• Recent
  • Categories
  • 0 Unread 0
  • Popular
  • Tags
  • More
    • Guidelines
    • Disclaimer
  • Users
Skins
  • Light
  • Default
  • Cerulean
  • Cosmo
  • Flatly
  • Journal
  • Litera
  • Lumen
  • Lux
  • Materia
  • Minty
  • Morph
  • Pulse
  • Quartz
  • Sandstone
  • Simplex
  • Sketchy
  • Spacelab
  • United
  • Yeti
  • Zephyr
  • Dark
  • Cyborg
  • Darkly
  • Slate
  • Solar
  • Superhero
  • Vapor
Collapse
Definedge Forum Logo

Is Your Portfolio Stock Really Outperforming?

Scheduled Pinned Locked Moved Knowledge Sharing
1 Posts 1 Posters 19 Views
    • Oldest to Newest
    • Newest to Oldest
    • Most Votes
Reply
  • Reply as topic
Log in to reply
This topic has been deleted. Only users with topic management privileges can see it.
  • N Offline
    N Offline
    Nishant Bhandari

    Pro User

    wrote on last edited by
    #1

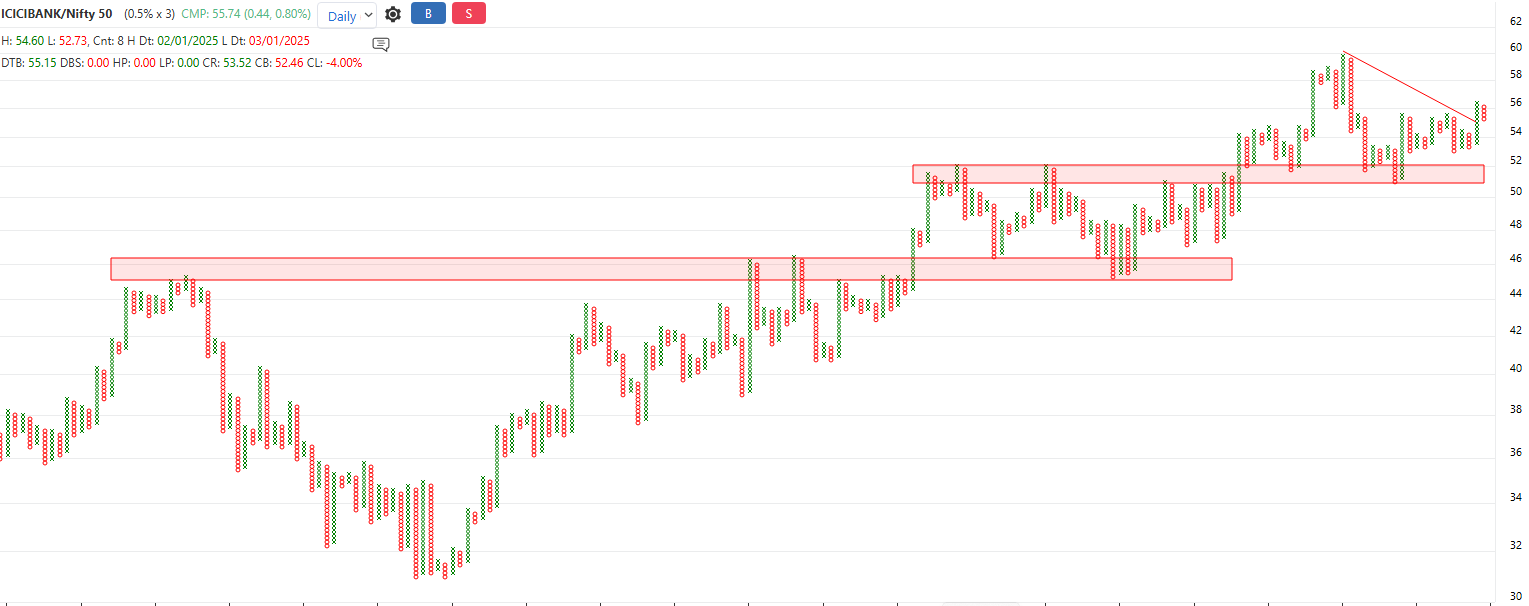
    A simple way to check whether your portfolio stocks are truly outperforming is by using ratio charts on Point & Figure (0.5 x 3).
    Recently, both ICICI Bank and HDFC Bank reported decent results. But choosing the better performer isn’t always easy just by looking at price or fundamentals. This is where relative strength (ratio charts) can help.

    Here, I compared:
    ICICI Bank / Nifty 50
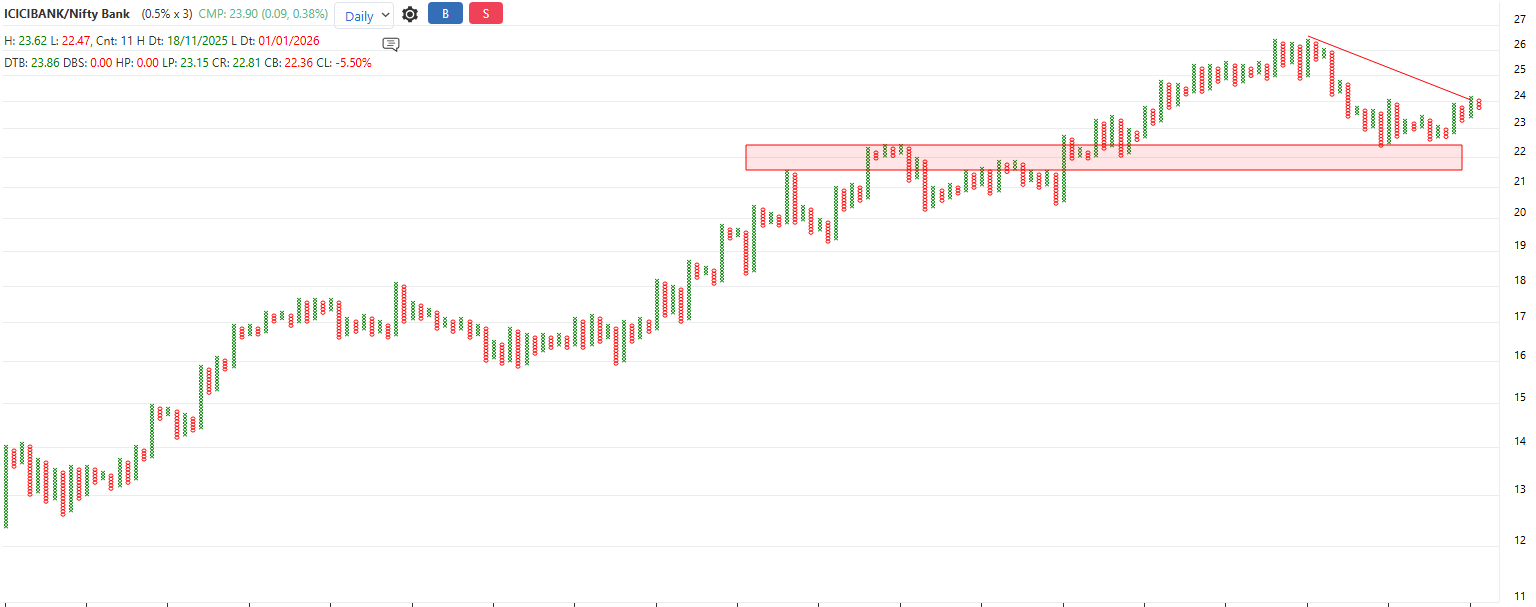
    ICICI Bank / Bank Nifty
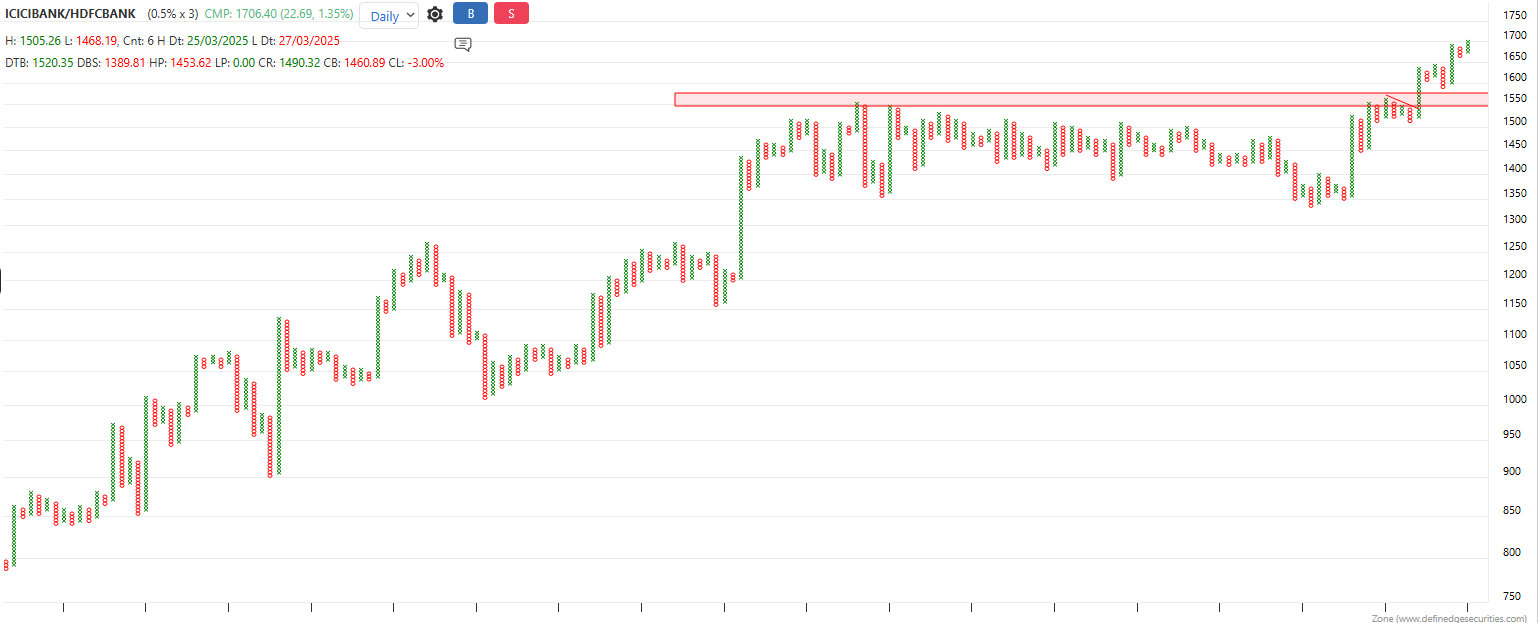
    ICICI Bank / HDFC Bank
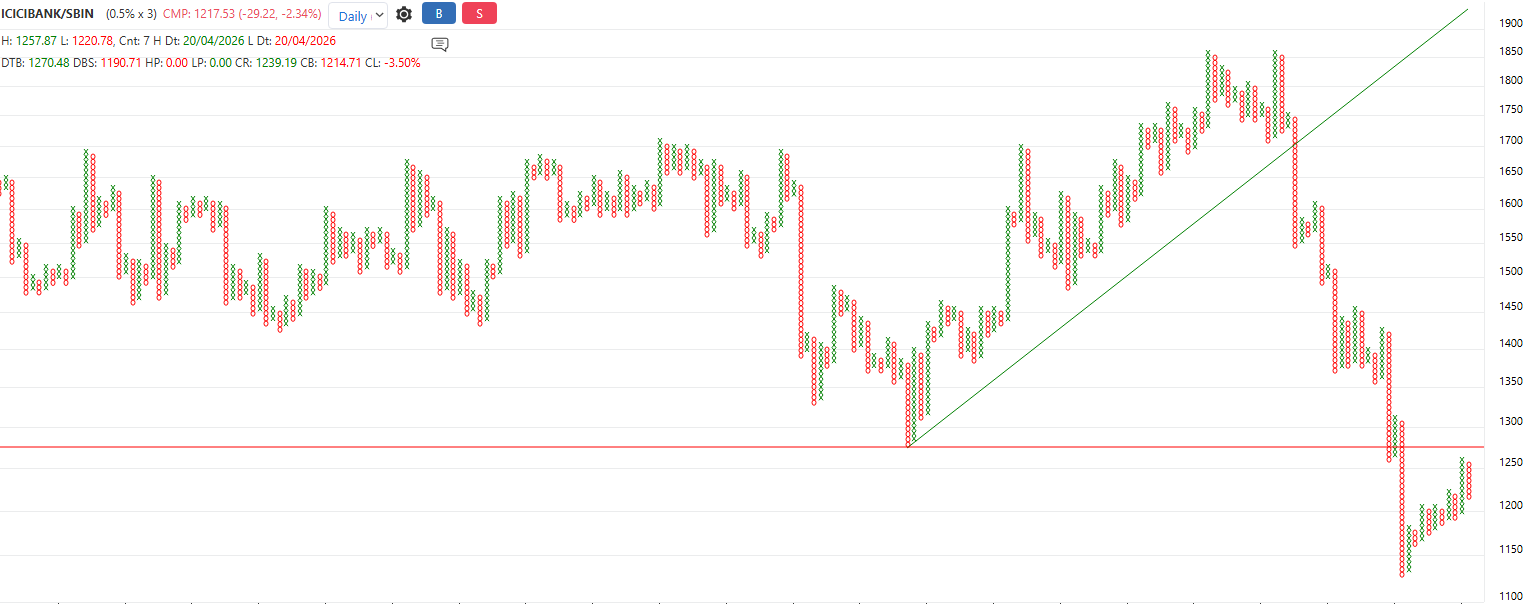
    ICICI Bank / SBI

    From this, ICICI Bank appears to be outperforming most of them, except SBI, which is also showing relative strength.
    This suggests that while ICICI Bank has been strong, SBI may also be worth tracking from a relative performance perspective. On the other hand, HDFC Bank appears relatively weaker in comparison.
    Additionally, the 45° trendline breakdown in the SBI ratio chart indicates a possible shift in relative strength, which is something to observe going forward.

    Also, if these ratio charts start changing their trend, it may be useful to review and adjust allocations accordingly, as relative strength within the portfolio evolves over time.
    Overall, this kind of analysis can help in understanding relative performance within your portfolio and making more informed allocation decisions.

    b8c68683-d86a-42cb-81f7-2b0f6bd20597-image.png

    1d0db4fc-5b80-409d-8df1-f2586f3a485c-image.png

    2afa8fb9-ef5a-4d08-b6bf-7a74987a8d06-image.png

    76276b9c-62de-48e1-b7a8-5c65ead6fed5-image.png

    1 Reply Last reply
    0


Recent Posts

  • S
    BACKTEST RELATED
  • N
    Is Your Portfolio Stock Really Outperforming?
  • bbrijeshB
    25 Minutes and 125 minutes timeframes
  • B
    NLC India Testing Major Resistance Again - Breakout or Another Bull Trap?
  • N
    📊 MIDSMALL vs Nifty 100 – What the Ratio Chart is Saying- “Tiger abhi zinda hai”
  • Login

  • Login or register to search.
  • Blog
  • Youtube Videos
  • Refresh
  • First post
    Last post
0
  • Recent
  • Categories
  • Unread 0
  • Popular
  • Tags
  • More
    • Guidelines
    • Disclaimer
  • Users
  • Login

  • Login or register to search.
  • Blog
  • Youtube Videos
  • Refresh