Is this a genuine reversal or just another market trap?
-
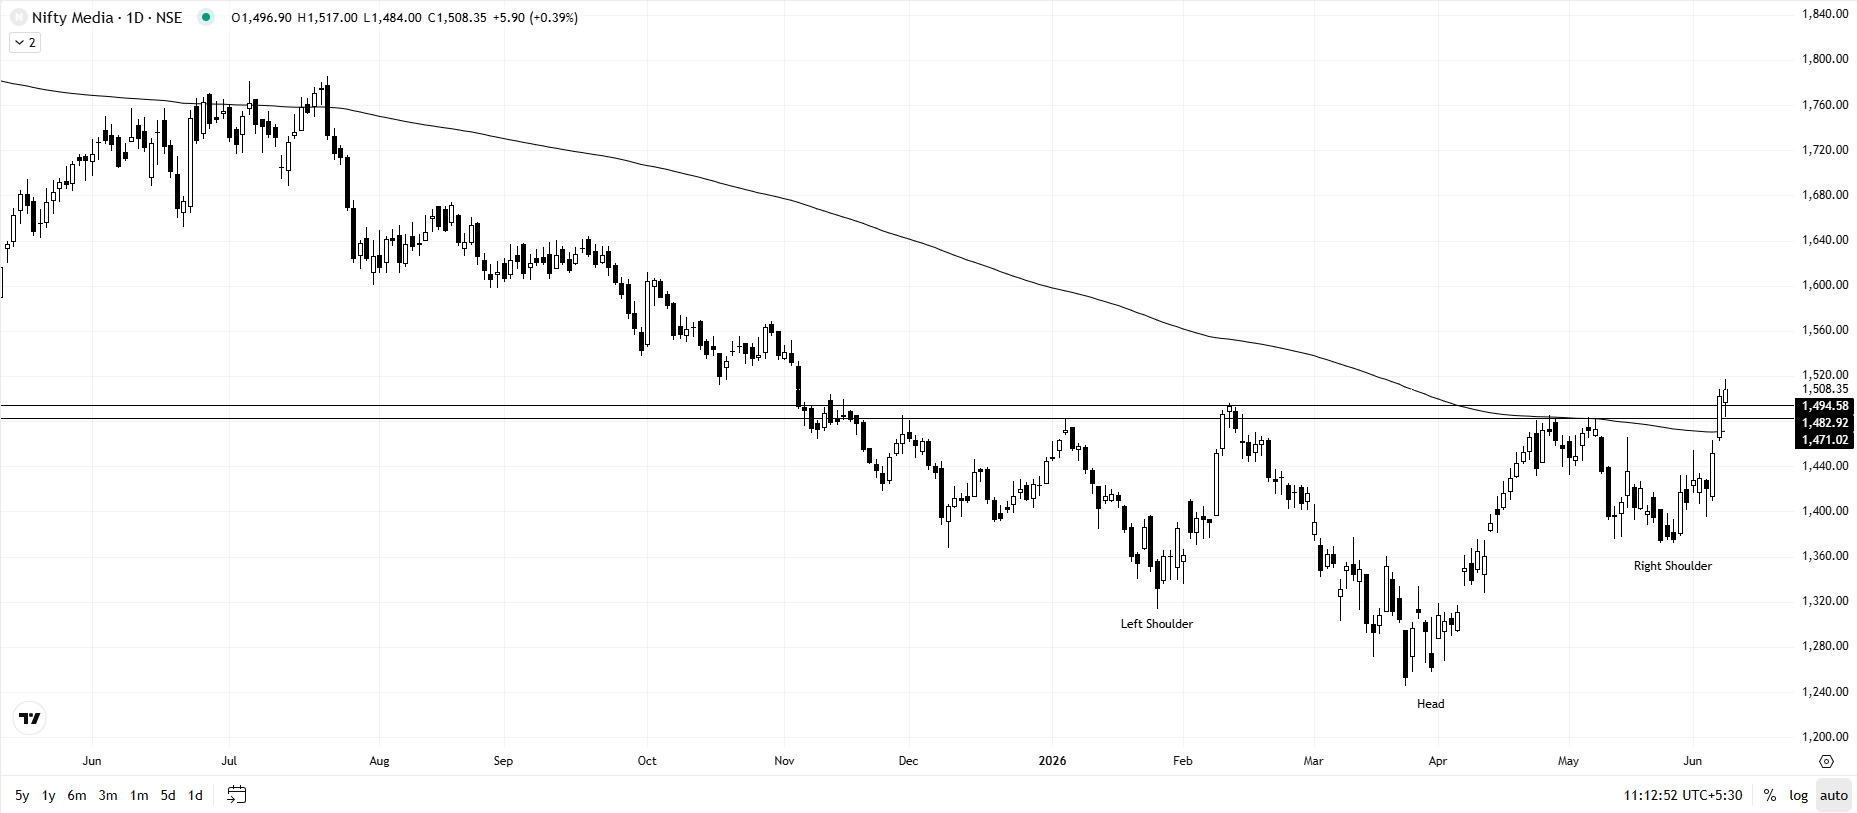
The NIFTY MEDIA index is currently forming an Inverted Head & Shoulders pattern on the daily timeframe while also moving above its 200-day EMA. Since the Inverted Head & Shoulders is widely regarded as a bullish reversal pattern, it naturally raises an important question: can this breakout sustain, or is it setting up a false move?
Interestingly, we have already seen a similar setup play out in ZEEL. The stock formed an Inverted Head & Shoulders pattern on the daily chart, broke above the neckline, and has continued to hold above the breakout level.
Now, NIFTY MEDIA appears to be at a similar stage. A sustained move above the neckline and the 200 EMA could indicate improving strength in the sector. However, as always, the real confirmation will come from follow-through buying and the ability to hold above key support levels after the breakout.
The pattern looks promising, but the market will ultimately decide whether this is the beginning of a meaningful trend reversal or just another trap for early buyers.
What are your views on NIFTY MEDIA? Do you see this breakout sustaining in the coming weeks?
-
Namaste Bhaumil Makwana
Since July 2025, the Nifty Media index has experienced a sharp decline of nearly 30%, falling from 1800 to 1250. Although we witnessed some buying interest in April 2026, heavy participation is still lacking, and the monthly chart has yet to show true strength. A monthly close above 1500 on strong volume—coupled with synchronized participation from major component stocks—will likely be required to trigger sustained buying. Furthermore, the broader market trend remains indecisive due to ongoing geopolitical tensions.
This is just my perspective, and I welcome any counterviews.