
Can options trading generate income?
-
Notes from my Finding Edge YouTube episode
On 9 Sept 2026, Definedge published an episode of its Finding Edge series in which Abhijit Phatak (AP) Sir and I talked through how I trade index options. Many viewers asked for the slides. This article is the written version of that conversation, with the presentation material in article format. You can watch the full episode on Definedge's YouTube channel.
Nothing here is a recommendation. It is how I built a process around my own constraints, and you should test every part of it yourself before you deploy capital.
The problem I was solving
My situation will be familiar to a lot of readers. I have savings built over 15 to 20 years, spread across mutual funds, bonds, gold and shares. I also have other interest and personal commitments to my family specially my twin boys who deserve my time.
That gave me three constraints. I could not sit in front of a screen for six hours a day. Most of my savings were invested, not lying in cash, so I could not put ₹50 lakh of cash into a trading account. And because those savings are my retirement money, I could not afford a blow-up.
So the question was narrow. Can I earn a meaningful income from the savings I already have, without watching screens and without risking the savings themselves?
Pledging
The answer started with pledging. When you pledge approved holdings, your broker gives you collateral margin against them after a haircut. The holdings stay invested and keep earning, and the same money now does a second job. Definedge explains the steps in its guide to the pledging process, and the approved list shows which securities qualify.
For derivatives positions you carry overnight, the margin comes in two halves:
- Up to 50% can come from pledged equity shares or mutual funds, ETFs or SGBs.
- At least 50% has to be cash or cash equivalents (which include liquid fund, liquid ETFs, SGBs and some approved debt funds / ETFs).
If you don't have the cash for the second half (cash), Definedge can now fund it as margin, with interest on positions carried overnight.
I should know my worst day in advance!
What pledging does not change is the need to know my worst case in advance. With retirement savings behind the trading account, I wanted a structure where the maximum loss is fixed on the day I enter, and a credit spread gives me that structure, When i combine max loss of a risk defined option payoff structure, i know my worst loss in advance.
Five things the market kept showing me:
Before building anything, I wrote down what I was actually observing. They are simple observations that any trader can check.
- Theta is the one certainty. An option loses time value every day. Nobody knows where delta will take the price or what implied volatility will do, but time decay can be calculated in advance. As a seller, I want to collect it inside a structure where the loss is capped. If you are new to options or want to learn more about them you take this Learn Options from basic course.
- Only four indices really have liquidity: Nifty, Bank Nifty, Nifty Mid Select (symbol MIDCPNIFTY) and Sensex. Stock options are often a liquidity trap: a stock can move 4% to 6% in a day and leave you stuck in an ITM / OTM strike nobody trades with no liquidity. Four instruments is a small enough universe that one person can study it properly.
- The index makes its money overnight. Nifty went from about 8,285 in January 2015 to about 24,288 in mid-August 2026, up roughly 16,000 points. Underneath, it gained roughly 40,000 points overnight (close to next open) and lost roughly 24,000 during market hours (open to close). You can read more about it here Why Does an Index Move More Overnight Than All Day?. For me it means two things: hold trades overnight, and give bullish trades more room than bearish ones, because falls tend to recover in a sharp V trend.
- Each index has its own rhythm. Nifty and Sensex have weekly expiries (Tuesday on NSE, Thursday on BSE). Bank Nifty and Nifty Mid Select have only monthly expiries.
- Expiry week changes the risk. In the last two or three days before expiry, option prices race towards zero and gamma is at its highest. A small move against you can take a spread straight to its maximum loss. Some traders try to exploit this. I avoid those days altogether. By staying out or moving to next week / month expiry, I try to mitigate one of the unknowns which is expiry calendar risk. BTW you can watch this Fun video on Delta & Gamma to know more.
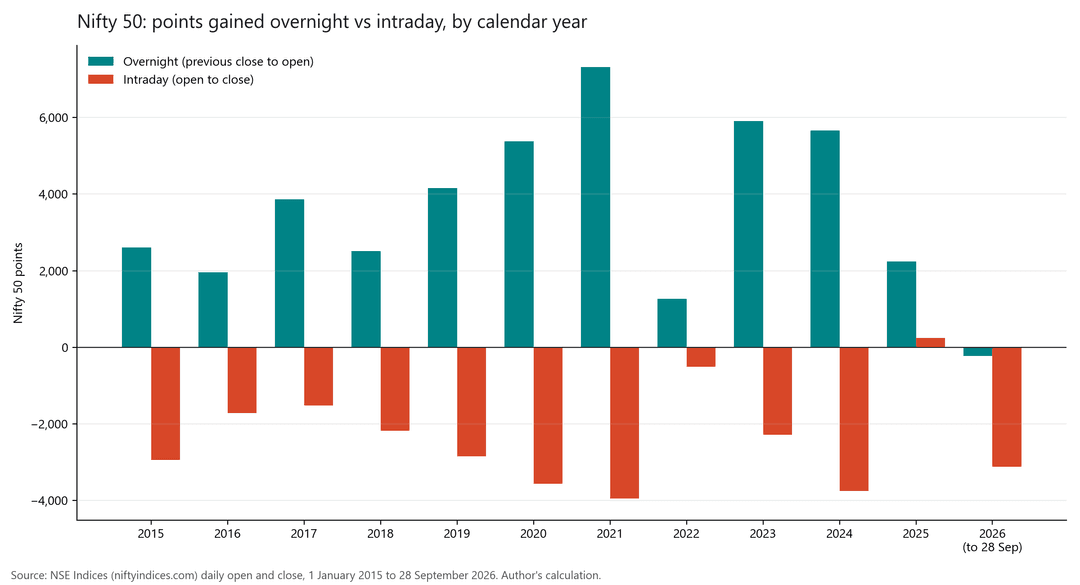
Nifty 50 points gained overnight vs during market hours, by year. Source: NSE Indices daily data, 1-Jan-2015 to 28-Sep-2026, my calculation.
The structure: a credit spread
A credit spread has two legs. For a bullish view I sell the ATM put and buy a put 200 to 300 points further out as the hedge. For a bearish view, the same with calls. The point is that max profit, max loss and margin are all known on the day you enter.
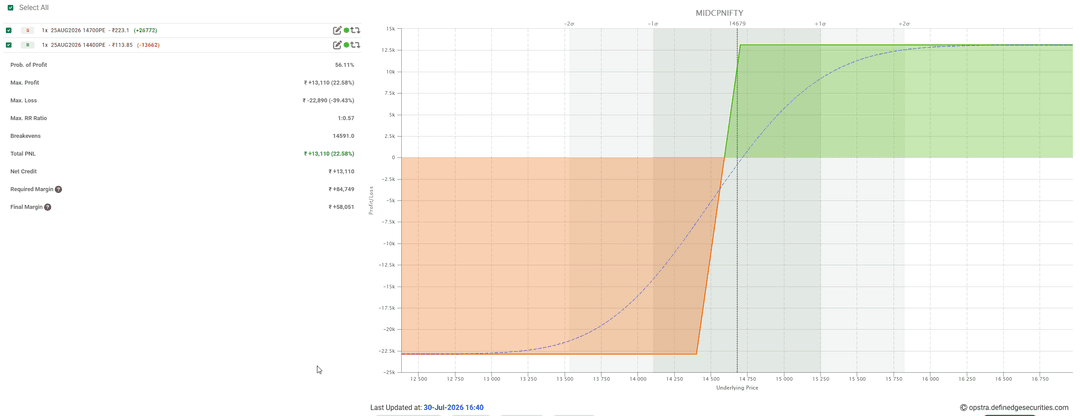
Real example from the Opstra strategy builder, 30 July 2026, Nifty Mid Select, 25 August expiry, lot size 120:
- Sell 14,700 PE at ₹223.10, buy 14,400 PE at ₹113.85
- Net credit: 109.25 points = ₹13,110
- Max loss: 300 − 109.25 = 190.75 points = ₹22,890
- Margin shown after hedge benefit: ₹58,051
Likewise bearish structure for Nifty.
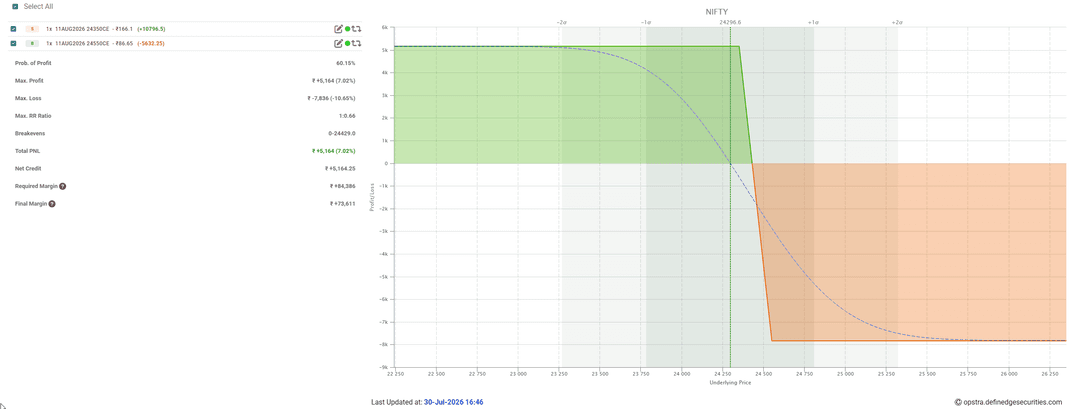
Illustration only, not a recommendation.
A bull put spread makes money if the index rises, and it usually makes money if the index goes sideways, because the sold option loses time value. It loses money only if the index falls far enough. Likewise, a bear call spread makes money if index falls, and it usually makes money if the index goes sideways, because the sold option loses time value. It loses money only if the index rises far enough.
It is tempting to call that a 66% chance of winning. It is not a statistic. The wins are small and frequent and the occasional loss is larger, so the structure on its own gives you no edge. The edge has to come from when you enter and how you exit.
My rules
These rules came out of my research, and I follow them on every trade.
- No fresh positions in the last 2/3 days before expiry. Trade next week or next month expiry based on liquidity. On Nifty I always trade next week's expiry.
- Book bullish spreads at about 75% of max profit or net credit. What does this mean --> example: sold ATM option at 200 and bought hedge at 100 means net credit received of 100 points, so book at 75 points. If you are trading this manually you can see it in Opstra Positions by selecting positions and clicking Analyze. Further suggestion: If on any given day just before close, if you see 72% dont wait, take profits and close position, who knows next day trend reverses and profits turns to losses.
- Book bearish spreads earlier, 40 to 60% (below 50% on Nifty) of Max profit or net credit. Falls recover too fast to wait.
- Exit when the main trend indicator/oscillator flips or reverses. The trend that makes you enter the trade also is the one that takes you out.
- Round strikes only: 100s on Nifty, Sensex and Nifty Mid Select, 500s on Bank Nifty. The 50 and 25 strikes are where you get stuck.
- Size from max loss, not available margin. If every open spread hit its maximum loss on the same day, could you take that loss and still trade the next morning? If not, the size is too large!.
Rules only help if they are followed every time, including on the day you feel the market will go further. So I let the system execute them. My strategies run on Algostra, which places the entry, books the target on the spread value and exits on the trend flip. I only check that the orders went through, because in a fast market a limit order with market protection can sometimes stay unfilled. The Algostra manual shows how to set up a strategy.
How I size a position
At the time of recording video (August 2026), one spread on any of the four indices needed roughly ₹40,000 to ₹80,000 of margin. I keep about ₹1.5 lakh aside for each lot. About two thirds of that (or ₹1 lakh) comes from pledged holdings and about ₹50,000 is my own cash. That is nearly double the requirement, and it is deliberate. Two or three maximum losses in a row should not force me to stop trading. The aim is to stay in the game, and few good trade a month on each index is enough to do the job.
Index Expiry Lot size Typical spread width Margin per lot (Aug 2026) Nifty Weekly 65 200 to 300 points ₹40,000 to ₹80,000 Sensex Weekly 20 500 to 700 points ₹40,000 to ₹80,000 Bank Nifty Monthly 30 500 to 700 points ₹55,000 to ₹80,000 Nifty Mid Select Monthly 120 200 to 300 points ₹55,000 to ₹80,000 Lot sizes as on 29-Sep-2026, Definedge contract master. Margins are indicative and change with volatility and exchange rules; check the current figures before you trade.
Why I read trends on Renko and Point & Figure
A candlestick chart prints a new bar every minute whether or not anything happened. When the market goes sideways for an hour, a 10-period moving average on candles flattens out and tells you nothing.
Renko and P&F charts print a new brick or box only when price moves by a fixed percentage. The sideways hour becomes a single brick, and a moving average on the chart reflects the last ten bricks of real movement. The trend becomes much easier to read.
For the indices I use a 0.02% or 0.03% box on P&F and a 0.04% or 0.05% brick on Renko, all built from 1-minute closing prices. A brick or box forms only on a closed 1-minute price, so once it is printed it does not change. Signals therefore do not repaint. You can learn more about noiseless charts on Definedge Shelf. Want to go deeper? Here are a few courses we highly recommend - Trade the Markets the Point & Figure way and Profitable Trading with Renko.
Renko and Point & Figure (P&F) charts excel at filtering out market noise, but that does not mean standard Open-High-Low-Close (OHLC) or candlestick charts are bad or not useful. For certain type of trades which require precise entry timing, volume analysis, and understanding immediate market reaction to news, i still use OHLC. Every charting method is just a tool to visualize human behavior. Finding the one that aligns with your psychology is what matters most.
Strategy Set-up: Trend first, then a trigger
Keep it simple. Put one indicator or oscillator on a Renko or P&F chart to tell you the trend, then wait for a pattern to trigger the entry.
- Trend: a moving-average stack, or RSI above/below 50, price above/below DSmart WL, price above/below MAST.
- Trigger: a pattern in the same direction, like Swing Breakout on Renko or Turtle Follow-Through on P&F. Trend indicators flip back and forth in a sideways market, and the pattern confirmation prevents false signals.
- Trade: sell the spread in the trend's direction; exit at target or when the trend flips (or reverses), whichever comes first.
I use 0.02 to 0.03% boxes on P&F and 0.04 to 0.05% bricks on Renko, built on 1-minute closes, so nothing repaints. Definedge's patterns and indicators library explains each of these for Renko and P&F charts.
What a backtest must show before I believe it
I backtest the signal on the index and then trade it through options. Option backtests on 1-minute data are not realistic, First of all, 1-minute Option prices are in LTP whereas real trades as per bid-ask spreads, secondly option prices move a lot within a minute and real orders go in with market protection at worse prices. The index test tells me whether the signal holds up. The spread then decides how much of that move I can keep.
Before I trust a result, I look for four things.
- It covers several market phases: rallies, falls and sideways stretches. A strategy tested only in a bull run tells you very little.
- It has hundreds of trades and not a small sample size.
- The average holding period is about two to five days. The spread needs at least one night to decay; remember in a credit spread we are short main leg and it pays off when there is time decay.
- It has a good profit factor and a tolerable worst month. An average hides the month that makes you abandon the system.
If you are new to backtesting, Definedge's articles on why backtesting is the foundation of systematic trading and on backtesting for trading system development cover the basics.
Sample strategy 1: Nifty Mid Select, Renko, stop and reverse
This is a pure stop-and-reverse system. It takes bullish and bearish trades with the same rules mirrored, so the margin is almost always in use.
The chart is Nifty Mid Select on a 0.05% Renko brick, built from 1-minute closes. The trend state is a triple moving-average stack using exponential moving averages (EMA) of 20, 30 and 40 bricks. You can read more about Triple Moving Averages but note the parameters below.
- Go long (sell bull put spread) when the 20 EMA is above the 30 EMA, the 30 EMA is above the 40 EMA, and a Swing Breakout Bullish appears.
- Go short (sell bear call spread) when the indicators are inverted and a Swing Breakout Bearish appears.
- Exit either side when the indicator flips which is for bullish side when EMA 20>30>40 becomes EMA 20<30<40 and likewise for bearish side.
Public strategy names:
Bullish Entry: 'Triple MA Bull AND SWB Bull' with exit on 'Triple MA Bear'.
Bearish Entry: 'Triple MA Bear AND SWB Bear' with exit on 'Triple MA Bull'.
Backtest on the index, 1-Jun-2022 to Jul-2026, index points before costs, not option P&L. Source: Definedge Zone System Builder, five yearly exports consolidated by the author.
Long Short Combined Trades 559 542 1,101 Profit factor 2.0 1.7 1.8 Net points +14,658 +9,971 +24,628 Months positive 80% 76% 82% Max drawdown 703 points. Worst streak: 12 losers in a row, about a fortnight at this trade frequency, so size for it.
The rules also held up when I changed the brick to 0.04% and when I used a double instead of a triple moving average, which gives me some comfort that the result is not an overfitting of one setting.Sample strategy 2: Nifty, Point & Figure, long only
On Nifty I use a different setup and take only bullish trades. The chart is a 0.02% P&F with a three-box reversal, built from 1-minute closes. The trend state is Triple Moving Averages (TMA) of SMA 10, 15 and 20.
- Enter a bull put spread when 10 SMA is above 15 SMA, 15 SMA is above 20 SMA, and a Strike Back Bullish pattern appears.
- Exit when the TMA inverts. No pattern is needed to get out.
Strike Back Bullish is a six-column pattern, an extended form of a bear trap. The market pulls back, draws in sellers, then turns and gives a double top buy. So this is a pullback entry within an uptrend, where the Midcap system chases a breakout.
Public strategy names:
'Triple MA Bull And Strike back bullish' with exit on 'Triple MA Bearish OR Target'.Backtest on the index, 1-Jun-2022 to Jul-2026, index points before costs, not option P&L. Source: Definedge Zone System Builder, five yearly exports consolidated by the author.
Long only Trades 238 (about 5 a month) Profit factor 1.9 Net points +8,765 (about +175 a month) Months positive 64% Max drawdown 698 points It trades about five times a month and holds for about a day and a half, so it needs very little screen time. Its drawdown and worst month were the shallowest of everything I tested.
Both are backtested in Zone Web's System Builder (how to use it), June 2022 to July 2026, five yearly runs joined together. These are index points before costs, not option P&L.
Why no bearish trades on Nifty
I did test the mirror image of the Nifty system for bearish trades. As an index trade, it showed no edge at all.
Then I measured how far each trade moved in my favour before the exit, known as maximum favourable excursion (MFE). Bullish trades went an average of 164 points my way and booked 23 points at the exit. Bearish trades went 154 points my way, almost the same distance, but booked only 8.
The falls on Nifty are real. The problem is that the index recovers so fast that by the time the trend shows exit, 95% of the move is gone. An Index backtest will hold each trade until the indicator flip exit trigger (because those are the rules to test). It cannot see that large move, but a credit spread booked early can certainly collect some of move gains.
So on Nifty you can leave bearish trades out altogether; the bullish side works as a complete strategy on its own. If you do take a bear call spread, do not wait for the trend to flip. Book it early, below 50% of the maximum profit (the net credit you collected), because the fall you are trading is usually recovered with aggressive reversals. When trading options, it is just as important to know what NOT to do as it is to know what to do. Discover a new way to trade options objectively in Trading Options Based on Options Charts course by AP Sir.What 18,000+ backtests taught me
Over the past year I ran more than 18,000 backtests on about 11 years of 1-minute data for the four indices, on both Renko and P&F, in both directions. I will not share the exact pairings, but the broad findings may save you time.
- Bullish systems beat bearish ones almost everywhere, even with the Covid crash inside the backtesting data range. Bearish side only really paid well on Nifty Mid Select, point to be aware of is that Midcap index is relatively a new index and does not cover full range of market conditions. If doing bearish side options trade on other indices then data suggest taking profits early.
- Trend indicators that kept showing up near the top: on P&F, RSI vs 50 line, moving-average pairs (Triple, Double MA), MACD above zero, MAST (Supertrend). On Renko, DSmart WL showed promise, moving-average pairs and the Ichimoku group of indicators.
- The same confirmation patterns kept showing up next to the winners: Strike Back, Turtle Breakout and Turtle Follow-Through, Swing Breakout, different Trap set-ups, Rounding Bottom, Anchor Follow throughs all on default settings.
- Simple set up won. Two conditions beat five. The survivors held 1 to 2 days, traded a handful of times a month, and had win rates under 45%. A win rate under 45% should not worry you in a trend-following system. If a trend system shows a 65% or 75% hit rate, treat it as a red flag and check the test.
Which indicator goes with which pattern, on which index and box size, is the treasure hunt I'll leave to you.
Key takeaways
- Decide what you can lose before you decide what you want to earn.
- Pledged holdings can back a derivatives position while they stay invested, and a credit spread keeps the risk to those savings fixed and known.
- Trade the four liquid indices, use round strikes and stay out of the last two/three days before expiry.
- Read the trend first, then wait for a pattern to confirm it.
- Book bullish spreads near 75% and bearish spreads between 40% and 60%.
- Size from the maximum loss of all open spreads together.
- Judge the results by the quarter, because any single month can be a loss.
- Markets change. Weekly expiries, lot sizes and rules have changed before and will change again, so keep testing.
The full conversation, including the live chart walkthroughs, is on Definedge's YouTube channel.
Happy to answer questions below.
Educational only, not a recommendation. All strategy figures are index backtests in points, before costs, and past performance doesn't guarantee future results. SEBI's August 2026 study found 87.7% of individual F&O traders made net losses in FY2025-26. I trade index option spreads in my personal account. Please consult a SEBI-registered adviser before trading.
Investment in securities market are subject to market risks, read all the related documents carefully before investing.
-
Thanks for your sharing the notes for the said episode.
-
 D Dushyant Thakker-1733574956821 referenced this topic
-
-
@Pavan hi Pavan, I have shared a template to evaluate further on all instruments. Recently I shared some more ideas using ichimoku and renko... Now, which instrument and how much profitable is something you need to evaluate. Goodluck
-
Hi Dushyant ji, something I found while forward testing the Triple MA and SWB strategy on Midcap. You might find it interesting or may know it already. We usually plot Triple MA indicator on the Nifty Mid Select chart along with SWB to check our trade entry and exit. However, in system builder we use DMA to build the conditions. Sometimes the trade entry and exits don't match the charts (like it happened today at 9:16AM), and it's because DMA use 'Close' for Input1 and 'Average' for Input2 whereas TripleMA uses 'Close' for all 3 inputs.
Let me know your thought please.
-
@Anurag Kansal Hi Anurag ji, Thanks for checking this so closely. You are right about the chart.
The bullish condition is EMA 20 (fast) > EMA 30 (medium) > EMA 40 (slow), and the bearish one is the reverse. And signal for entry for both was Swing break out. Now, currently there was no way to set this up using Triple Moving Average in System builder as per screenshot below. One can create price above 3 moving average but not that condition of slow above medium above fast.
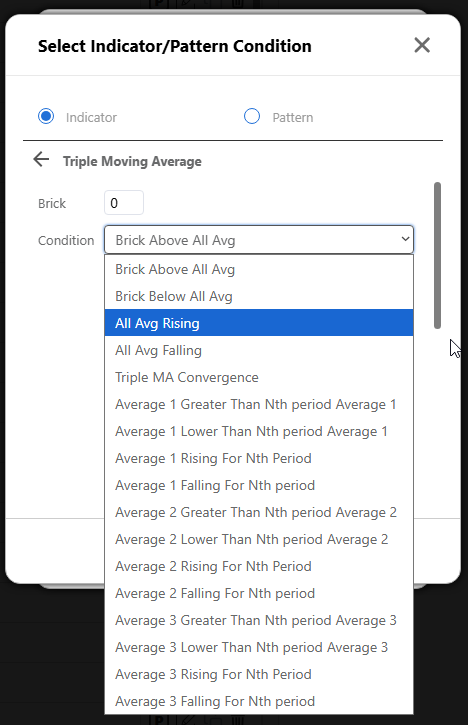
In System Builder, the simplest way for anyone to set this up is with two standard Double Moving Average conditions: EMA 20 vs EMA 30, and EMA 30 vs EMA 40. I kept the default inputs on both, which are Close for Input 1 and Average for Input 2, so anyone copying the rules gets the same result. So I am aware of this difference and had raised it in Definedge support Telegram chat (before recording podcast) before getting associated with Definedge The backtest results I shared were run on exactly these conditions. It is the same one shared in Public Strategy.
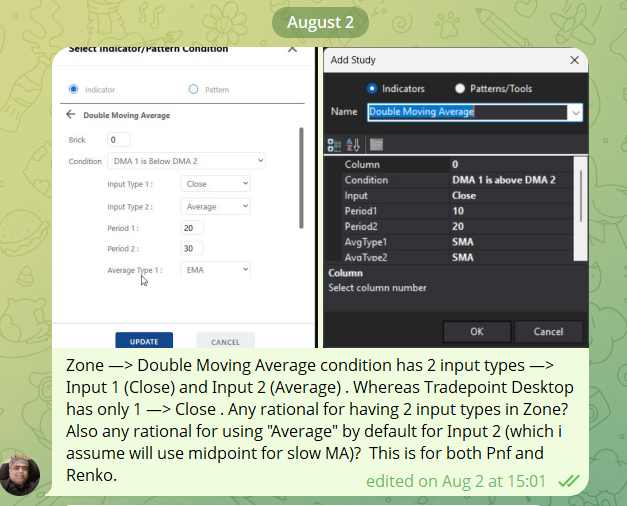
The Triple MA indicator on the chart uses Close for all three averages. So near a crossover, the chart and the System Builder signal can disagree by a brick or two. That is what you may have seen at 9:16.
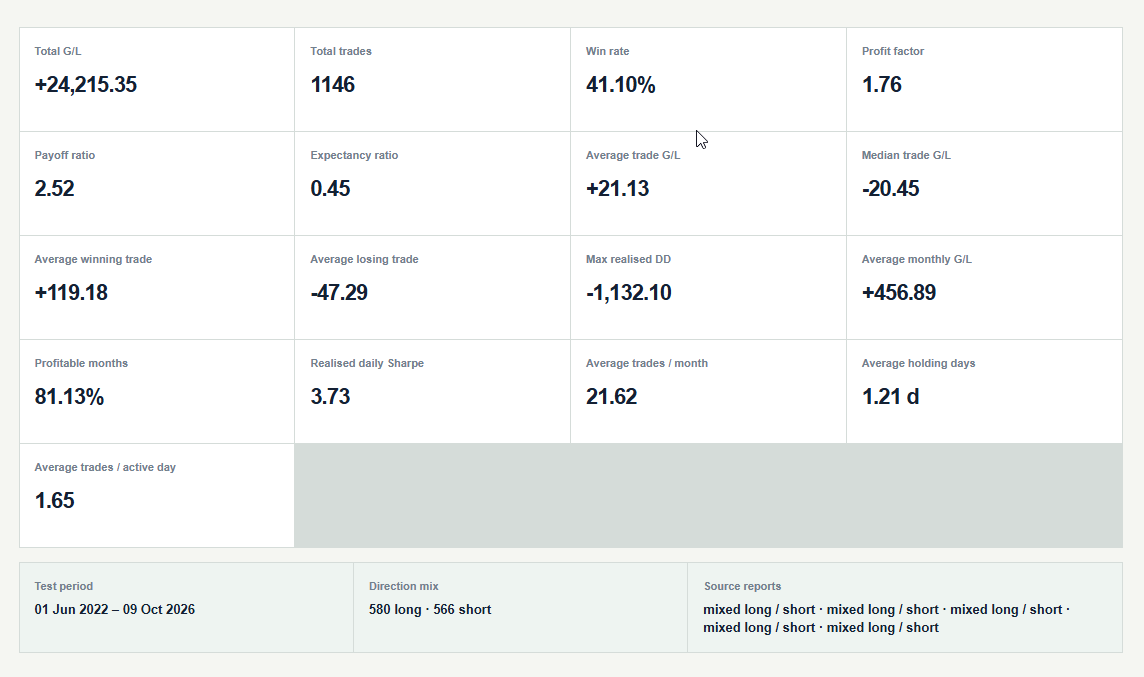
After your message I ran the backtest both ways on Nifty Mid Select, 0.05% Renko, 1-Jun-2022 to 9-Oct-2026.
All figures are in index points, before costs:(Close + Average): 1,146 trades, +24,215 points, profit factor 1.76, 81% of months positive
Close for all: 1,087 trades, +22,180 points, profit factor 1.69, 77% of months positive
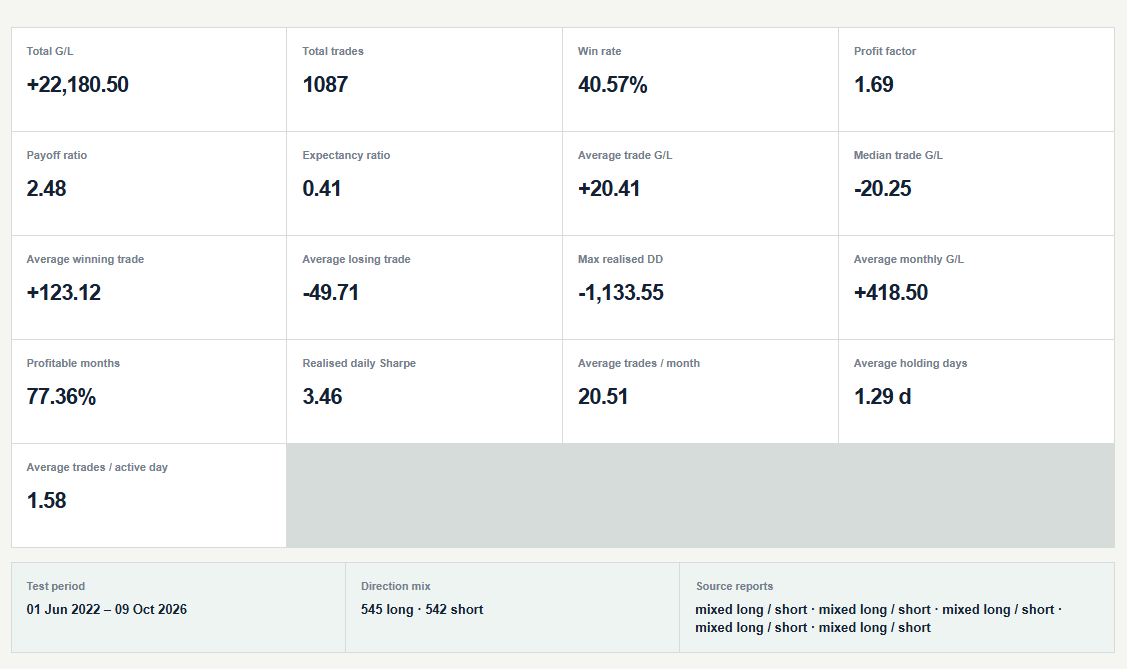
Close for all came out a little weaker in all five yearly backtest runs. The gap is small, though, and I can't tell you yet why the Average input does better.
What I would suggest for forward testing:
- Go by the System Builder signal, because that is what was backtested. Treat the Triple MA on the chart as a visual guide.
- If you want the chart and the signal to match exactly, switch both DMA conditions to Close and accept slightly weaker numbers.
- Whichever you pick, use the same setting in the backtest and in live trading.
Actions for me to follow up:
- Check with product team / developer, what is the rationale for using Close for one and Average for another?
- Check with the product team / developer, can Average 1 > Average 2 > Average 3 or similar condition be added in Triple Moving Average System builder? So that one can build this using Triple MA condition.
Thanks
Dushyant"An investment in knowledge pays the best interest." — Benjamin Franklin
-
Thanks for the detailed response and the backtest. The backtest shows better results with 'average' but we ought to know why it is being used. Thanks again. And eager to meet and learn from you in the upcoming
Momentum Trading & Investing Bootcamp. -
Nice one. Please share exact entire Algostra parameters you set to have zero ambiguity