
RBI rate hikes and cuts: What happened to the Nifty?
-
Every RBI rate move sparks the same debate. Will a rate hike hurt the market? Will a cut lift it?
We reviewed 11 RBI rate phases since 2001. The direction of rates alone did not decide the Nifty 50's return. All 10 completed phases, and the current rate-cut phase up to 13 April 2026, showed a positive return.
How we defined a rate phase
We treated consecutive rate moves in the same direction as one phase.
-
A rate-hike phase runs from the first hike to the first cut.
-
A rate-cut phase runs from the first cut to the first hike.
A pause does not end a phase. Only a move in the opposite direction does. This gave us five rate-hike phases and six rate-cut phases.
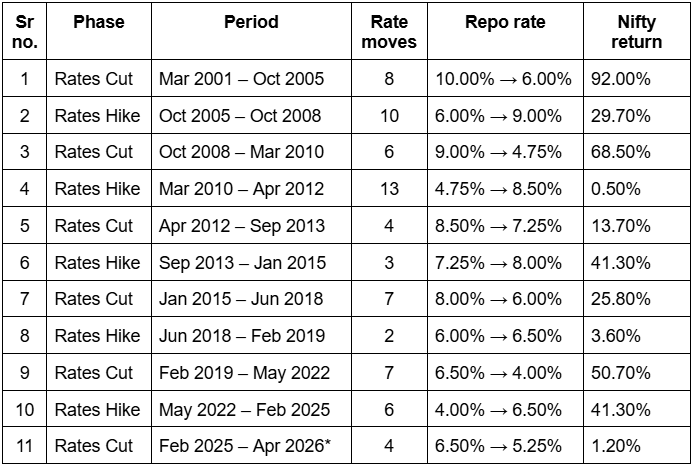
The latest rate-cut phase is still running. Its return is measured up to 13 April 2026, the latest Nifty data used in this study.What the data shows
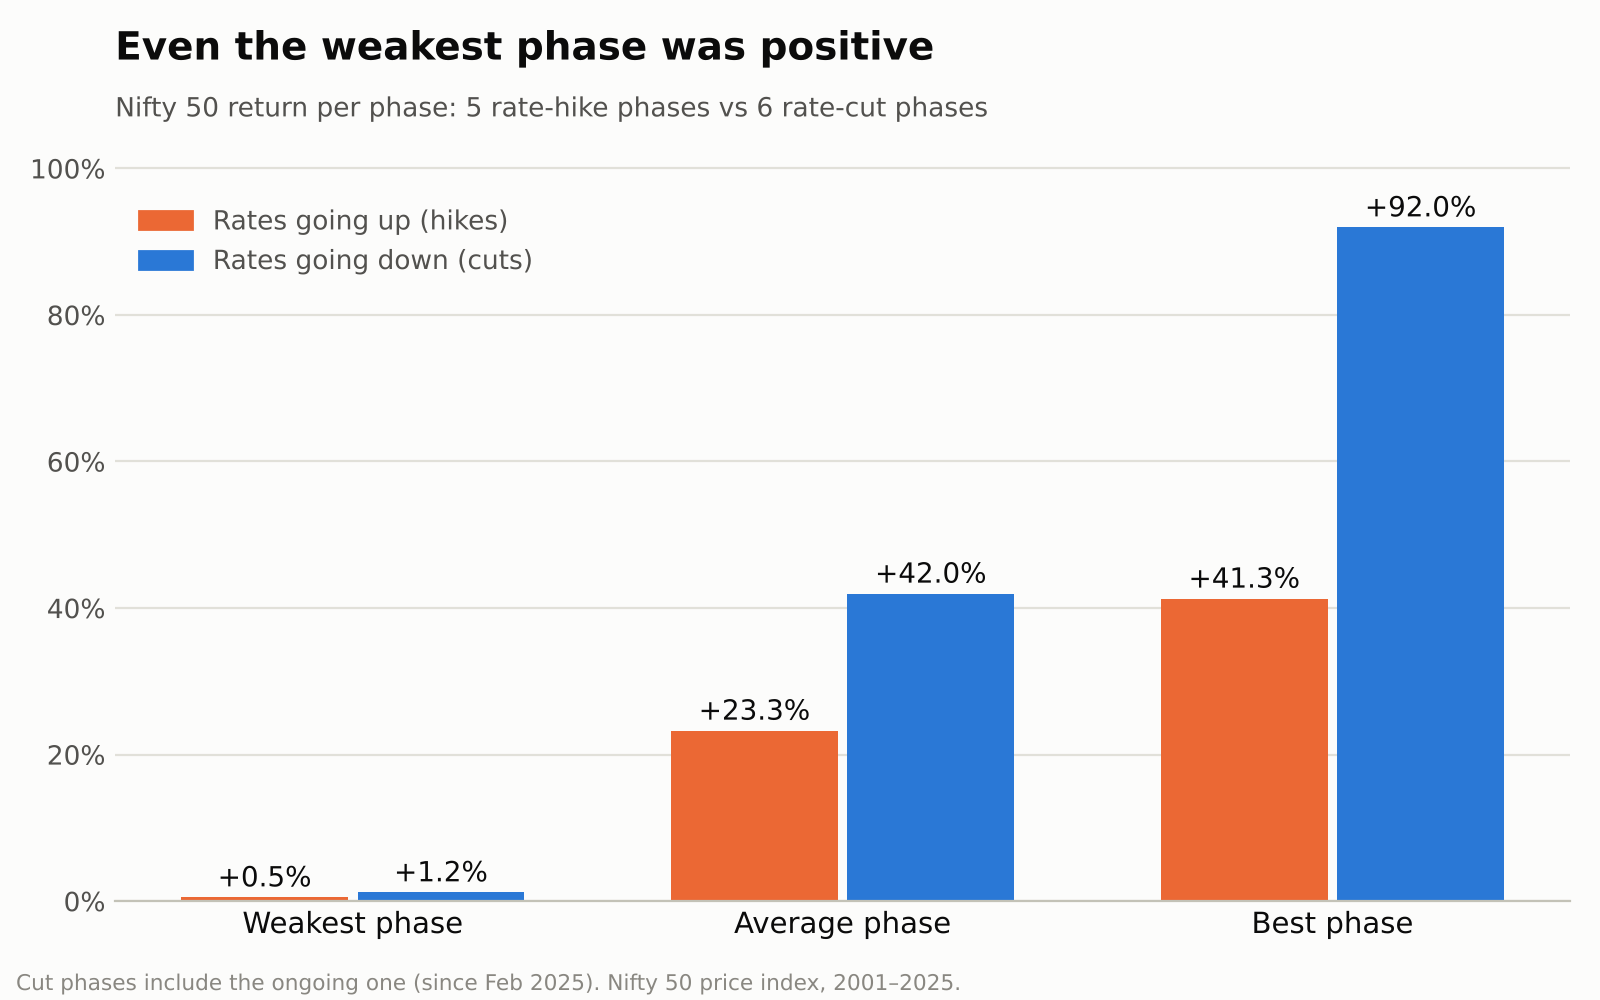
The Nifty 50 had a positive return in every phase in this sample. Across the six rate-cut phases, the average return was about 42%; the strongest phase returned 92%. Across the five rate-hike phases, the average was about 23%; the strongest returned 41.3%.
In this sample, the RBI's action by itself was not a reliable directional signal for the market.
During the moves, and during the pause
We split each phase into two parts:
Active period: when the RBI was changing rates.
Pause period: from the final rate move until the first move in the opposite direction.During rate-hike phases, the Nifty 50 gained 17.6% on average in the active period and 8.9% in the pause. During rate-cut phases, it gained 12.1% on average while cuts were happening and 29.2% in the following pause.
The 2019 to 2020 period shows why the rate direction alone is not enough. The Nifty fell about 18% while the RBI was cutting rates, largely during the COVID market fall. After the final cut, it gained about 84% during the pause.
The practical takeaway
Rate decisions matter, but they are only one input. Earnings, economic growth, global events and money flows also shape the market's path.
This is a small sample of 11 phases, and several major events occurred within it. Treat the results as historical observations, not as a rule for future returns. A trader or investor should look at the full rate cycle and the wider market environment, rather than assume that a hike means a falling market or a cut means a rising one.
-