
Confused About Results Season? This Screen Has the Answers!
-
Results season is when companies report how much money they made. Prices often move a lot around this time. Opstra's Options Screener has a section built just for this period. It gives you four ready-made trading plans around results day, along with the past record of each one. It also lets you filter the list to match your own view, your comfort with risk, and how easy a stock is to trade.
What is this feature?
It is a part of the Options Screener that looks at how stocks behaved around their past results days. Instead of you guessing when to enter and exit, the screener offers four fixed timing plans. It then shows how each plan performed for each company in earlier results seasons.
In short: a ready-made plan, plus the proof of how it did before.The four plans
Each plan has a name, a start day and an end day. That's all there is to it.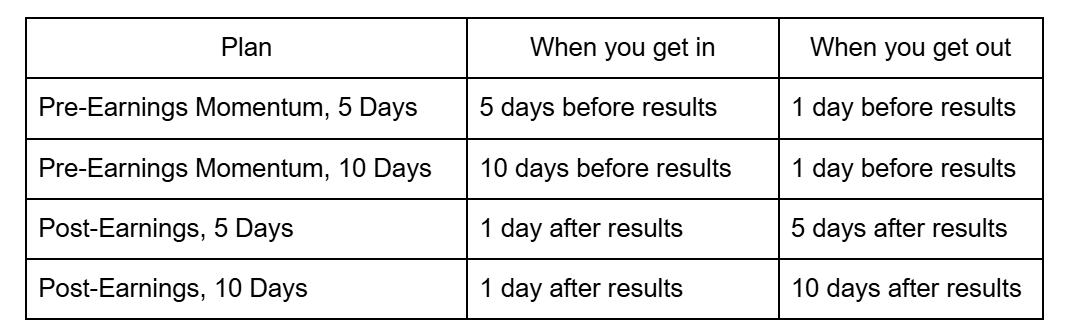
How to think about them:
"Pre" plans are for the build-up. You are in the trade before the news, and you leave one day early, so you don't face the result itself.
"Post" plans are for the aftermath. You wait for the news to come out, then take part in the move that follows.
5 days vs 10 days is simply a shorter or longer window.
Make the list fit you
You don't have to look at everything. Three simple choices at the top help you cut the list down to what suits you.
Liquidity:choose "High"
Some stocks hardly have any buyers and sellers. That makes it hard to get in and out at a fair price. When you choose High, you only see stocks with plenty of buyers and sellers. Getting in and out becomes much smoother.
Directional Bias: what kind of trade do you want to take?
Bullish ,Bearish ,Neutral.Pick your view, and the screener shows only the strategies built for that view. You can select more than one if you're open to both.
Risk Bias: how much risk can you handle?
Defined Risk: the most you can lose is known before you start. It's like buying an insurance policy with a fixed price. You know the worst case in advance.
Undefined Risk: the loss can grow bigger than what you first put in. These trades can pay more, but they need more care and more money kept aside.
And just like that, your list is ready
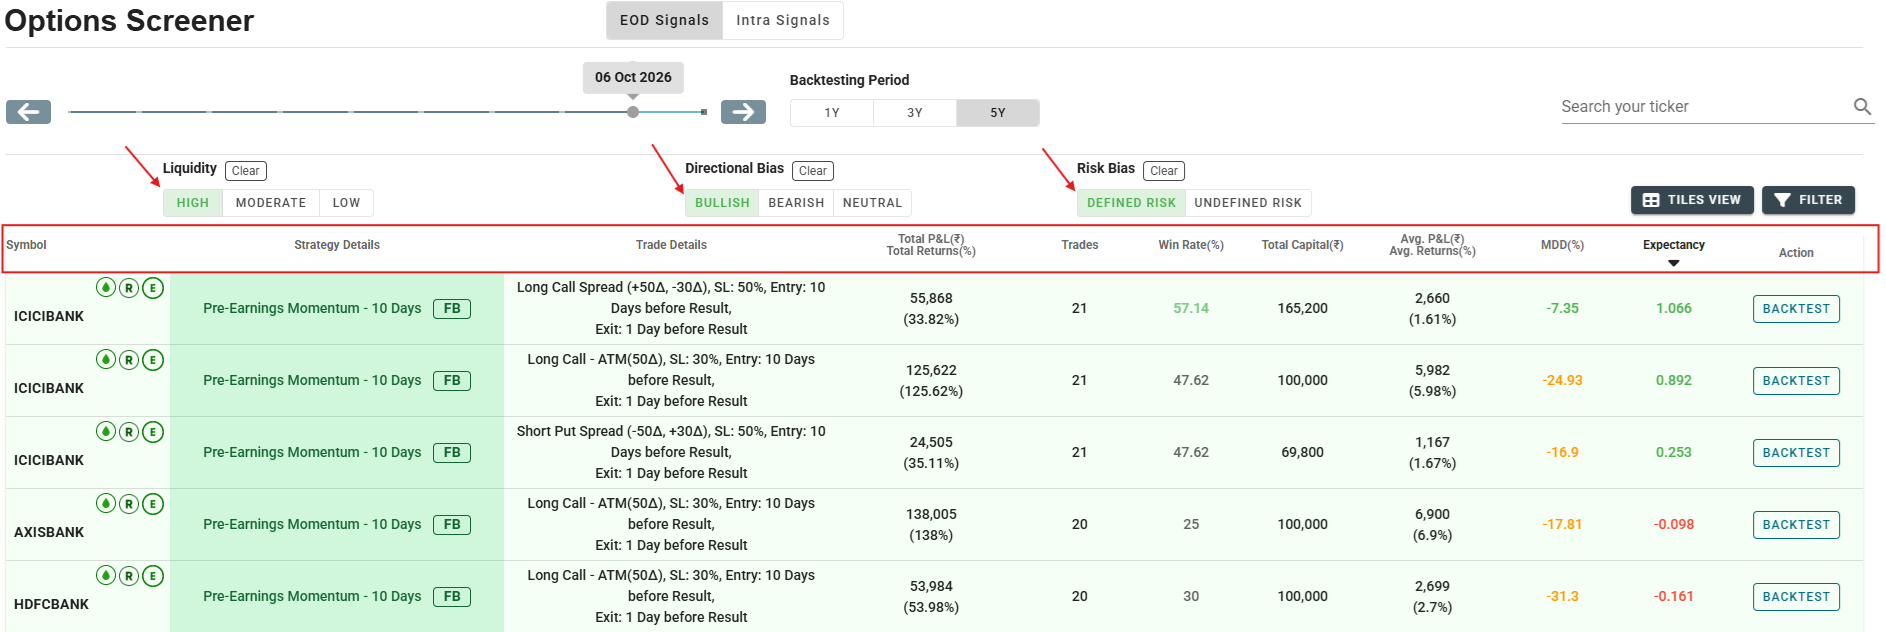
After these three choices, the screen builds a ready-made list for you. Each line tells you:
Symbol: the company name.
Strategy Details: which of the four plans is being used.
Trade Details: the exact trade taken, plus the entry day and exit day. It also shows the loss limit set for the trade.
Total Profit/Loss: how much money the plan made or lost in total, and the percentage return.
Trades: how many times the plan was tried in the past.
Win Rate: out of every 100 tries, how many made money.
Total Capital: how much money was needed to run it.
Average Profit/Loss: what one typical trade made.
Worst Dip: the biggest fall along the way. Smaller is easier to live with.
Expectancy: a score for what you can expect from an average trade. Above zero is a good sign. Below zero is a warning.Results season doesn't have to feel like a guessing game. Choose stocks that are easy to trade. Choose your view. Choose your risk. Then let the screen show you what worked best for each stock.
Less confusion. More clarity.

 Weekly Relative Strength Ranking Report