KK's Corner
-
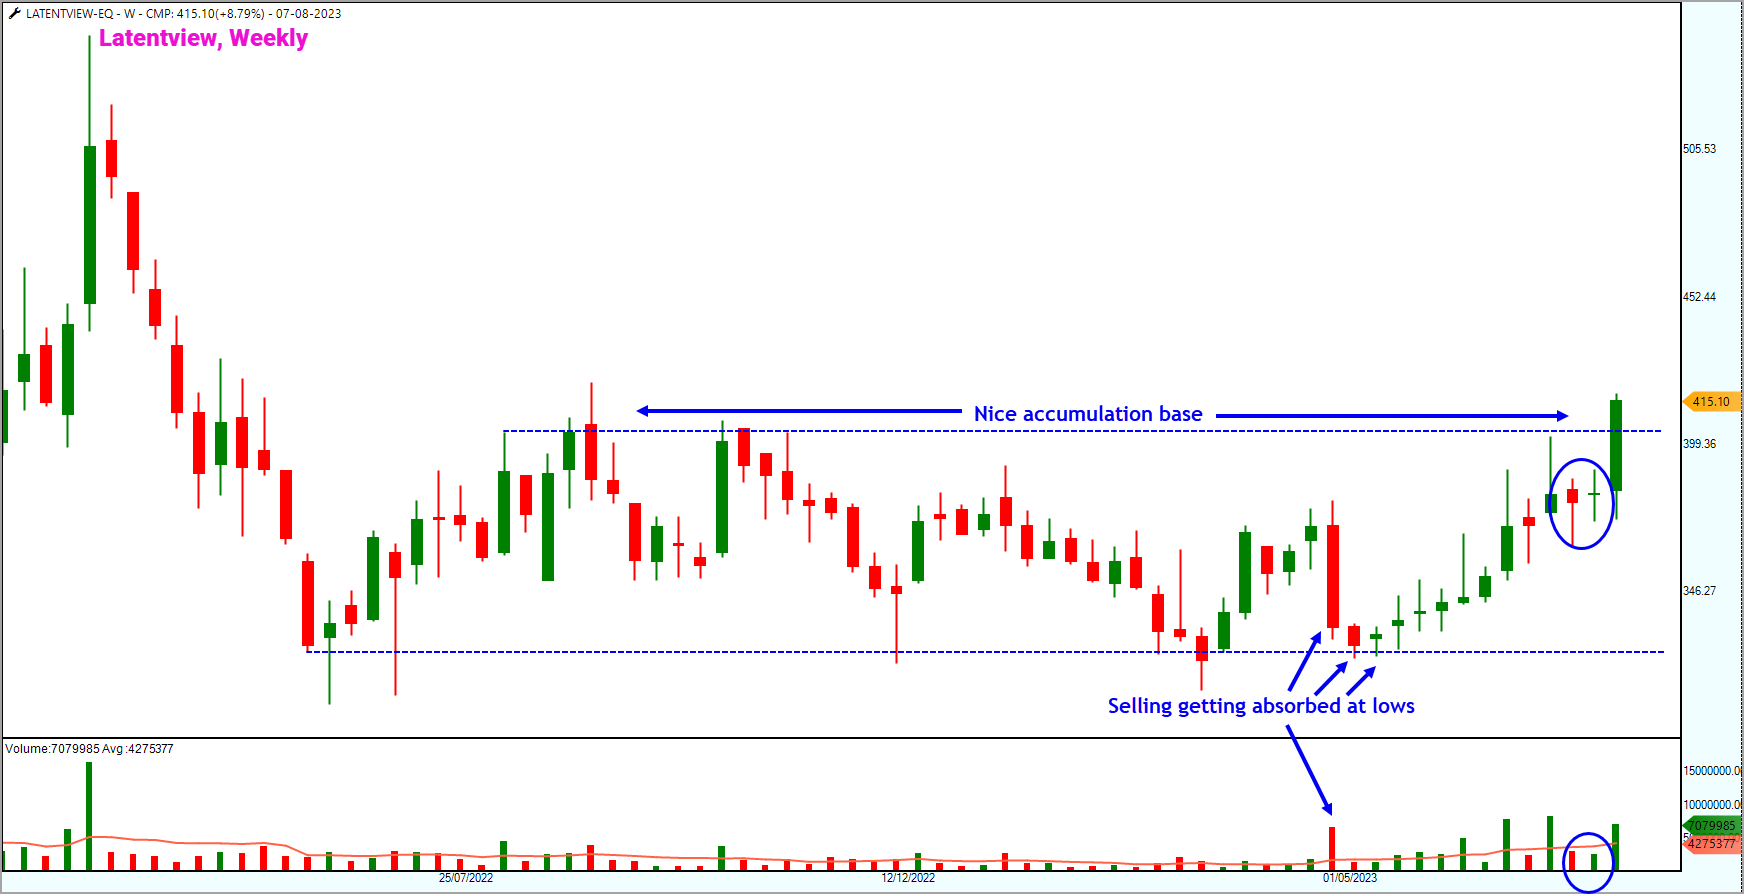
Latent View Analytics is setting up well. I had shared this candlestick chart in the telegram channel earlier.
Here is the Point & Figure Chart of the stock.
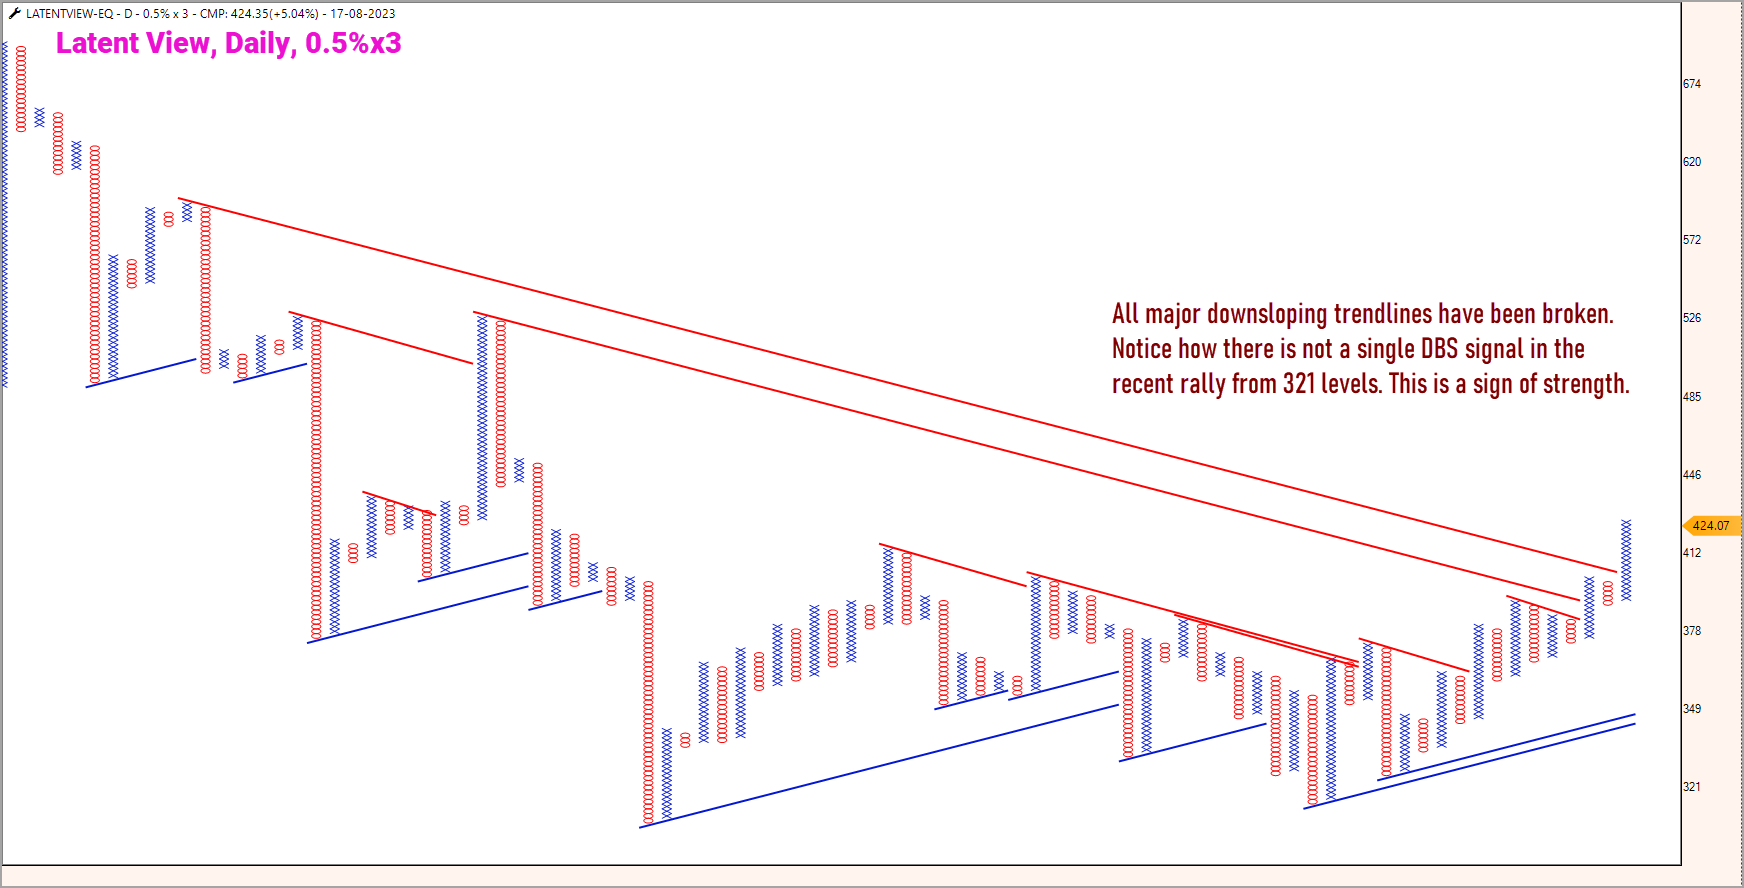
The major downsloping 45-Degree trendlines have been broken, suggesting strength. Notice the absence of double bottom sell signal since the rally began from Rs.321. This again is a bullish sign.
Here is the P&F chart with a few horizontal & vertical counts.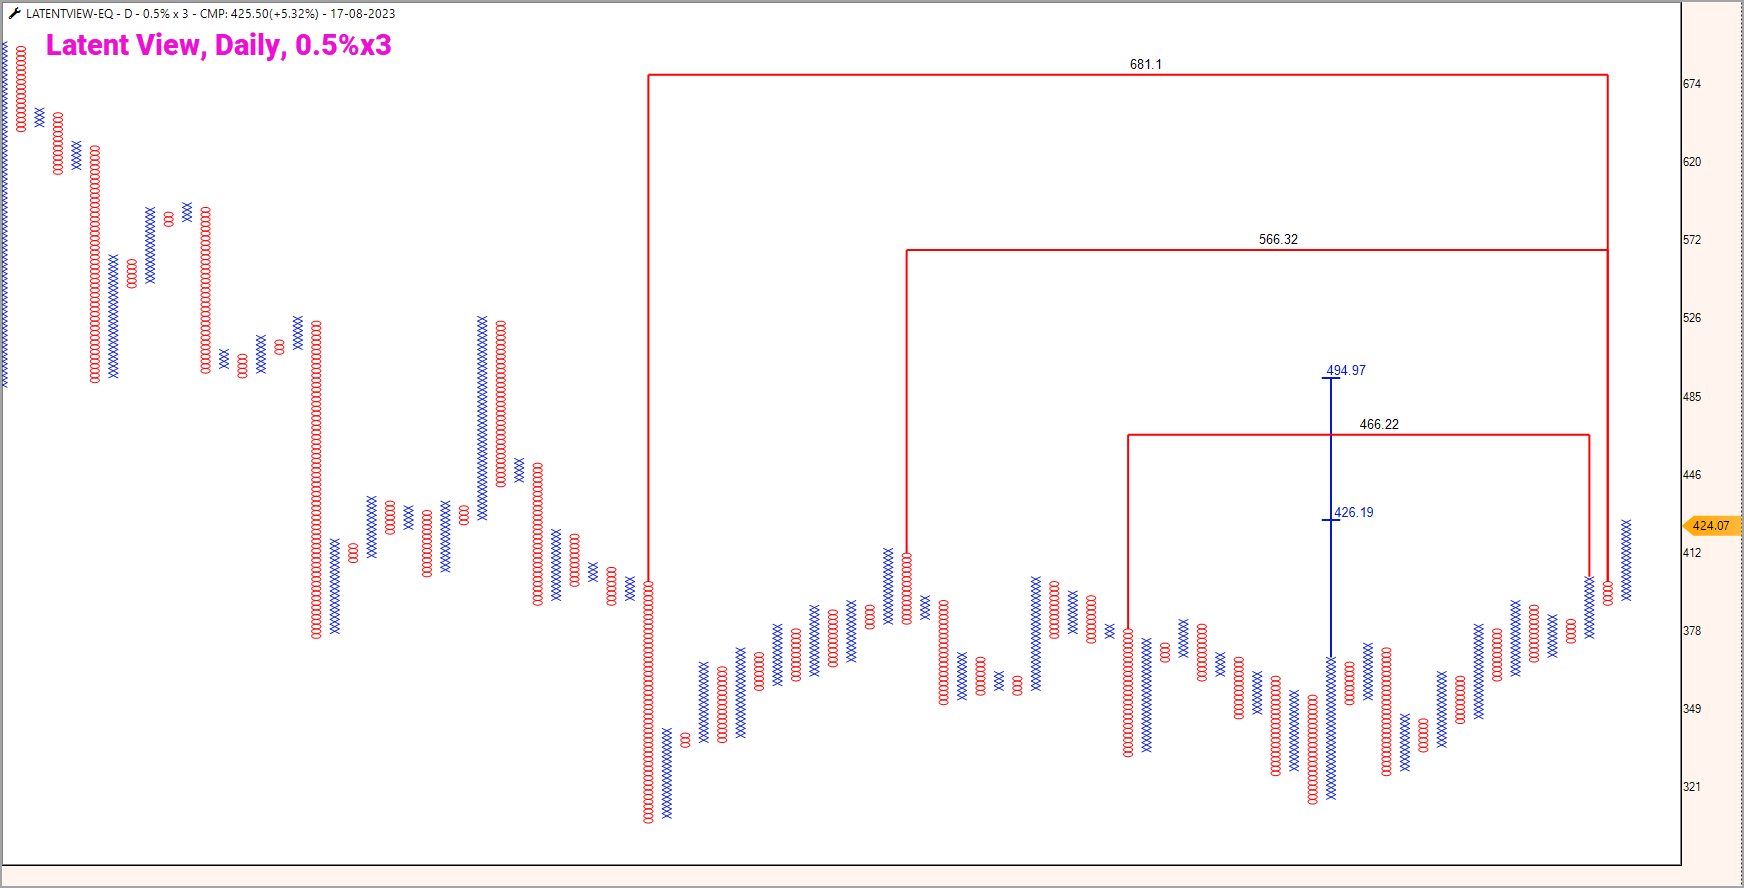
The immediate targets could be Rs.466-495 range. But I am long in the counter for targets in excess of fresh highs. Have an appropriate stop loss and trade wisely.