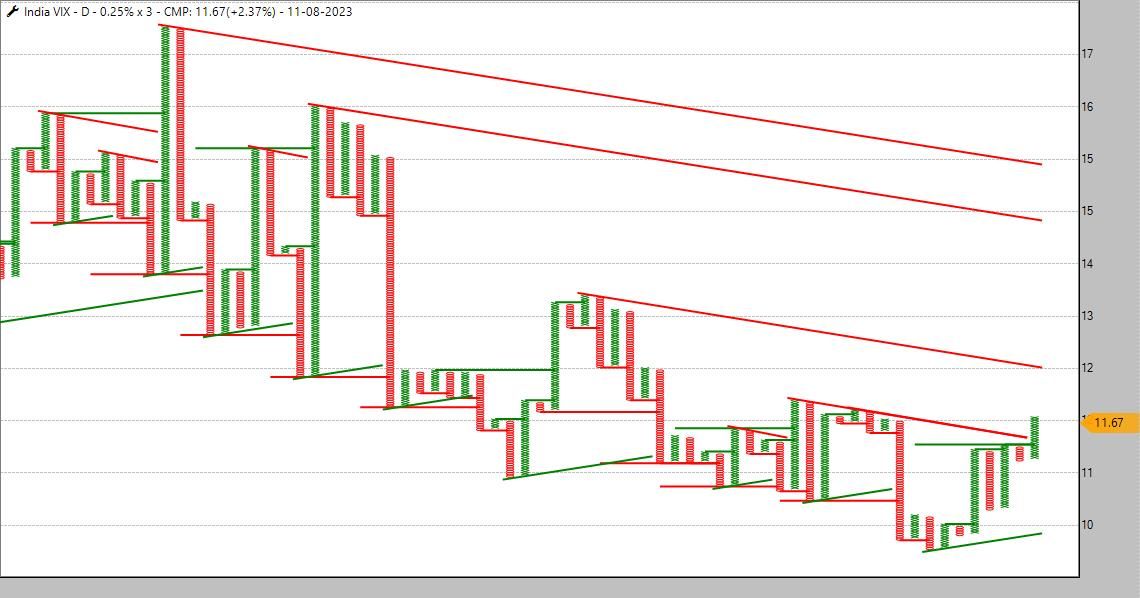
Tracking the VIX chart on 1 minute might help (I have explained it in a video few months back)
AP
Pro User
All Replies
-
-
@Anurag Rathore
The best commodities to trade are Gold, Silver, Crude Oil and Natural gas. You can refer charts posted by Mangesh from time to time for details. -
@Siddharth Venkataraman what is the box size you are using, and which instruments are you trying to plot?
-
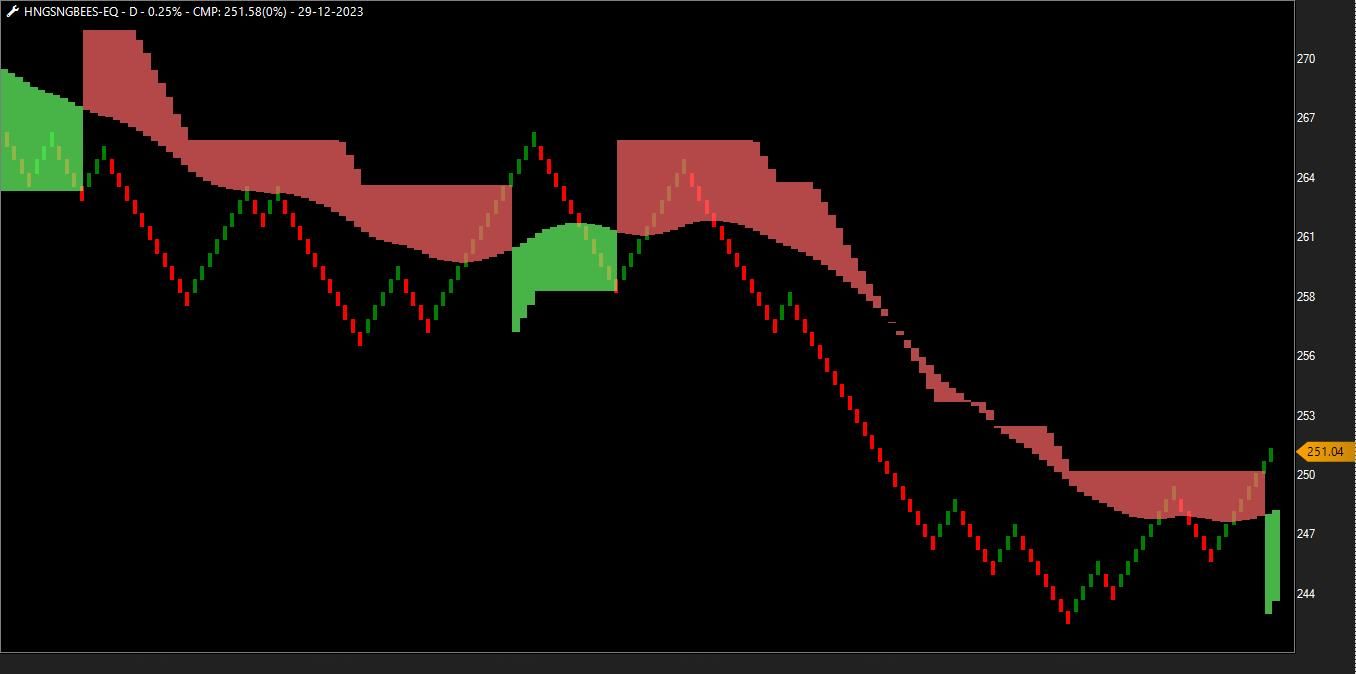
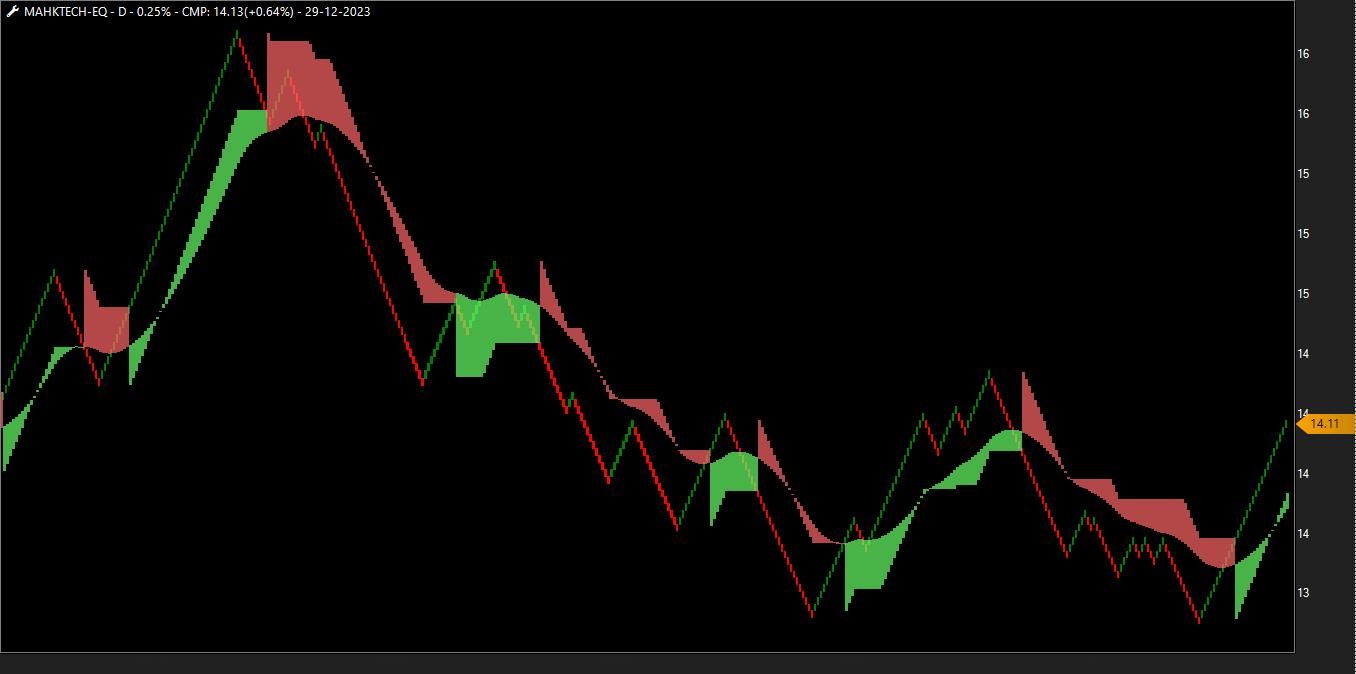
The underperforming mkt of 2023, Hang Seng seems to be reversing.
2 ETFs available in our market
HNGSNGBEES and MAHKTECH
-
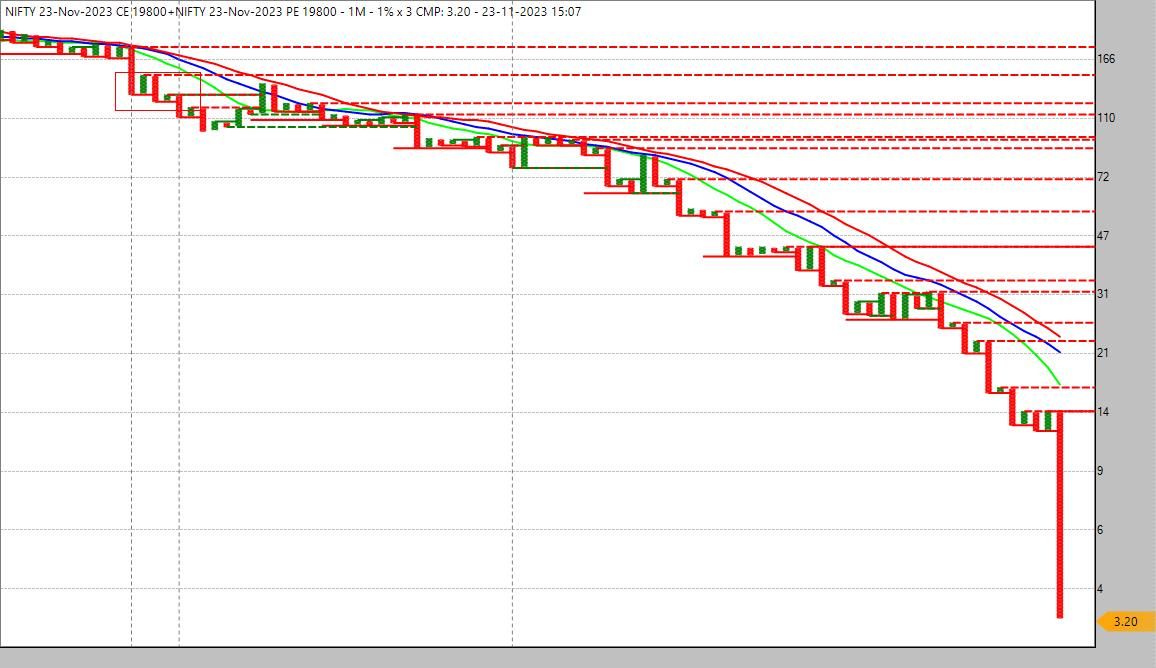
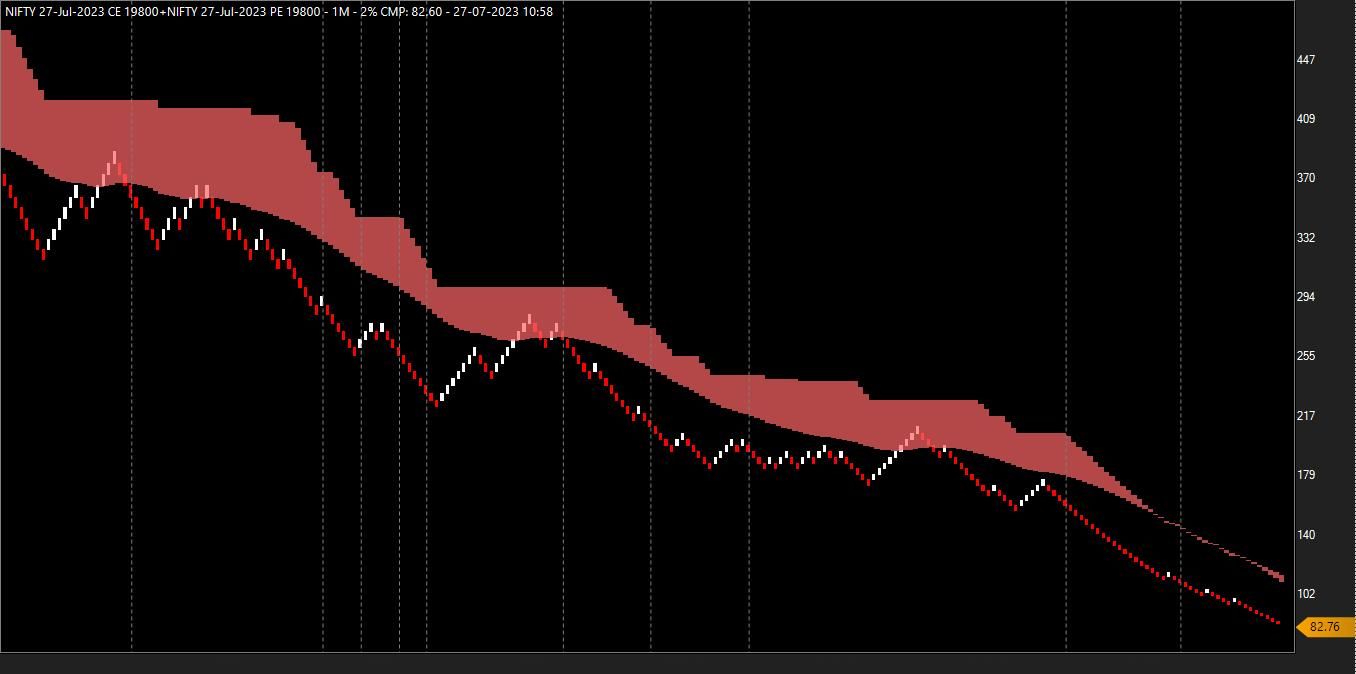
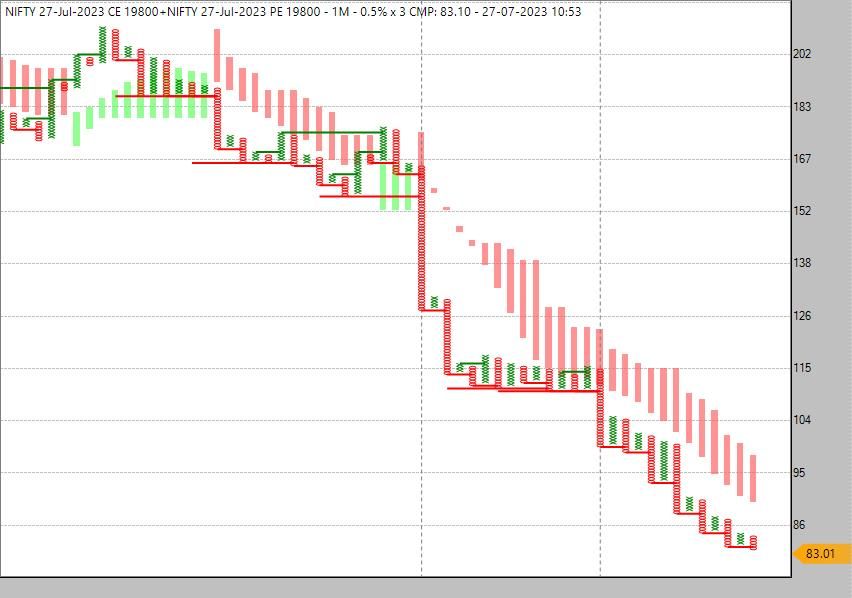
The weekly 19800 straddle gave a DBS sell below the TMA on 21st November hinting at a silent expiry for today; that straddle has come down to 3-4 from 128 in 2 days
-
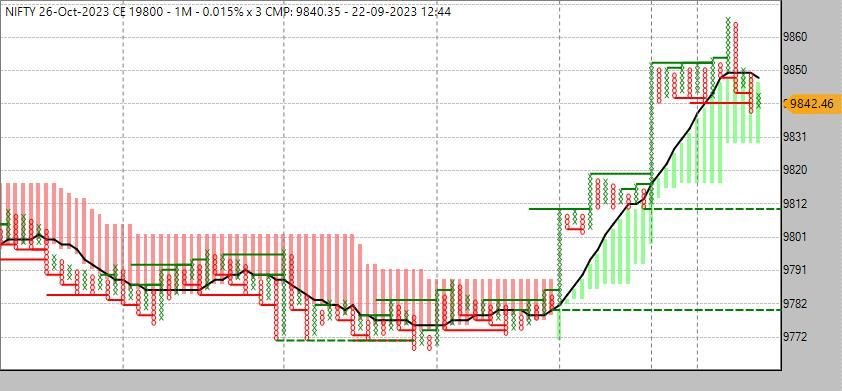
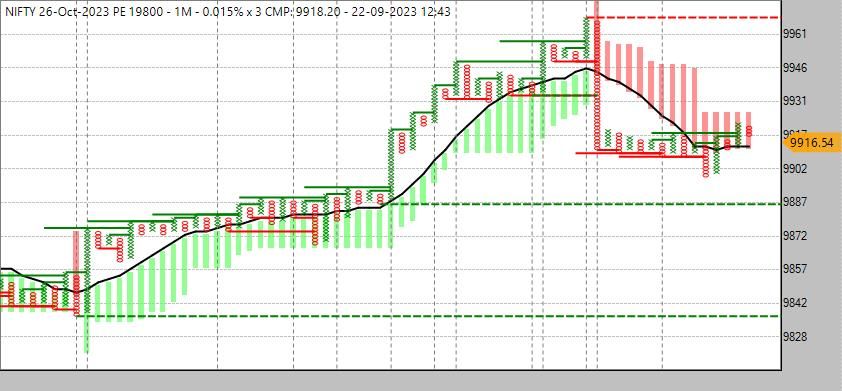
@Nisanth TS Also check TOI of TCS ATM from time to time
-
@Nisanth TS yes, also keep an eye on the ATM PE chart around that time - that also gives a hint
-
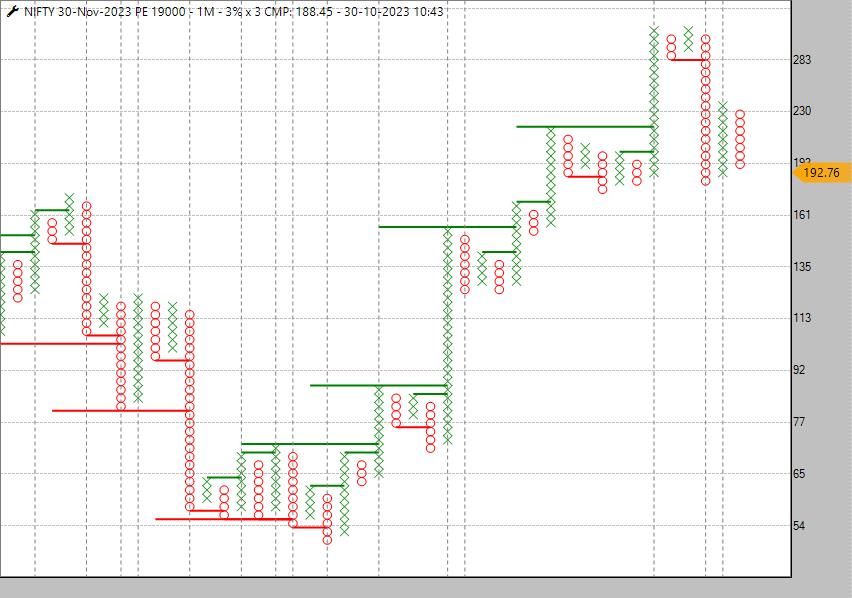
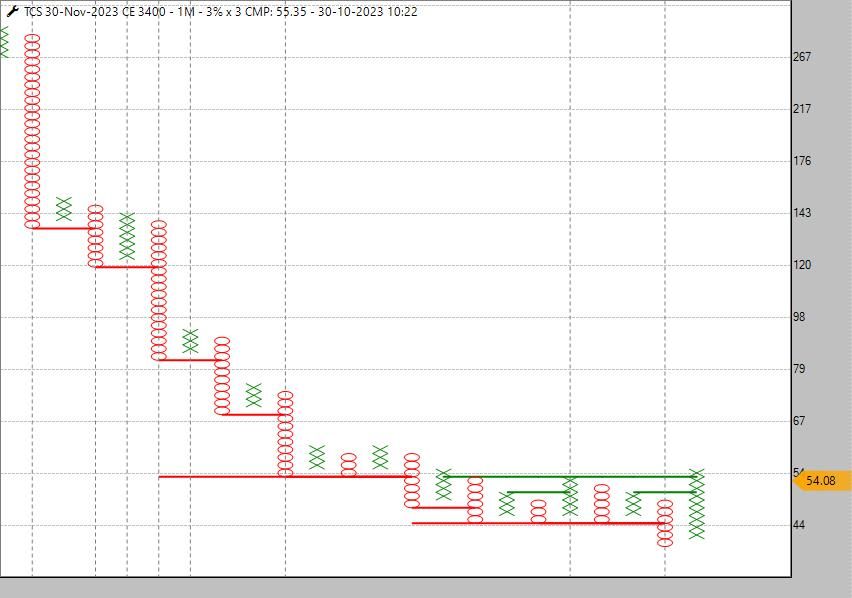
Keep an eye on the highs of the bearish columns on the left of the chart
-
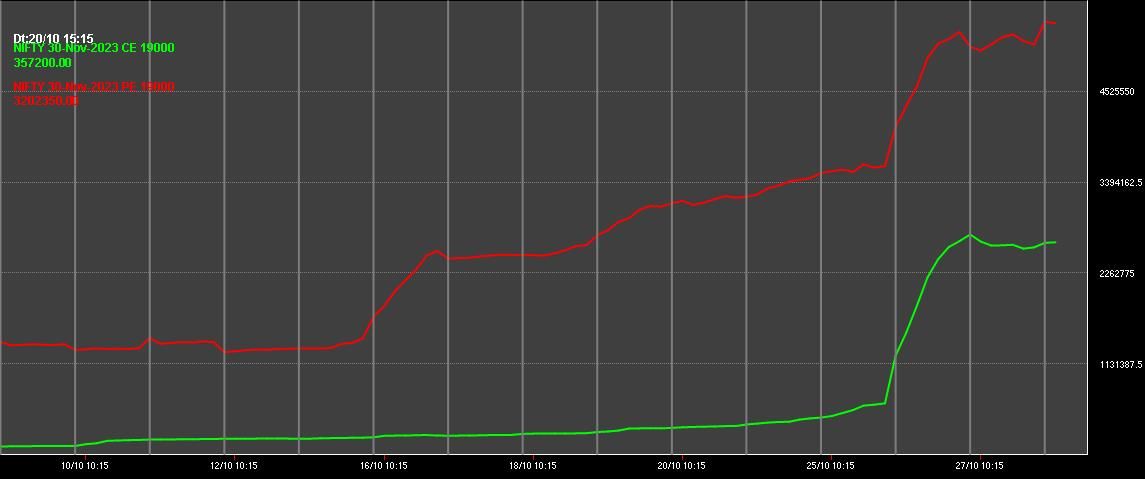
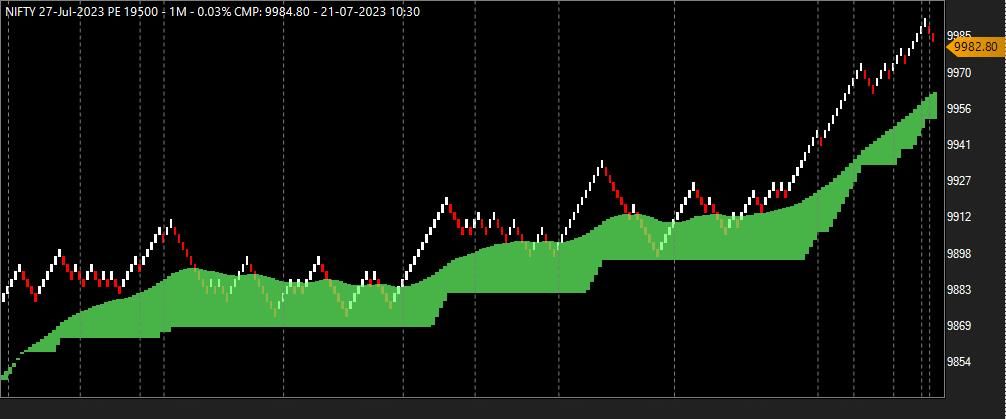
A bearish anchor column on the monthly 19000 PE indicating a reversal in the PE, to be confirmed with a DBS now
-
A very good rr possible in TCS 3400 CE
-
We have started a series on Youtube explaining various features of TradePoint and RZone.
A new video is added every week and you can watch the playlist herehttps://youtube.com/playlist?list=PLlPE6keXfCzrnaw6WuRuWn3-mPRCMFMlK&si=QVTR-tXJf3gFom1-
-
Only ATM options are updated in the group.
-
@Abhi Talwalkar We will try and introduce different expiries in the multi-leg feature; however, the chart will work only till current expiry @Tapan-Jani
-
This will plot only the spread (difference) between the two legs.
A better option is to plot the same strategy in Opstra - Strategy charts where you can define the short and long leg. Its under Options in Opstra; and the strategy remains saved too
-
@Tapan Jani you can plot it on a Spread chart
Ratio / Spread / Sum chart (Alt R)
-
Now, if it goes below 100, it can be bullish for Nifty
-
A simple and lazy system for NiftyBees.
Close to giving a sell after a good run in 4 months. It looks very good when it works, but there are whipsaws too; like any other system, take all trades, and you get at least 1 or 2 big winners every year; this ensures that you are sitting in cash in case of a decline (no idea how much mkt can decline), and always in a trade in an uptrend.Will it? or won't it?


-
19400 straddle for today drifting down;
Multiple OI at 19400 bearish, but that at 19350 bullish-----SO FAR


-
Same chart on Renko
-
@Anil Bilawala on the chart, yes, but the main leg is the short option, which falls
-
@RAGUNATH_AG PnF is 0.01 or 0.015, for Renko, it can be 0.02 or 0.03
-
@Ashish Gupta I have explained it above
-
@Davinder Sachdeva its difficult to plot negative scale on PnF and renko; hence the spread value has been subtracted from 10000
-
@Ashish Gupta Multi-leg--Renko, select monthly ATM short and 300 away OTM long
-
@Davinder Sachdeva These spreads are on a negative scale and hence plotting is done by subtracting the value from 10000
-
 Keep observing such charts; keep experimenting.! 19500 PE credit spread and 19800 CE Credit spread charts 19500PE_CrSp+Renko.jpg
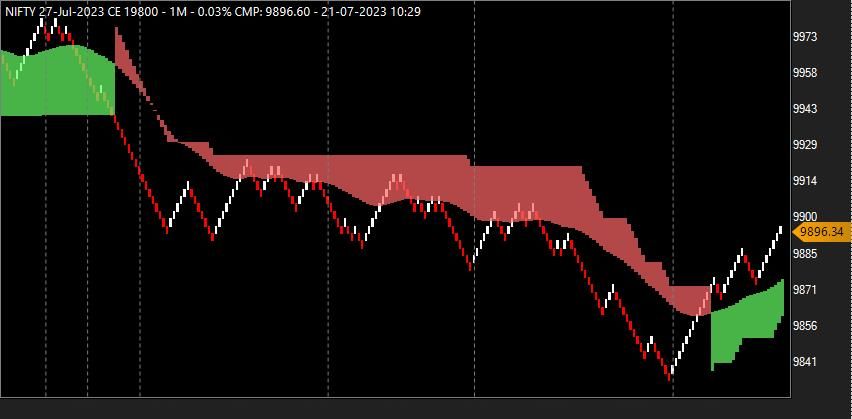
-
Monthly TOI has been bullish all through the last few days, you need to enter the ATM leg (PE short) as soon as it gives a signal; A cross check with the reverse spread also helps (CE short); Best confirmation is from the naked PE chart either on PNF or Renko 3%
-
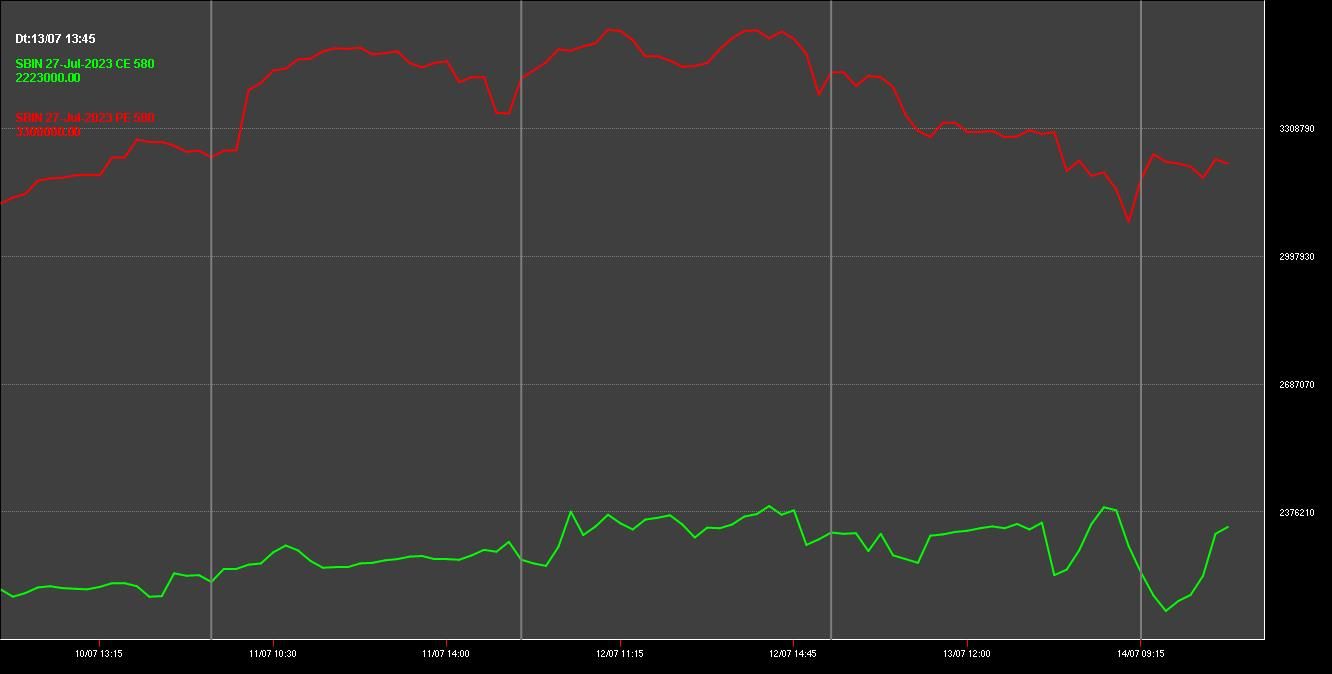
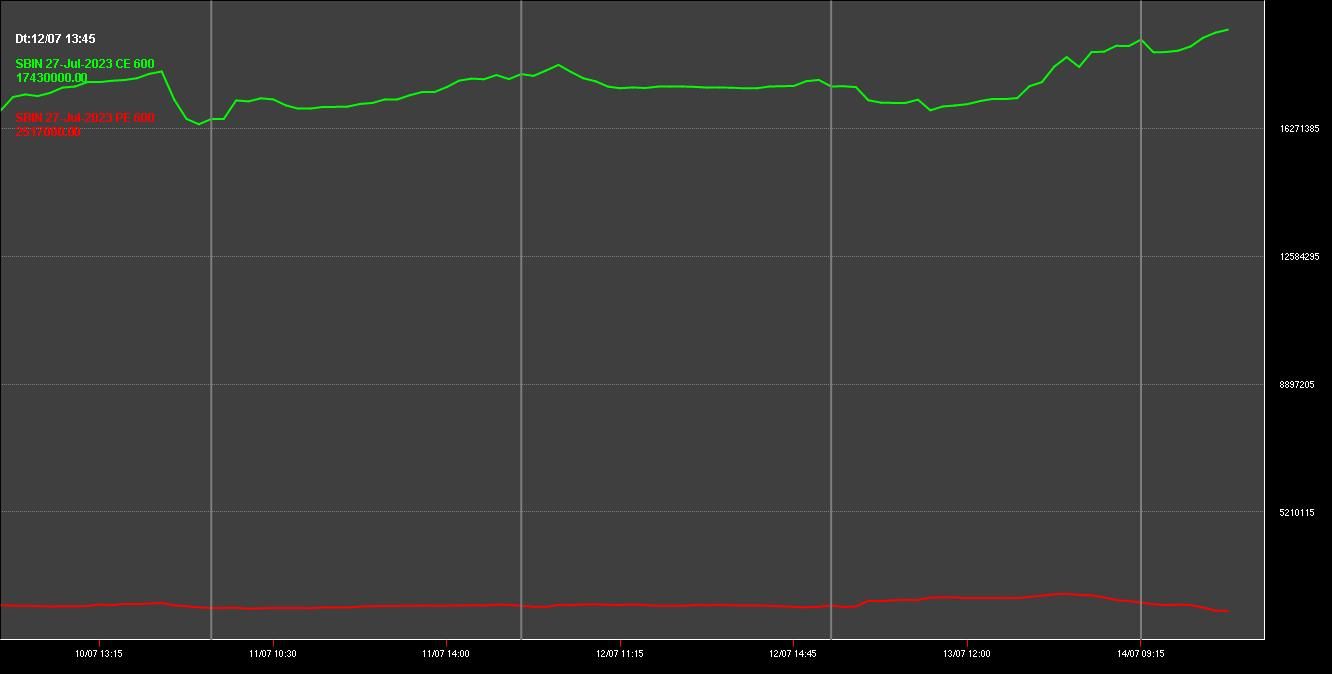
SBI has a 'crowded bus scenario' at 600, however, 580 strike shows exactly opposite; That is the reason why the stock is range bound.
-
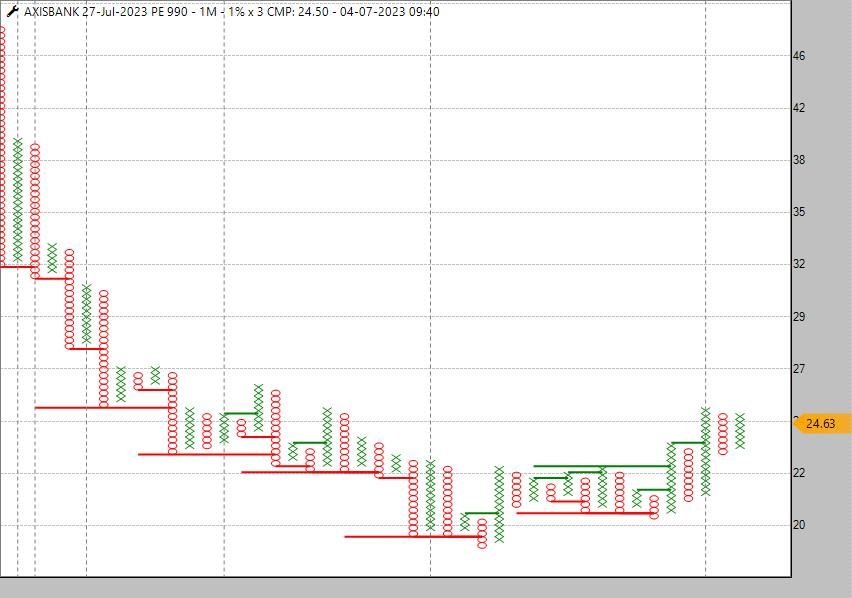
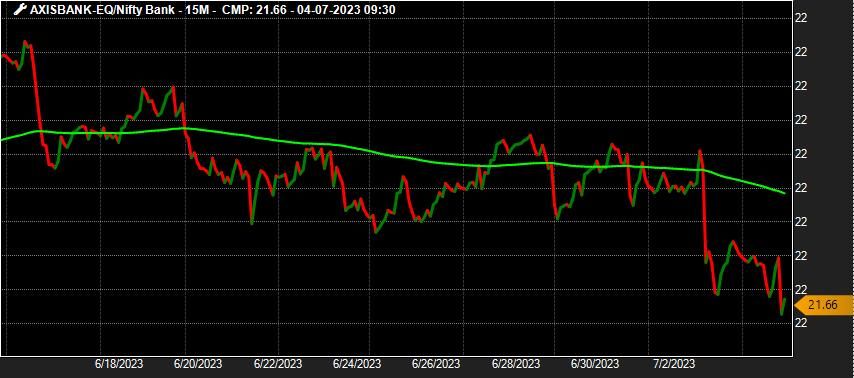
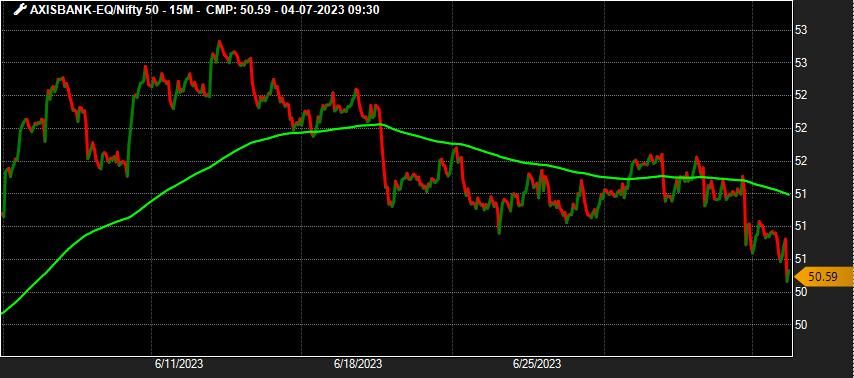
Axisbank was weak in this market after 3 failed attempts to cross 990, is now 953. Put is near the trgt (high to the left)
950 is a support too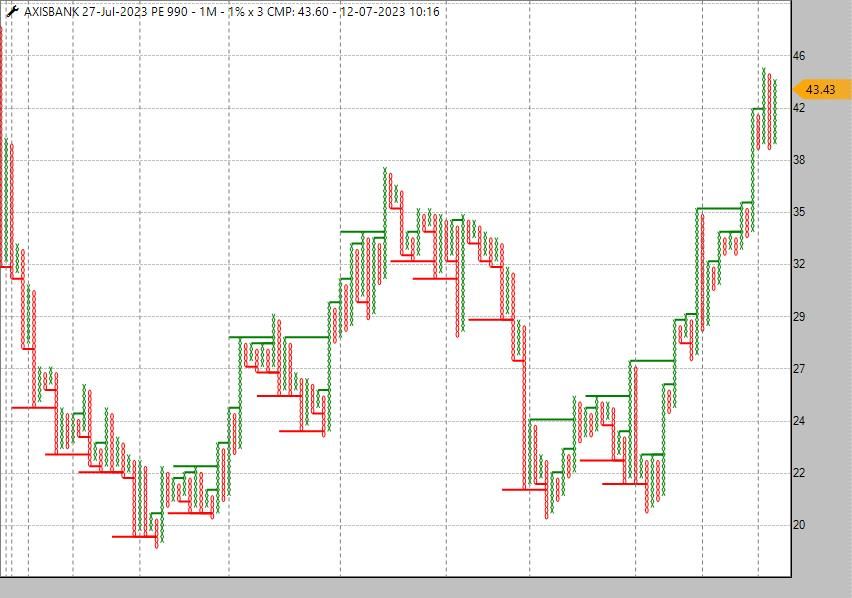
-
Opstra takes data directly from NSE and this spike had come yesterday morning; AUBank in general is a very illiquid stock in Options and this is a deep ITM option
-
@Anil Bilawala Sorry, was busy whole day. Right now Nifty is in momentum, maybe you can check on Friday after a couple of hrs
-
@RAGUNATH_AG perfect
-
@Soujanya Holkar Sorry, was busy whole day. Right now Nifty is in momentum, maybe you can check on Friday after a couple of hrs
-
@Anil Bilawala if a higher straddle is bearish, that means Nifty is bullish, since it is PE heavy and going down, which means the PE is taking the straddle down. This means Nifty is bullish
-
@Deven Shah right time was the DBS yesterday, now, maybe after a column of X and THEN a column reversal, so sl is that much closer
-
@Anil Bilawala on imbalance due to a 100-150 pts move in Nifty, but keep an eye on higher and lower straddles also (more often than not, they also have a story to tell, about an impending move)
-
@Yogender Panwar one hack is to go to 0.25% box size and then a CR after a column of X if is there
-
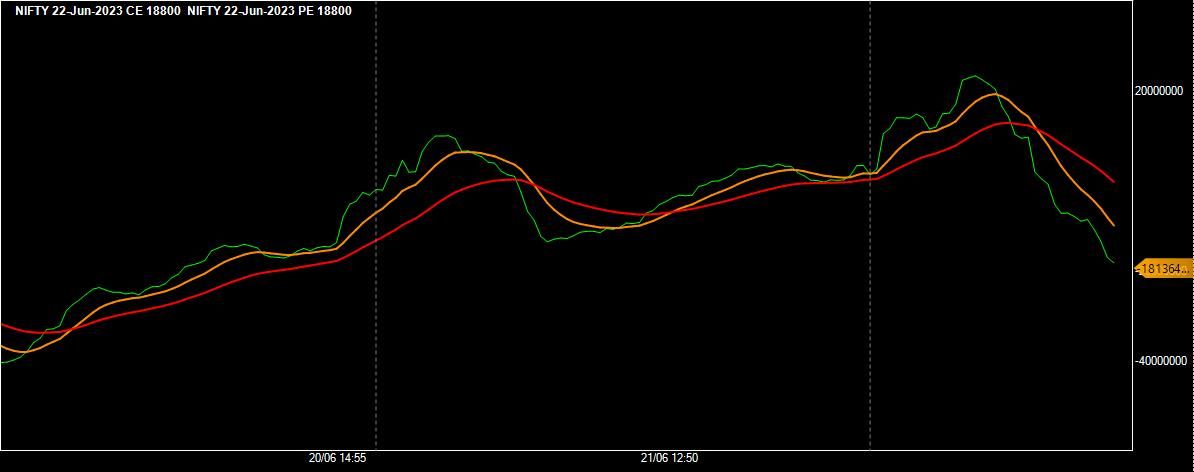
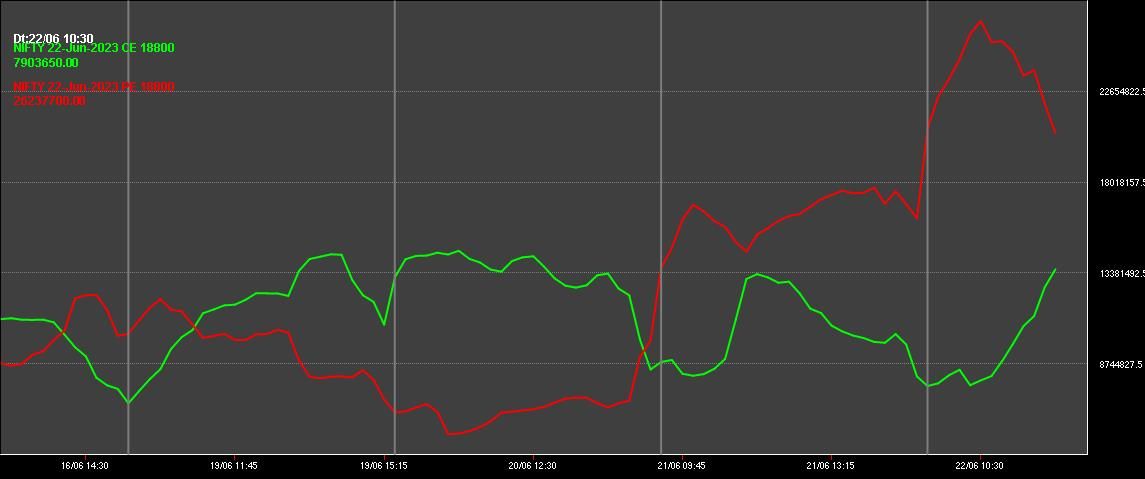
TOI has been negative since morning, 18850 Put rising, and OI of 18800 PE has started falling
-
@Anil Bilawala yes, and CE and PE are quite close to each other
-
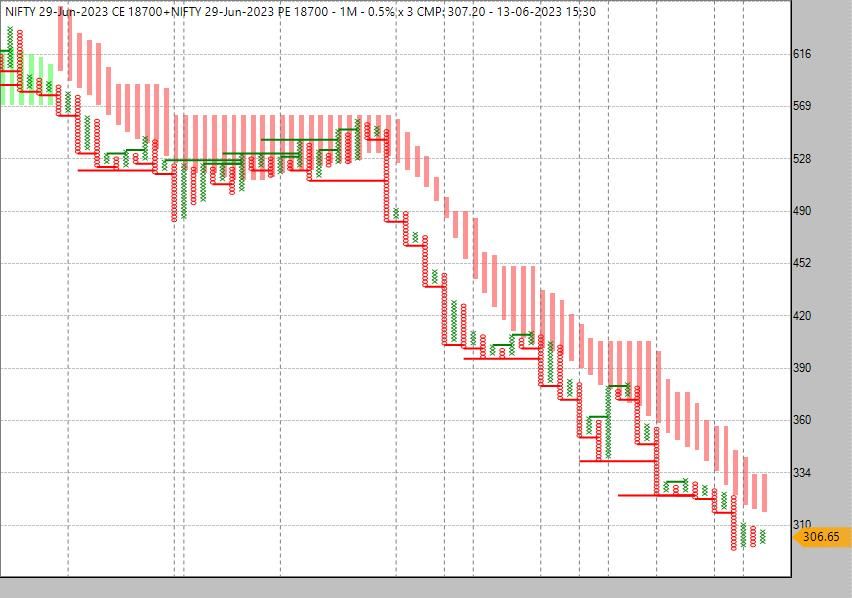
@Anil Bilawala looking at current mkt, 18700 looks good. I had also posted this chart a couple of days back and it's now below 299
-
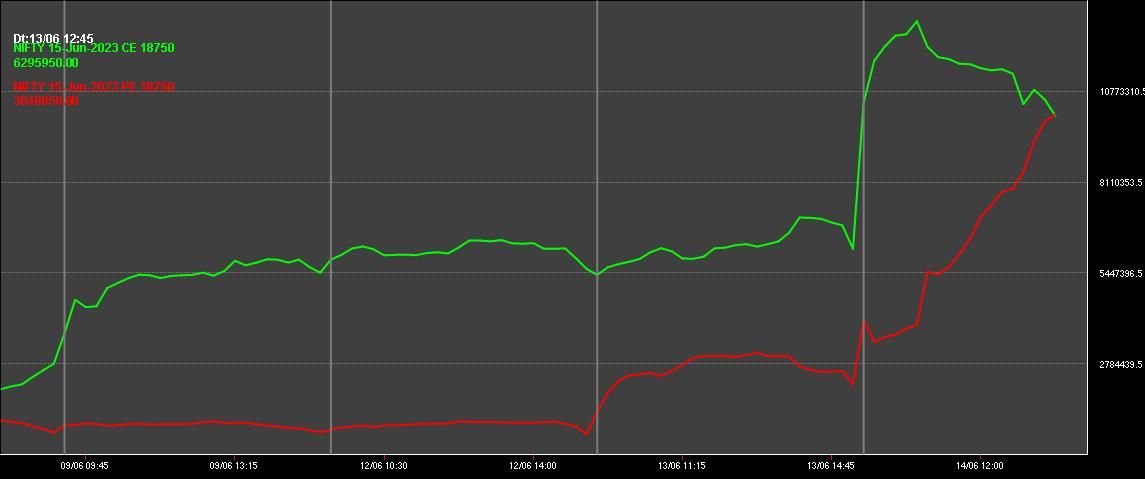
18750 PE OI has risen sharply today and it is now exerting pressure on the 18750 CE OI.
Who will blink first?
-
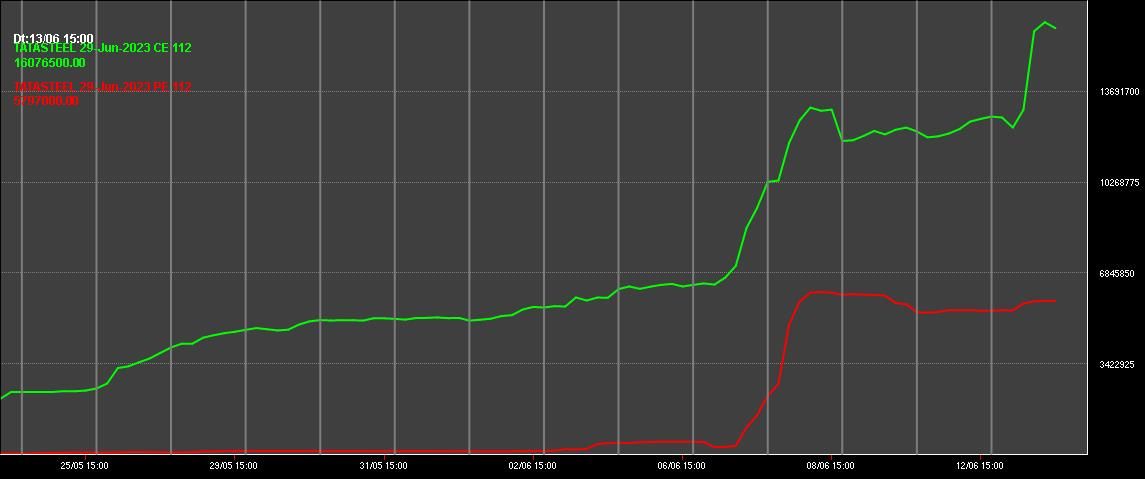
112 CE has OI which is almost 2.5 times that of the 112 PE; unless the CE OI goes down, it will be difficult for Tata Steel to sustain above 112; sustaining abv 112 can take it to 115
-
Monthly 18700 straddle below 298 will be a continuation sell
-
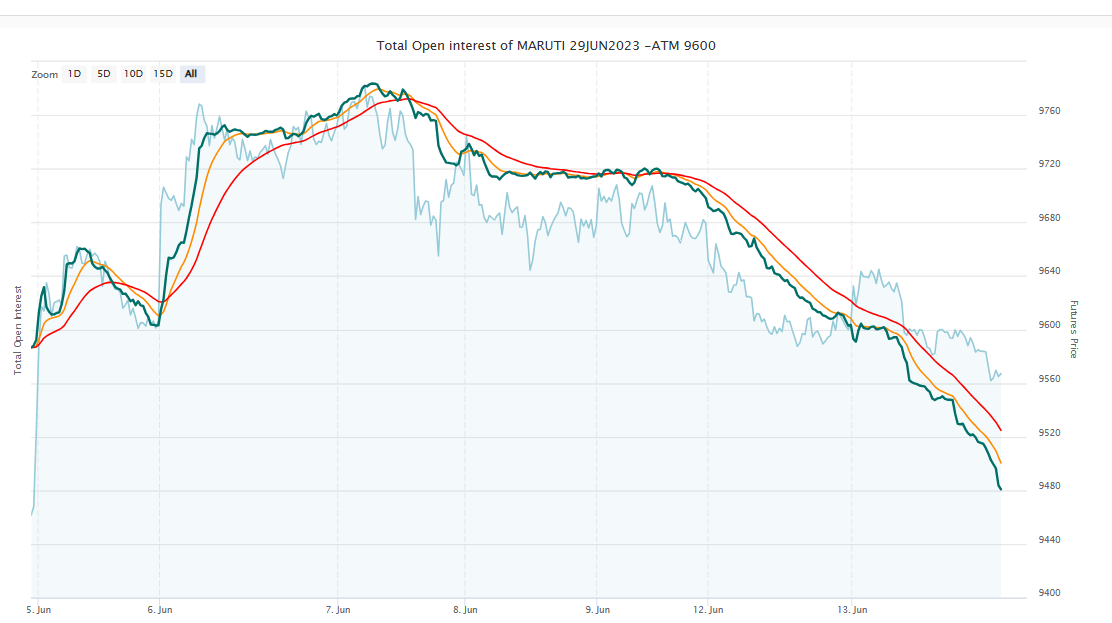
Maruti TOI
-
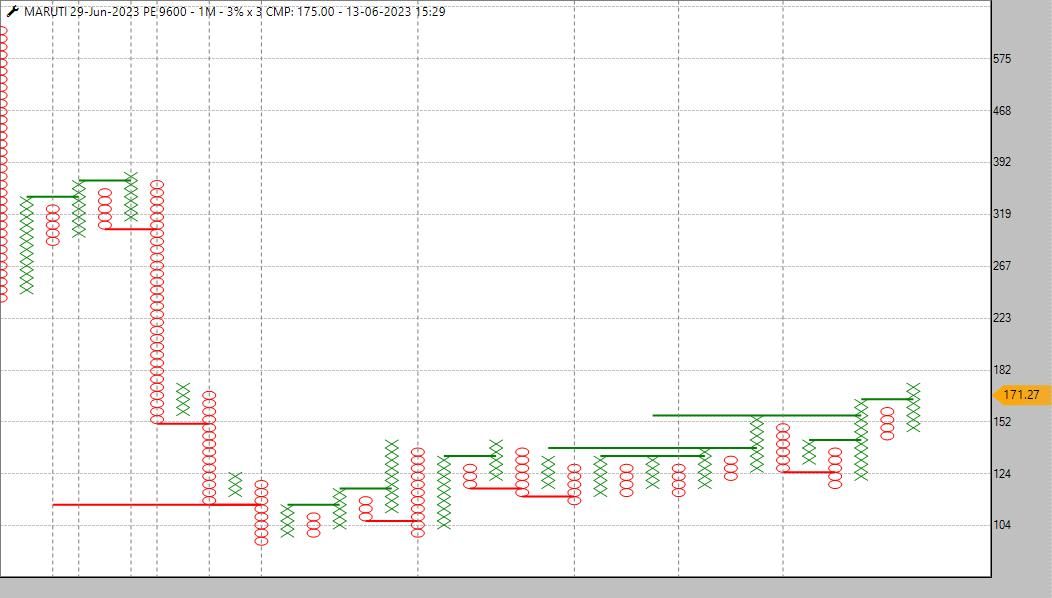
Maruti 9600 PE
-
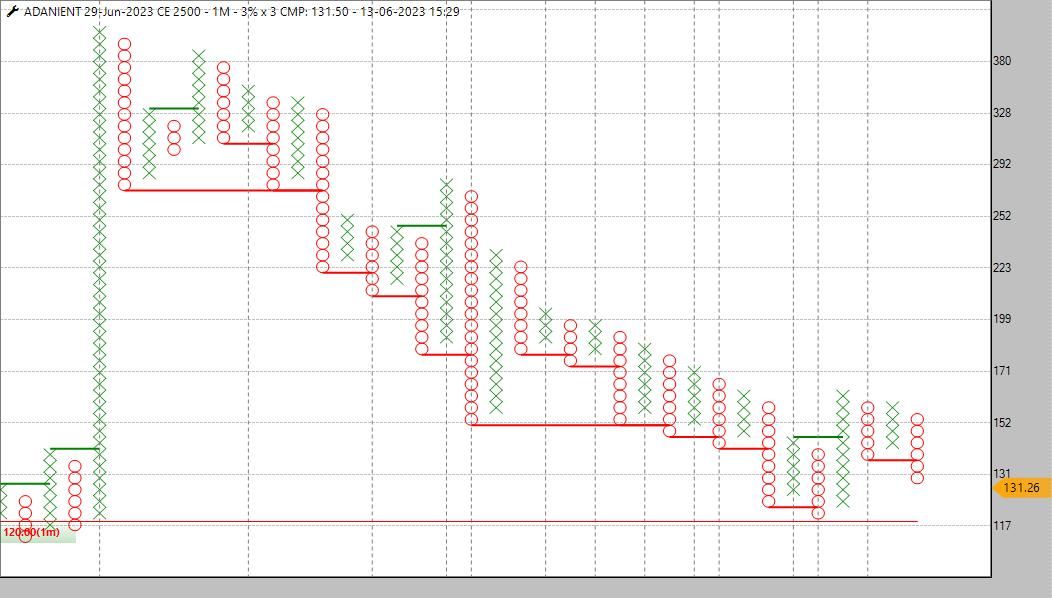
Adani Ent 2500 CE - possible pattern retest; DTB abv 162 can take it to 260 or higher; Pattern invalid if the CE goes below 120
Renko | Nifty Short Straddles (45 DTE) | Positional Trading System
Commodity Basic Questions.... for experts to answer
Tradepoint Multileg Chart
You can invest in Hang Seng on NSE and BSE
19800 straddle suggested a silent expiry from 2 days back
TCS showing signs of a reversal
TCS showing signs of a reversal
TCS showing signs of a reversal
Nifty pullback / reversal?
Nifty pullback / reversal?
TCS showing signs of a reversal
Request for Training and Clarification on R Zone Scanner Modes
What are the criteria for Stock Options Liquid Group?
Tradepoint Multileg Chart
Tradepoint Multileg Chart
Tradepoint Multileg Chart
Is the market reversing? October CE and PE spread charts are suggesting so
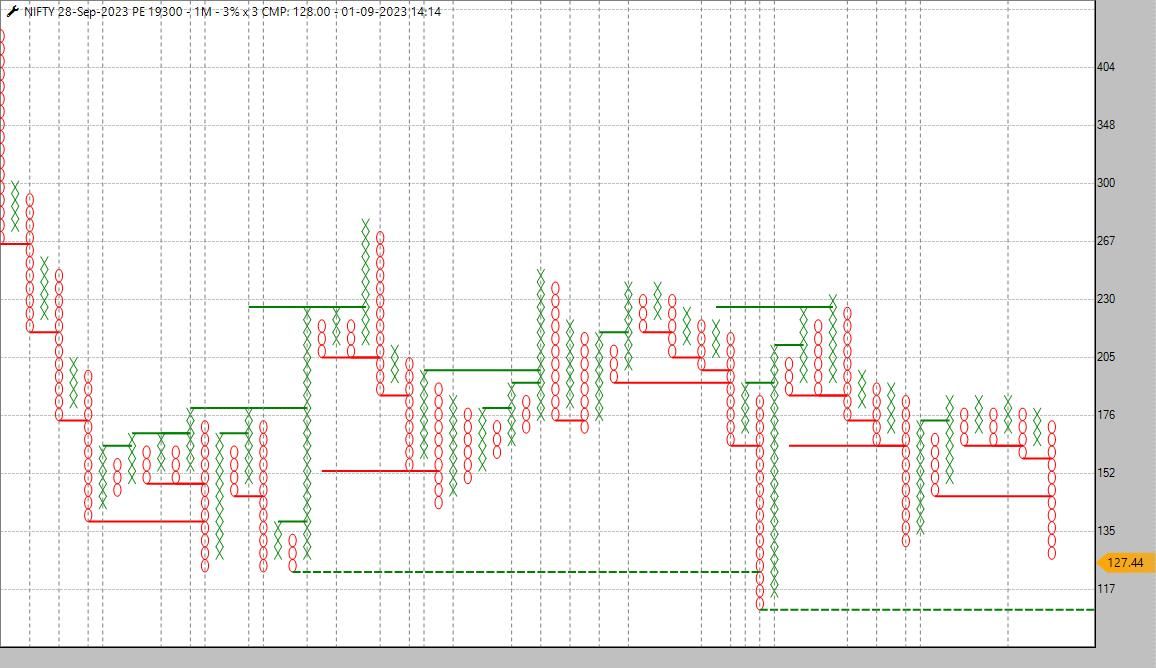
Nifty Sept 19300 PE never had any momentum in the 'downtrend'
Simple and lazy system for Niftybees; Renko 0.25% EOD with MAST
Nifty caught between the devil and the deep blue sea
INDIA VIX close above 12 can be a breakout in India VIX
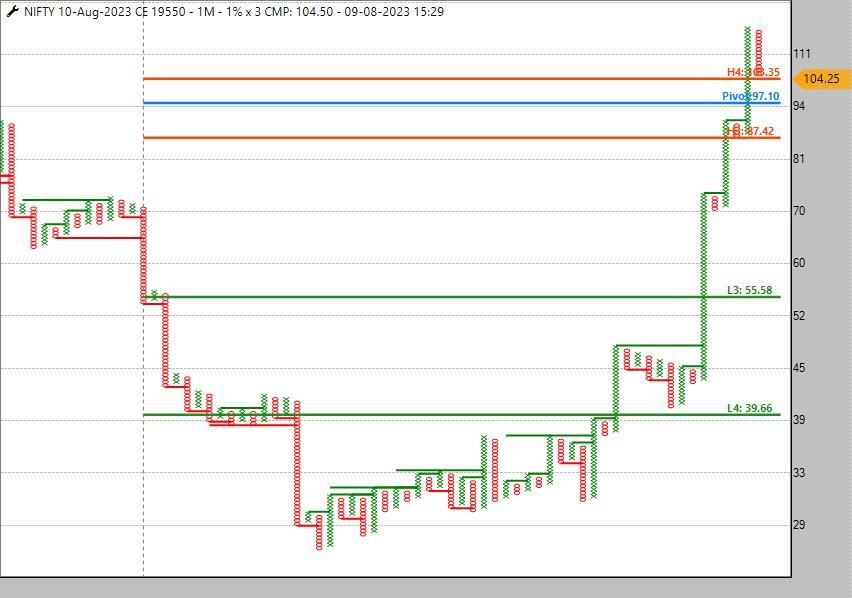
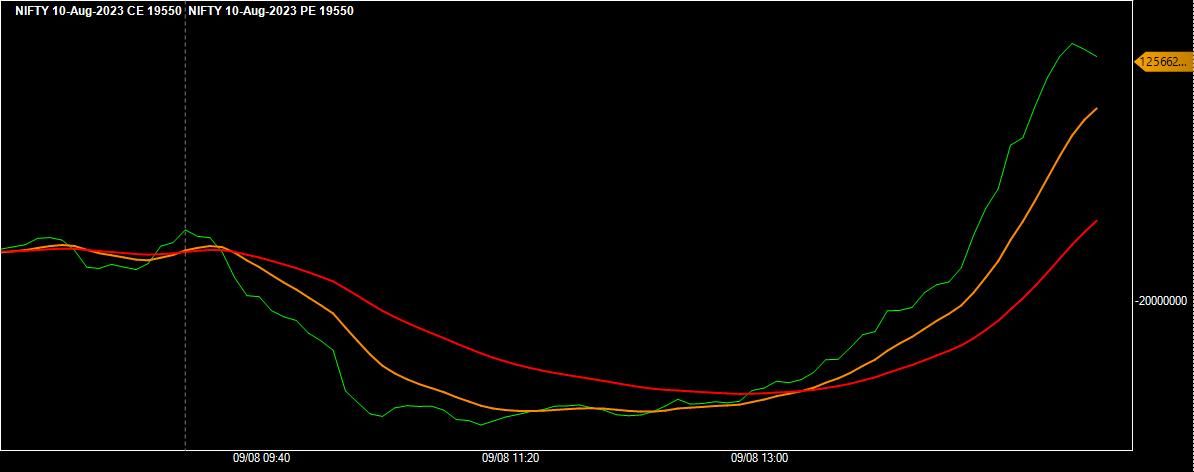
Trade what you 'see' and NOT what you 'feel'; TOI turned buy after 1.15 and then the 19550 CE triggered a buy
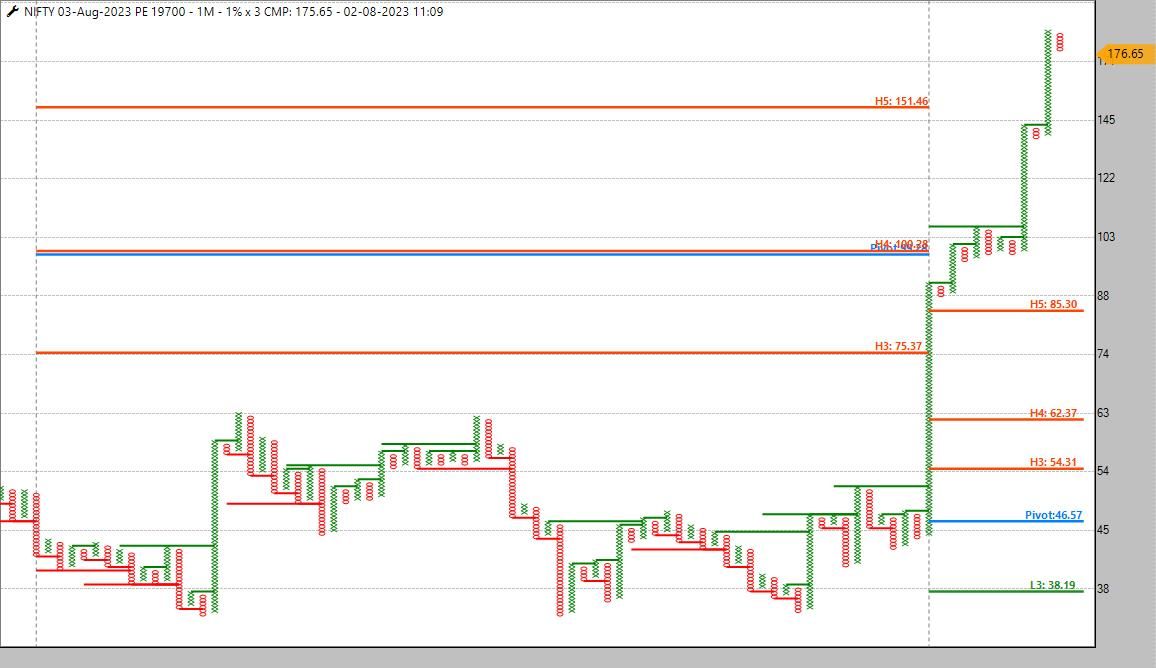
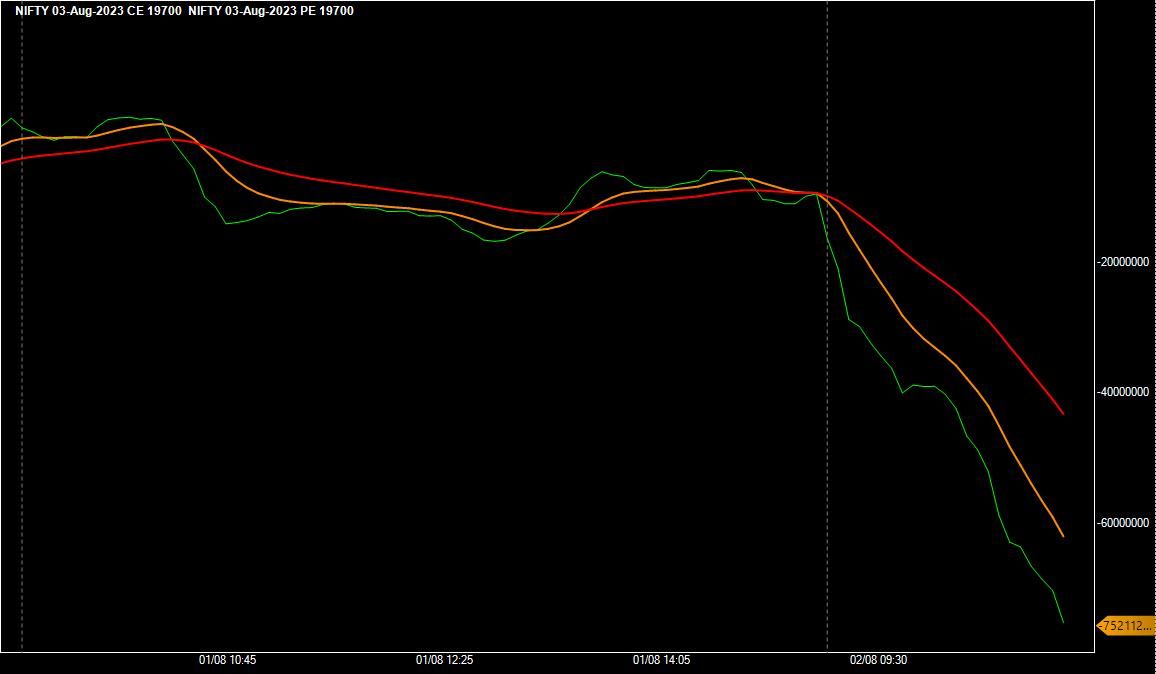
Gaps are not in your control, BUT, what you do AFTER the gap is very much under your control
19800 straddle for today
19800 straddle for today
How Renko charts look on Credit spreads, much more objective - 0.03% brick
How Renko charts look on Credit spreads, much more objective - 0.03% brick
How Renko charts look on Credit spreads, much more objective - 0.03% brick
How Renko charts look on Credit spreads, much more objective - 0.03% brick
How Renko charts look on Credit spreads, much more objective - 0.03% brick
How Renko charts look on Credit spreads, much more objective - 0.03% brick
How Renko charts look on Credit spreads, much more objective - 0.03% brick
Doubt in Spreads
SBI sandwiched between 2 strikes
Axis Bank underperforming to Nifty and Banknifty and the 990 PE showing first signs
Axis Bank underperforming to Nifty and Banknifty and the 990 PE showing first signs
Wrong data on Opstra?
Axis Bank underperforming to Nifty and Banknifty and the 990 PE showing first signs
July 18700 straddle drifting down
July 18700 straddle drifting down
July 18700 straddle drifting down
July 18700 straddle drifting down
July 18700 straddle drifting down
July 18700 straddle drifting down
July 18700 straddle drifting down
July 18700 straddle drifting down

Interesting setups for the expiry today
Nifty straddle
Nifty straddle
Open interest at 18750 looks interesting
Tata Steel crowded bus?
Nifty straddle
Strange to see a bearish pattern in a stock
Strange to see a bearish pattern in a stock
Adani Ent 2500 CE