Dalal Street opened on an optimistic note as the Goods and Services Tax (GST) announcements fueled excitement across sectors. The Nifty opened higher yesterday, signalling positive sentiment. However, the real lesson for Indian stock market traders lies not just in the numbers, but in the psychology of “buy the rumor, sell the news.”
In trading psychology, “buy the rumor, sell the news” is a common phenomenon where investors build positions ahead of an anticipated event, such as a policy change, corporate result, or government announcement.
For Indian traders, GST revisions provide a textbook example of this strategy.
GST Buzz and the Auto Sector Rally
Ahead of the GST announcement, there was strong buzz around a possible tax reduction in the automobile sector. Anticipating positive reforms, traders and investors aggressively bought into auto stocks.
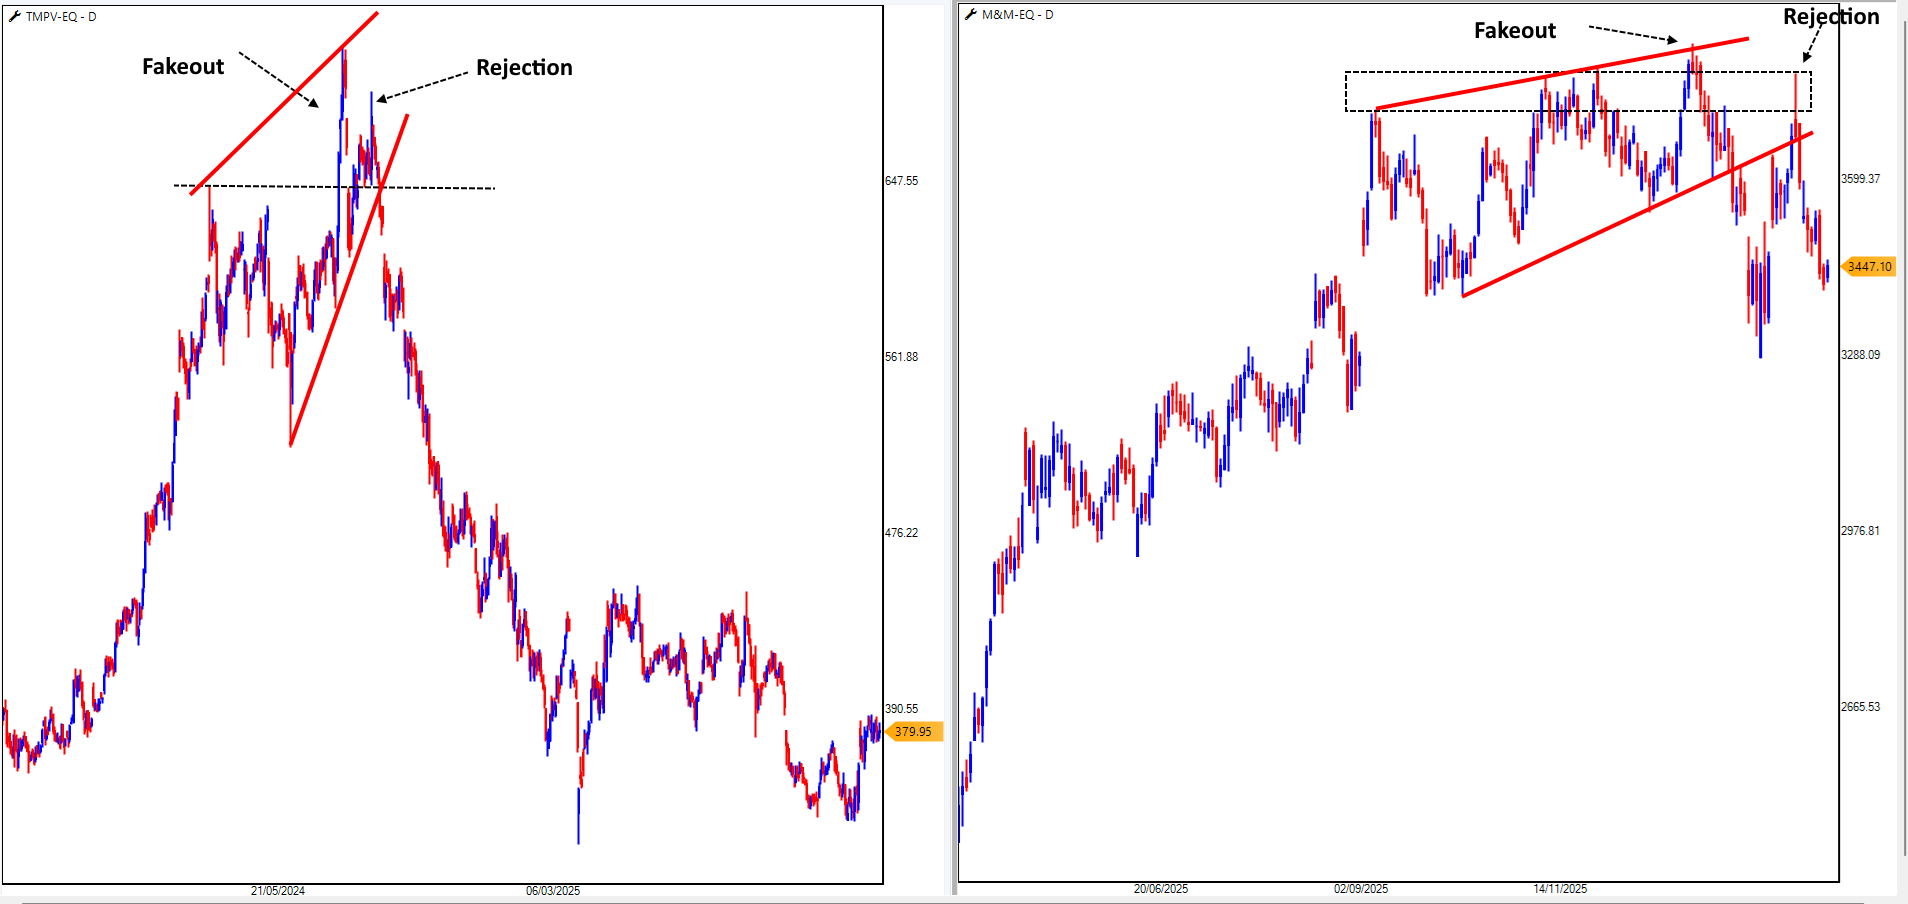
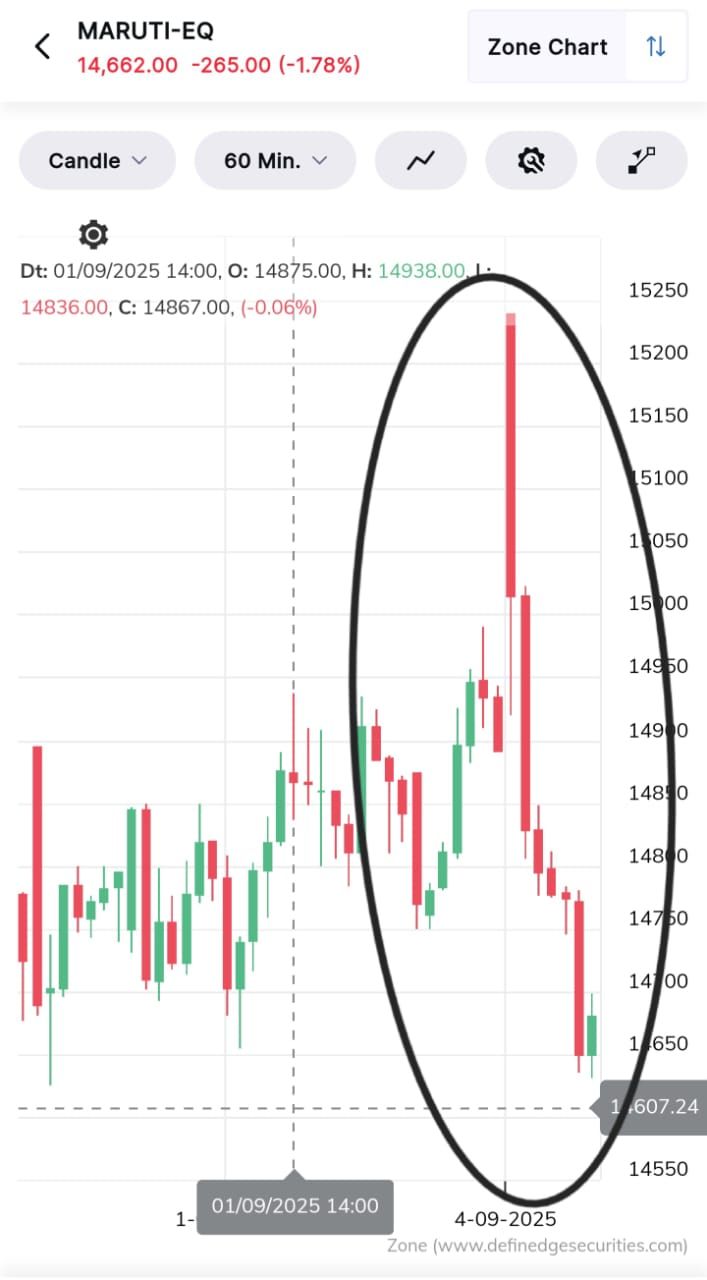
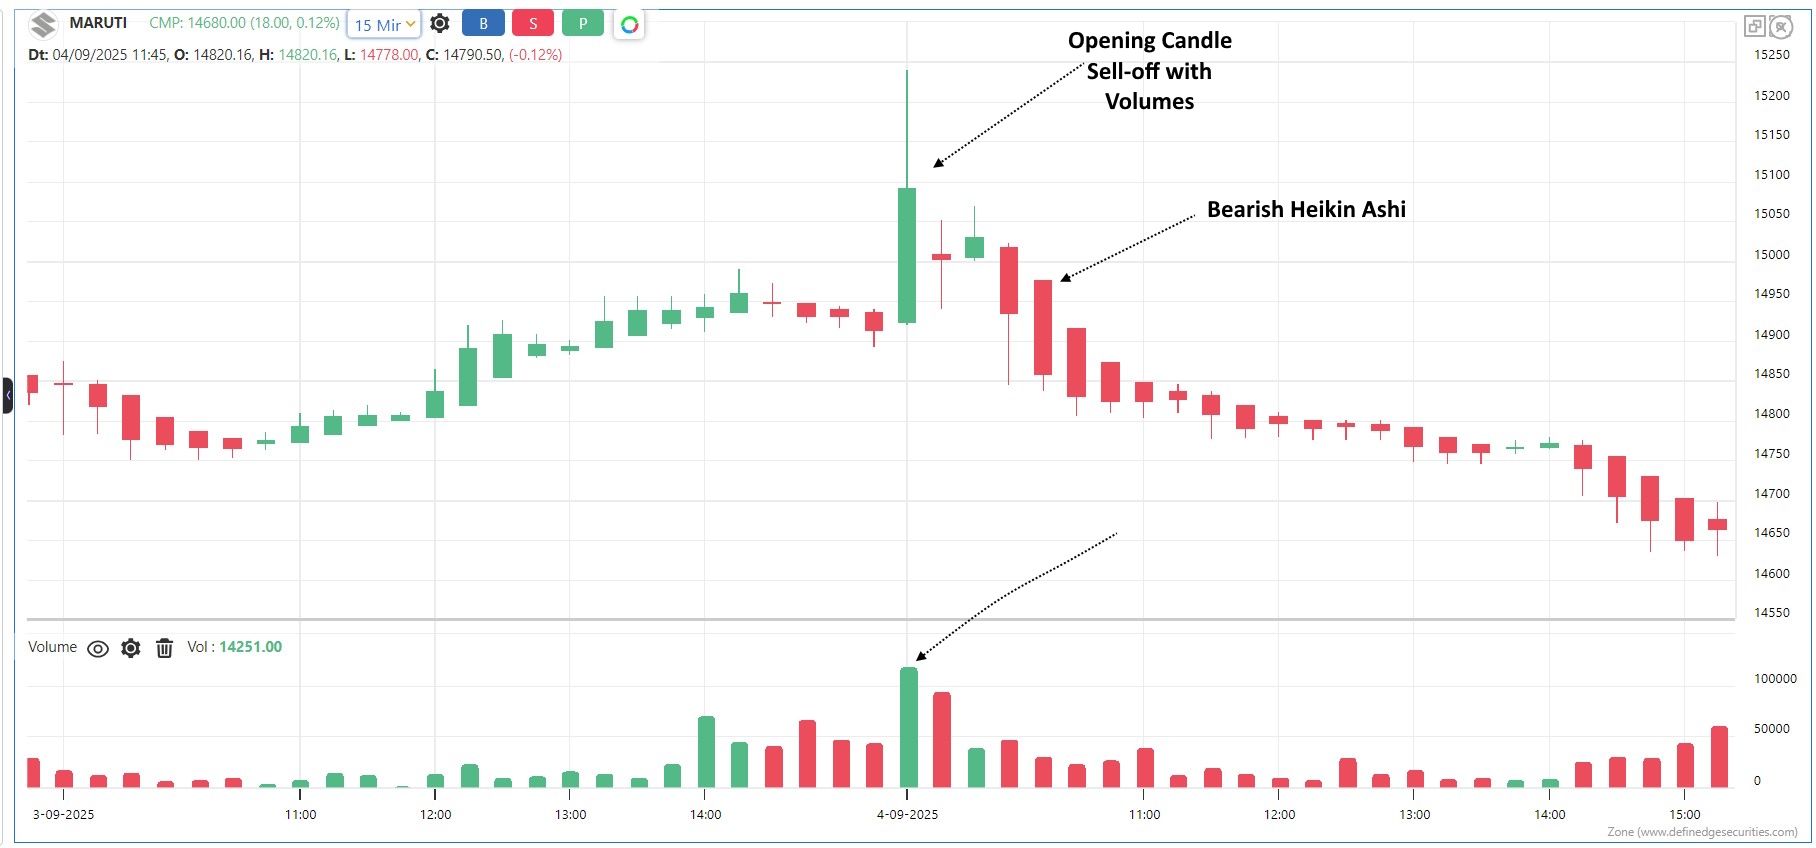
• Maruti Suzuki surged in the run-up but fell 4% from its high once the news became official.
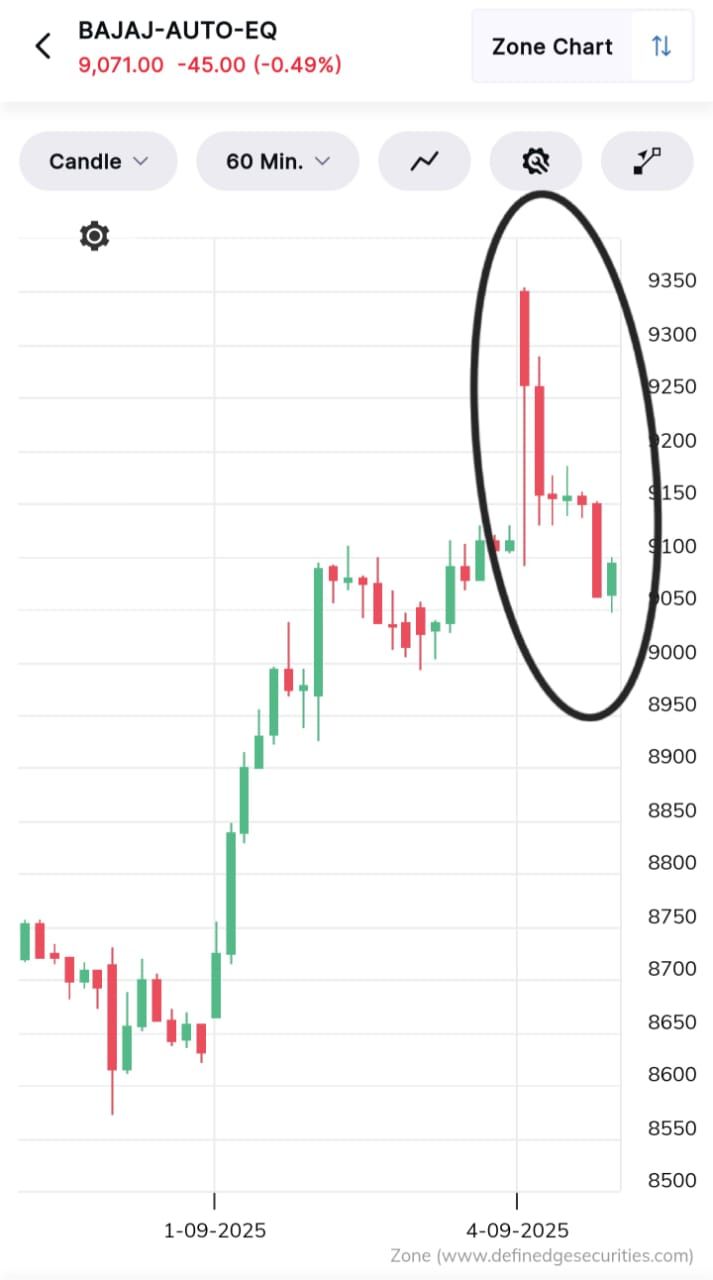
• Bajaj Auto declined nearly 3% from the top levels.
• Tata Motors also gave up about 3% after the announcement.
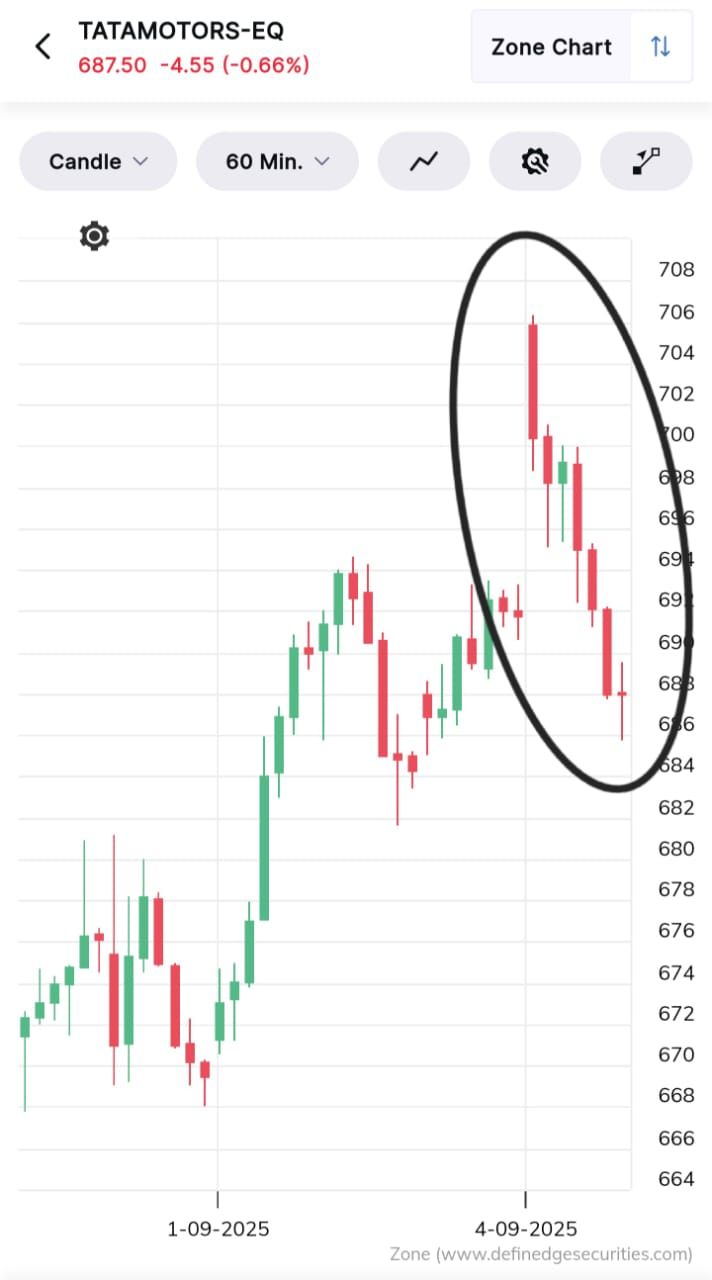
This reaction highlights how expectations are often priced in well before the official confirmation.
Why Do Stocks Fall After Positive News?
- Expectations Already Priced In:
Traders often position themselves weeks before the news. By the time the announcement is made, valuations already reflect the optimism.
- Profit Booking by Early Buyers:
Institutions and early entrants use the event as an opportunity to book profits, triggering a wave of selling.
- Reality vs. Expectations:
Sometimes the actual announcement, while positive, may not fully match the exaggerated expectations built up during speculation.
Key Lessons for Indian Stock Market Traders
- Follow the Price Action, Not Just News:
News creates sentiment, but price charts reveal where smart money is moving.
- Anticipate Market Behavior:
If a stock rallies significantly ahead of an event, be prepared for profit booking once the news is out.
- Don’t Chase the Highs:
Buying after a sharp rally on expectations can trap retail traders if profit booking sets in.
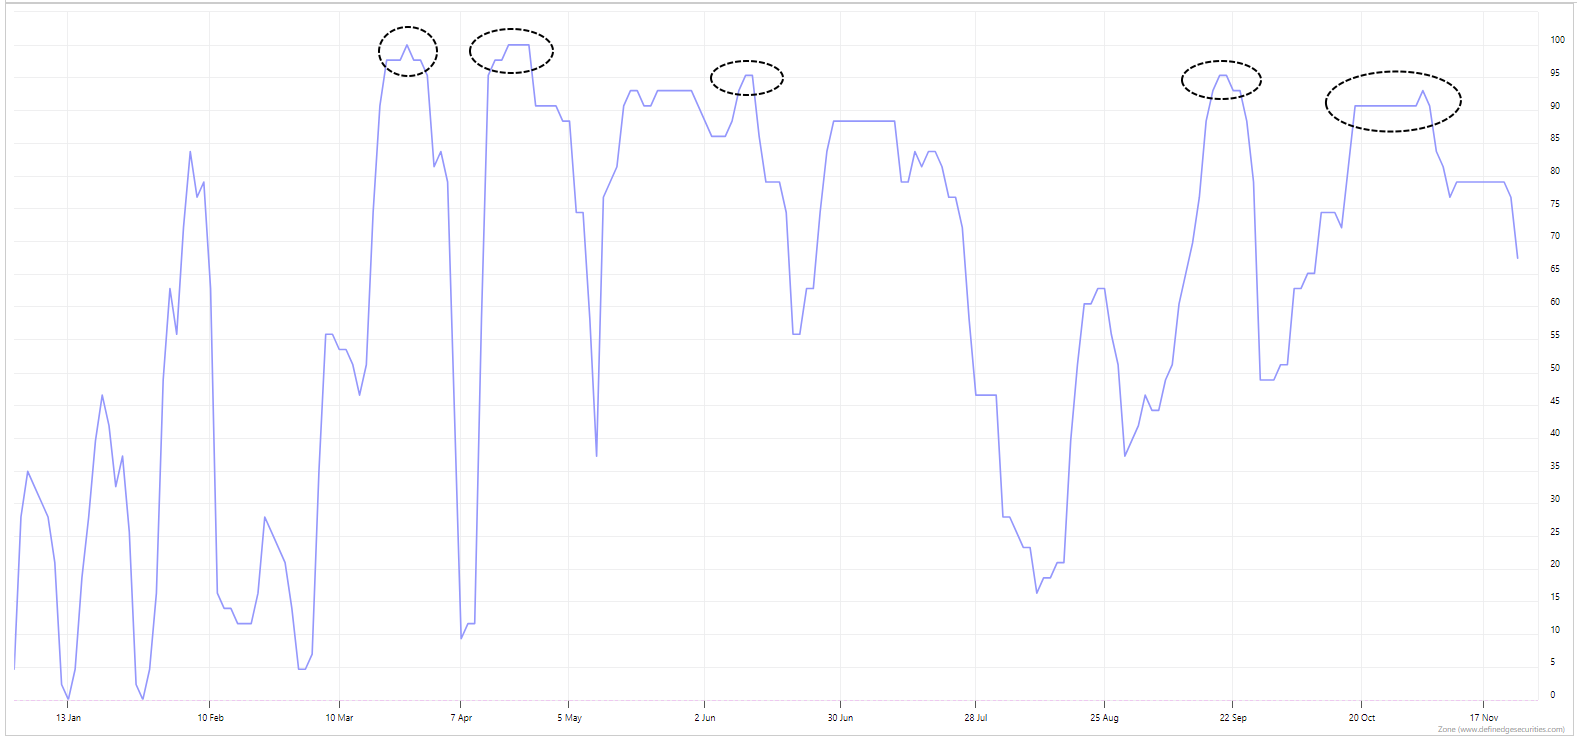
Here is the Maruti Heikin Ashi Chart to understand these key lessons:
 y
y
")