They are available.
Brijesh Bhatia
Pro User
All Replies
-
-
You can connect with our Customer Support on 020-61923200
-
Sir so far we are allowing only 10....we will update if we increase the limit.
-
@Somu R WIP sir
-
@Akash The Multi-Time Frame features are under process.
-
@Sanjay Auti No issues sir.
-
We don't have that feature yet.
-
Your feedback is appreciated and forwarded to the team. Let us check the feasibility.
-
On the MyAccount Dashboard, go to Request Menu 》 Buy Back 》 Add Wipro and Qty you hold 》 Submit
-
Thanks.
-
It is not an error sir. They are traded in Futures.
-
Can you please DM the UCC so that we can arrange a call.
-
Thanks Vivek for appreciating the product.
Let us check regarding 3:15pm time slot. -
You can initially add the portfolio and from the following Rebalance day, the Momentify will trade accordingly.
-
You can track here
-
@Somu R BSE in Algostra will be Live soon.
Scanner I will make it Public as Trend Ribbon.
-
You cannot modify the alert.
-
To learn Harmonic Patterns, Click here
-
@Naresh Kanani Sir can you DM the UCC...will tell the team to connect with you.
-
@Manigopal Vutla can you plz DM the client code.
-
Ramesh-LM-1701514567093, please attempt this now. We have removed the waiting period.
-
Dear Momentify Investor,
We would like to inform you about the recently completed demerger of Vedanta Limited (VEDL) and its impact on your portfolio.
The record date was May 1, 2026, but since May 1 was a market holiday, the stock traded ex-spin-off on April 30, 2026. Vedanta opened at ₹289.50 on April 30, reflecting a ~63% drop from the previous close of ₹773.60. This drop was due to the subtraction of the demerged businesses' value from the stock price.
For every 1 share of Vedanta Ltd held, you will receive:
• 1 share in Vedanta Aluminium
• 1 share in Vedanta Oil & Gas
• 1 share in Vedanta Power
• 1 share in Vedanta Iron & Steel
So, if you hold 100 shares of Vedanta, you will receive 100 shares in each of the 4 new companies.
If Vedanta is part of your Momentify portfolio, here is how it will be handled.
Post demerger:
• The price of Vedanta Ltd will reduce (as value gets distributed across the new entities).
• You will receive additional shares in the demerged companies. These may take some time to reflect in your account. Based on company announcements, they are expected to list by mid-June 2026.
How we are handling this in Momentify
To ensure continuity and avoid any disruption in your strategy:
• We will adjust your entry price proportionately in the backend, using the ratio of the post-ex open to the pre-ex close. This ensures no impact on rebalancing and no unintended trigger of stop-loss or exit conditions.
• The value corresponding to the demerged entities will be adjusted from your current holding value in Vedanta Ltd.
• You will receive the additional shares separately, as per the demerger process.This will reduce your Momentify investment value up to the value of the demerged entities. We believe this is the most appropriate approach to accurately reflect the demerger in your portfolio
If you prefer a different approach, you can manually update the price in Momentify as per your preference.
We hope this clarifies the process. No action is required from your end for this adjustment.
Please feel free to reach out in case of any questions or clarifications. -
Why don't you try volume scanner, which highlights demand and supply.
https://www.definedgesecurities.com/definedge_blog/education/selecting-emerging-sectors-based-on-volumes/ -
@Akash Will add it
-
@Kameeshm Rao We will arrange a call for you.
-
Feedback appreciated. We will forward your request to concern team.
-
Feedback appreciated. We will analyse and check it.
-
They are available sir. Image attached:
-
@Akash Sir, can you clear the cookie or check in a different browser? None of the other clients have complained about this yet.
-
@Jaspreet Singh You can connect with the support team or DM the client code. We will connect with you on Wednesday.
-
@AshokKumar B L Yes. Perfect Shark.
-
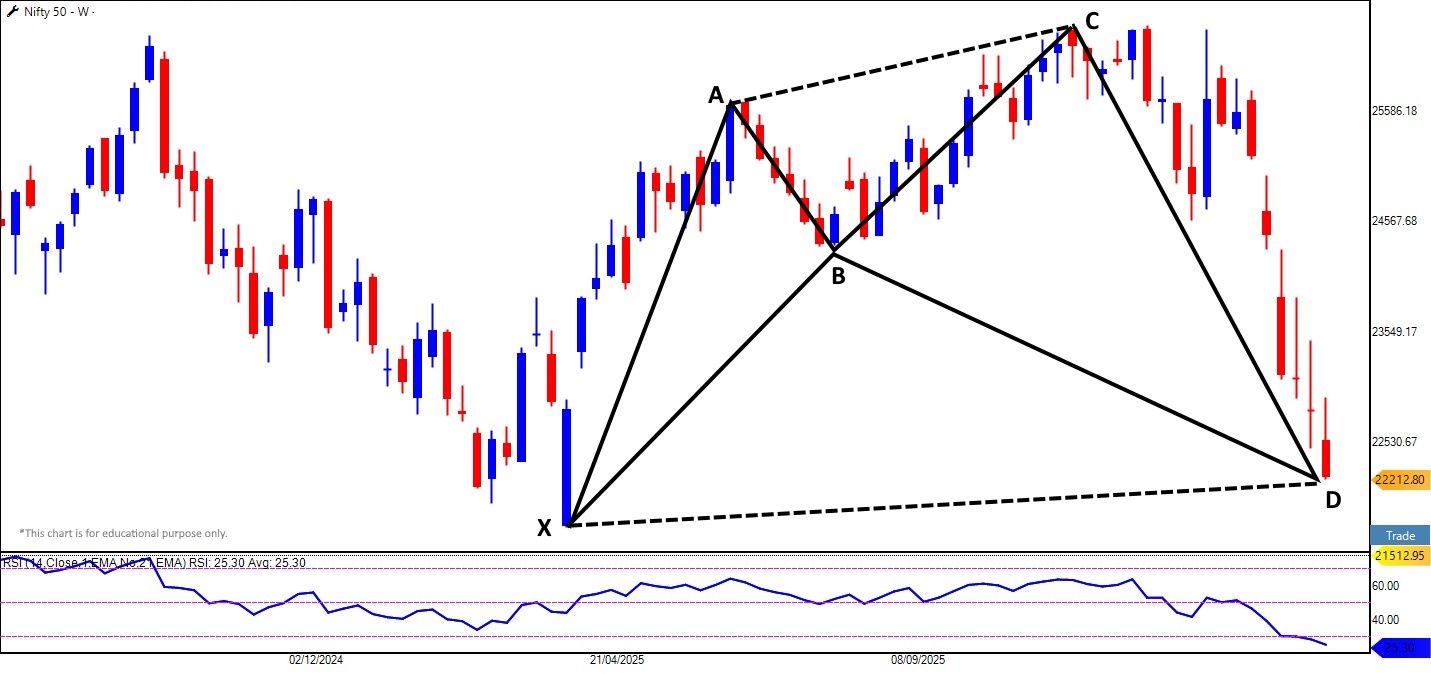
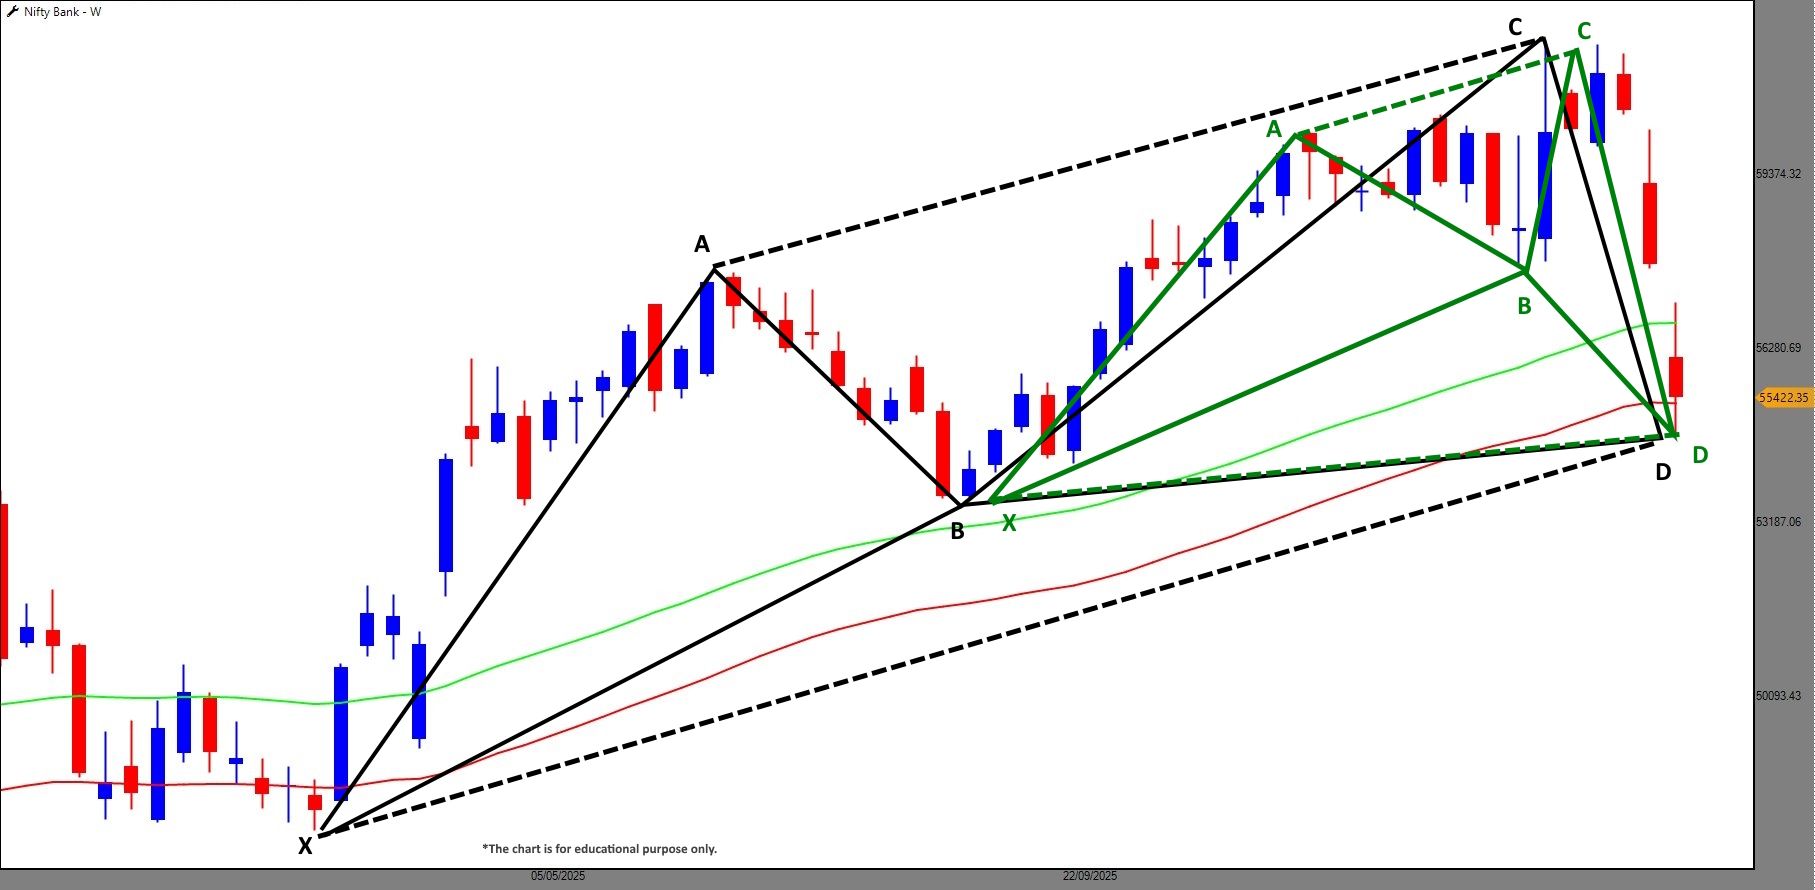
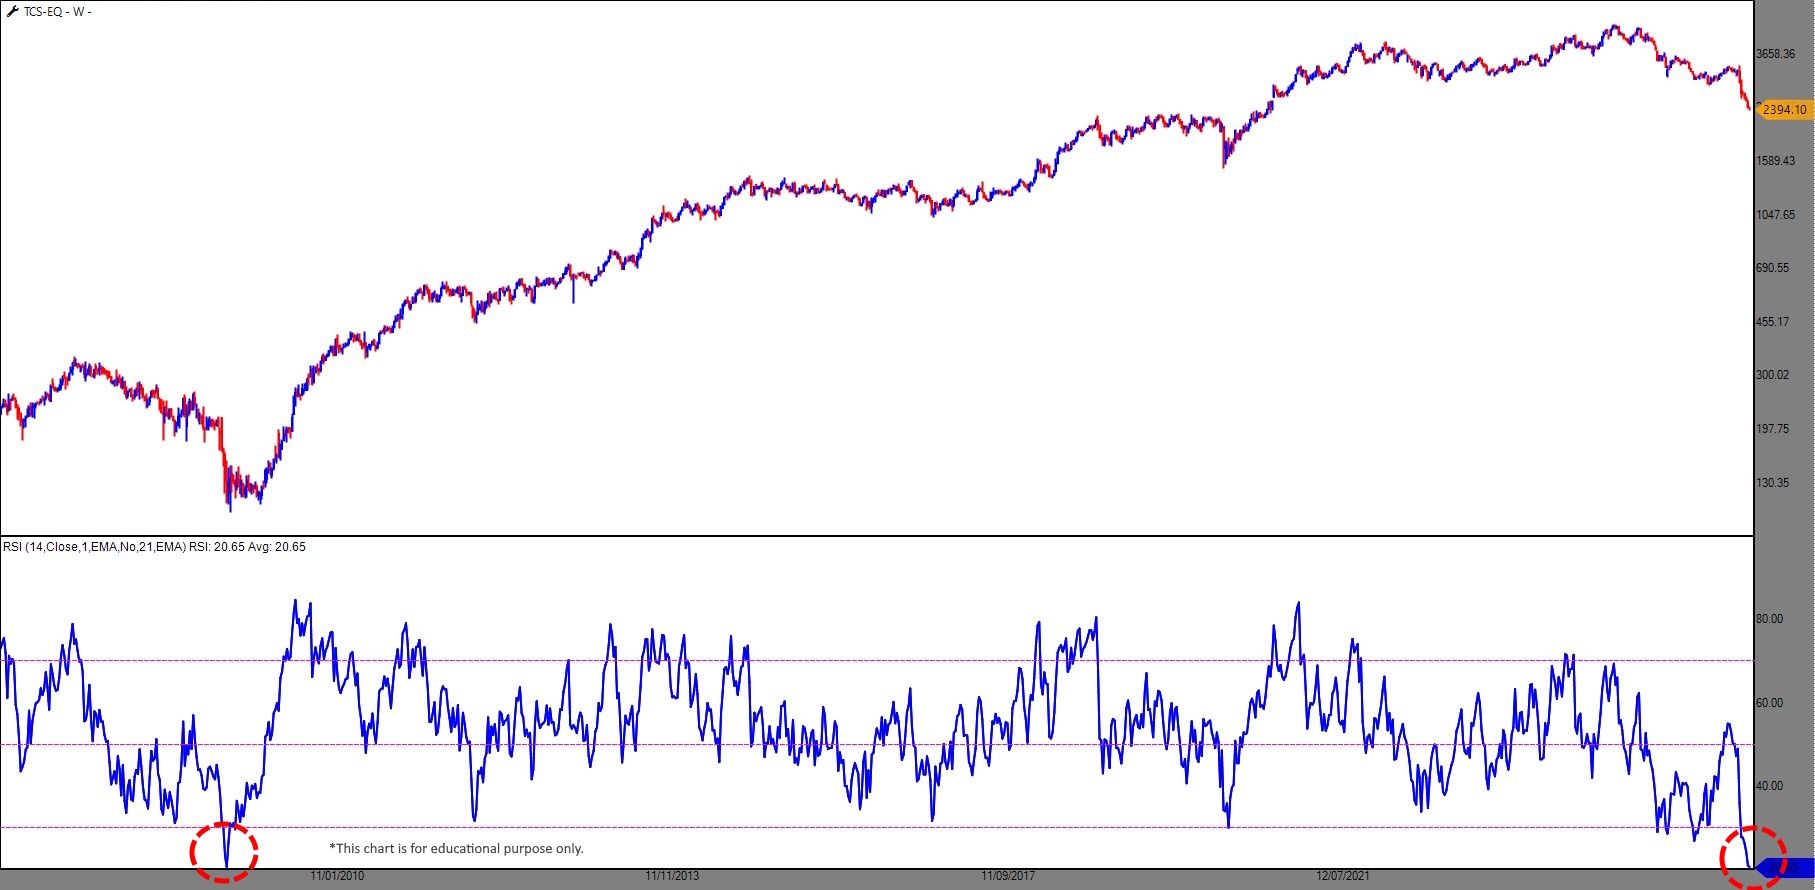
The Nifty weekly chart is currently hinting at a potential reversal zone through a Bullish Shark harmonic pattern, where point D marks a potential reversal zone of 22,137-22,200.
Adding weight to this setup, the RSI has plunged to 25, its lowest level since 2020, indicating deeply oversold conditions. Such extremes historically precede relief rallies.
The pattern negates on the break of low at X.
-
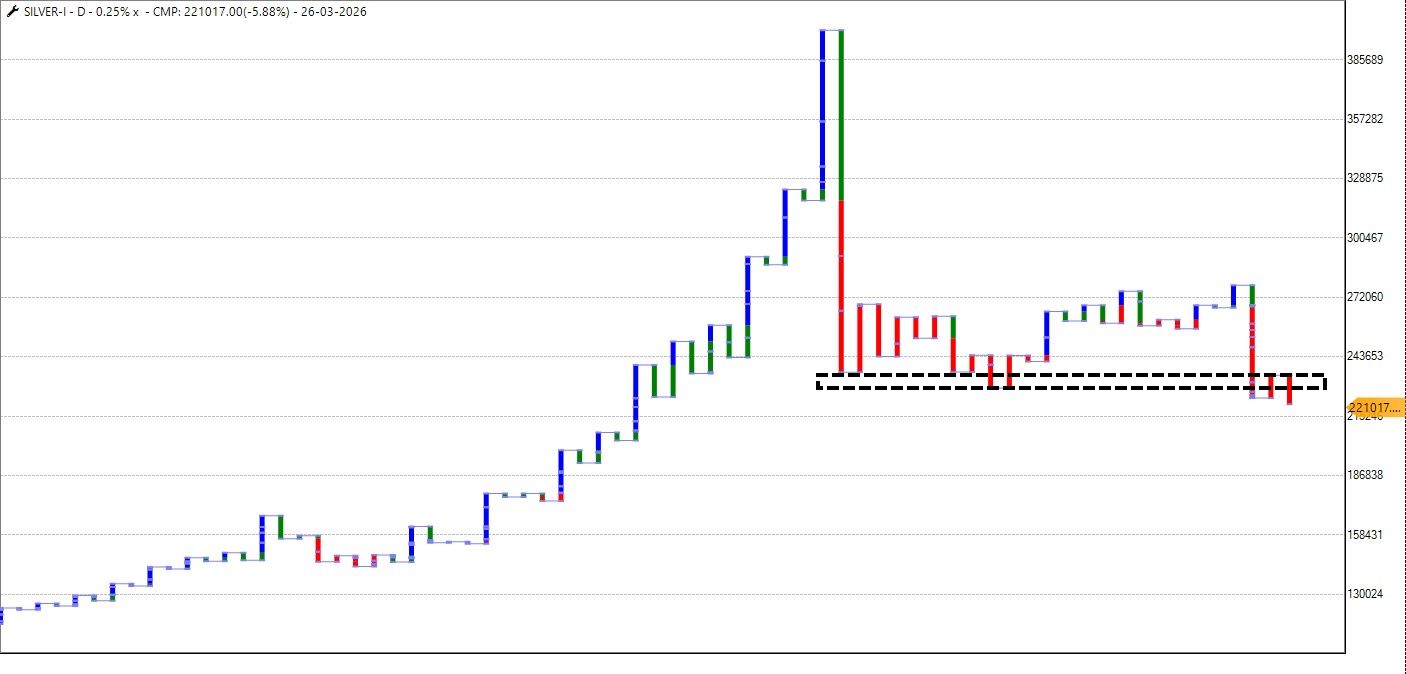
The Shoulder Breakout at Rs.2,35,000 negates the current structure.
-
@Vinubhai Patel Sir can you share the screenshot or timing when you faced the issue.....will check with team.
-
Close are always convincing sir.
-
@Shirish Shah That's where an objective investing turns to subjective investing

Stick to the rules sir.
-
Sir, it seems you are using the Free version of TradePoint.
-
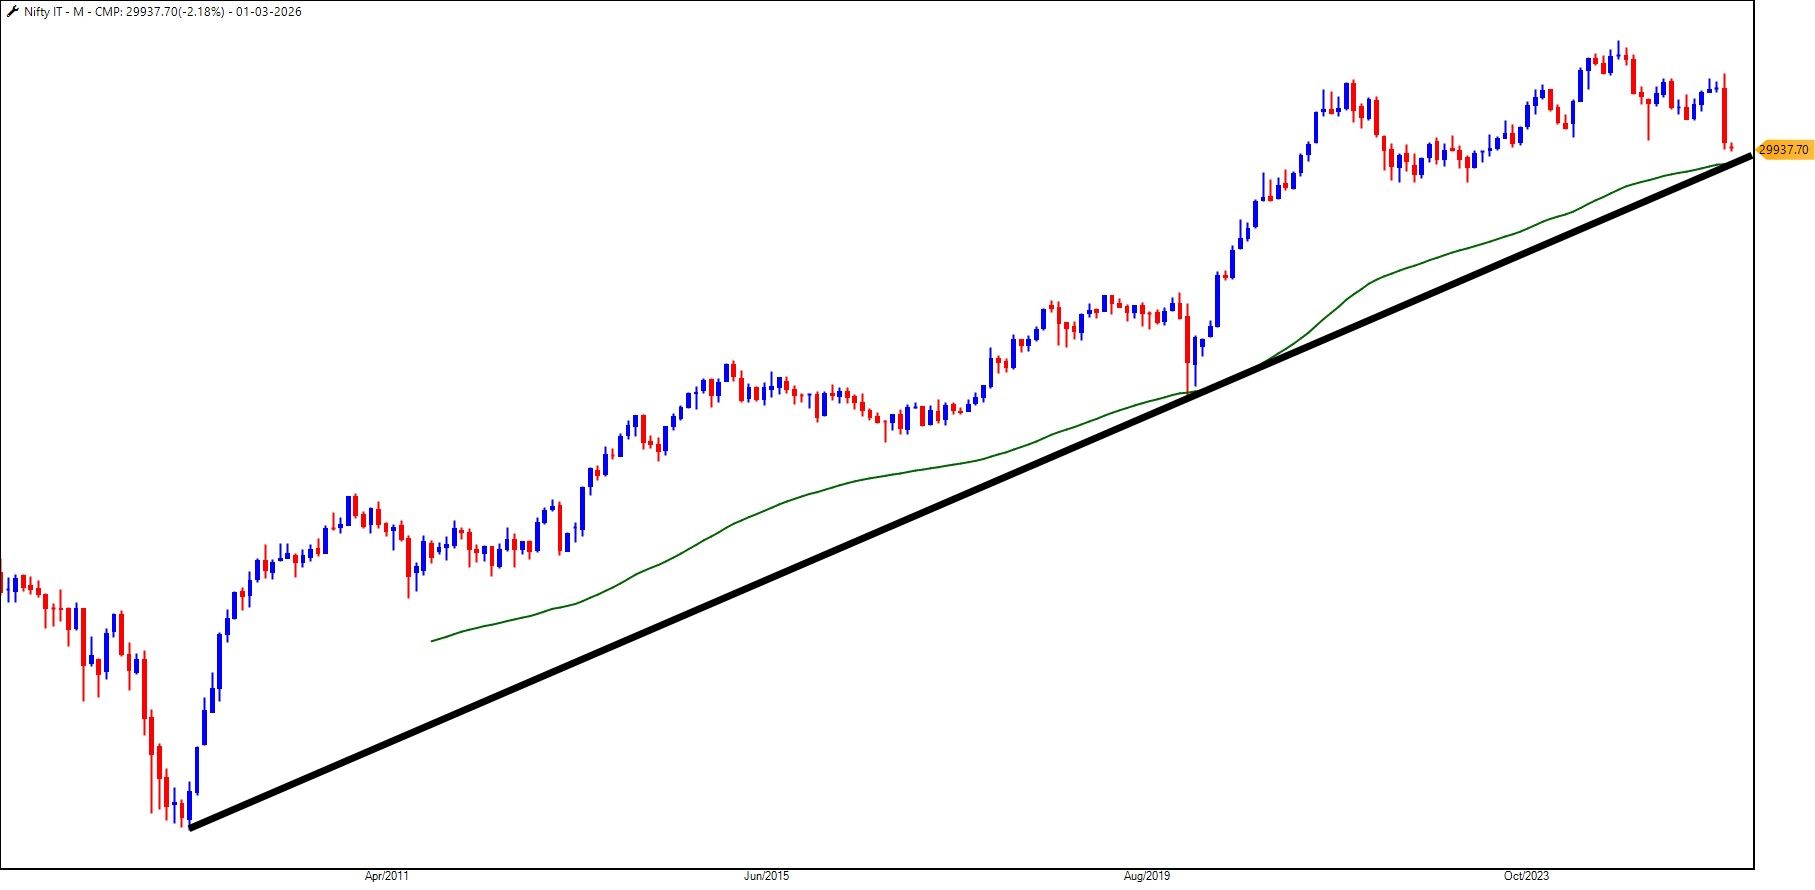
The multiple Harmonic patterns at the support of 62 Weekly Moving Average Channel signals a probable reversal.
Learn more about Harmonic Pattern here
-
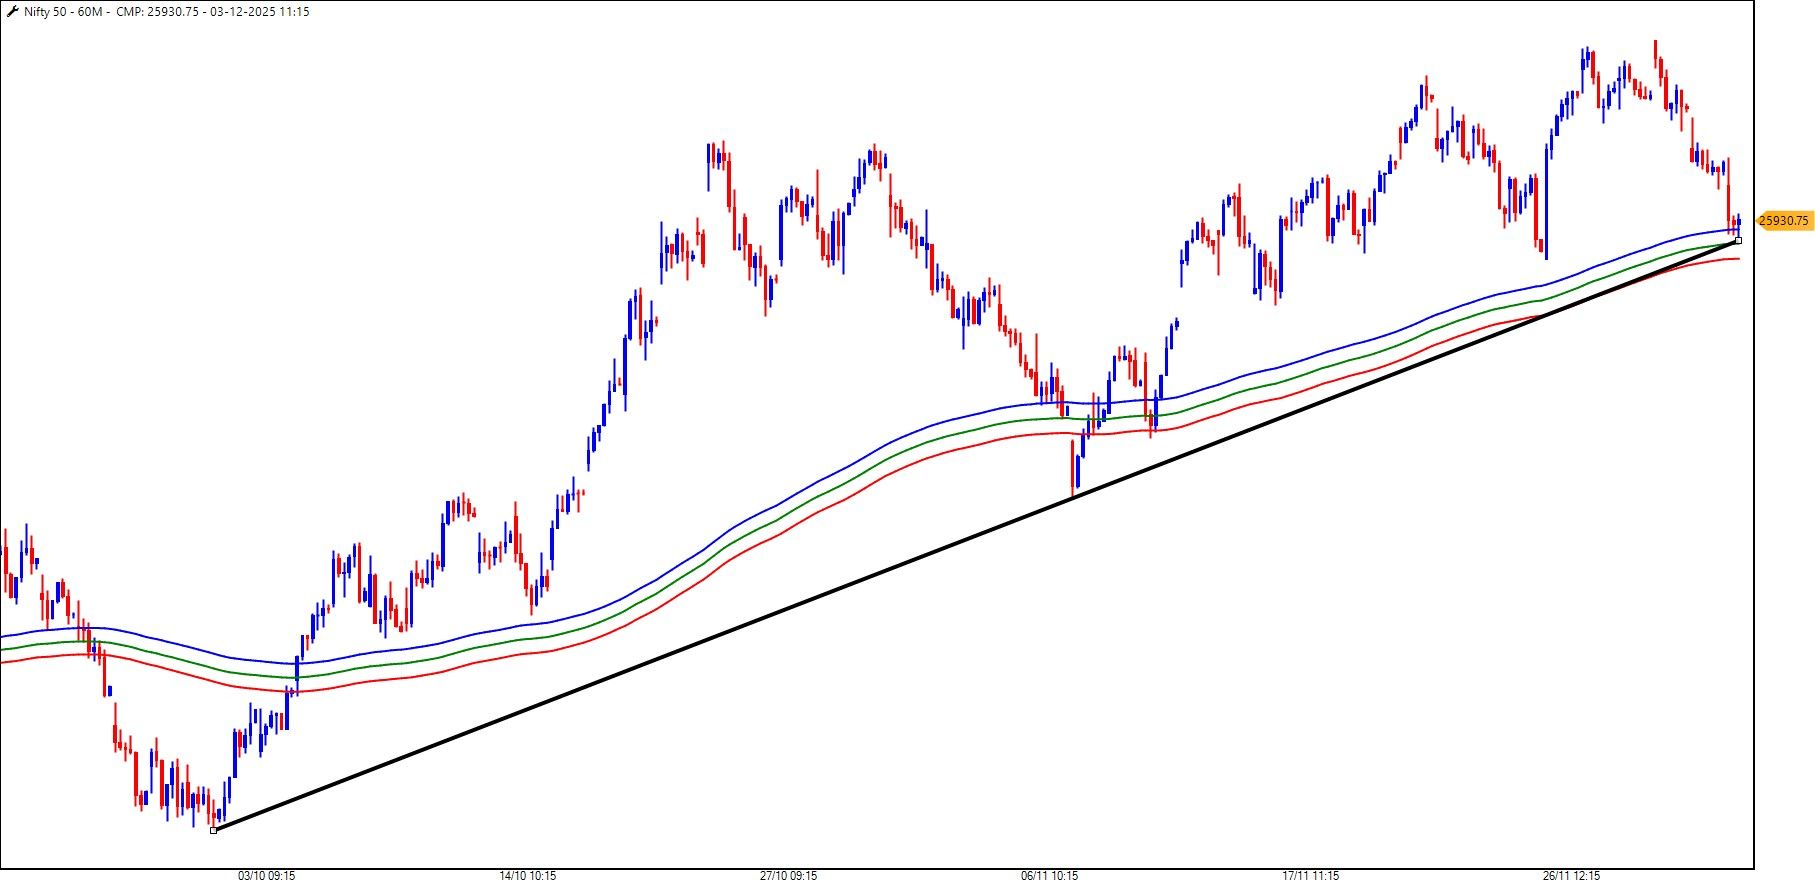
- 17 years Rising Trendline
- 100MEMA
-
@Guru Kumar We have forwarded the query to our tech team. Please allow us some time to resolve.
-
@Santosh C Will update regarding the same.
-
@Akash Feedback appreciated. Will convey it to the team.
-
The charts reveal a textbook case of institutional distribution in TataMotors and M&M.
In #TataMotors, the 2024-2025 period saw a classic Bearish Rising Wedge formation. As the wedge tightened at the ₹620–₹700 range (demerger adjusted), we witnessed a final Blow-off Top (Fakeout), a move designed to trap breakout buyers before a sharp Rejection confirmed the trend reversal.
The result? A massive ~50% correction from the highs.History Repeating in #M&M?
We are now seeing a remarkably similar structure unfolding in #M&M. The price action is mimicking the same exhaustion signals that preceded the Tata Motors crash:1.The Bearish Wedge: Narrowing price action indicating diminishing buying momentum.
2. The Fakeout: A spike above resistance to hunt liquidity.
3.The Rejection: A swift move back into the wedge, signaling that the "Smart Money" is exiting.If #M&M follows the result of #TataMotors, we know the answer now.

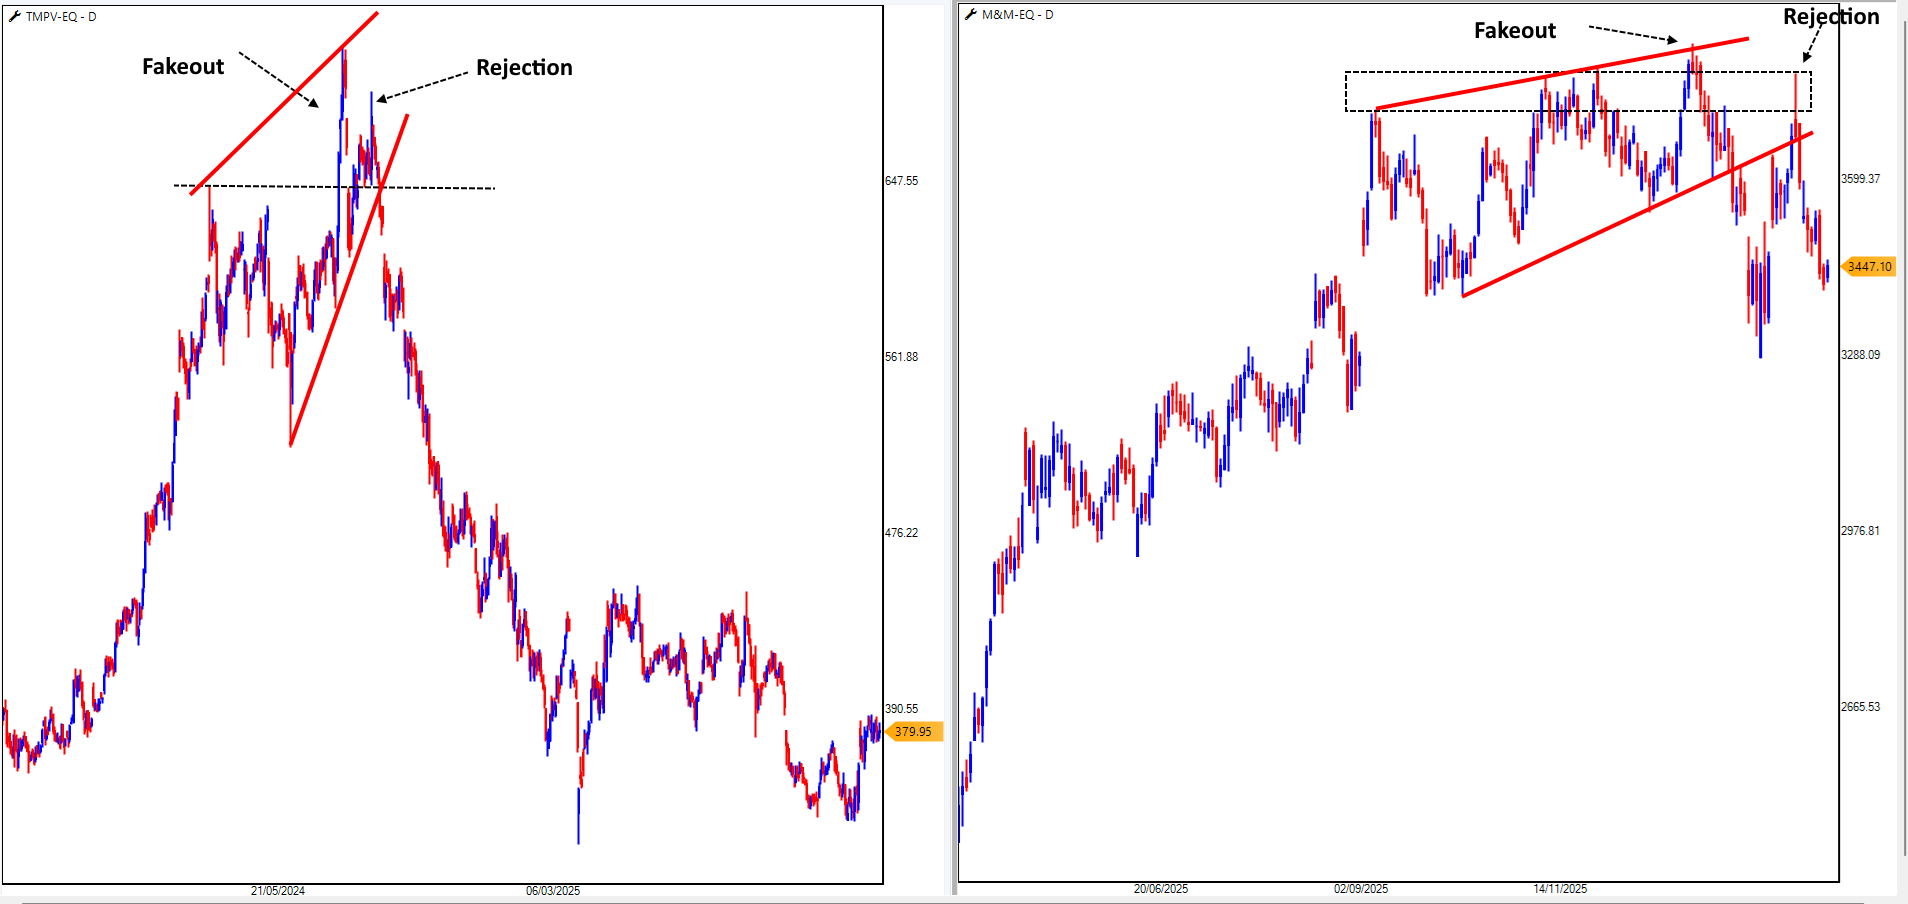
#KeepItSimple
-
@Vinubhai Patel Dear Sir,
We would like to inform you that our systems undergo daily trade and position updates early each morning following the late-night receipt of trade files from the Exchange.Because of ongoing OMS server processing, you might notice some data inconsistencies between 6:00 AM and 7:30 AM. We recommend checking your account after this period for the most accurate information.
-
You can use the CUTTING AVERAGE for the strategy.
-
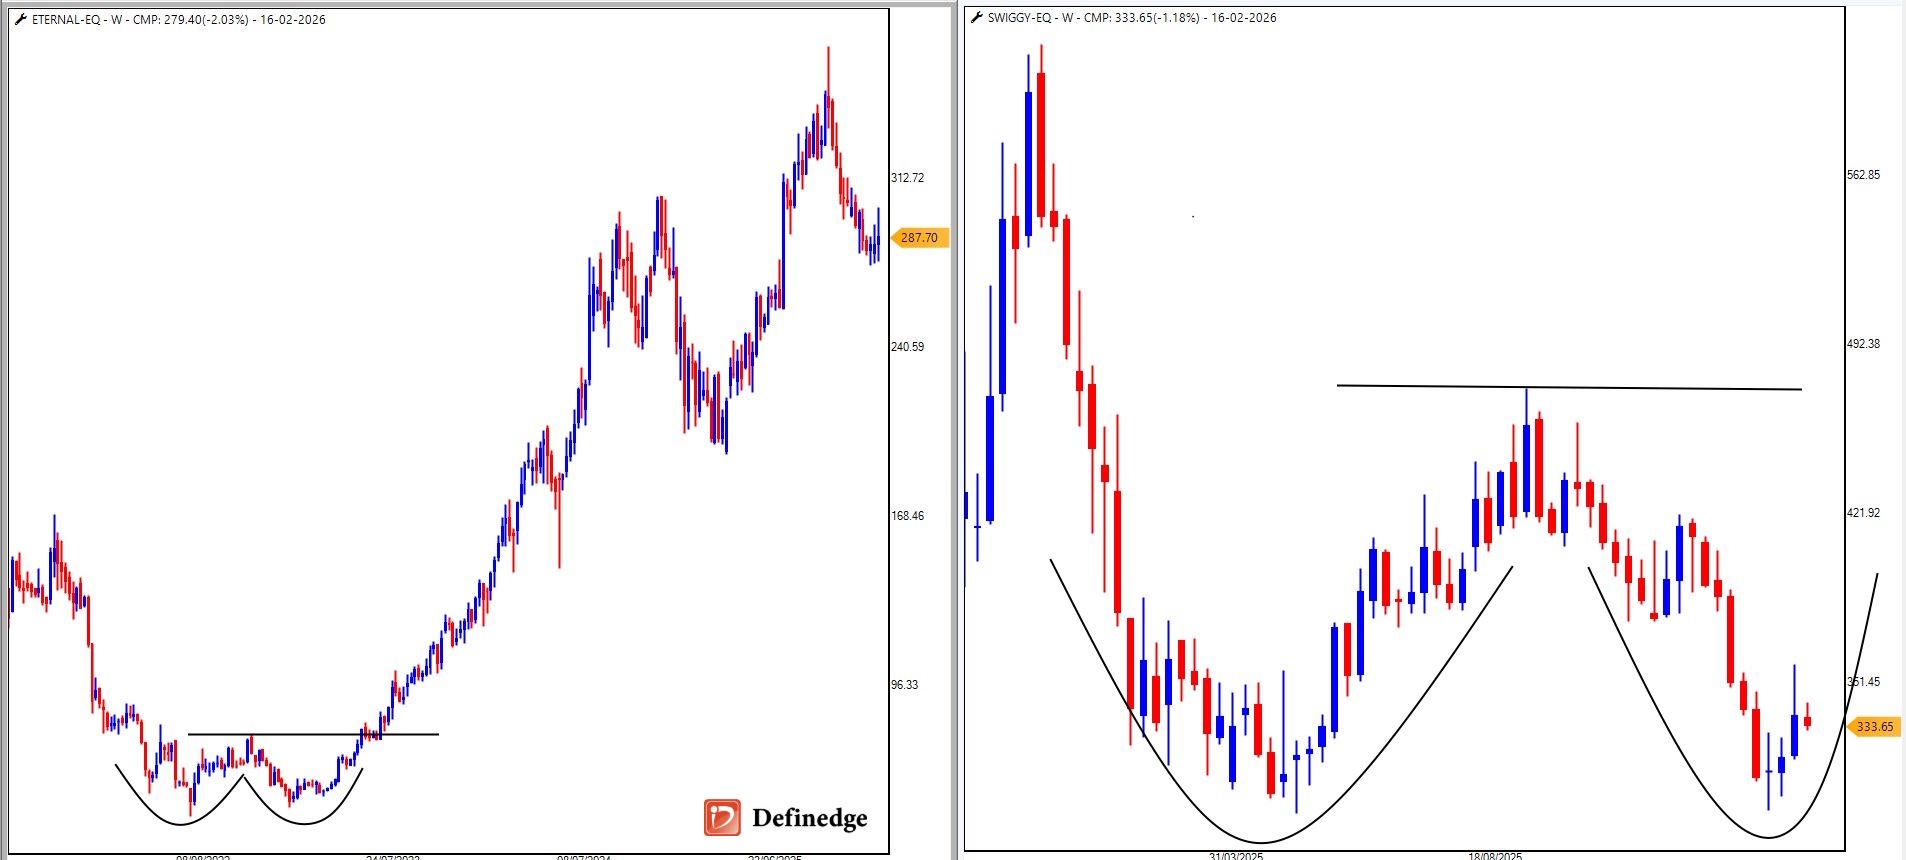
If you missed the Zomato rally after its 2023 double bottom, you might want to keep your eyes on the Swiggy chart right now.
-
Right Click on the TradePoint icon and go to the Path. You will find the MyMkt folder. PLace the excel file there.
Open the chart and select MyMkt and you will find the stock data.
In case you don't find, you can connect with our customer care.
-
@Atul-Bansal Sir it is incorrect. You have to filter the stocks that are trading within the 10% of the range of 52-Week High for Longs and 52-Week Low for shorts.
As I can see, you are backtesting IRCTC for Long which is at 52W Low.
-
Currently we don't have that feature. We appreciate your feedback and let us analyse the feasibility.
-
As per SEBI rules, 2-Factor Authentication (2FA) is mandatory for logging into trading and demat accounts. A PIN alone is considered a single-factor authentication and is therefore not permitted.
Biometric login is allowed as it works along with device-level security and registered credentials, fulfilling the 2FA requirement. For devices that do not support biometrics, login via password/OTP is provided to ensure compliance and account safety. -
@Atul-Bansal @Paresh-Topiwala The scanner is available in the RZone. Check the image below.
-
@Somu R We appreciate your feedback and have communicated it to the team. Let us check the feasibility before we assure.
-
@Guru-Kumar We have upgraded our servers on the weekend and that may be the reason you are experiencing the issue on weekends. We always believe in offering the best experience and would request you to check it for a week or so. If the problem persists, you can get in touch with us.
-
@Ashok Prasun Sir, are you talking about the Laidback strategy?
-
@Aadil Shaikh Yes sir.
-
The US-India trade deal reshapes market sentiment, boosts foreign inflows, and opens opportunities across exports, technology, manufacturing, and defence, guiding traders and investors on short, medium, and long-term positioning.
-
@Vandana Joshi Can you plz DM your client code. Our team will connect with you over a call.
-
@Abhi Trader Can you plz DM the client code. Our team will connect with you.
-
@Abhi-Trader We appreciate the post from you. Can you post the period (Start and End date) for the actual backtesting? It will be easy for our team to check.
@Abhi-Trader @Manigopal-Vutla @Vandana-Joshi Please note that the backtesting considers closing prices, but we always recommend to entry at the 3:15pm for the entry day, as they are close to the day's price (as 15mins average are near to the entry).
-
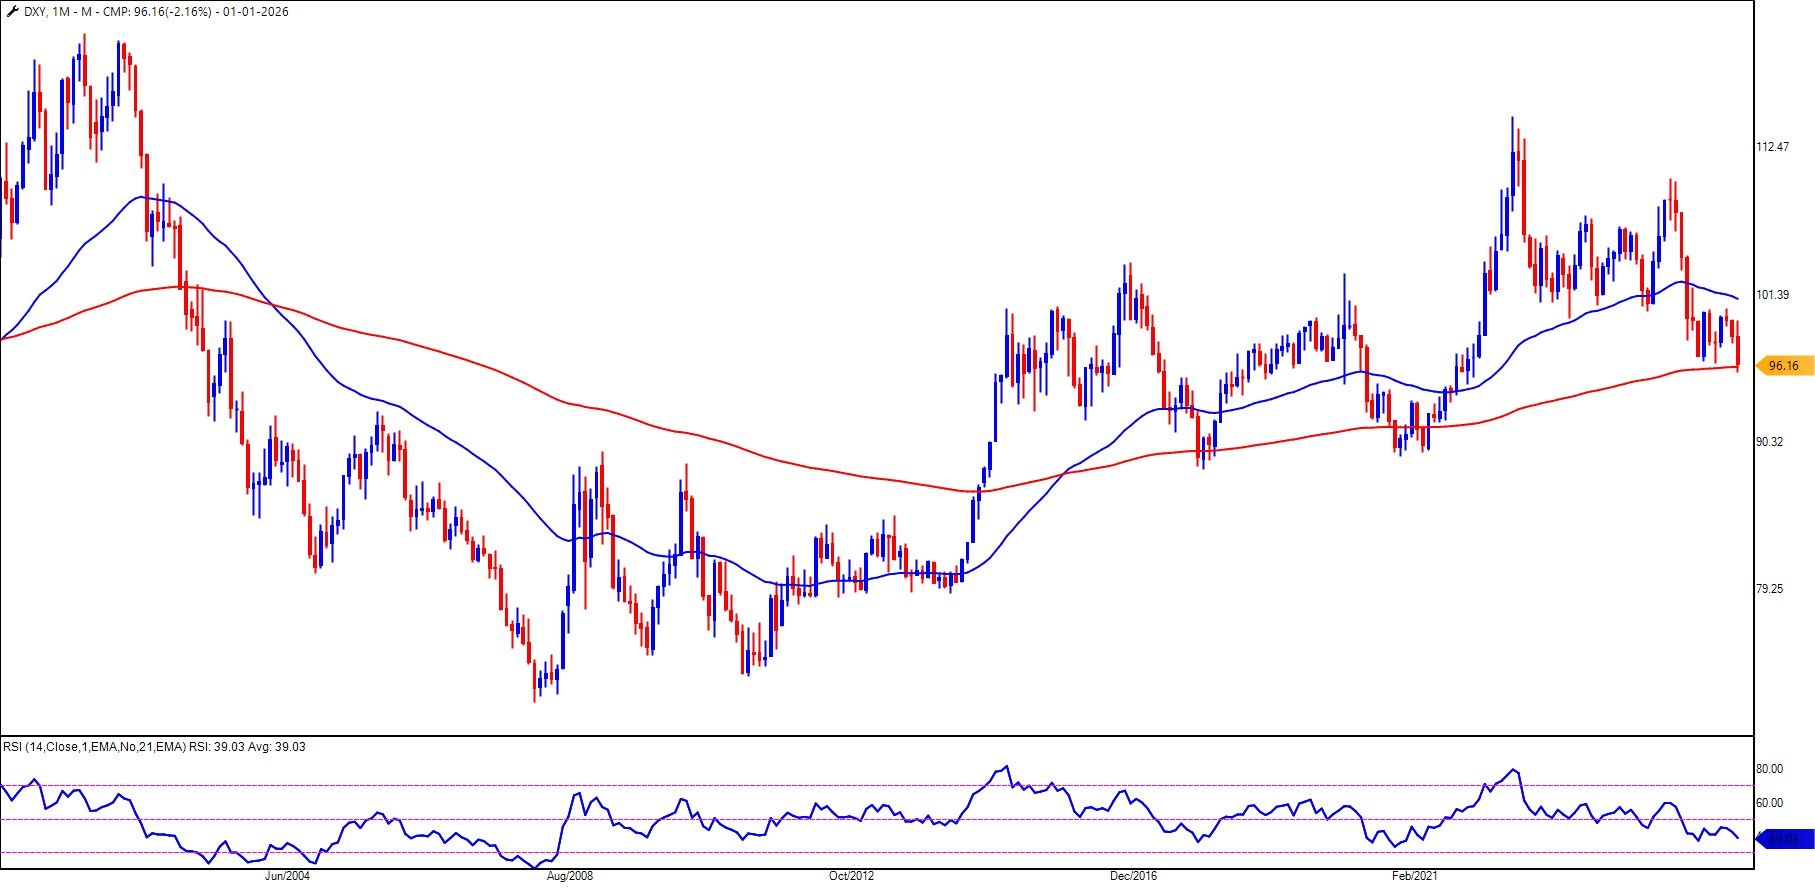
DXY is hovering at the long-term support area. The rising DXY will have a negative impact on Gold & Silver.
Join me at 7pm to discuss about the Commodity Trend. [Register here](https://i.definedge.in/gsbb30)
-
-
Regarding the exit strategy, how will the system decide which candle low?
-
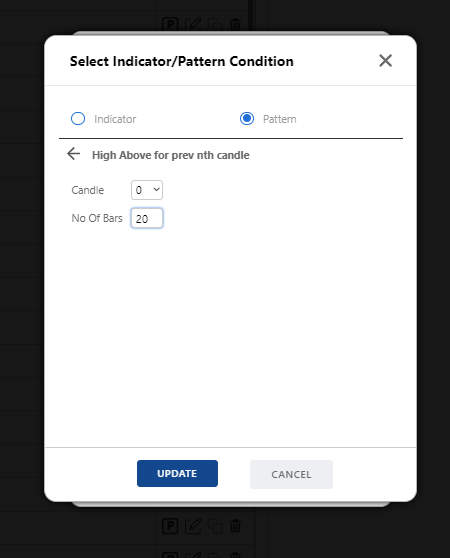
Regarding Super Trend turned Positive, there is a criterai in the system builder.
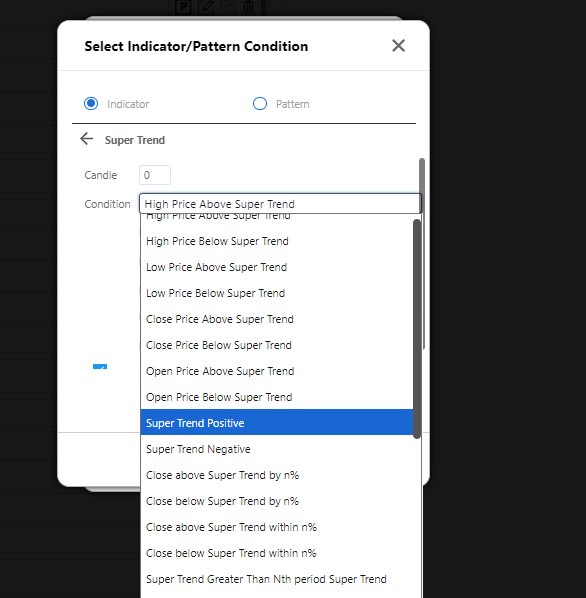
-
Add Super Trend turned Positive at 1 and add High above the Previous Bar from the system builder.
-
-
Can you please share the sample image.
-
Thank you for taking the time to share such detailed feedback on the issues and blockers. We truly appreciate the effort and clarity with which you have highlighted the challenges. Such inputs help us improve the platform experience for everyone.
At Definedge, providing the greatest experience and ensuring that issues are handled in an organised and efficient manner while preserving the system's stability and functionality are our top priorities.
-
@Vinubhai Patel You can create the scanner in the system builder.
-
You need to update the stocks group daily.
The scanner are perfect.
-
@Jatin Patel Following Monday of the Bullish Weekly Candle. If its daily, at the opening of the next day.
-
What traders need to accept now is that 45 out of 46 sectoral indices are in negative RSI territory. Let us keep the charts aside because if I post the chart, the reader may analyse as per his knowledge and concludes the view.
According to the most recent RSI levels on the daily Heikin Ashi chart of 46 sectoral indices, 45 sectors have an RSI structure that is lower than their RSI averages. Only one sector, PSU Banks, has a new RSI crossover that is positive. Take a moment to think about that.
Read article here: https://www.definedgesecurities.com/blog/education/not-a-crash-not-a-rally-just-a-warning/
-
@Prashant Jaiswal Yes, you are right.
You can watch this video if you have any doubts.
https://www.youtube.com/watch?v=2dzubtUxp9o -
@Hiral-Mehta-176456257495 Negative crossover on MACD above the Zero Line may indicate a pause to bullish momentum.
The follow-up can be a retracement or reversal, which will be confirmed as the price move unfolds. For bulls, this can be a profit-booking setup.
-
@Vinubhai Patel We appreciate your feedback. Let us check how we can implement it seamlessly.
-
@Prashant Jaiswal The Andrew Cardwell RSI Range Shift concept will be the same on the OHLC, P&F, Heikin Ashi, Renko or any other chart form.
The difference between the various charting methods will be in the RSI calculations, but the range shift theory based on the RSI levels will remain constant for all.
-
@Vinubhai Patel You can scan the Super Pattern or Anchor Column Follow Through pattern for the Flag and Pennant in the P&F scanner.
For Triangle, there is a Triangle scanner in P&F.
For Rectangle, you can scan Triple Top or Quadruple.
-
NSE has discontinued USDINR Futures, so you can't find the chart now.
-
@Smit K Thanks for highlighting. Our team is working on the changes, and soon we may release them in the next update.
-
@SANTOSH CHOUDHARI Plz allow us some weeks.
-
@Smit K Let us check with the team.
-
@Akash sure we will update it.
-
@Anuj Mehta Request you to watch this video for create system using System Builder
-
@SANTOSH CHOUDHARI Let me check Santoshji.
I work from Mumbai office
")
-
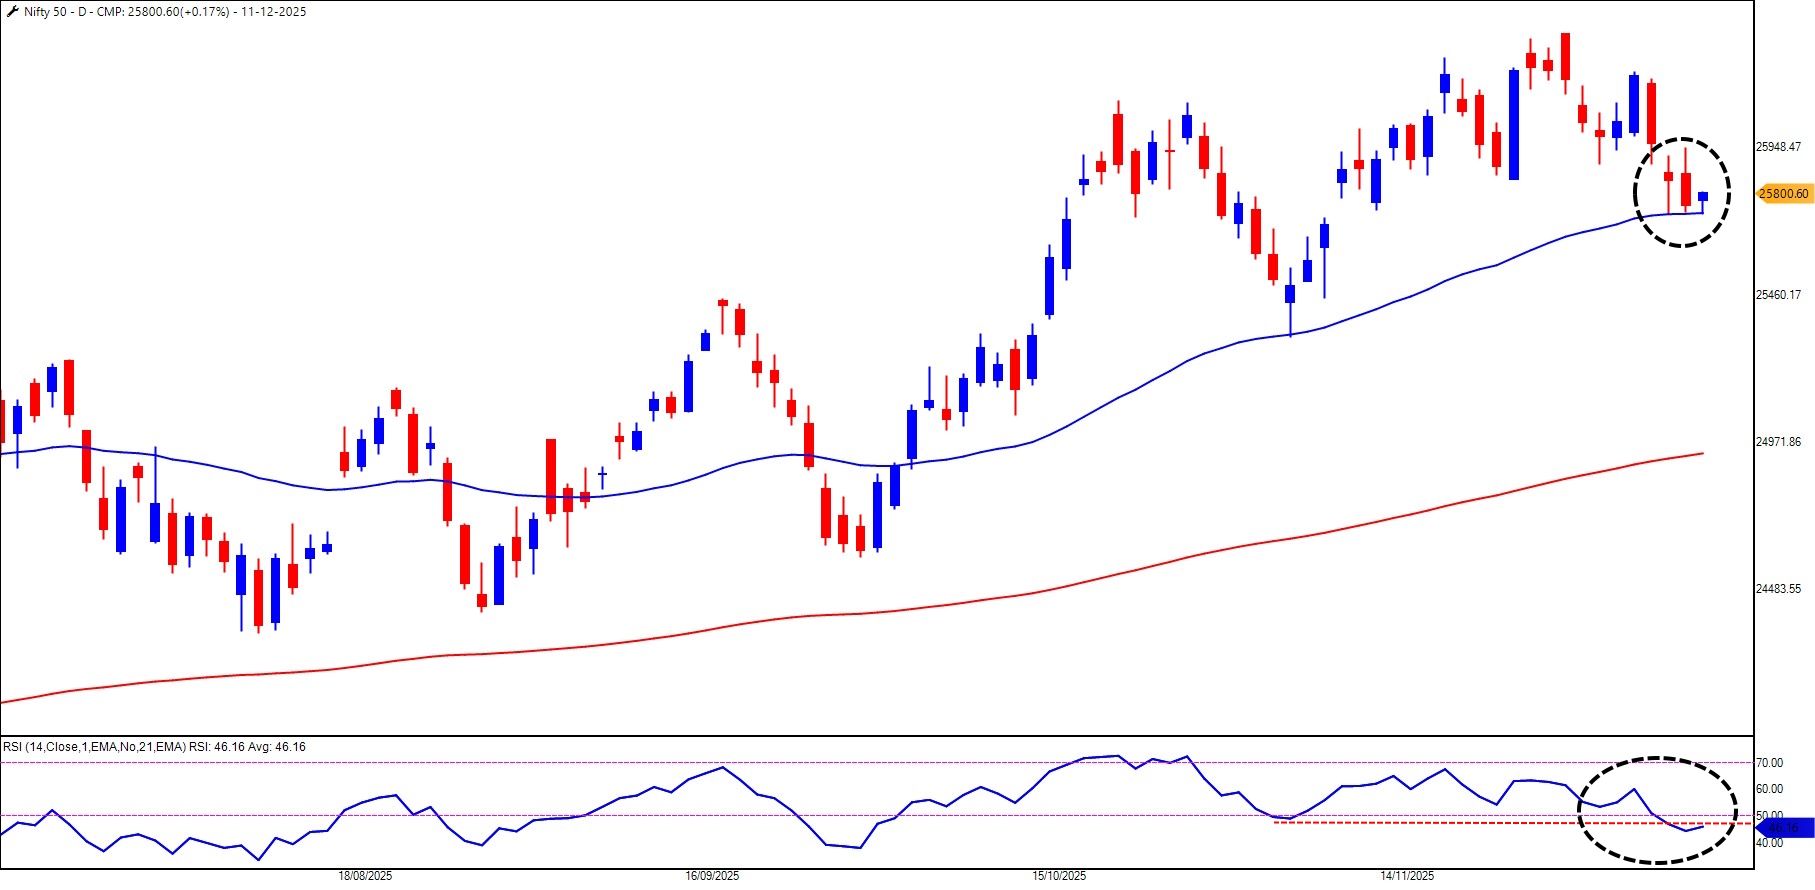
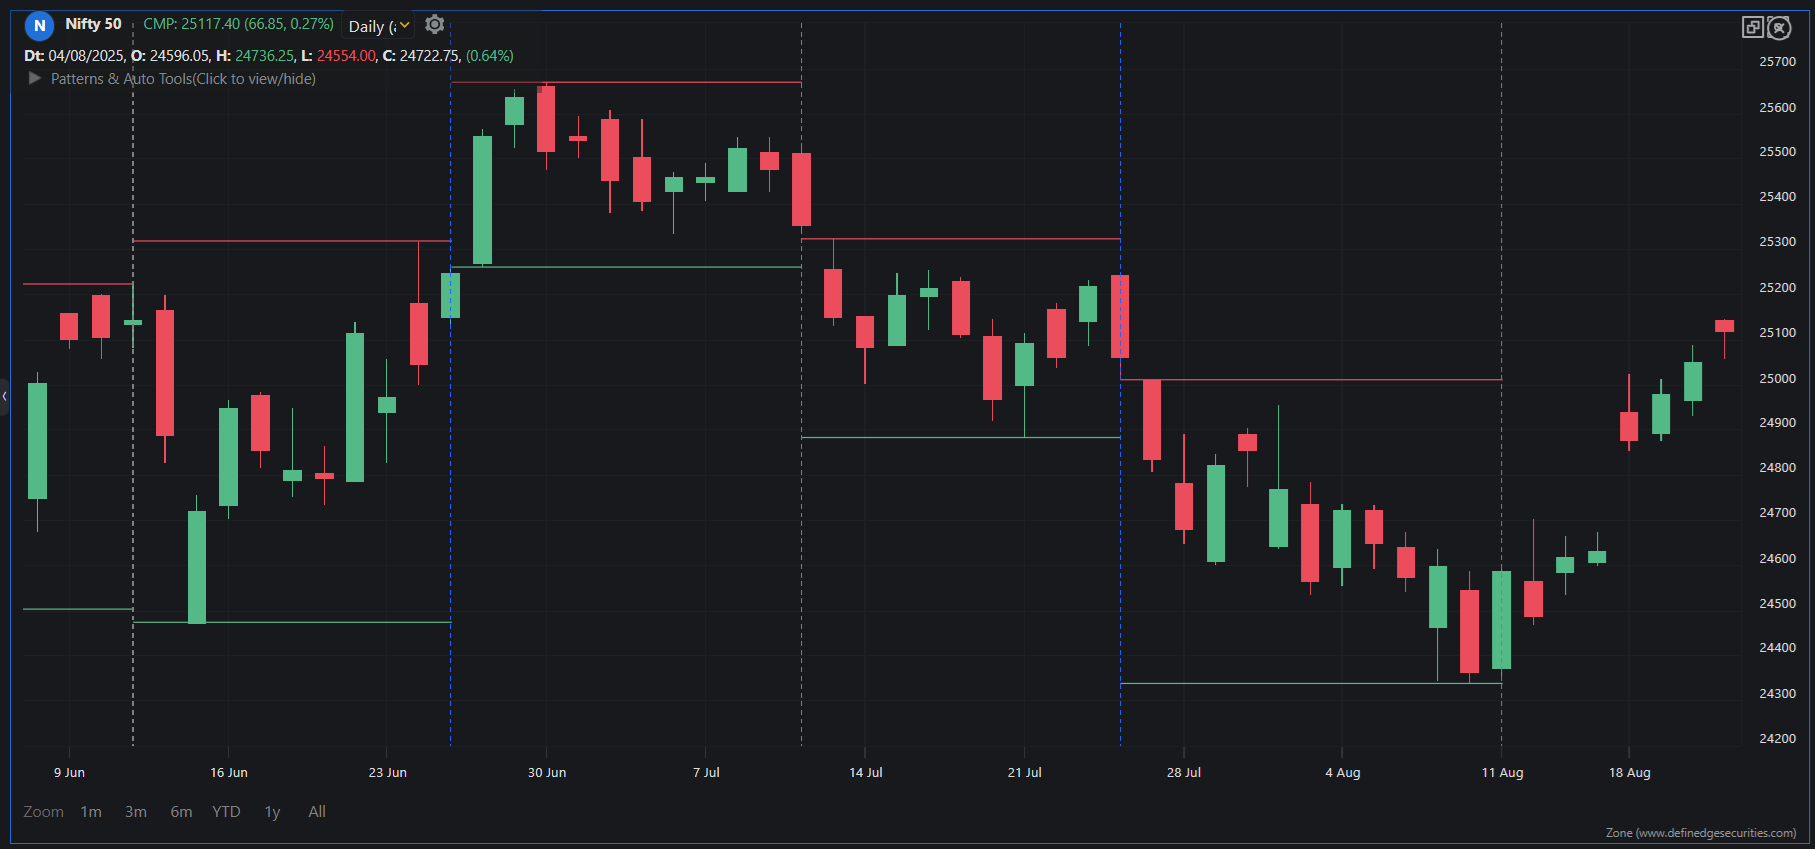
The Nifty is managing to hold on to the higher levels, but the broader market is clearly feeling the heat from the bears.
The 50-day Exponential Moving Average (DEMA) is acting as a crucial support zone, with the index hovering right around it.
However, the bigger worry for the bulls lies in the Bearish Range Shift on the RSI. Although some might argue for the Positive Reversal theory, but this theory would come in the picture if the price action convincingly reversed. As of now, that confirmation is still missing.
-
@SANTOSH CHOUDHARI Do you mean Stan Weinstein’s Stage Analysis?
-
@SANTOSH CHOUDHARI SIr, what is your basis for comparing the stocks with others using OHLC in the Dynamic Ultimate Matrix that will help you make the decision?
We need to understand whether that is workable in deciding a trade.
-
Rise with clarity as the Nifty Analysis feature on Definedge Zone blends setups, breadth, and pattern insights to illuminate the path for every trader.
https://www.definedgesecurities.com/blog/products/nifty-analysis-on-the-move-in-one-screen/
-
@Deepakk Chabria Uppar le jane mein mehnat karte hai sir
")
-
I have forwarded the issue to the concern team. Please allow us some time to check and revert.
-
You can start with the Basics of Candlestick and Point & Figure courses, practise them and then move to advanced-level courses on Gurukul.
Incase you have any doubts, you can ping me.
-
Sir you can select the strategy or pattern or indicators based on the charting method and scan the systems as per your requirement.
You can also check our YouTube videos based on Options by Abhijit Phatak and Raghunath Reddy.
-
Can you guyz explain the structure in detail and let me check.
-
Can you provide a detailed explanation of the conditions, @Akash?
You can also connect with our support team for the conditions.
-
Scan the Dynamic Ultimate Matrix to spot leaders, filter laggards, and compare stocks with their peers. A simple, humanised guide for Indian traders.
https://www.definedgesecurities.com/blog/education/when-data-learns-to-talk-dynamic-ultimate-matrix/
-
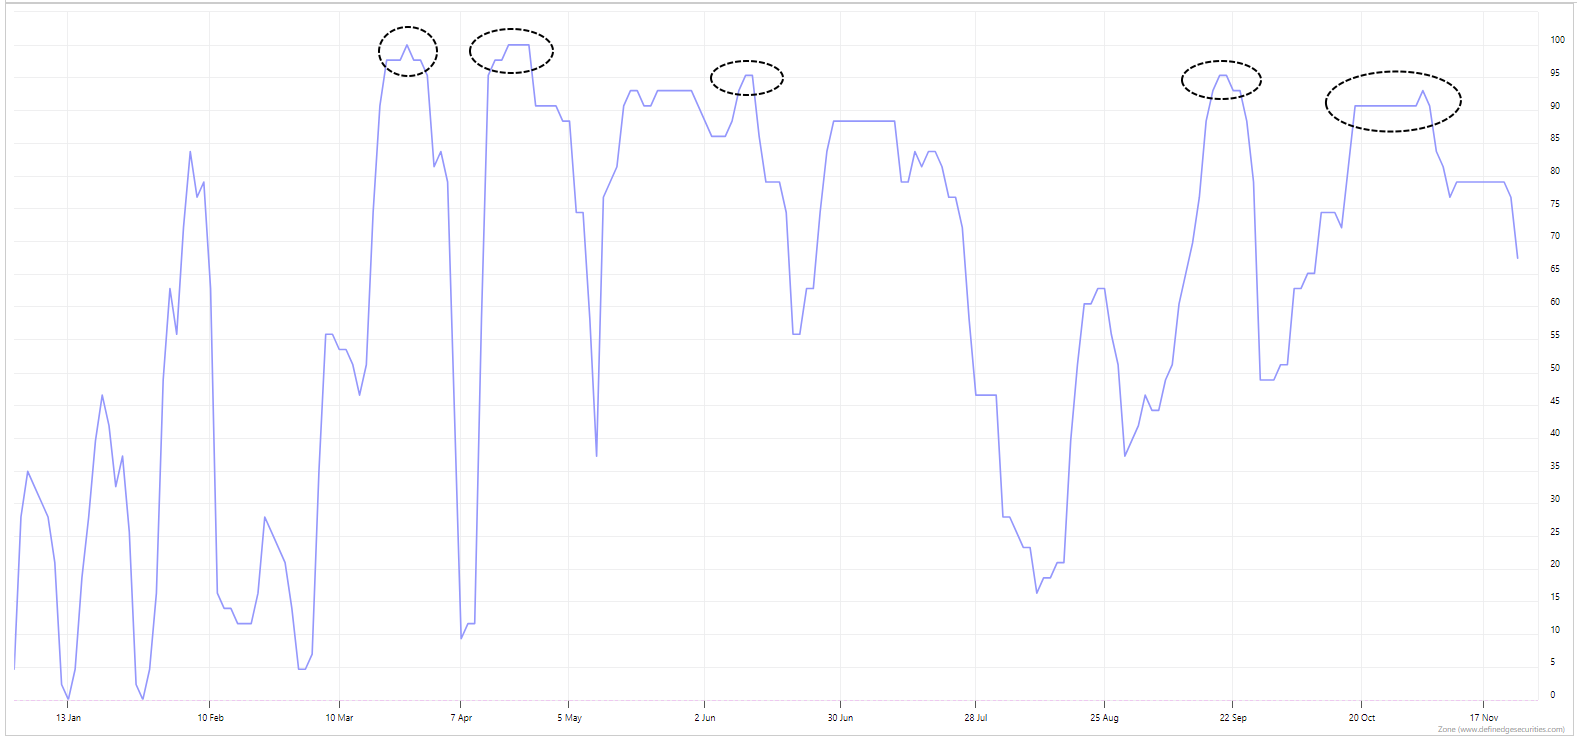
A concerning technical structure where the NSE All Sectors market breadth is consistently forming lower highs. This divergence suggests that despite the allure of recent prices near 52-week highs for Nifty50, the market may set a bull trap, enticing optimistic buyers into a rally that actually lacks broad-based participation.
As the slope of the breadth indicator heads south, it reveals a deterioration in the internal market strength. This weakening foundation is likely to excite the bears, as the fading momentum signals a shift in control that could precipitate a broader correction.
-
Sure. Our team will connect with you soon.
-
Feedback Appreciated!
-
Hi Sir, there are no discounts available right now. However, the courses are worth every penny because of the immense knowledge and value they offer.
-
@Akash
Count Retracement Breakout (CRB) tool is a new addition to the Point & Figure charting method. Often, a strong trend is difficult to trade with an affordable stop-loss. However, what if there were a tool that showed the retracement and breakout levels at the current trend levels.Biggest Anchor Levels are plotted on the chart for easy identification of Anchor Follow Through levels (Breakout Levels).
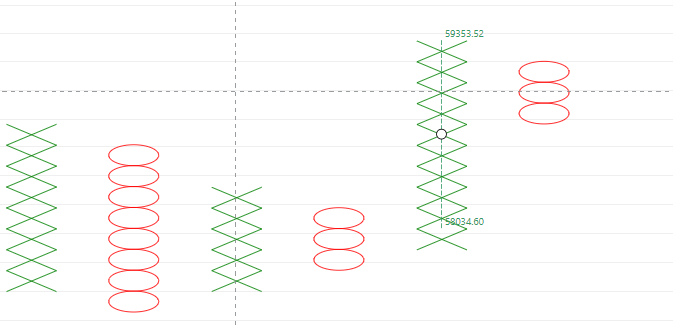
-
Scan Breakout across Candlestick, P&F, Renko, Line Break and Kagi charts at one place in BREAKOUT SCANNER. Spot bullish and bearish breakouts faster, trade smarter, and gain the edge every trader deserves.
-
@Vishal Shah It is available only on Zone Mobile.
-
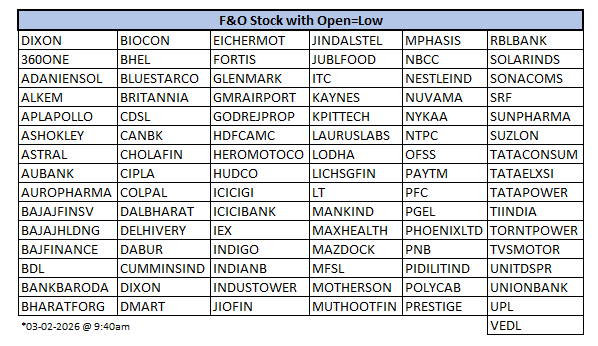
41 out of 500 stocks in Nifty500 had a Open=High structure ....What are your thoughts?
-
Every trader carries a secret desire in the heart – to be early in a trend that eventually becomes a headline.
Are you one of them?
Why Trends Begin With Sectors, Not Stocks....
-
@Akash If you are trading X Bar High Breakout or X Bars Low Breakout, you will get the same pattern under OHLC Scanner.
You can change the number of bars according to your requirements.
-
@Viswanath B You can go to Stocks Group > Grop Manager in RZone and overwrite or upload new group.
-
@OMESH YADAV Omeshji, Master Scanner helps to filter the stock if you are using multiple scanners to filter down the stocks.
Regarding the values, checkout this blog [https://www.definedgesecurities.com/blog/education/when-cricket-meets-charts-syncing-eden-gardens-pitch-with-the-stock-market-pitch/]
-
@Akash Aakashji can you explain in detail about the pattern?
You can DM me your number, will connect with you.
-
@MITESH HUF SHAH Appreciate your feedback. We will consider it in the list of features to be added.
-
@Radhakanta Samantara Our clients are the driving force behind everything we do at Definedge, and it's Free for Definedge Demat account holders.
-
@Bhaavin Ashar I have forwarded it to the concerned team. Please be patient, as our tech teams will review the issue.
-
Trade with clarity, not guesswork. Spot the truth behind every price move.
With Volume Spread Analysis, learn to identify strength, weakness, and smart accumulation.Enroll FREE on Definedge Gurukul, exclusive to Definedge Securities demat holders!
https://gurukul.definedgesecurities.com/courses/master-volume-spread-analysis-vsa/
-
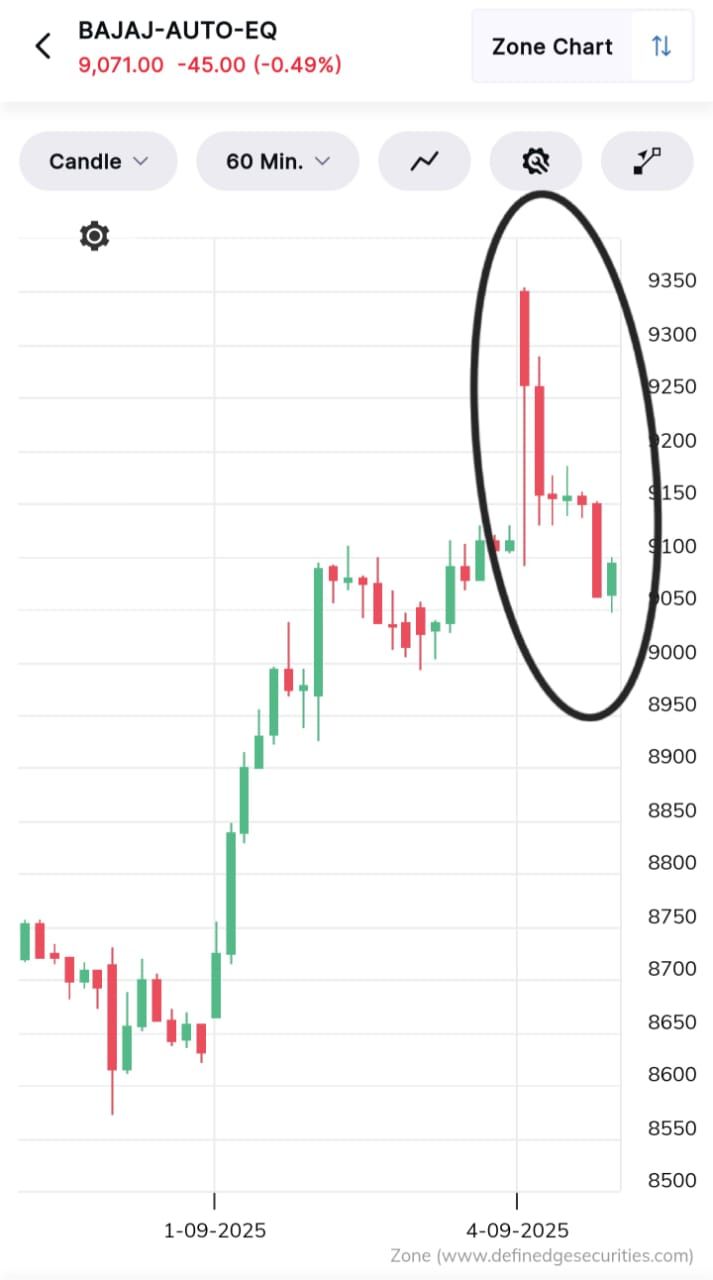
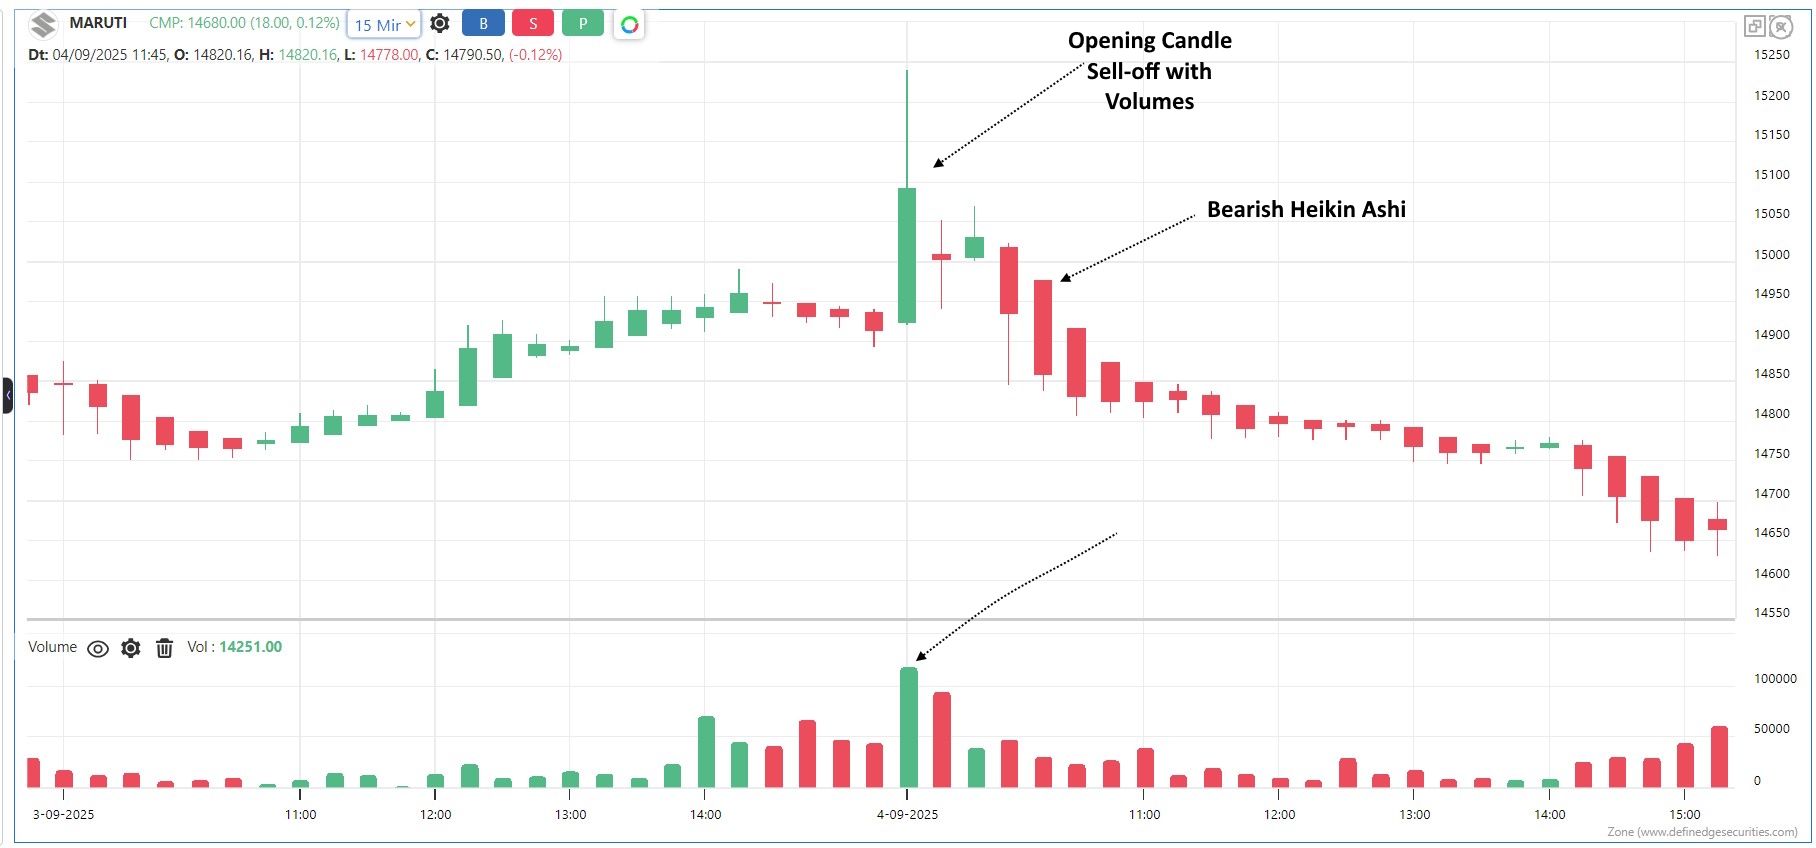
Dalal Street opened on an optimistic note as the Goods and Services Tax (GST) announcements fueled excitement across sectors. The Nifty opened higher yesterday, signalling positive sentiment. However, the real lesson for Indian stock market traders lies not just in the numbers, but in the psychology of “buy the rumor, sell the news.”
In trading psychology, “buy the rumor, sell the news” is a common phenomenon where investors build positions ahead of an anticipated event, such as a policy change, corporate result, or government announcement.
For Indian traders, GST revisions provide a textbook example of this strategy.GST Buzz and the Auto Sector Rally
Ahead of the GST announcement, there was strong buzz around a possible tax reduction in the automobile sector. Anticipating positive reforms, traders and investors aggressively bought into auto stocks.
• Maruti Suzuki surged in the run-up but fell 4% from its high once the news became official.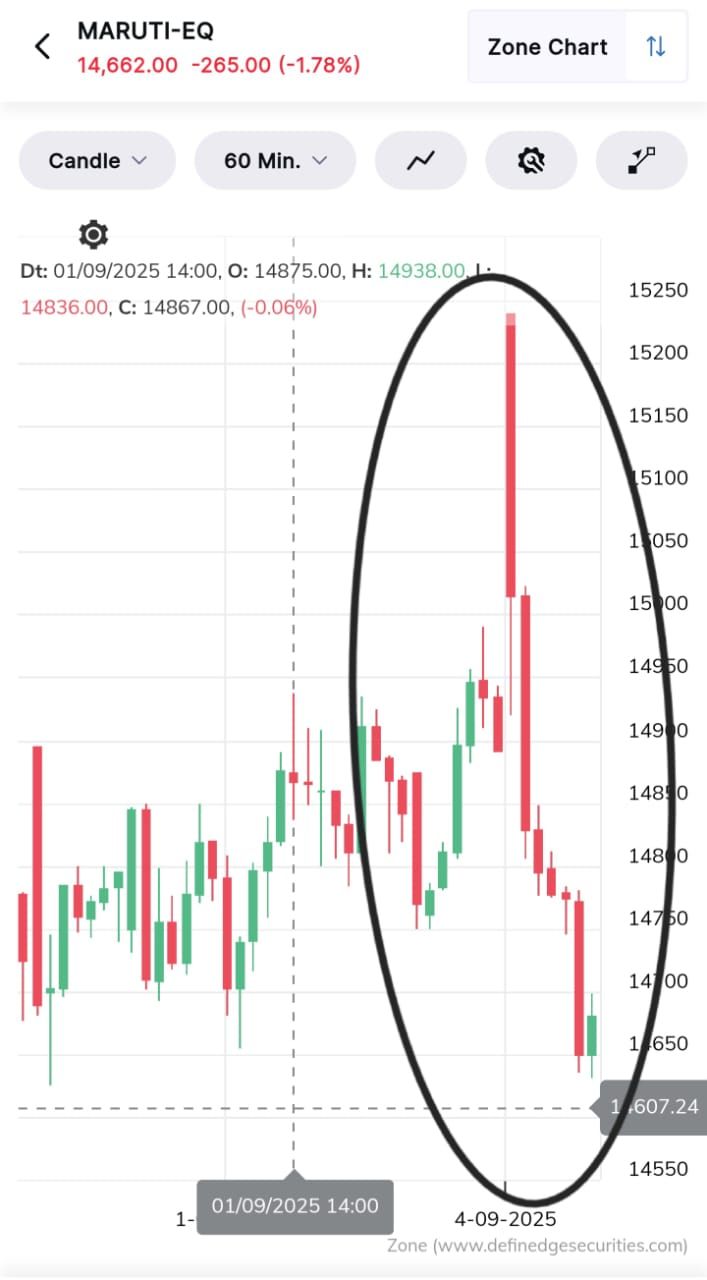
• Bajaj Auto declined nearly 3% from the top levels.
• Tata Motors also gave up about 3% after the announcement.
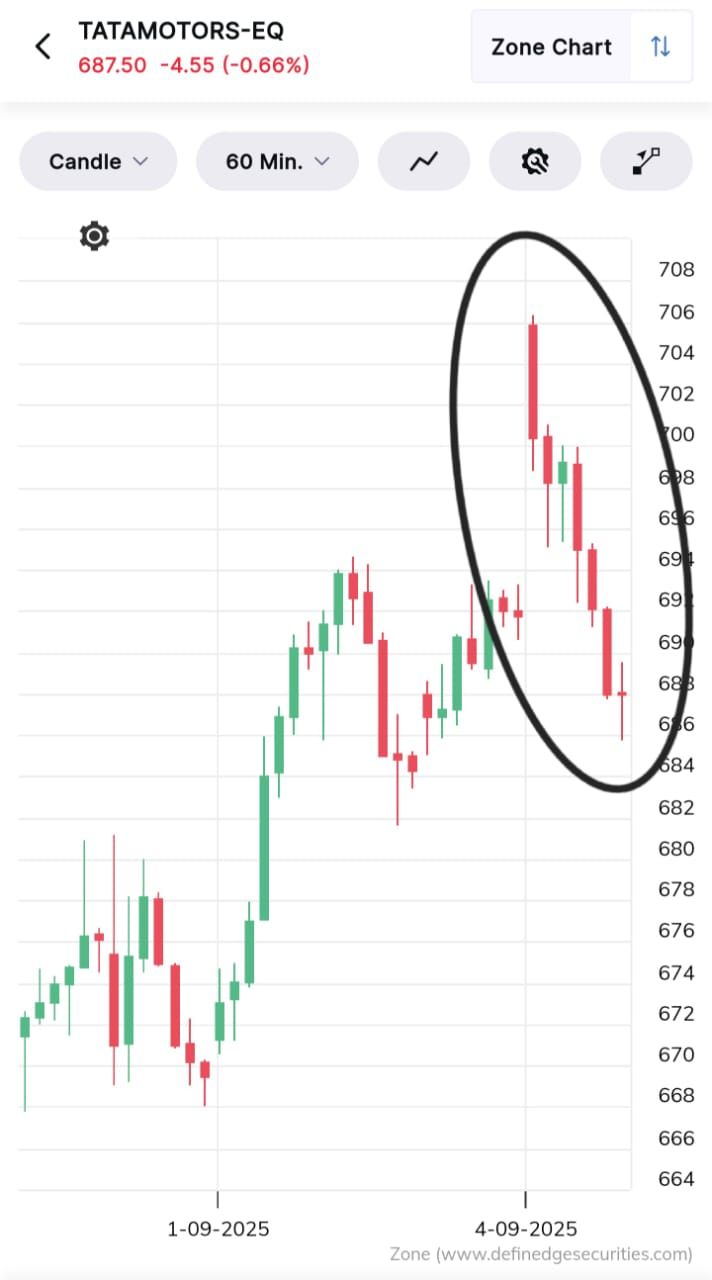
This reaction highlights how expectations are often priced in well before the official confirmation.Why Do Stocks Fall After Positive News?
- Expectations Already Priced In:
Traders often position themselves weeks before the news. By the time the announcement is made, valuations already reflect the optimism. - Profit Booking by Early Buyers:
Institutions and early entrants use the event as an opportunity to book profits, triggering a wave of selling. - Reality vs. Expectations:
Sometimes the actual announcement, while positive, may not fully match the exaggerated expectations built up during speculation.
Key Lessons for Indian Stock Market Traders
- Follow the Price Action, Not Just News:
News creates sentiment, but price charts reveal where smart money is moving. - Anticipate Market Behavior:
If a stock rallies significantly ahead of an event, be prepared for profit booking once the news is out. - Don’t Chase the Highs:
Buying after a sharp rally on expectations can trap retail traders if profit booking sets in.
Here is the Maruti Heikin Ashi Chart to understand these key lessons:
 y
y - Expectations Already Priced In:
-
Learn more about the Lunar Phase here https://www.youtube.com/watch?v=XWGbyNWZ9TQ&t=76s
-
The Neuro-Sponge Hypothesis impacts stock market traders by causing information overload and poor decisions. Learn strategies to filter noise, avoid mistakes, and see how Definedge Pathshala’s structured learning helps traders achieve consistent success. Read more
-
Watch the strategy - https://www.youtube.com/watch?v=JFNkoBNUb-Q&t=53s
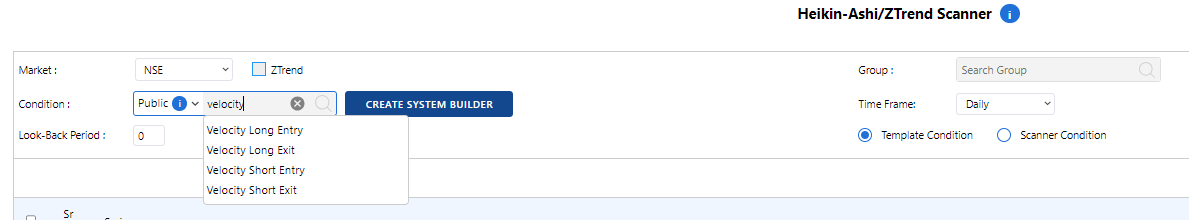
The scanner is available in the Public Condition:
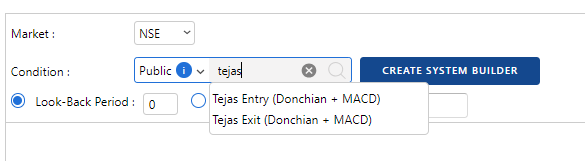
To scan this system/setup in your RZone, follow these steps:
Select “NSE” as the market.
Go to Public condition section, choose either:
– Tejas Entry (Donchian + MACD) - For Scanner
– Tejas Exit (Donchian Exit) - For Backtesting
Set the lookback period to 0.
INDEX UPDATES
Pulling Data into google sheets
Save strategy option
Algostra - available option for daily chart under chart-based MT filter?
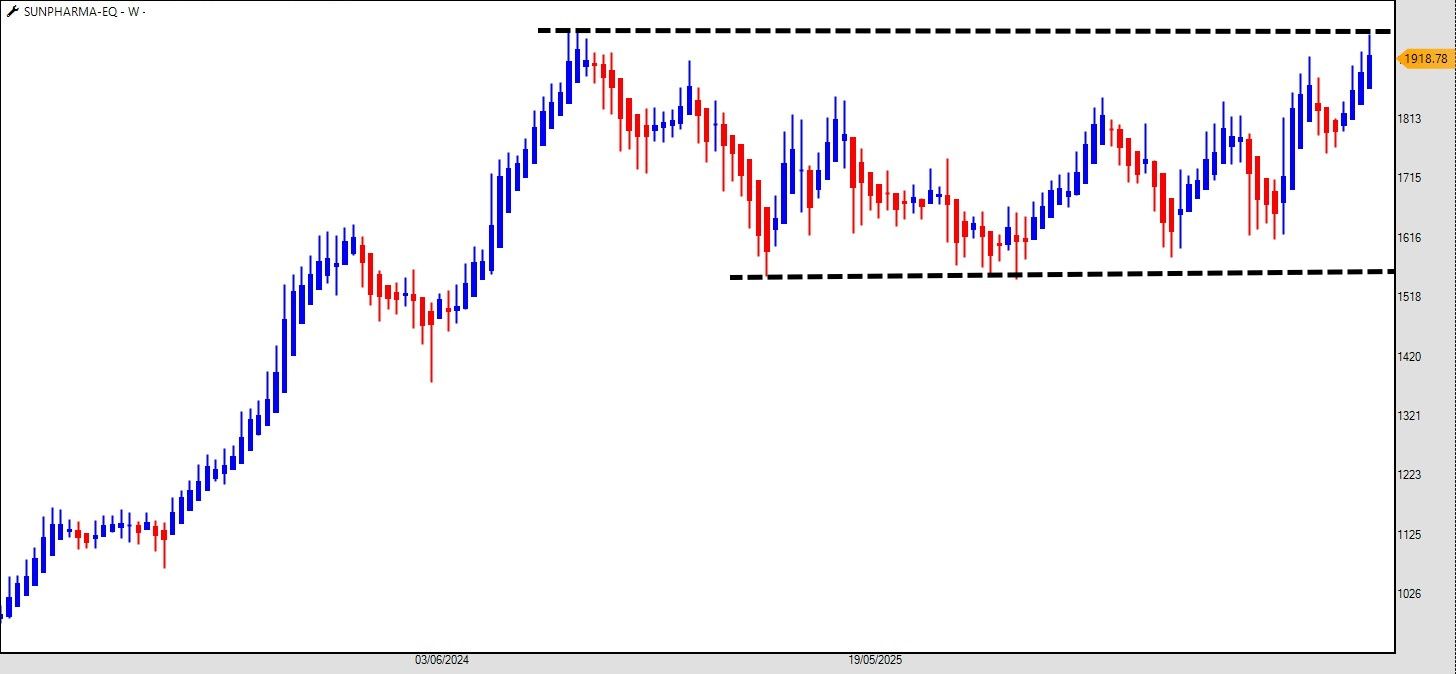
Sunpharma - Is it Warming Up for 2years Range Breakout?
Algostra - available option for daily chart under chart-based MT filter?
issue with mrrgin requirement for Future trading
How to use Chart and Chart Template in Zone Mobile which I saved in RZone?
Save strategy option
Wipro Shares Buyback
Algostra Filter (Optional) Clarification
Error in default FnO watlist
Algostra Filter (Optional) Clarification
Suggestion / Feedback : Momentify Auto-rebalane @ 3:15PM or later to match near EOD Price
Existing Holdings to Momentify Portfolio Strategy
do we have any place, where upcoming features for different products are listed
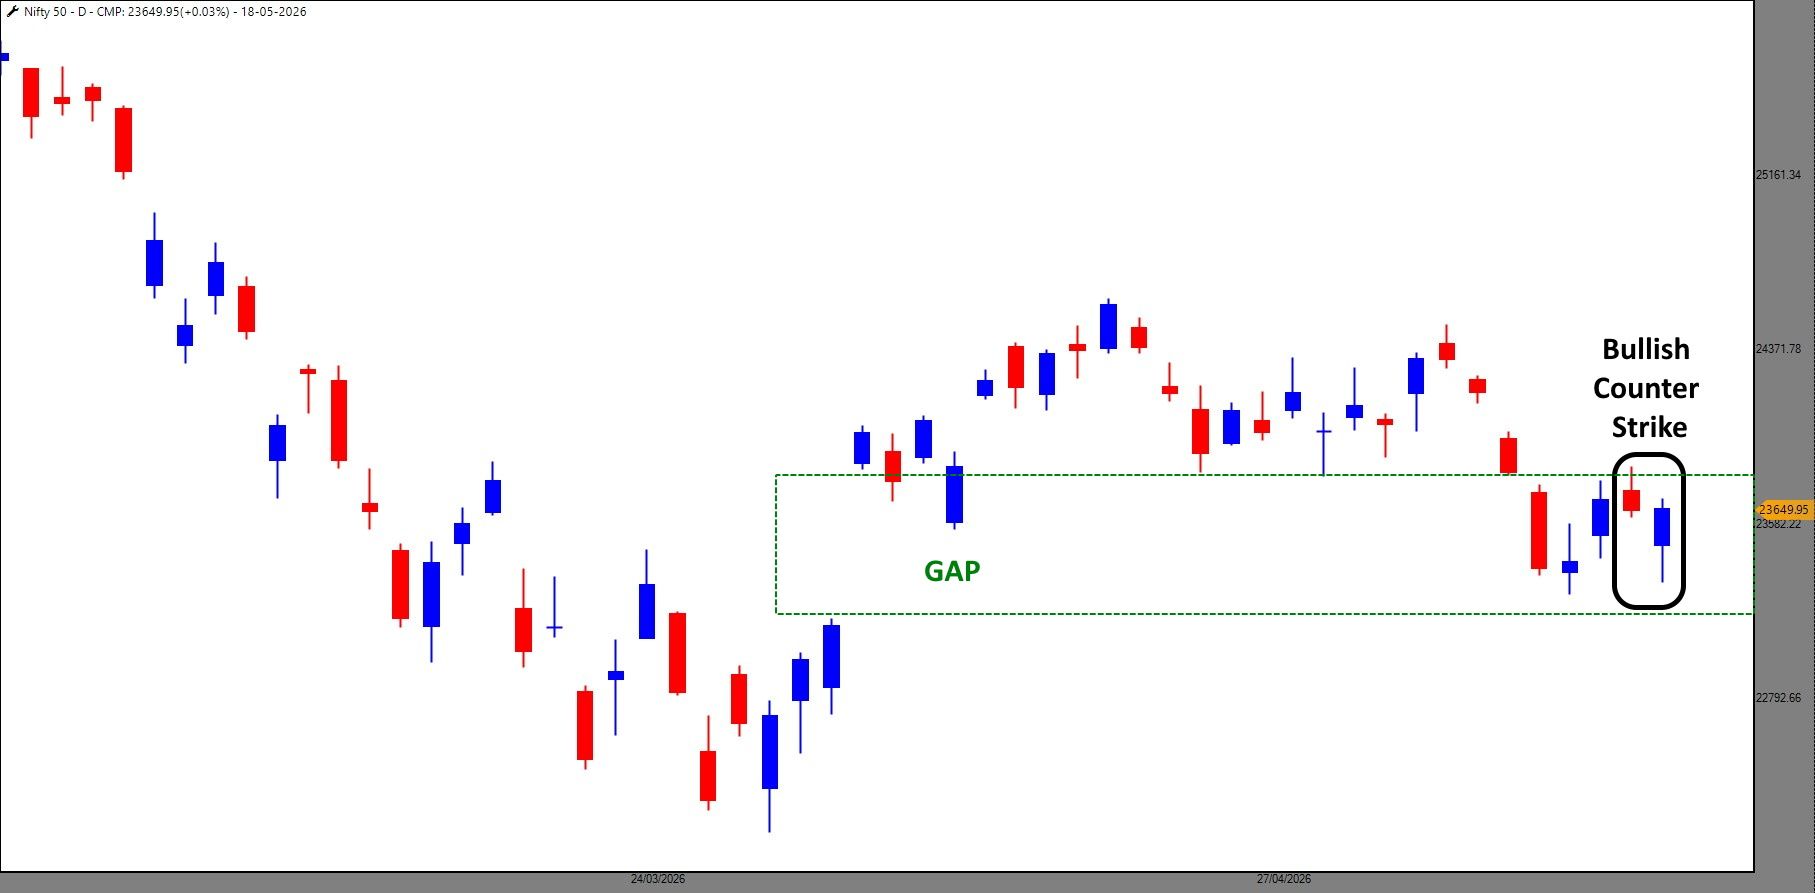
Nifty - Bullish Counter Strike
Nifty - Bullish Counter Strike
Rzone Website features
Bank Nifty Fut - Bullish Harmonic
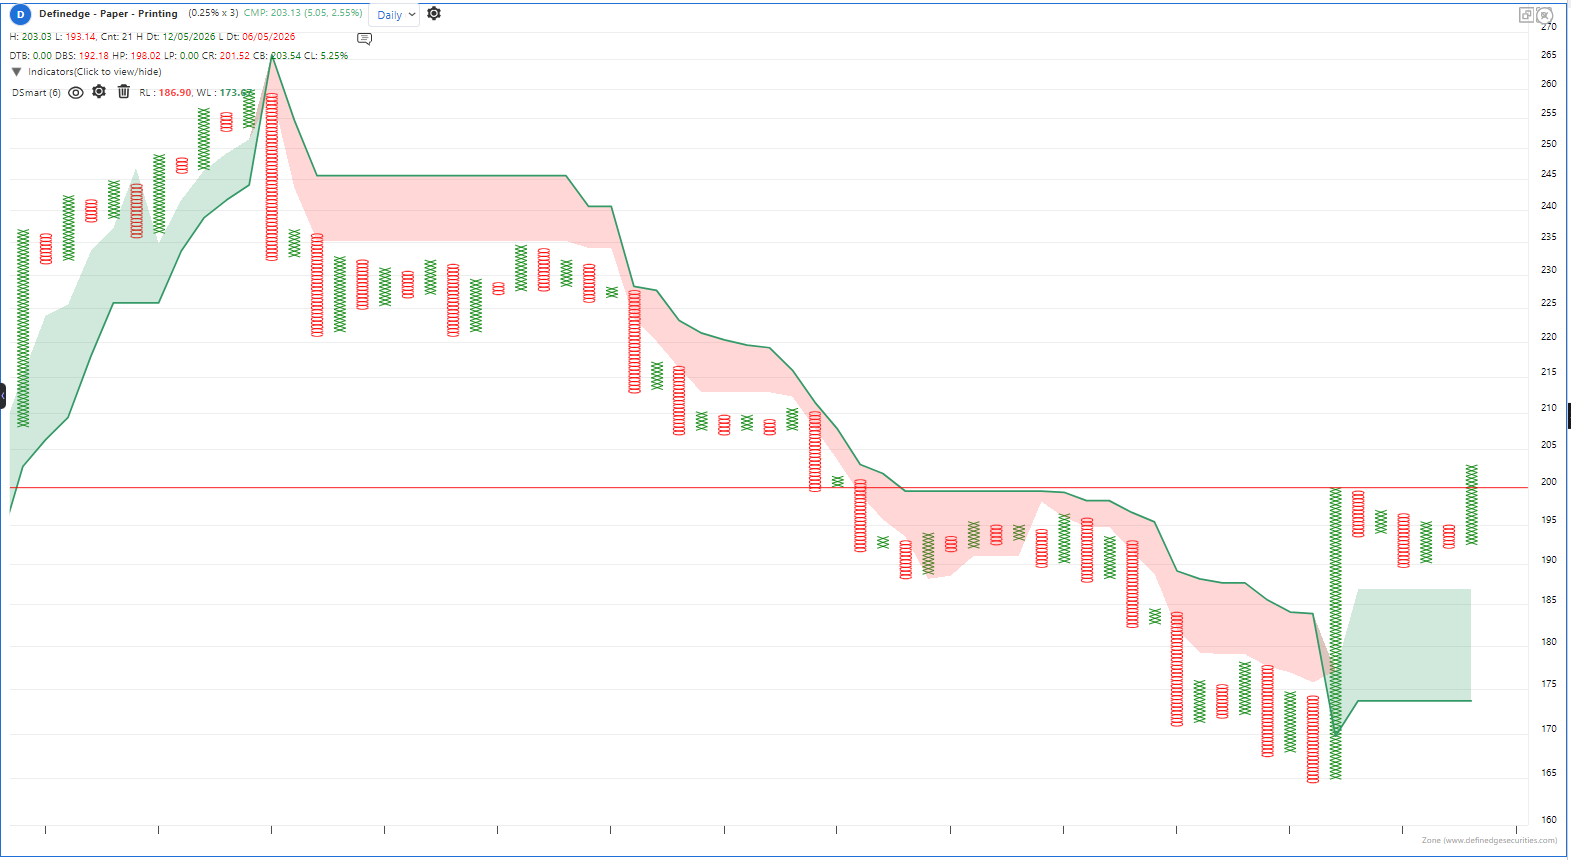
Definedge EQW Paper & Printing
System builder - help needed to create a system
MOMENTIFY - BASKET ERROR
Unable to Save Algostra stratergy
VEDL De-Merger in Momentify
Do we have any P&F pattern that shows the supply and demand area retest?
Renko pattern information is missing in library
creating real strategies in algostra
25 Minutes and 125 minutes timeframes
OOPS pattern for Renko chart
Many Indices are not available to scan
Page is not loading properly and widgets are not showing data
Guidance on System Builder
Nifty: A Perfect Storm - Bullish Harmonic Completion + RSI @ 2020 Levels
Nifty: A Perfect Storm - Bullish Harmonic Completion + RSI @ 2020 Levels
Silver - The Demand turns to Supply
RZone Not working, Mobile app chart not working
Should I use Input as a close or average for RSI indicator on P&F chart
Chart of the Day : TCS - Weekly RSI @ 2008 Levels
Momentary ETF Investing rebalancing
Trade Point Global Markets Data Upload
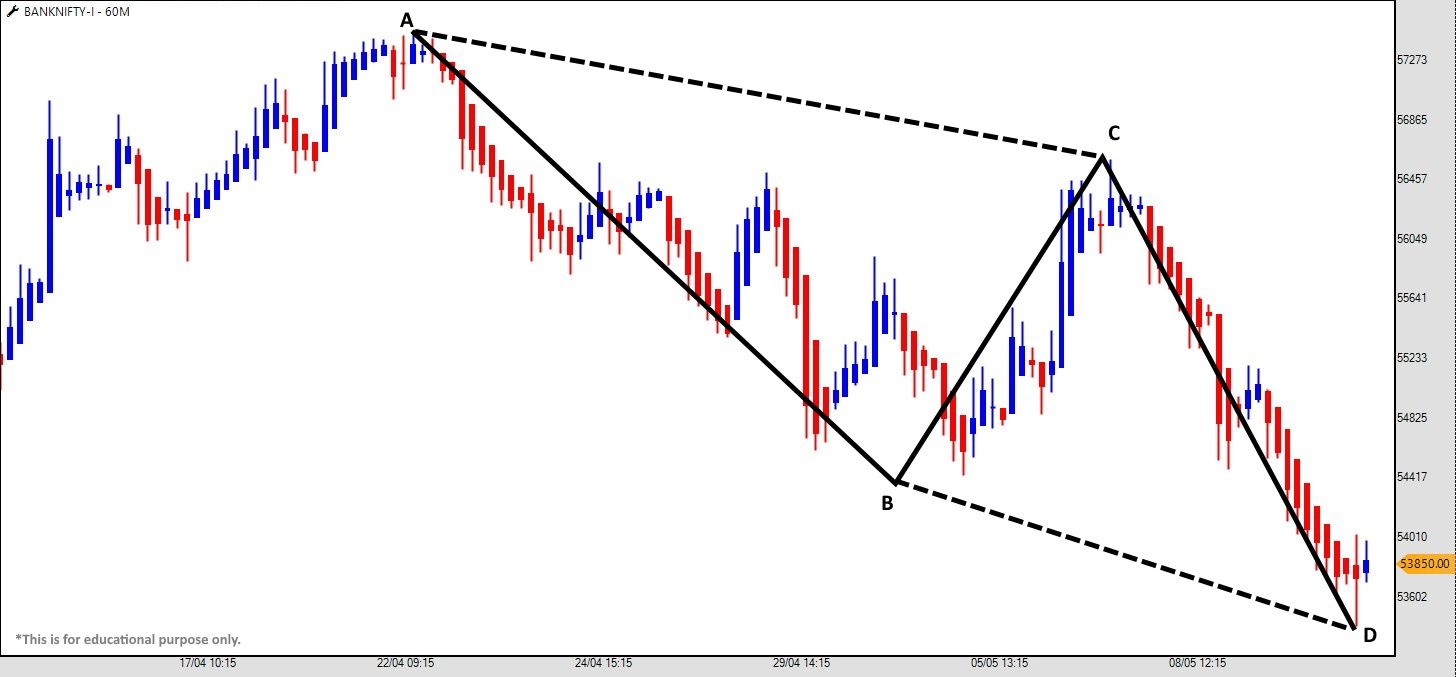
Chart of the Day : Bank Nifty - Bullish Harmonic
Chart of the Day - Nifty IT Index
RS screen for D sectors not working
Request for Stan Weinstein's Stage Analysis Scanner
Profit based SL trailing instead of percentage value
F&O Stocks with Open=Low
Tata Motors vs M&M - Will M&M Follow Tata Motors?
RZone Not working, Mobile app chart not working
Help With System Builder
Don't blink. Swiggy is printing a 'W' What Zomato has Formed in 2023
Technical help with Trade point
Regarding Velocity Long Entry
Visualise Scanner Condition on Chart
APP Opening related problem
Regarding Velocity Long Entry
signal automate in algostra
R Zone - unbelievably slow slow
Momentum investing strategies
Momentum investing strategies
US-India Trade Deal: Actionable Stock & Sector Strategy for Indian Investors
MIP 37 considers Market Trend Filter in Momentify for Rebalancing?
Serious Bug Identified in RZone Backtesting
Variation in Result of MIP_37
Dollar Index (DXY) @ 200MEMA - Is this the sign of top for Gold and Silver?
Continuation Pattern
Display of Build Up in Option Chain
ISSUES AND BLOCKERS
Continuation Pattern
Regarding Velocity Long Entry
Heikin Ashi
Not a Crash, Not a Rally; Just a Warning!
Need a clarification on construction of P&F charts
Learning Technical analysis
Backtest Master scanner and other pre built scanner
Content Request: Andrew Cardwell’s Range Shift via Point & Figure Charts
Continuation Pattern
Nifty Multi-asset and USDINR chart
Descrepancy between Order window for Nifty and Sensex
When Data Learns to Talk: Dynamic Ultimate Matrix
Descrepancy between Order window for Nifty and Sensex
Pattern occurrence scanner for candlestick, P&F and Renko
Issues in System Builder
When Data Learns to Talk: Dynamic Ultimate Matrix
Nifty @ 50DEMA, But.......
When Data Learns to Talk: Dynamic Ultimate Matrix
When Data Learns to Talk: Dynamic Ultimate Matrix
Nifty Analysis on the Move in One Screen
Nifty - Trendline + 200 HEMA
Nifty - Trendline + 200 HEMA
Wrong enty exit and differences in Momentify Portfolio and RZone backtest
Learning Technical analysis
Options Scanning tool (Rzone)
Swing high and low breakout (break of structure upside and downside) candles
Can we get bullish and bearish cloud option in system builder for MAST indicator just like we have for D smart?
When Data Learns to Talk: Dynamic Ultimate Matrix
How to implement MA crossover in System Builder
NSE All Sectors Breadth Alarms Caution for Bulls
DECMA2026
Breath Multi Chart Scan
Discount code for online gurukul course
Need to understand the working of these tools
When All Charts Speak the Same Language: The Breakout Scanner Story
Tradingview Integration
41 out 500 Stocks have Open=High - What are Your Thoughts?
A One Window Sector Performance for Your New Trade
Swing high and low breakout (break of structure upside and downside) candles
Delete or Overwrite Groups
Suggestion for Momentify
Swing high and low breakout (break of structure upside and downside) candles
RANK CRITERIA : DI (Disparity index)
Your FREE Ticket to Volume Spread Analysis Course
EMA checkbox bug in momentum trading backtesting
Intraday Scanner during Reversal Market Day
Your FREE Ticket to Volume Spread Analysis Course
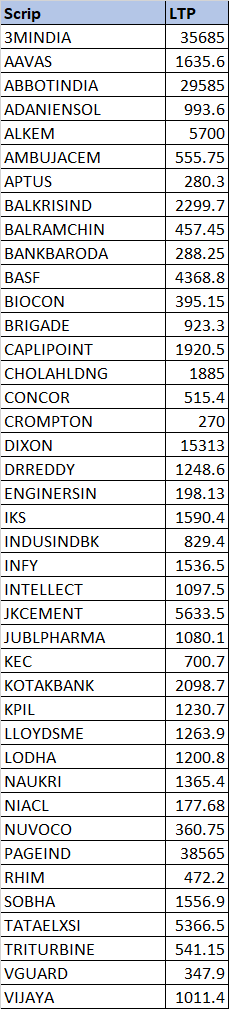
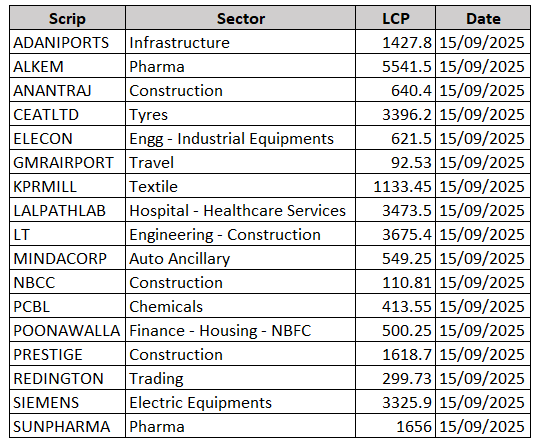
Laidback Stocks_19-09-2025
Laidback Stocks_27-09-2025
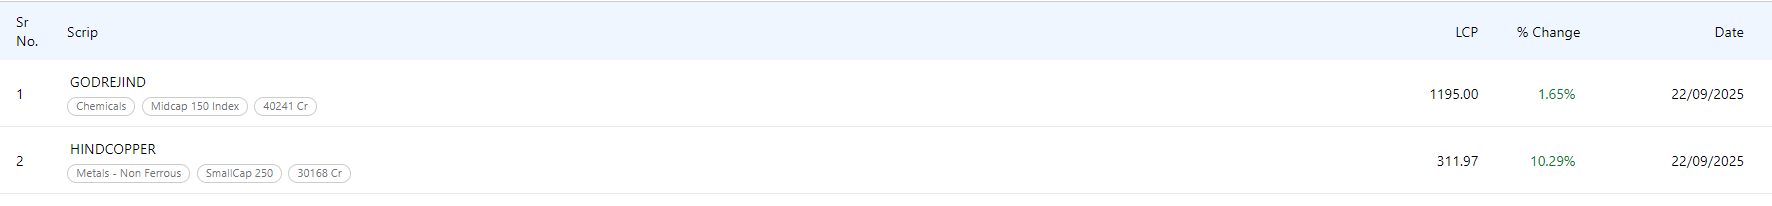
Laidback Stocks_19-09-2025
Buy the Rumors - Sell the News - The GST Saga
Nifty50 - Break After Three Falling Lunar Phase
The Neuro-Sponge Hypothesis - An Information Overload for Traders and Investors
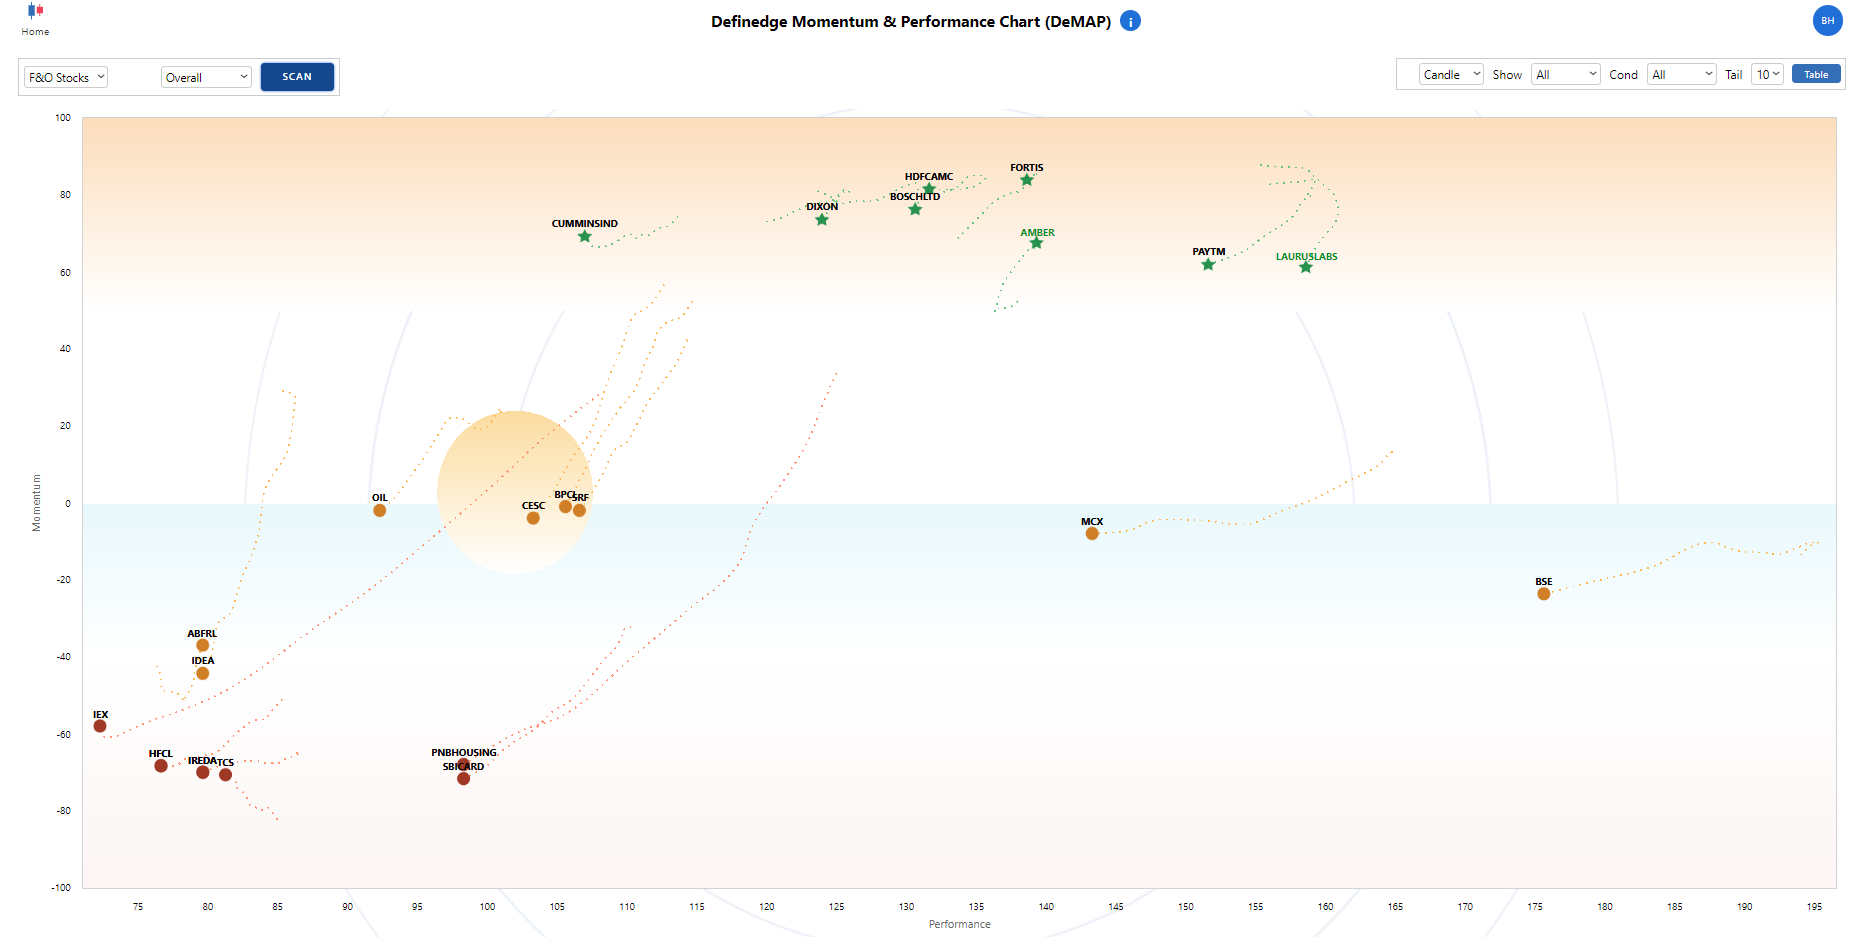
F&O Stocks Watchlist using DeMAP
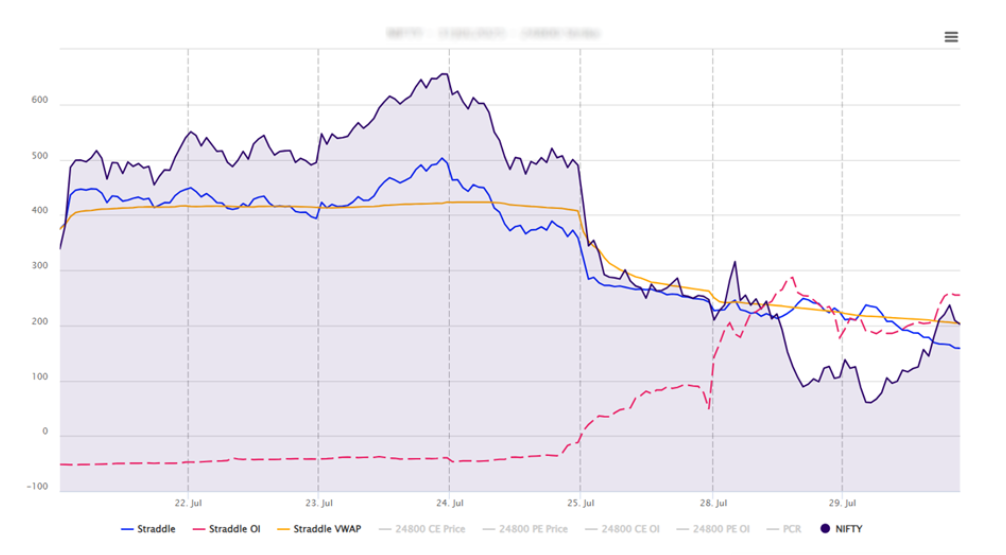
What's Next for Nifty? Check the Straddle Charts in Opstra
Donchian Channel Strategy