
Broadening follow through pattern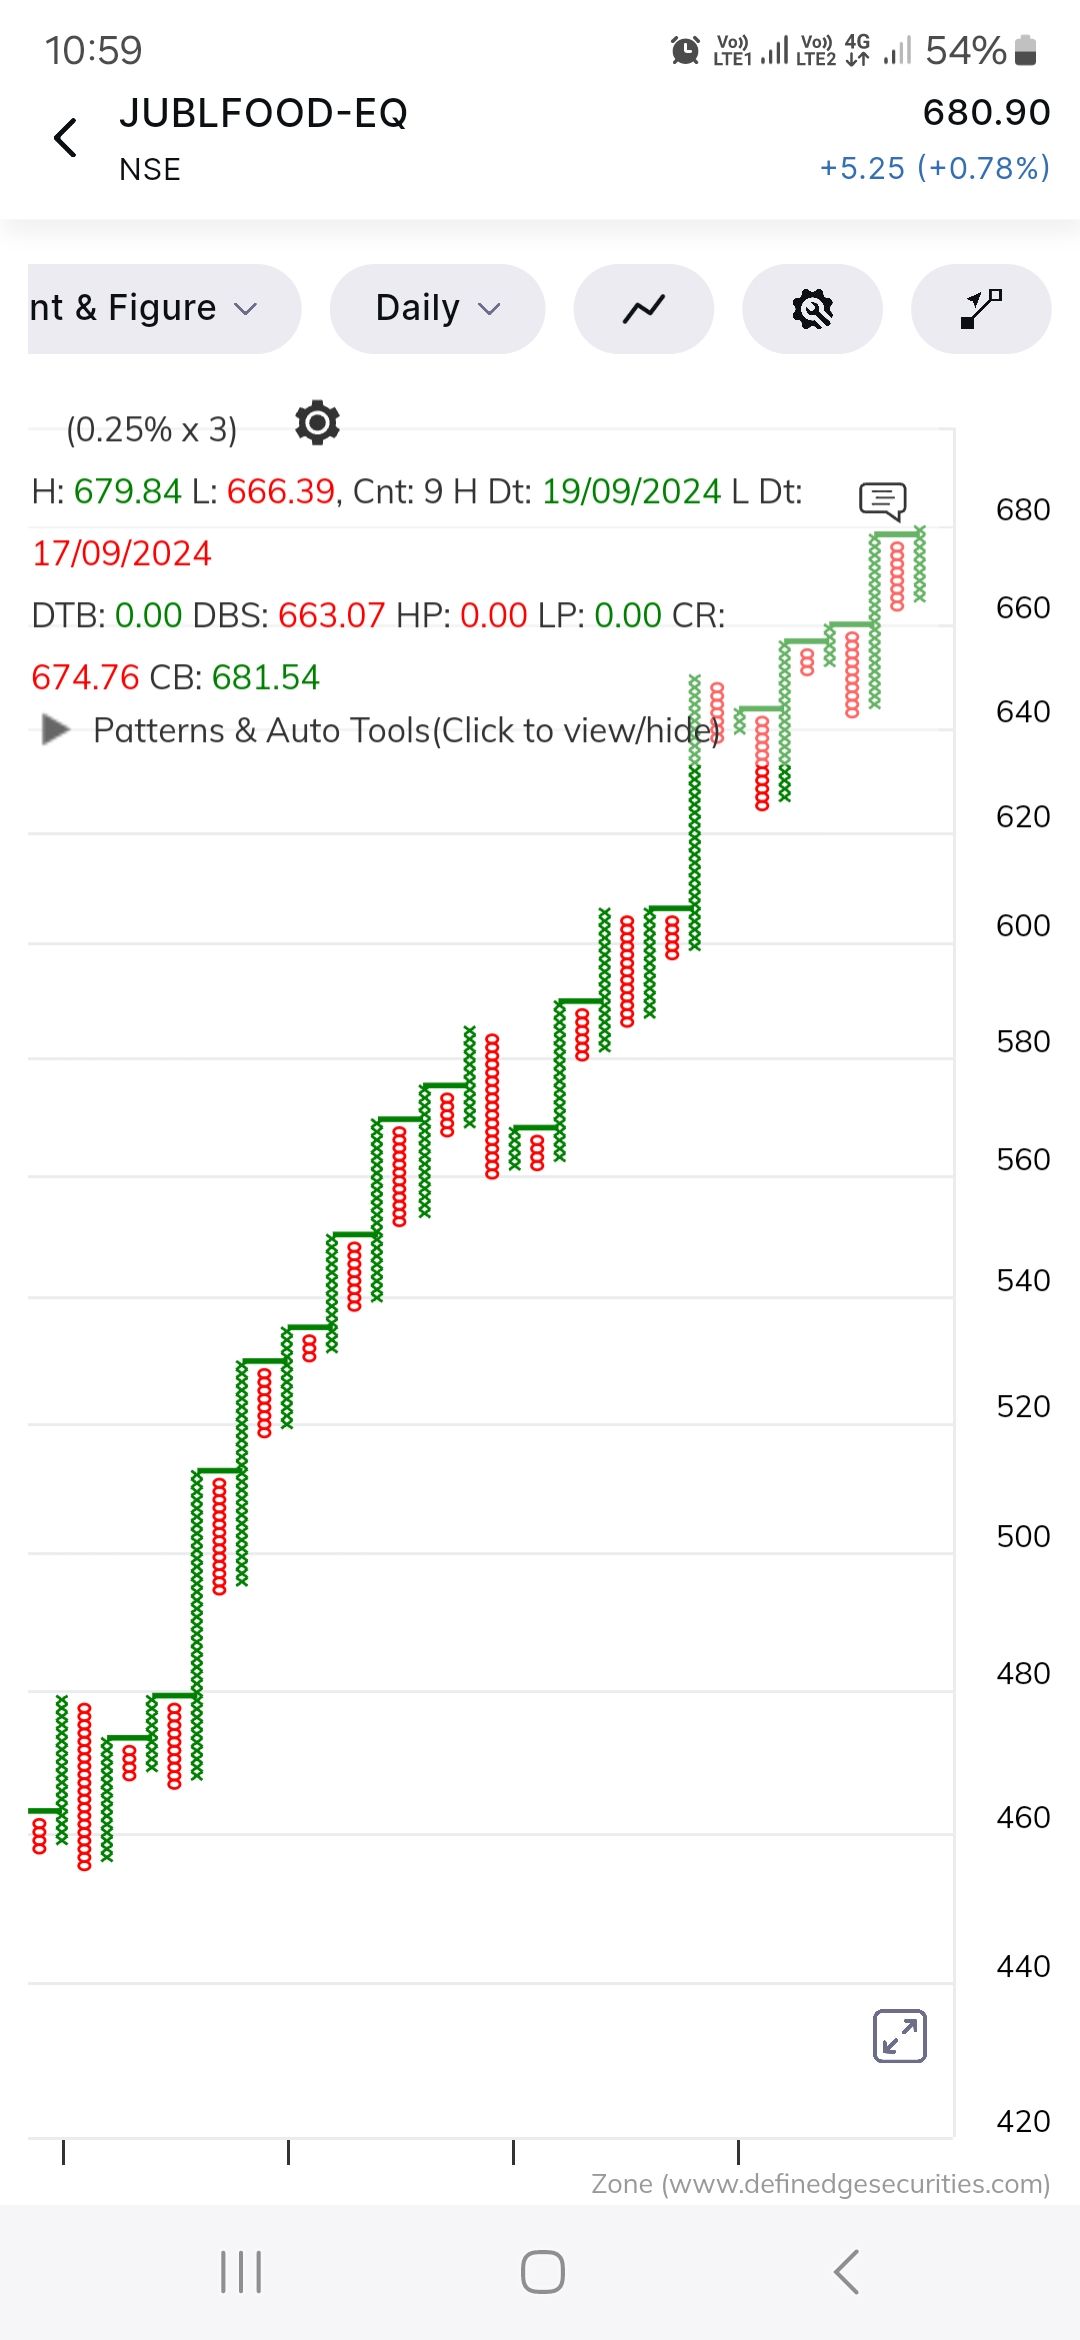
K
Karan Dattani
Pro User
All Replies
-
-
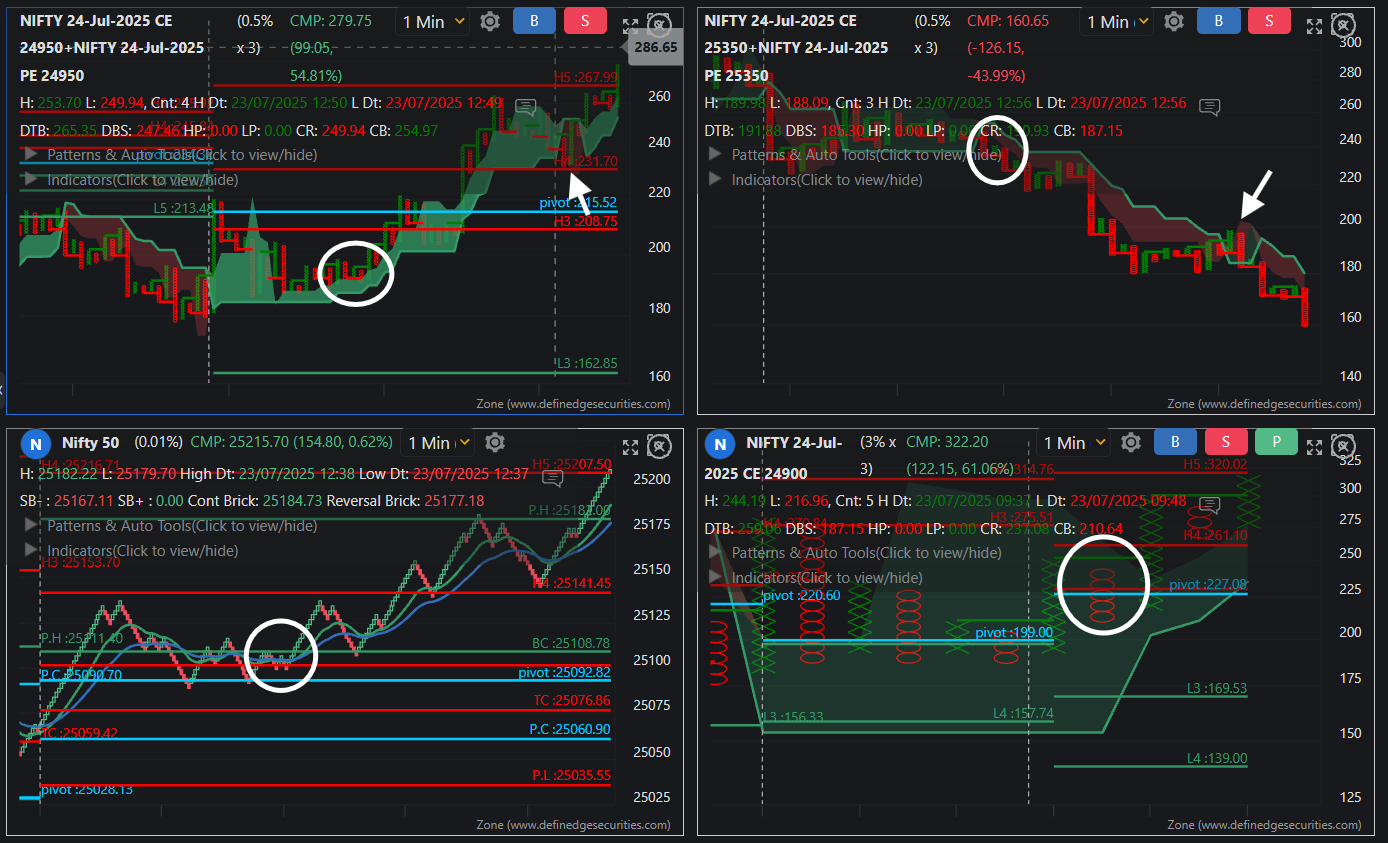
Gap up and retracement but straddle never broke D smart and thus no signal for PE then came signal for CE, wednesday/thursday 3% charts are better 24900 CE DTB triggered after multiple O at same level CE went from 260 to 320 -
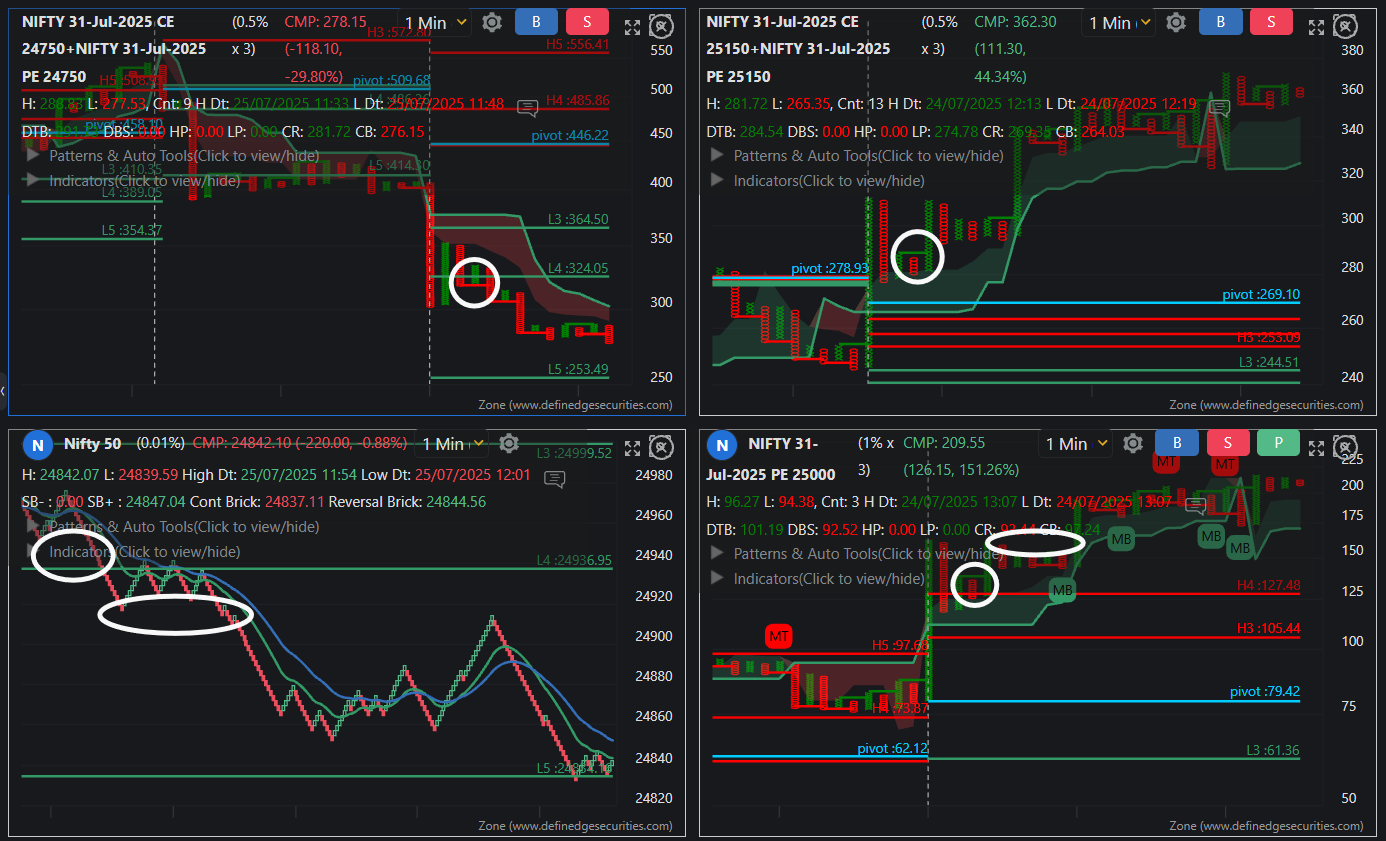
Morning had a setup in CE where bearish AC did not have FT, but straddles advised against it. Later PE had Triangle breakout at 140 which broke D smart at 176. -
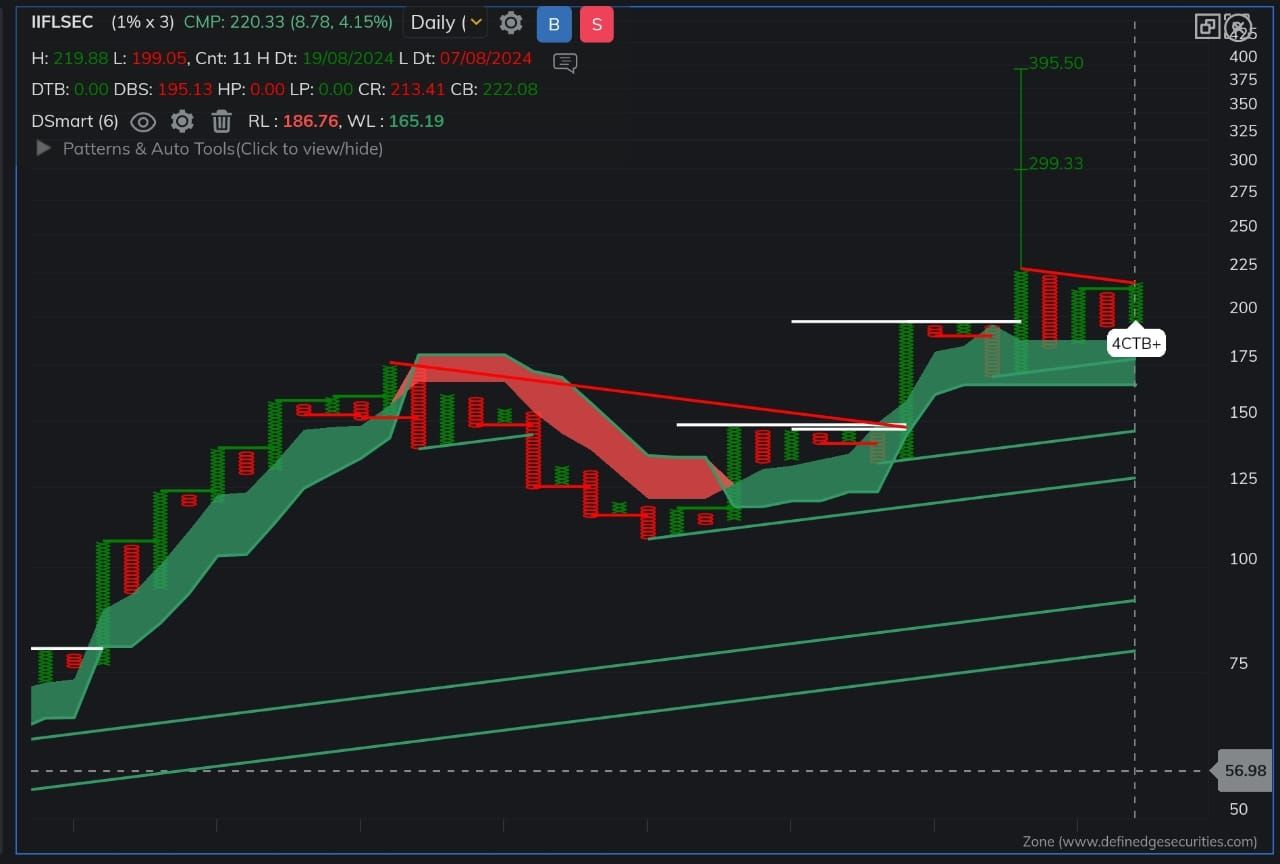 Strong sector
3 column triangle breakout
Along with 45 drgree line breakout
Upside counts are 299 and 395 -
Amazing sir... resonates so much for every trader
-
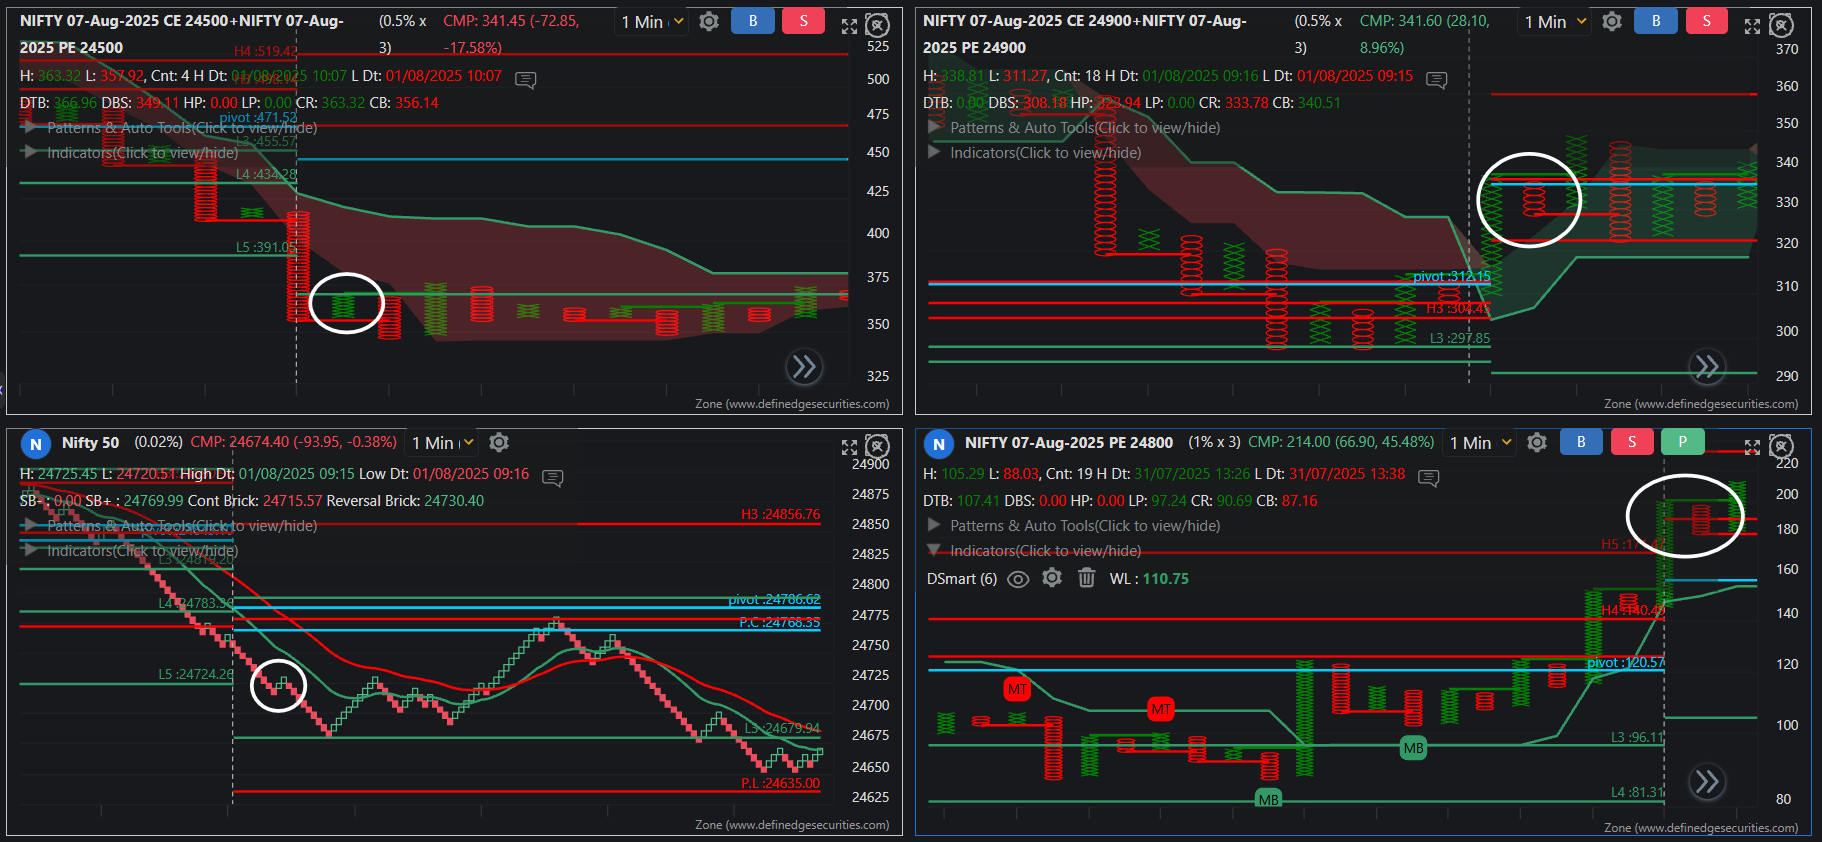
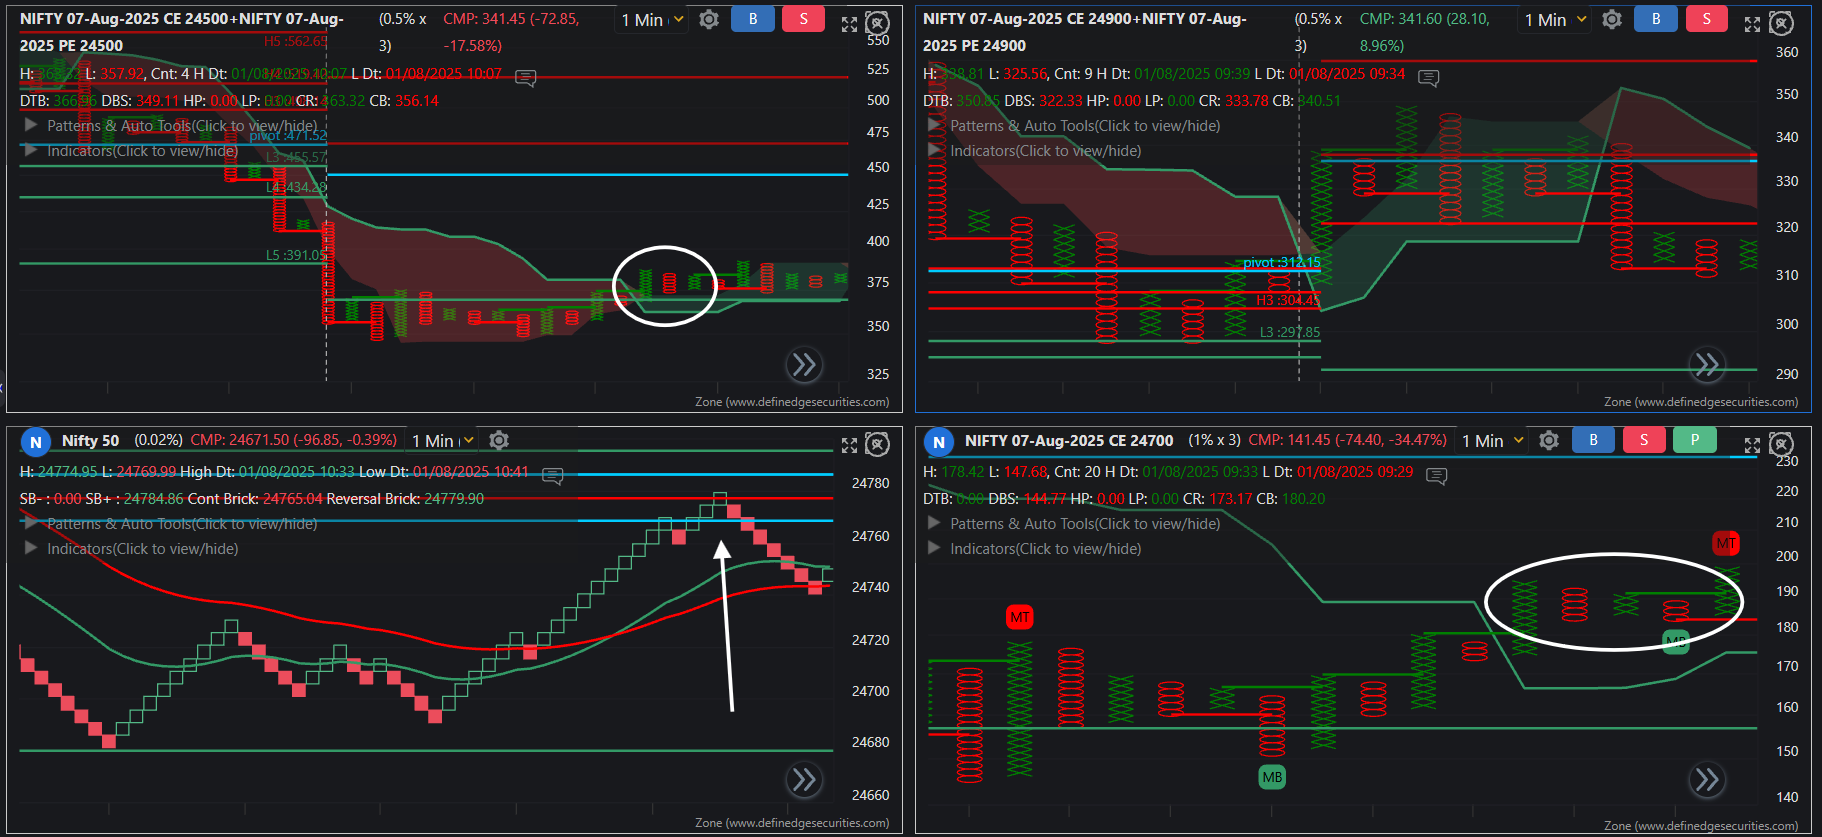 Plot 2 straddles one breaks D smart enter option book on next camarilla sounds easy right? However today was classic example of when NOT to trade. In opening session we had an opportunity to trade 24800 PE from h3 to h4 but...Nifty spot was giving same breakout just above L3 which could be a potential support and exactly that's what happened. Next similarly when CE was giving an opportunity Nifty was sitting right at Pivot and even that failed. Next PE opportunity coincided with Nifty breaking swing low below L3 and that's when we had same h3 to h4 opportunity in 24800 PE 1% chart from 206-232. Why not trade a DTB before that? Because both straddles were below Dsmart suggesting uncertainty in direction
 -
More than 12% in a day
-
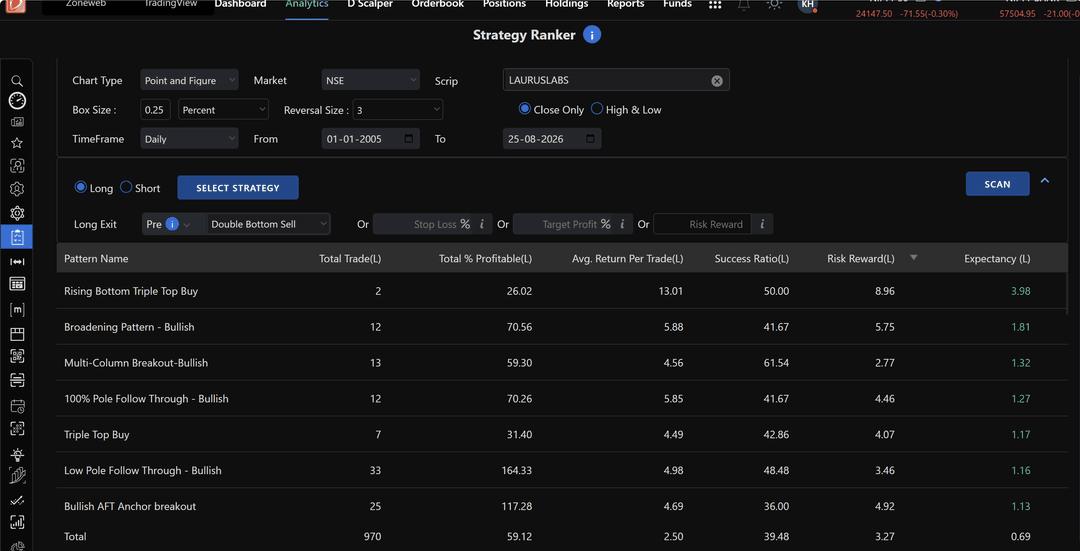
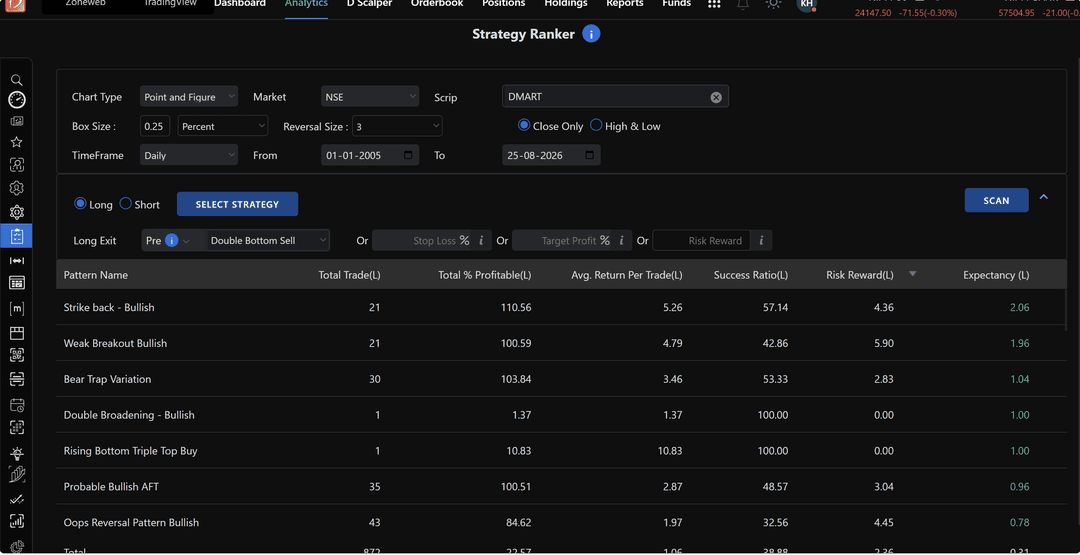
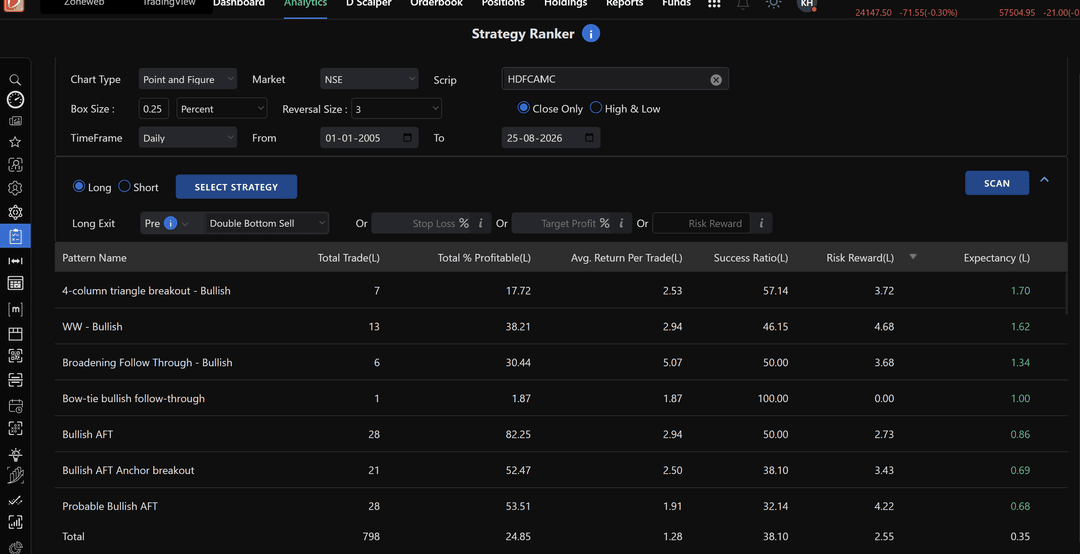
If you are a systematic trader following a specific chart pattern, have you ever noticed that certain stocks almost always make money for you, while others always seem to lose? The problem is neither your chart pattern nor luck. Every stock has its own unique behaviour, which also changes over time. Some stocks do well as breakout candidates, while others deliver better returns on a pullback setup. So how do you understand the nature of the stocks you trade often? The answer is Strategy Ranker in Rzone.
In Strategy Ranker, you can select multiple chart patterns on your favourite chart type and stock, and view how each pattern has performed historically. For example, Laurus Labs shows greater expectancy on Pole and Multi-Column Breakout patterns, while DMart has higher expectancy for reversal patterns like Strike Back, Bear Trap Variation, and Oops Reversal. Lastly, HDFC AMC shows higher expectancy for AFT and Triangle Breakout patterns.
So, the next time, you can shortlist stocks that have better expectancy for the pattern you trade consistently.
-
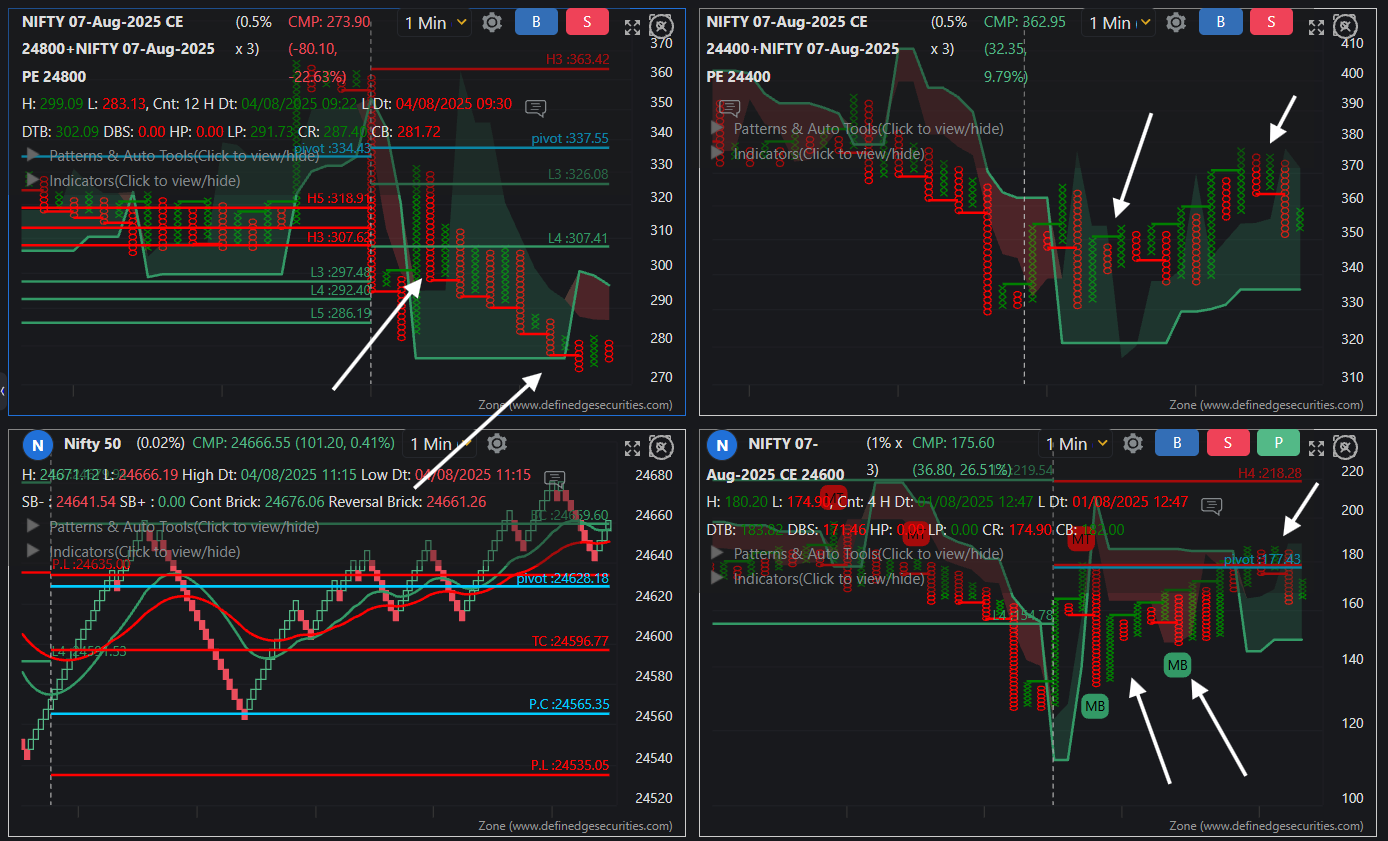 Example of Straddles helping avoid small SL trades. For Option buying you need Alignment of all stars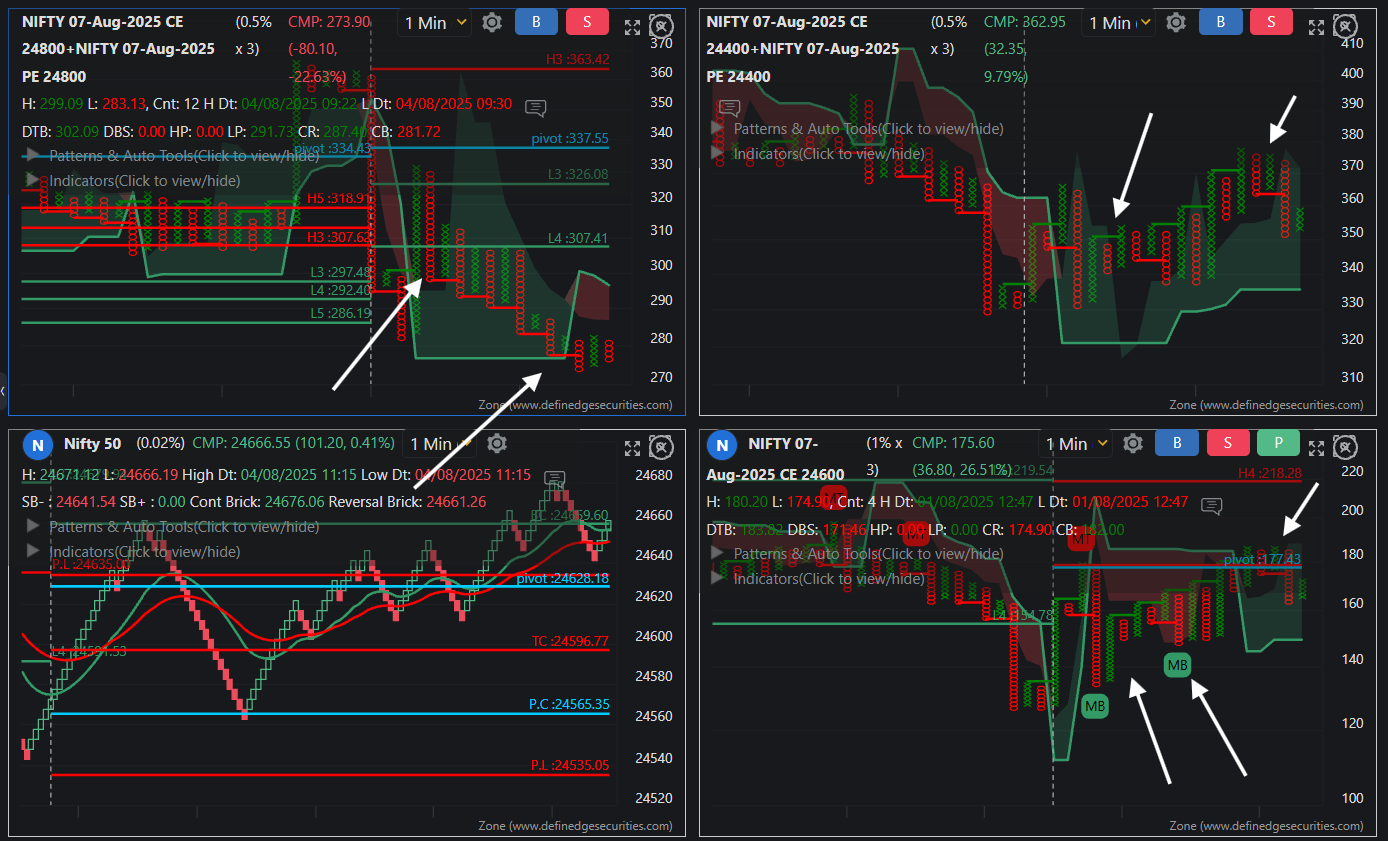
-
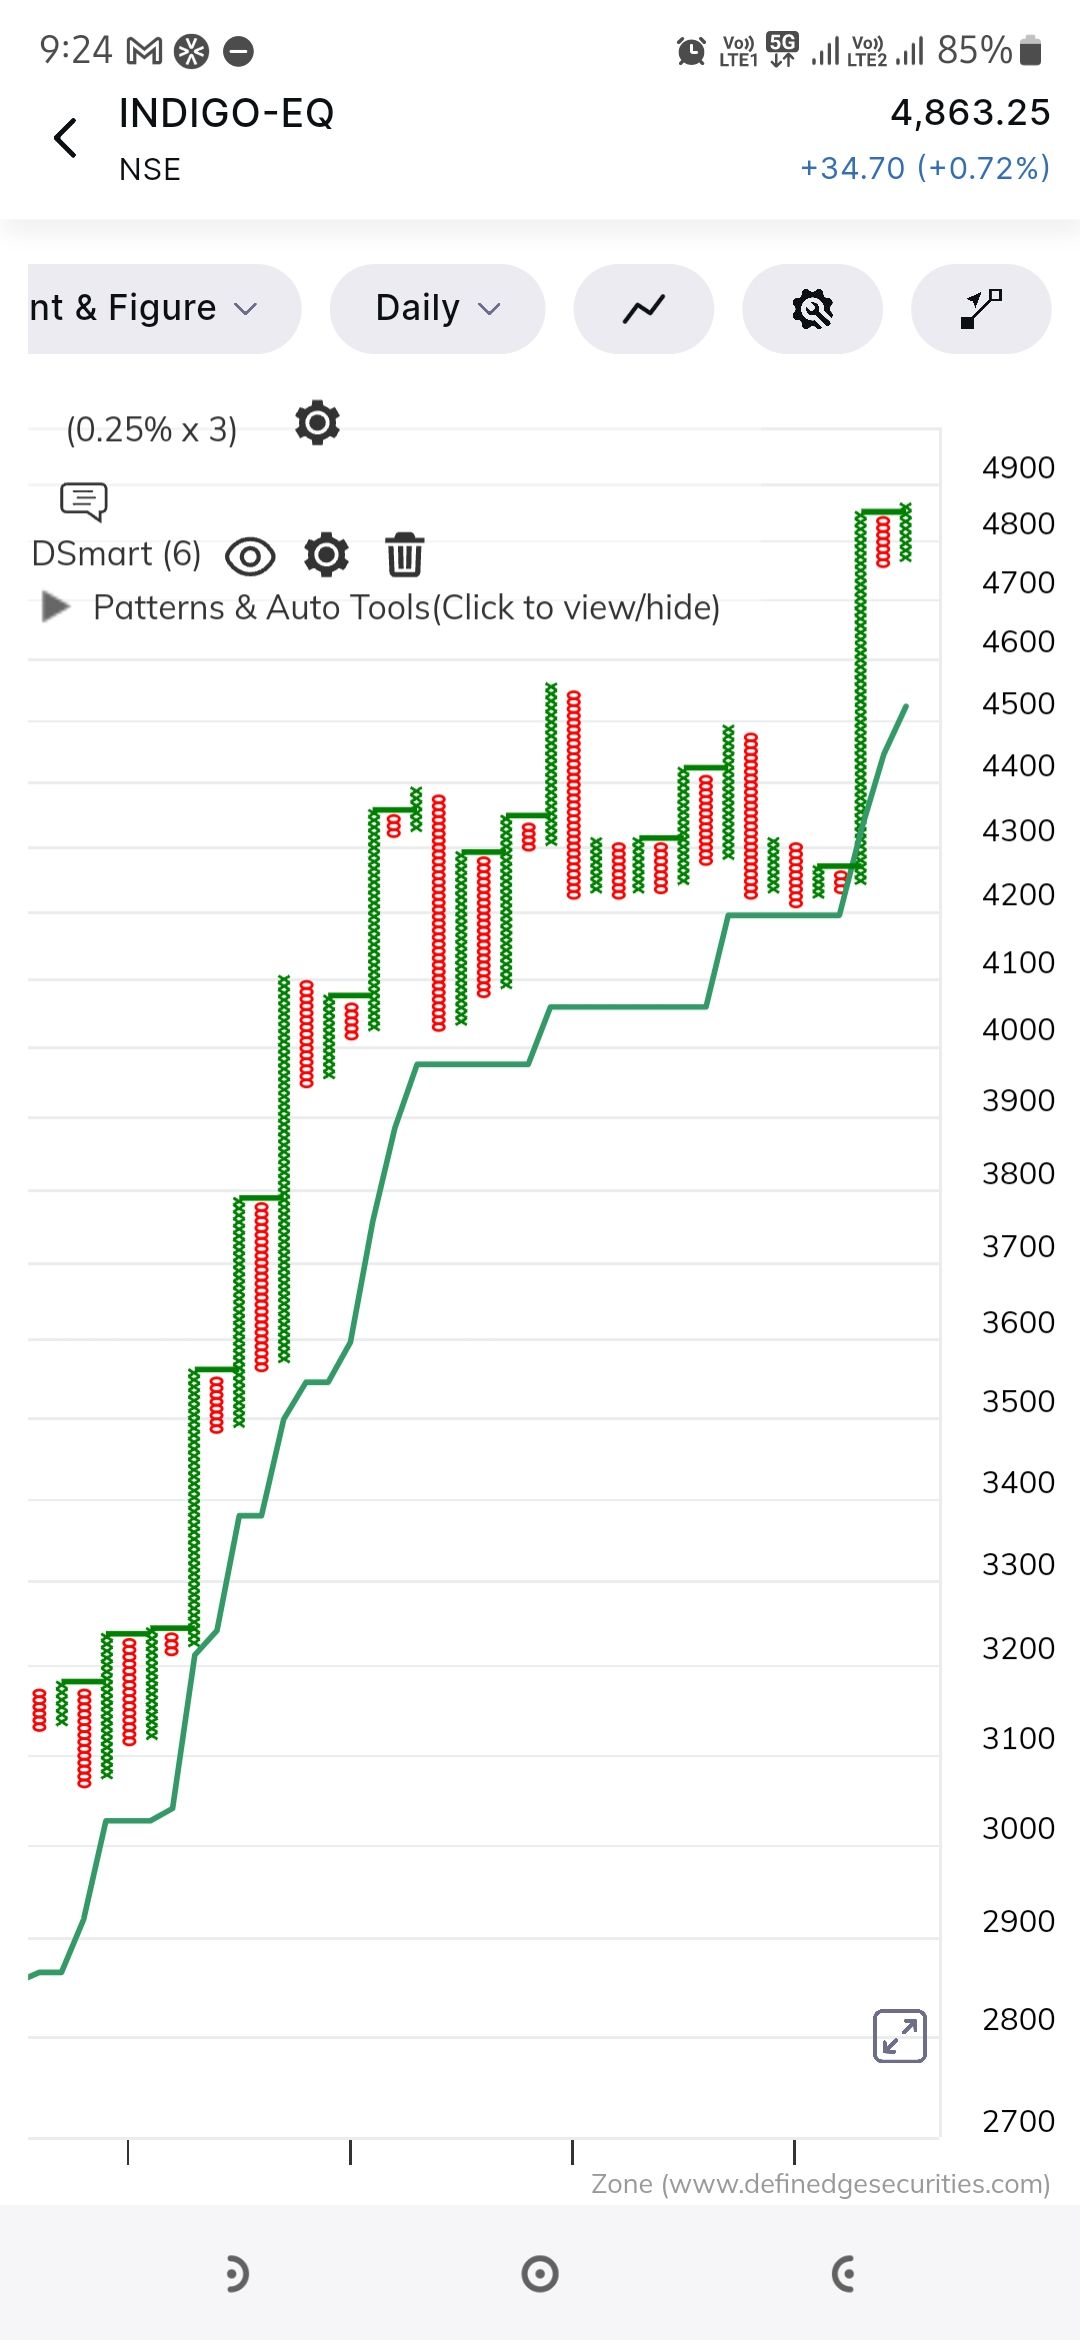
Consolidation breakout and followthrough
Relatively strong stock and sector
-
Hello sir
If we can have our drawings saved on our charts in Zone web, even if we switch scrips, it would be amazing -
Triple top in Cash and RS charts
Outperforming sector and stock
-
-
You just opened your trading terminal and lost about market health and where to look for trade?
Too many scanners and scrips flickering red and green got you confused?
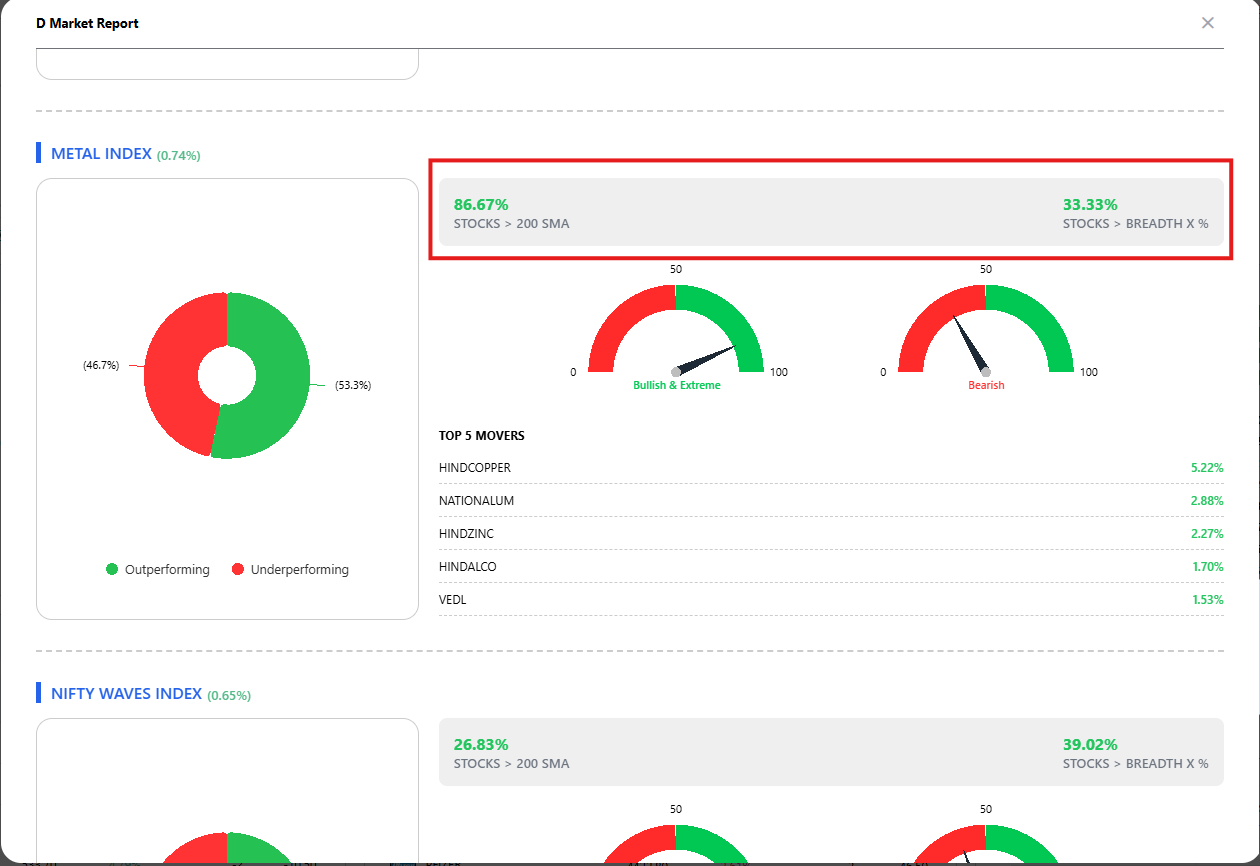
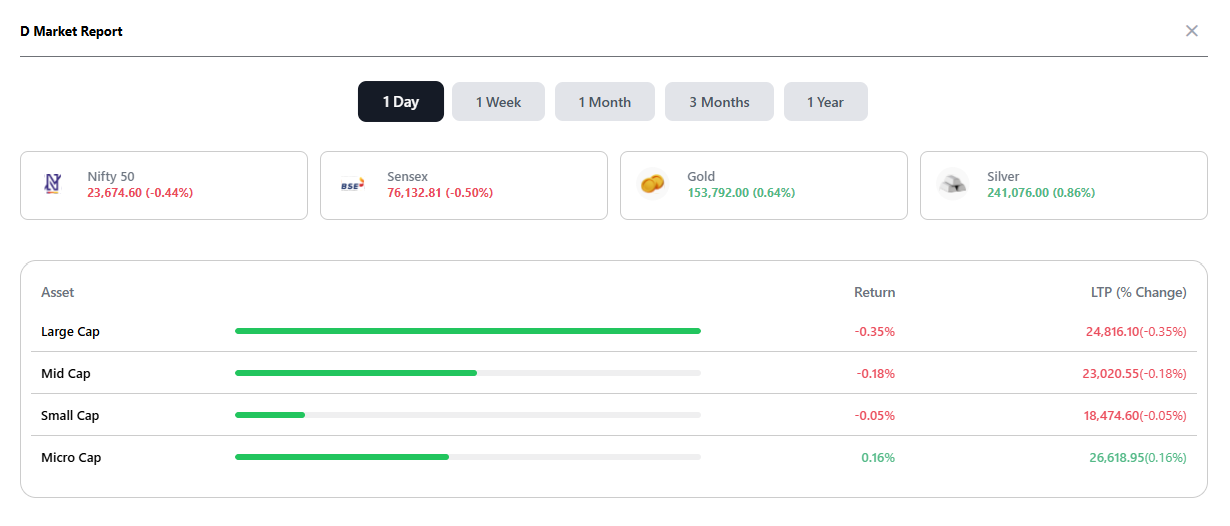
We have got you covered, introducing D Market Report a quick snapshot of all the action and market health.
Zone Web > Analytics > Dashboard > D Market ReportYou can immediately see how different assets are performing and within Equities how each segment like Large cap, Mid cap, Small cap and Micro cap are performing, top stocks and breadth of each segment.
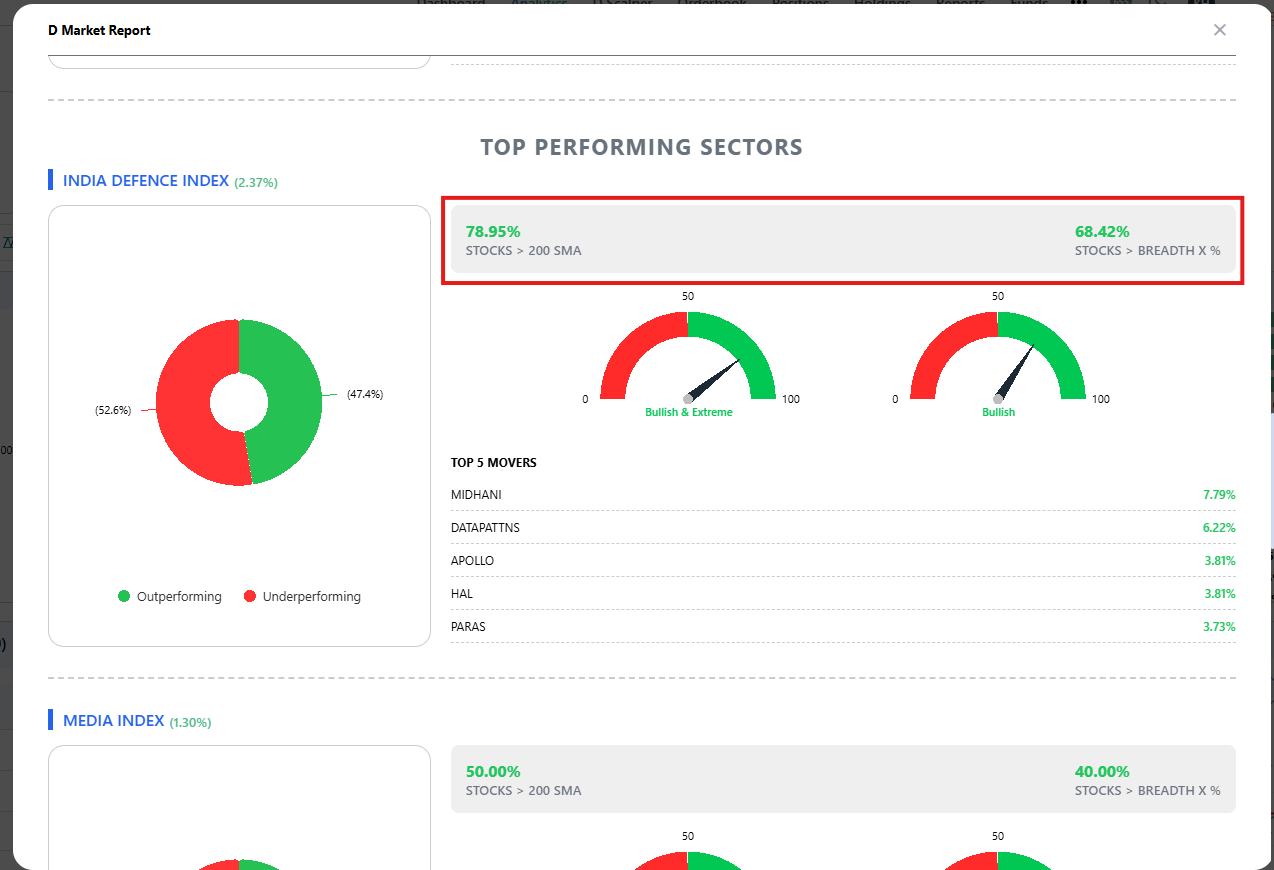
When you scroll down a little you can see Top Performing Sectors. Sector's performance of the day is visible at the top and users can check 2 breadth parameters: No of stocks > 200 MA and No of stocks in column of X. Treat this as long term and short term breadth. For example, today we can see India Defence Index in Outperforming Sector with LT Breadth > 75% and ST breadth > 68% this shows that Defence is a buzzing section good for breakout opportunities. Another Example is Metal Index having LT Breadth > 85% and ST Breadth near 33% this is good example of spotting a Pullback opportunity using D Market Report.
-
Turtle FT
With 20 as SL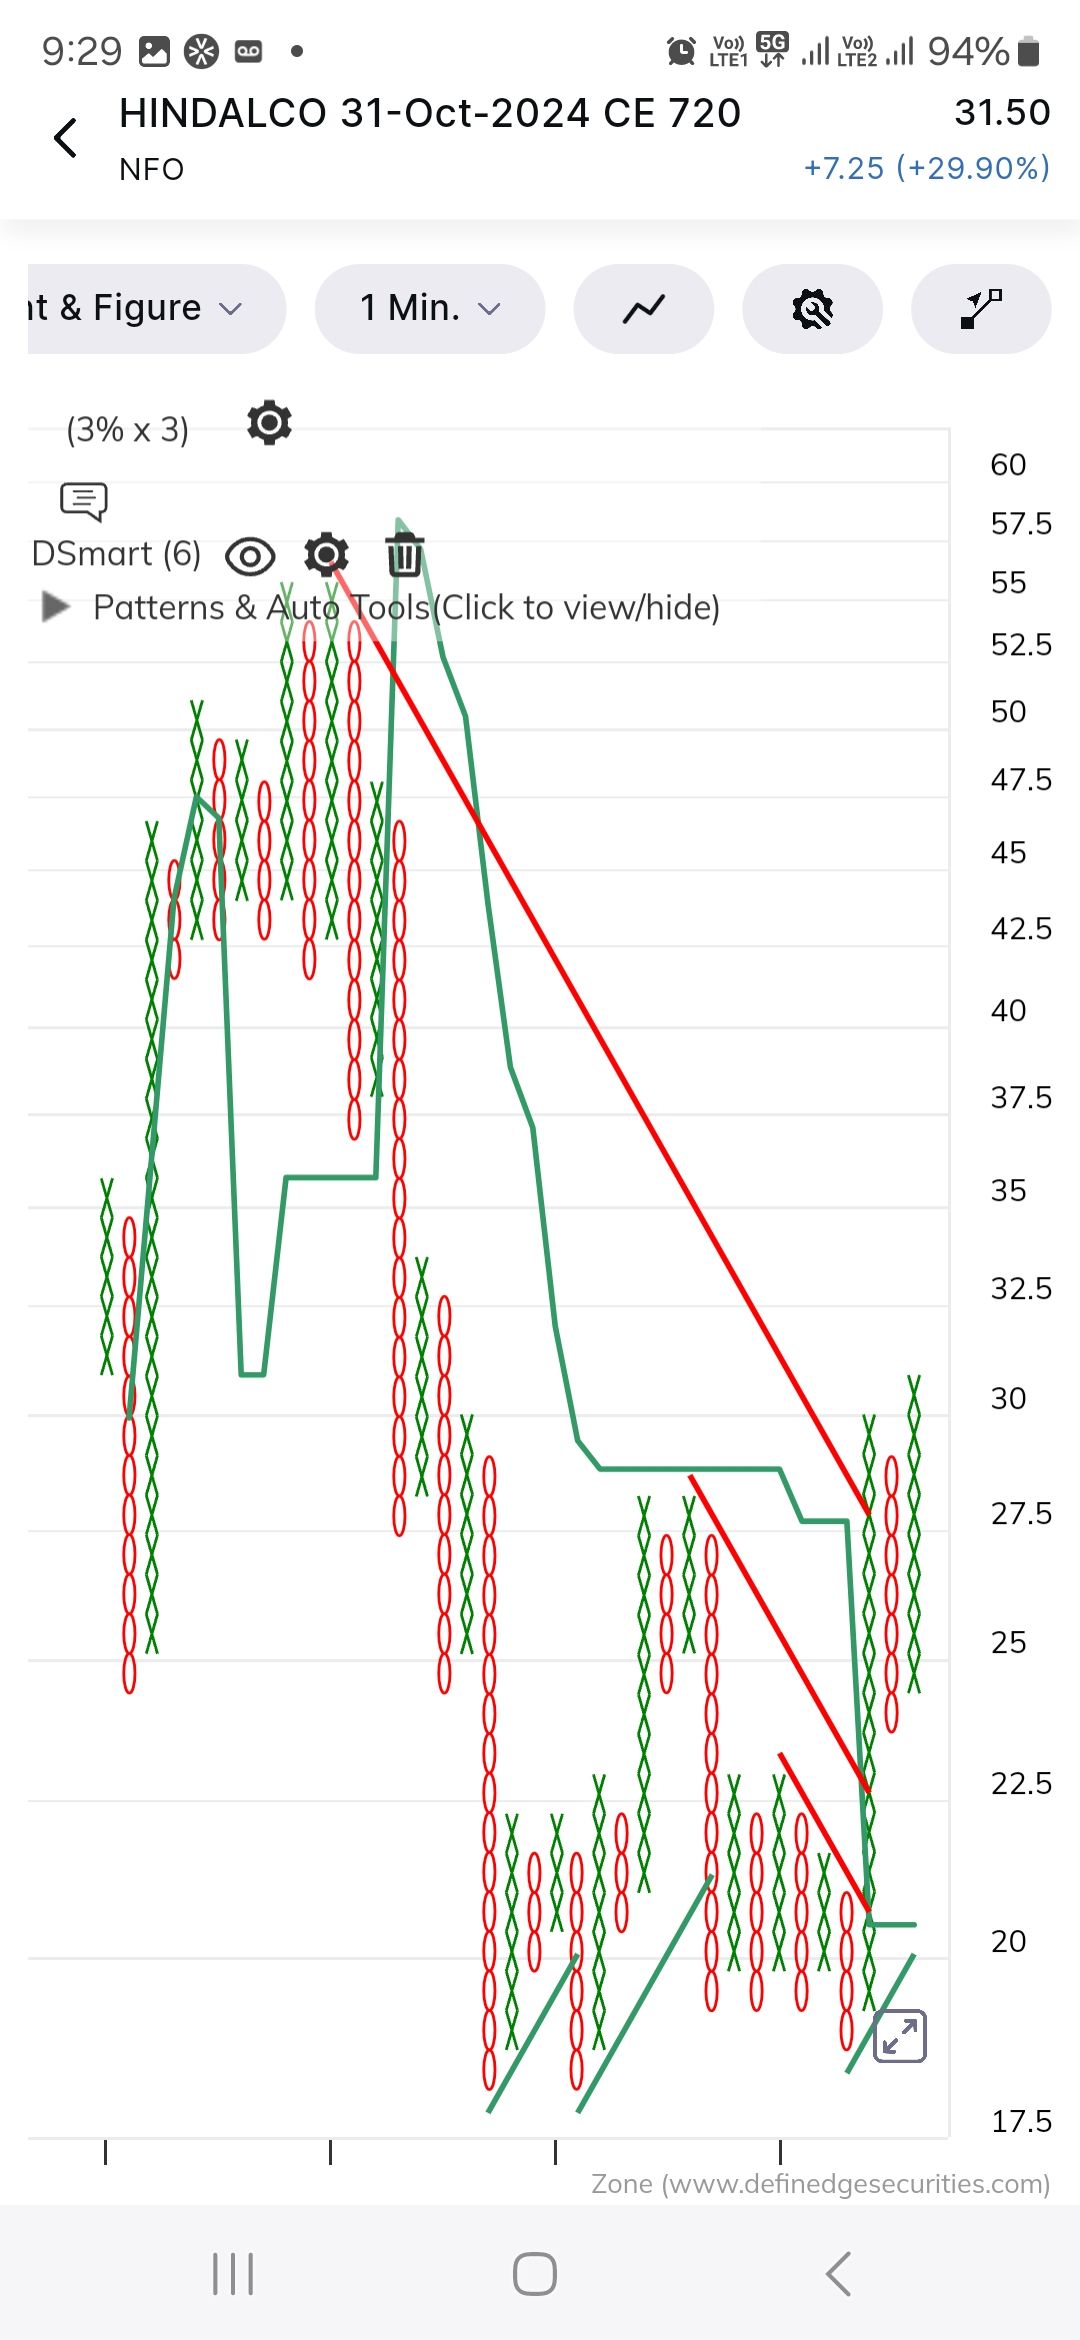
-
Flying stock based on D-smart
Sector breadth neutral
Overall market breadth above moving avg
Low pole follow through above D smart -
38+
-
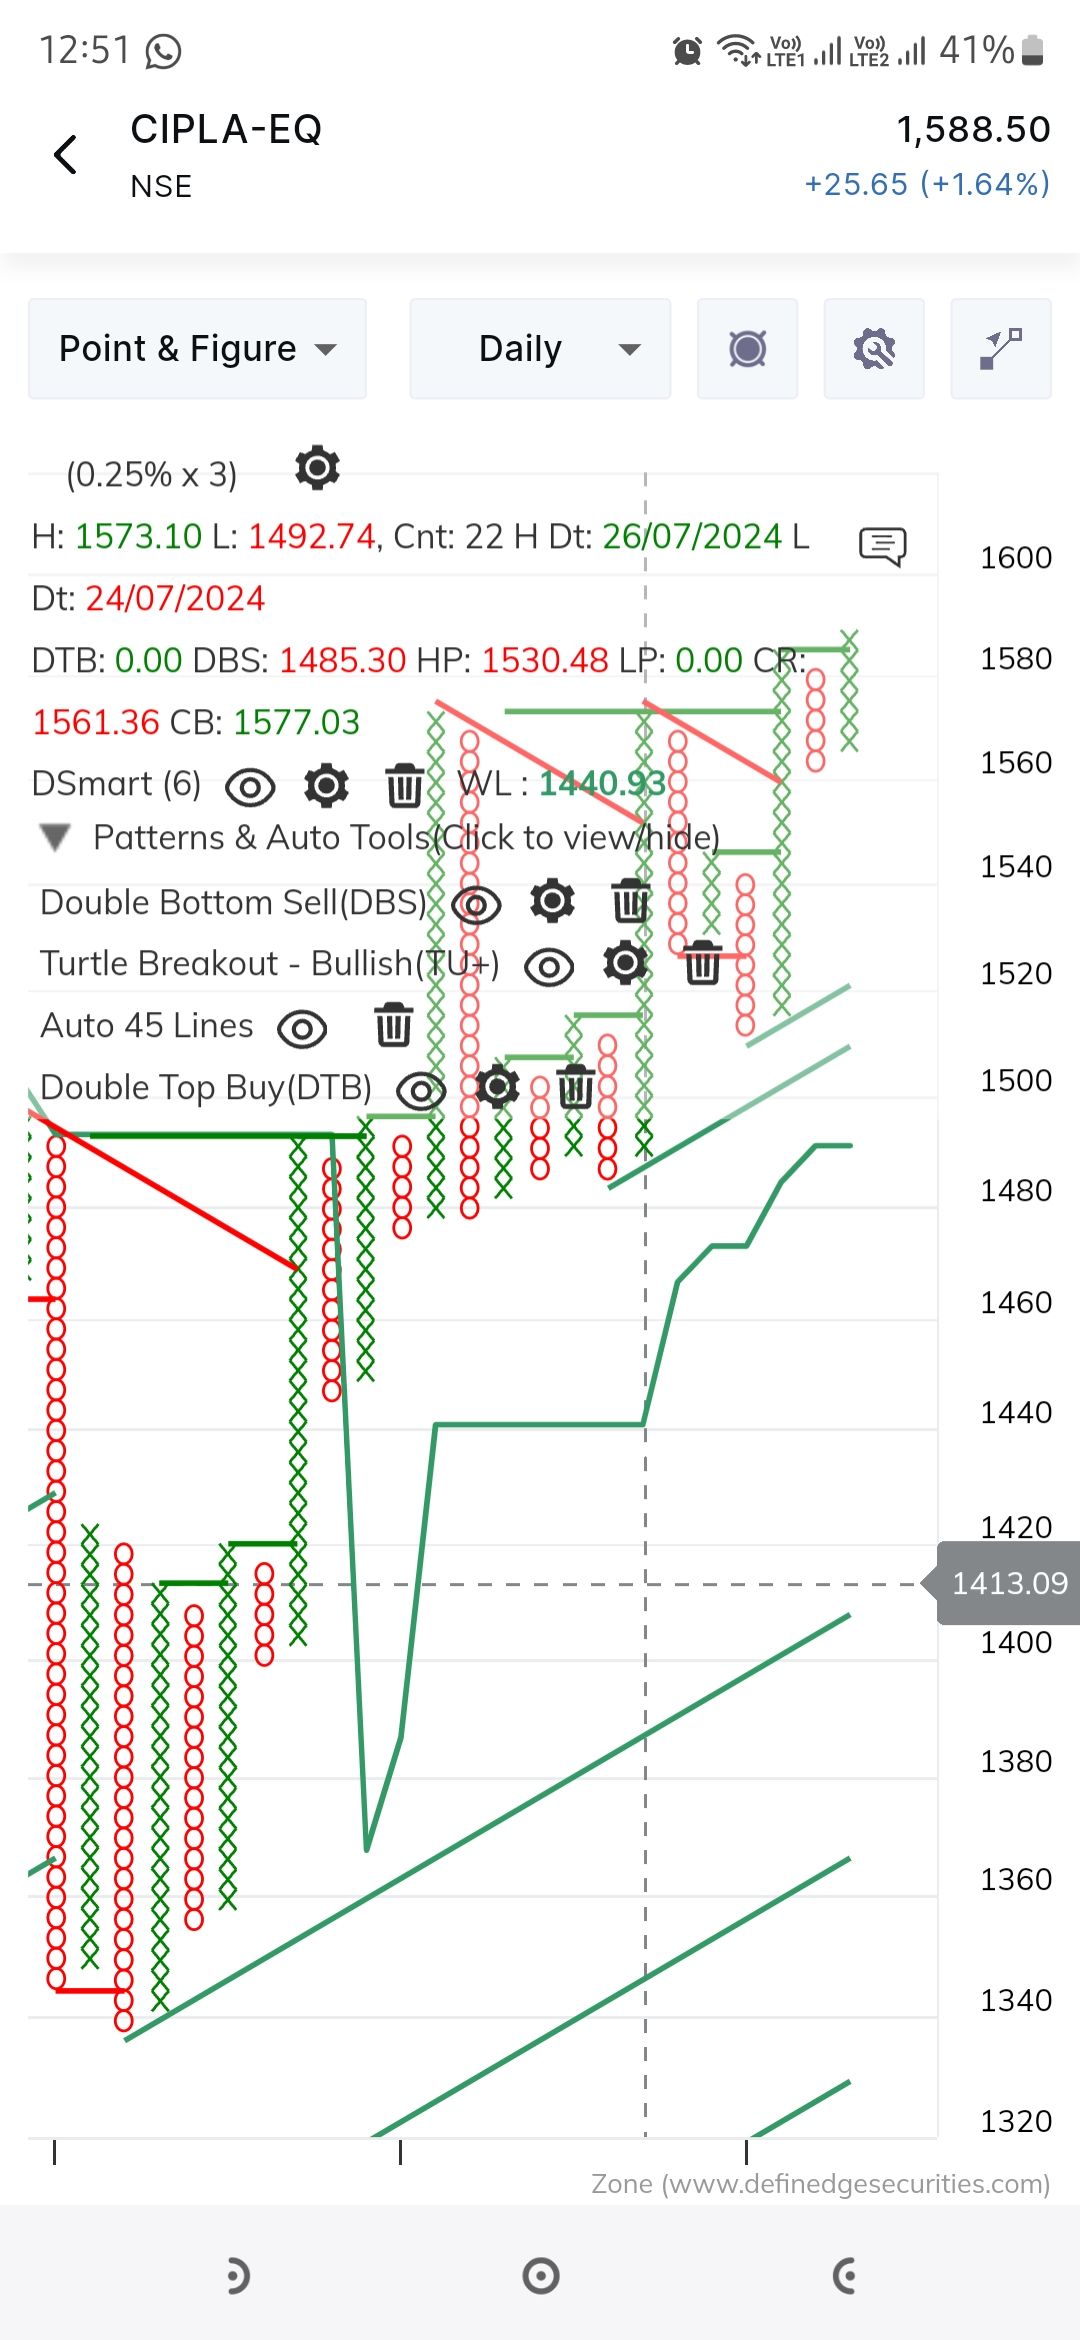
Another one from Pharma pack
Turtle follow through with affordable stop
-
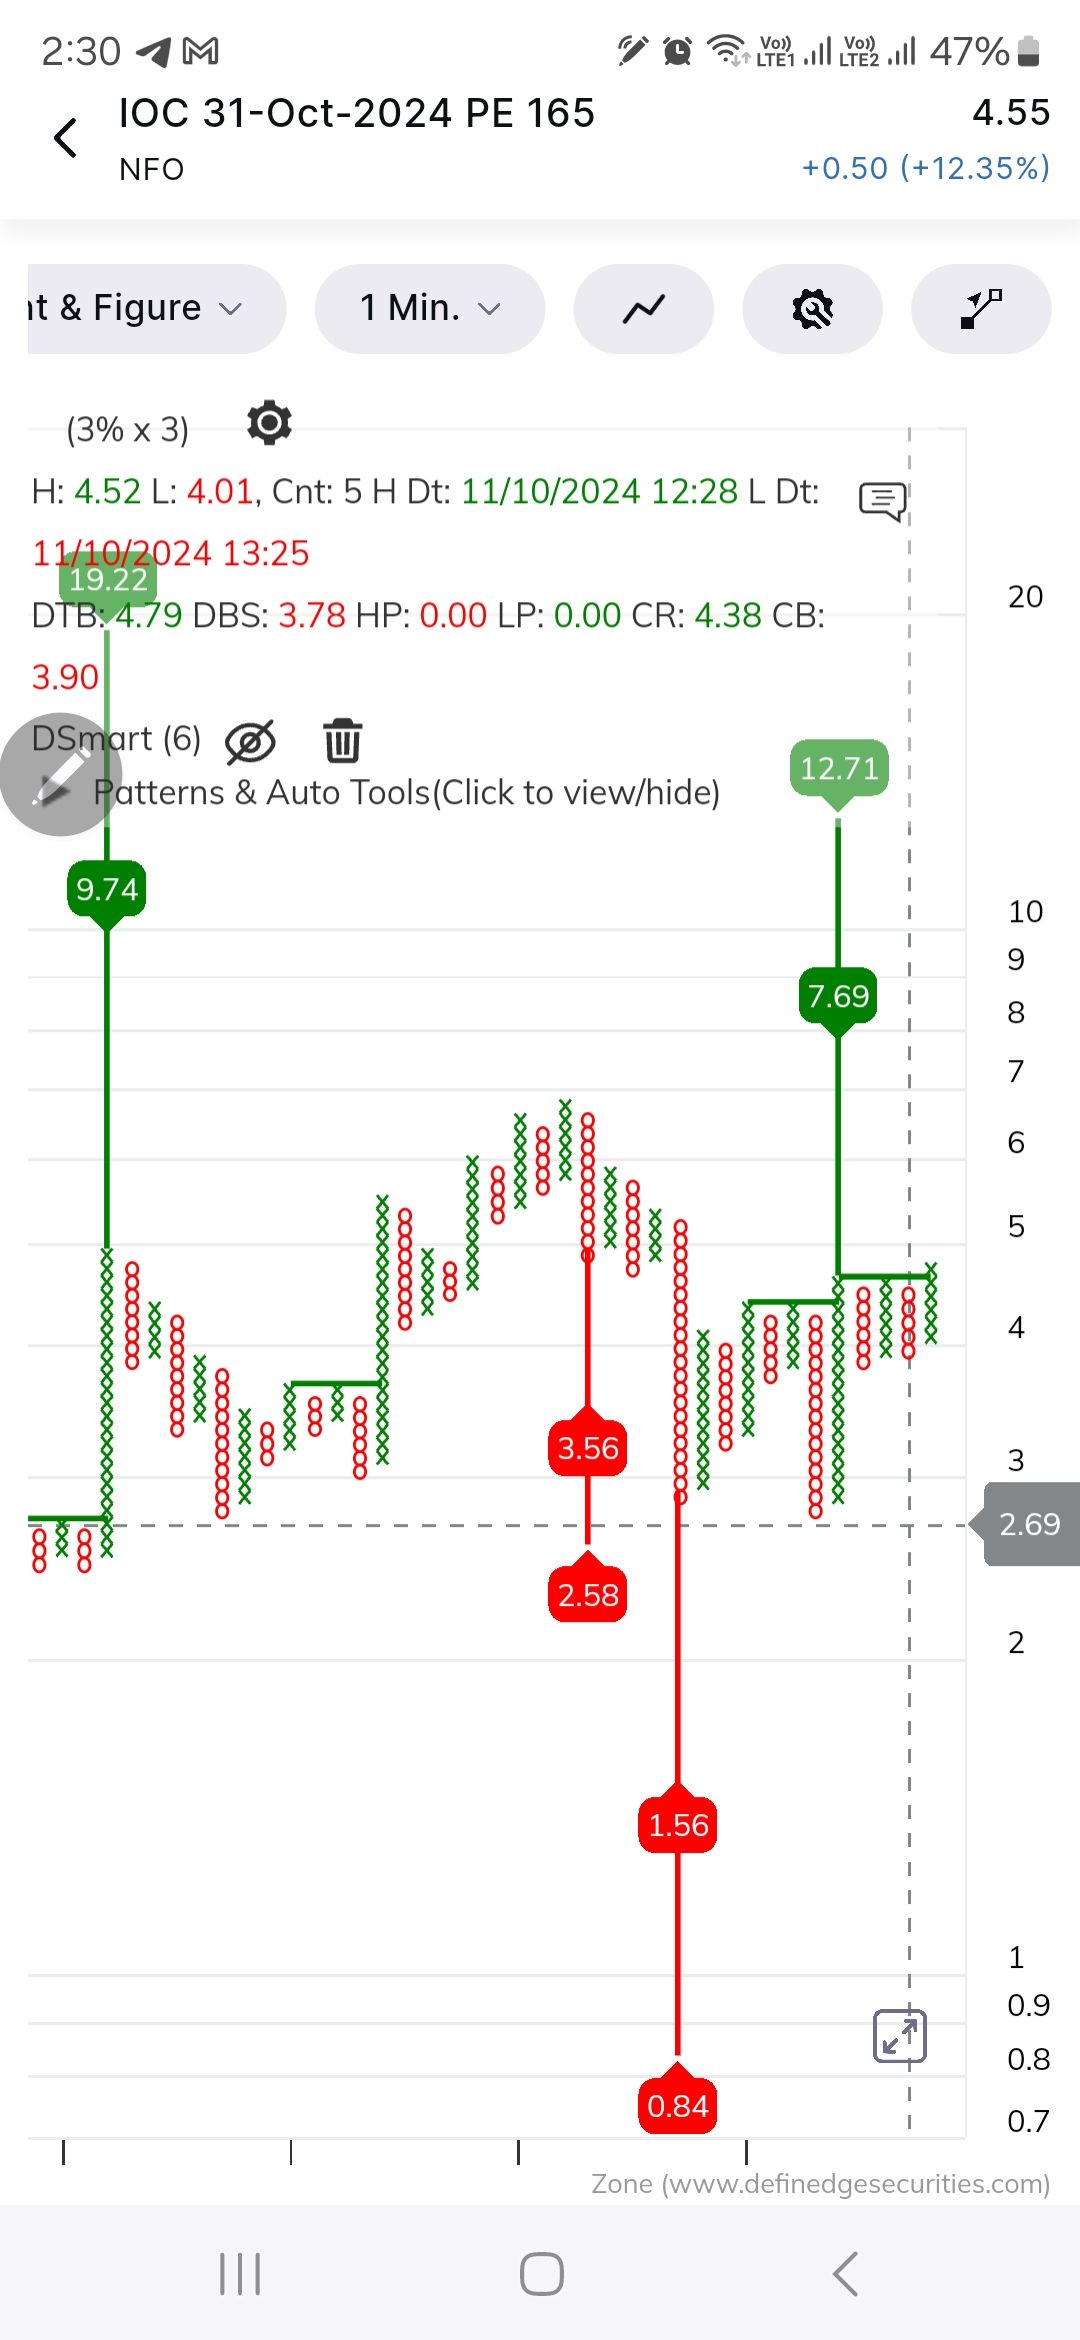
Triple top buy with SL 2.8
-
Up 25% I'll exit half here
-
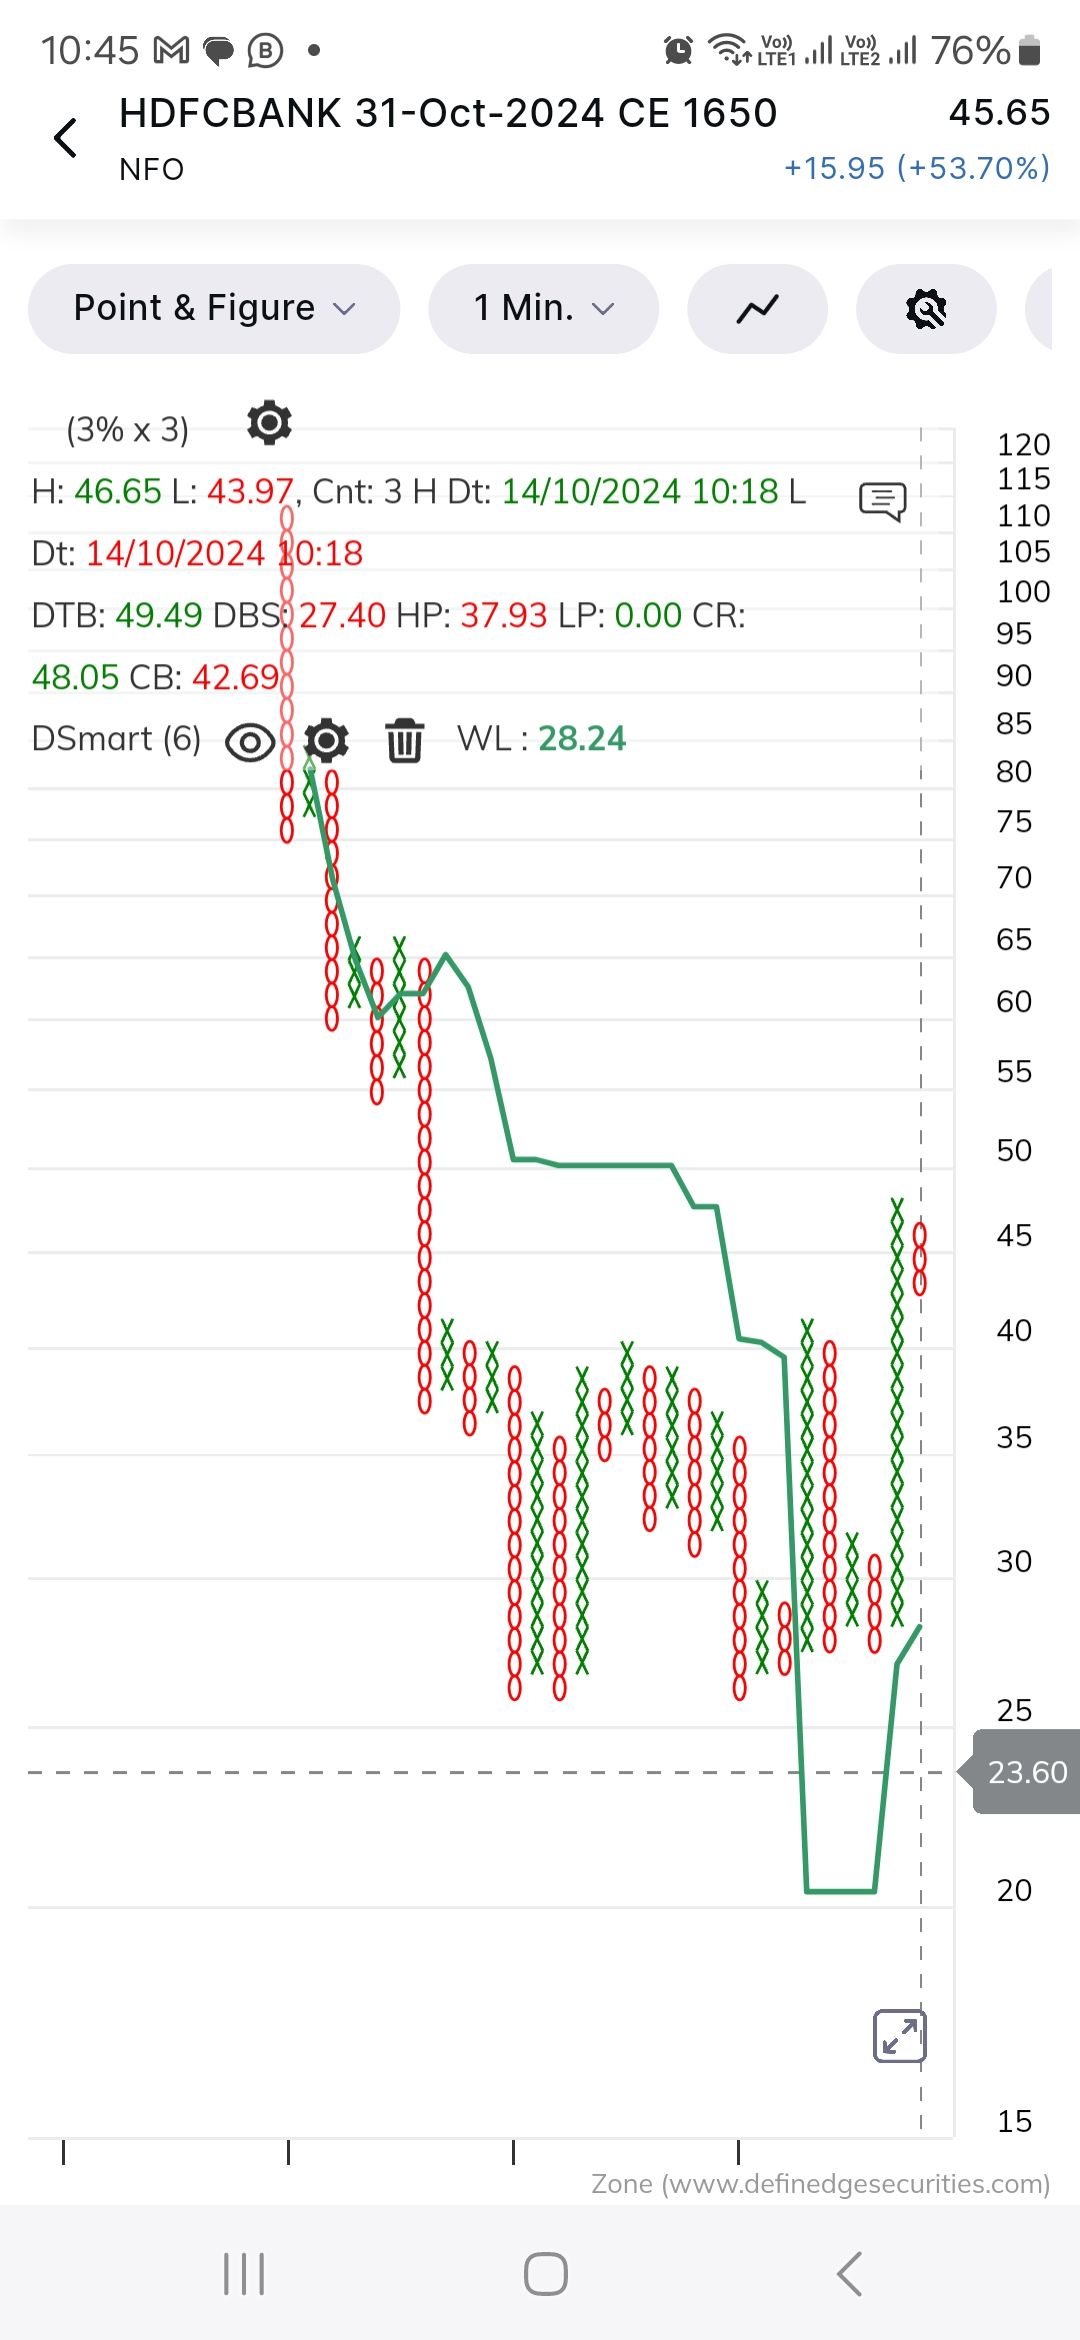 On cash charts we have 4 column triangle breakout and options we have turtle breakout and can trade followthrough
 -
Strong sector
Turtle breakout plus follow through
Along with multi column brrakout
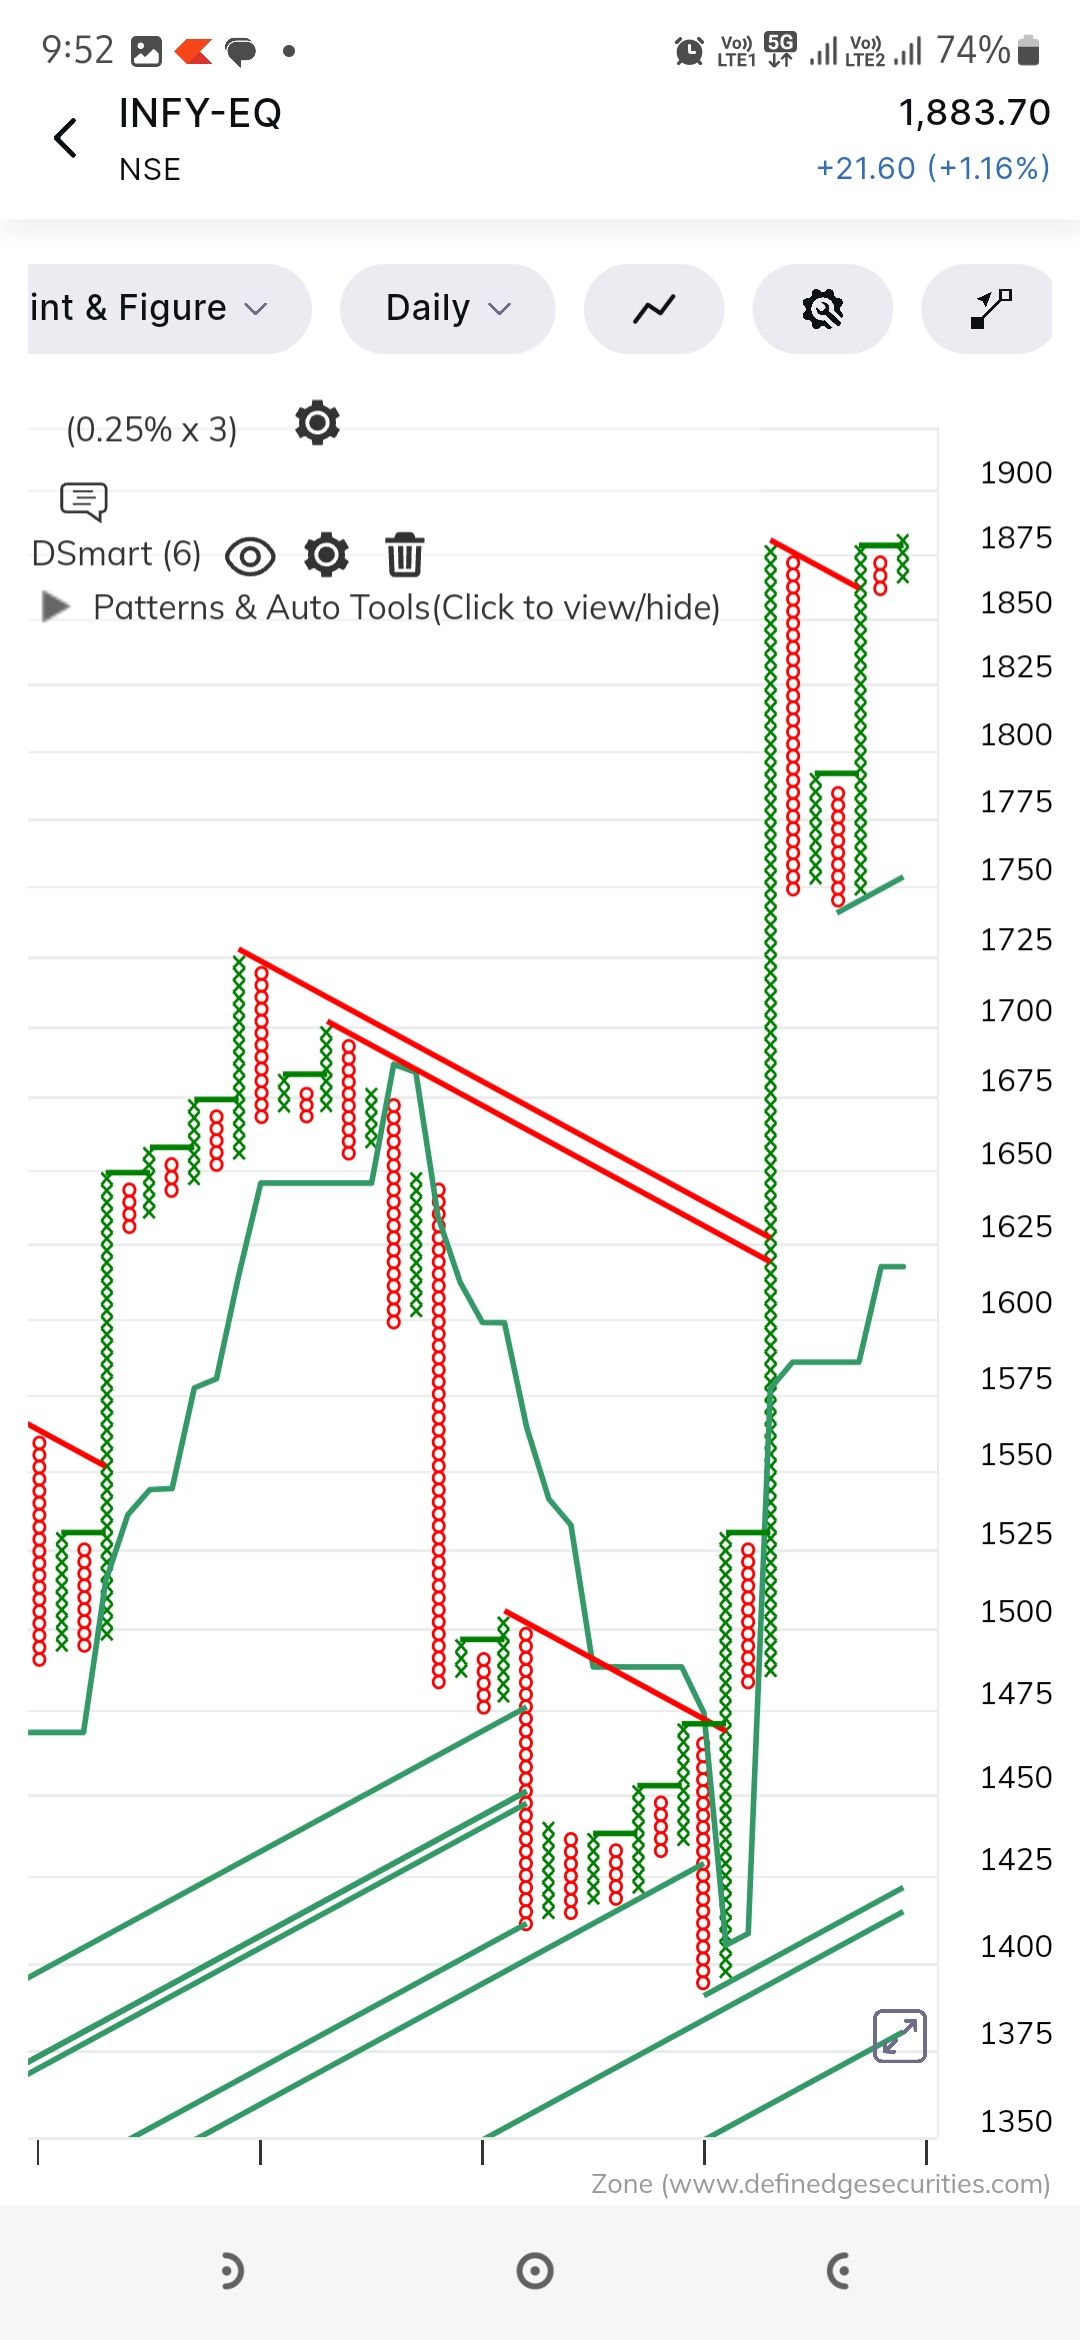
-
59+
-
Hits 2R today
-
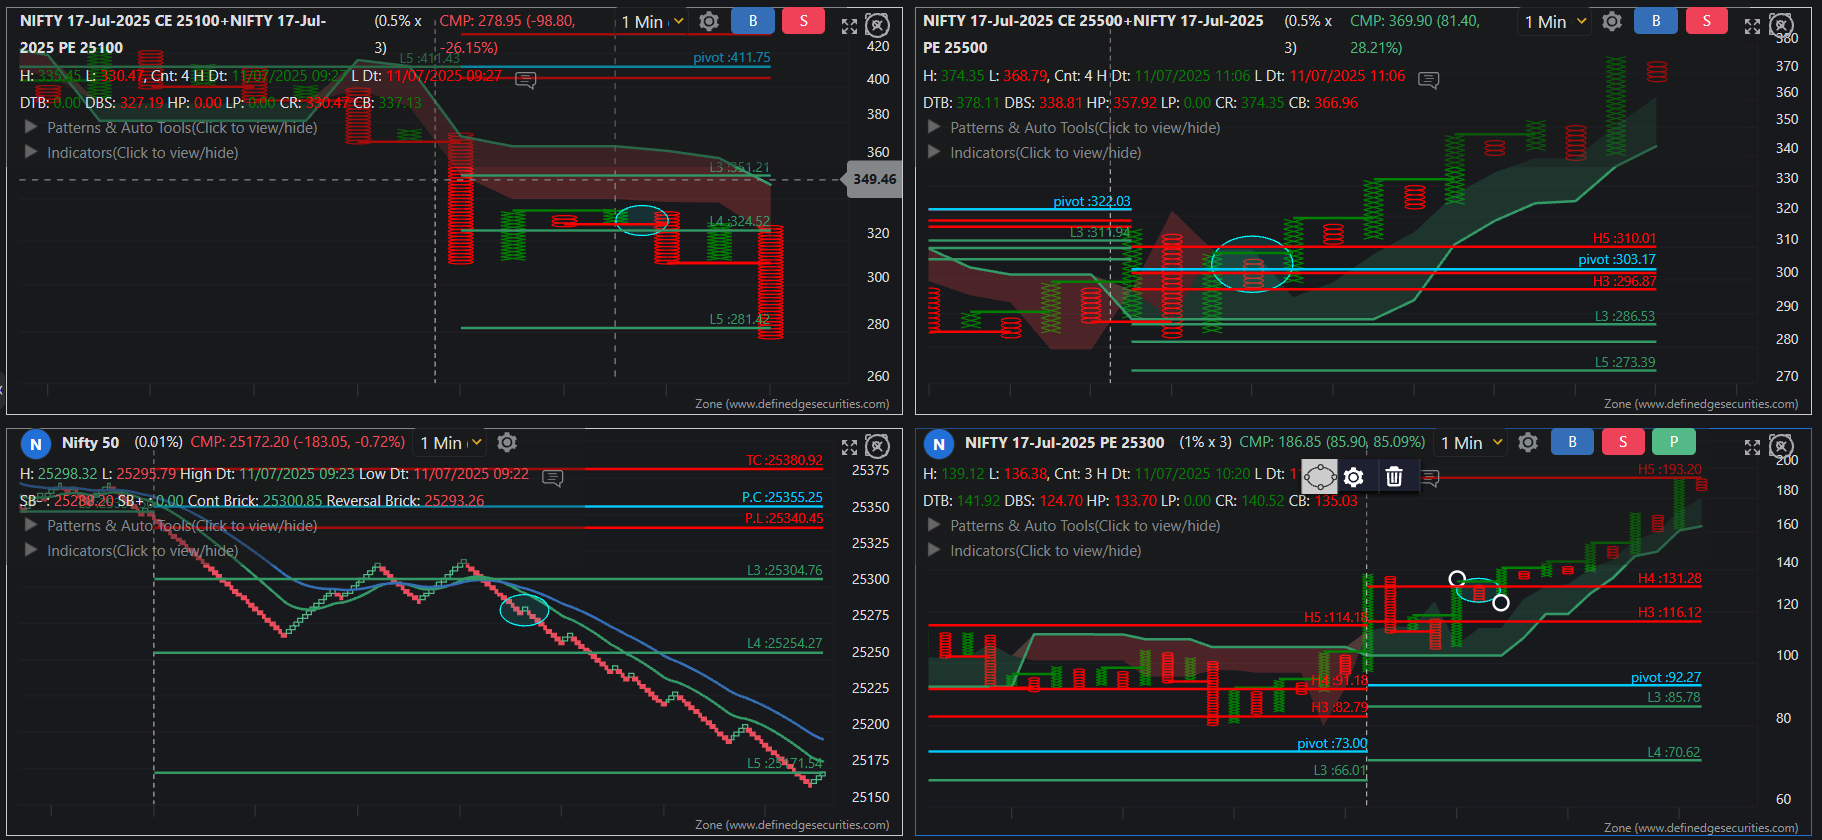
PE move from H4 to H5 -
Strong chart from strong sector
Turtle follow through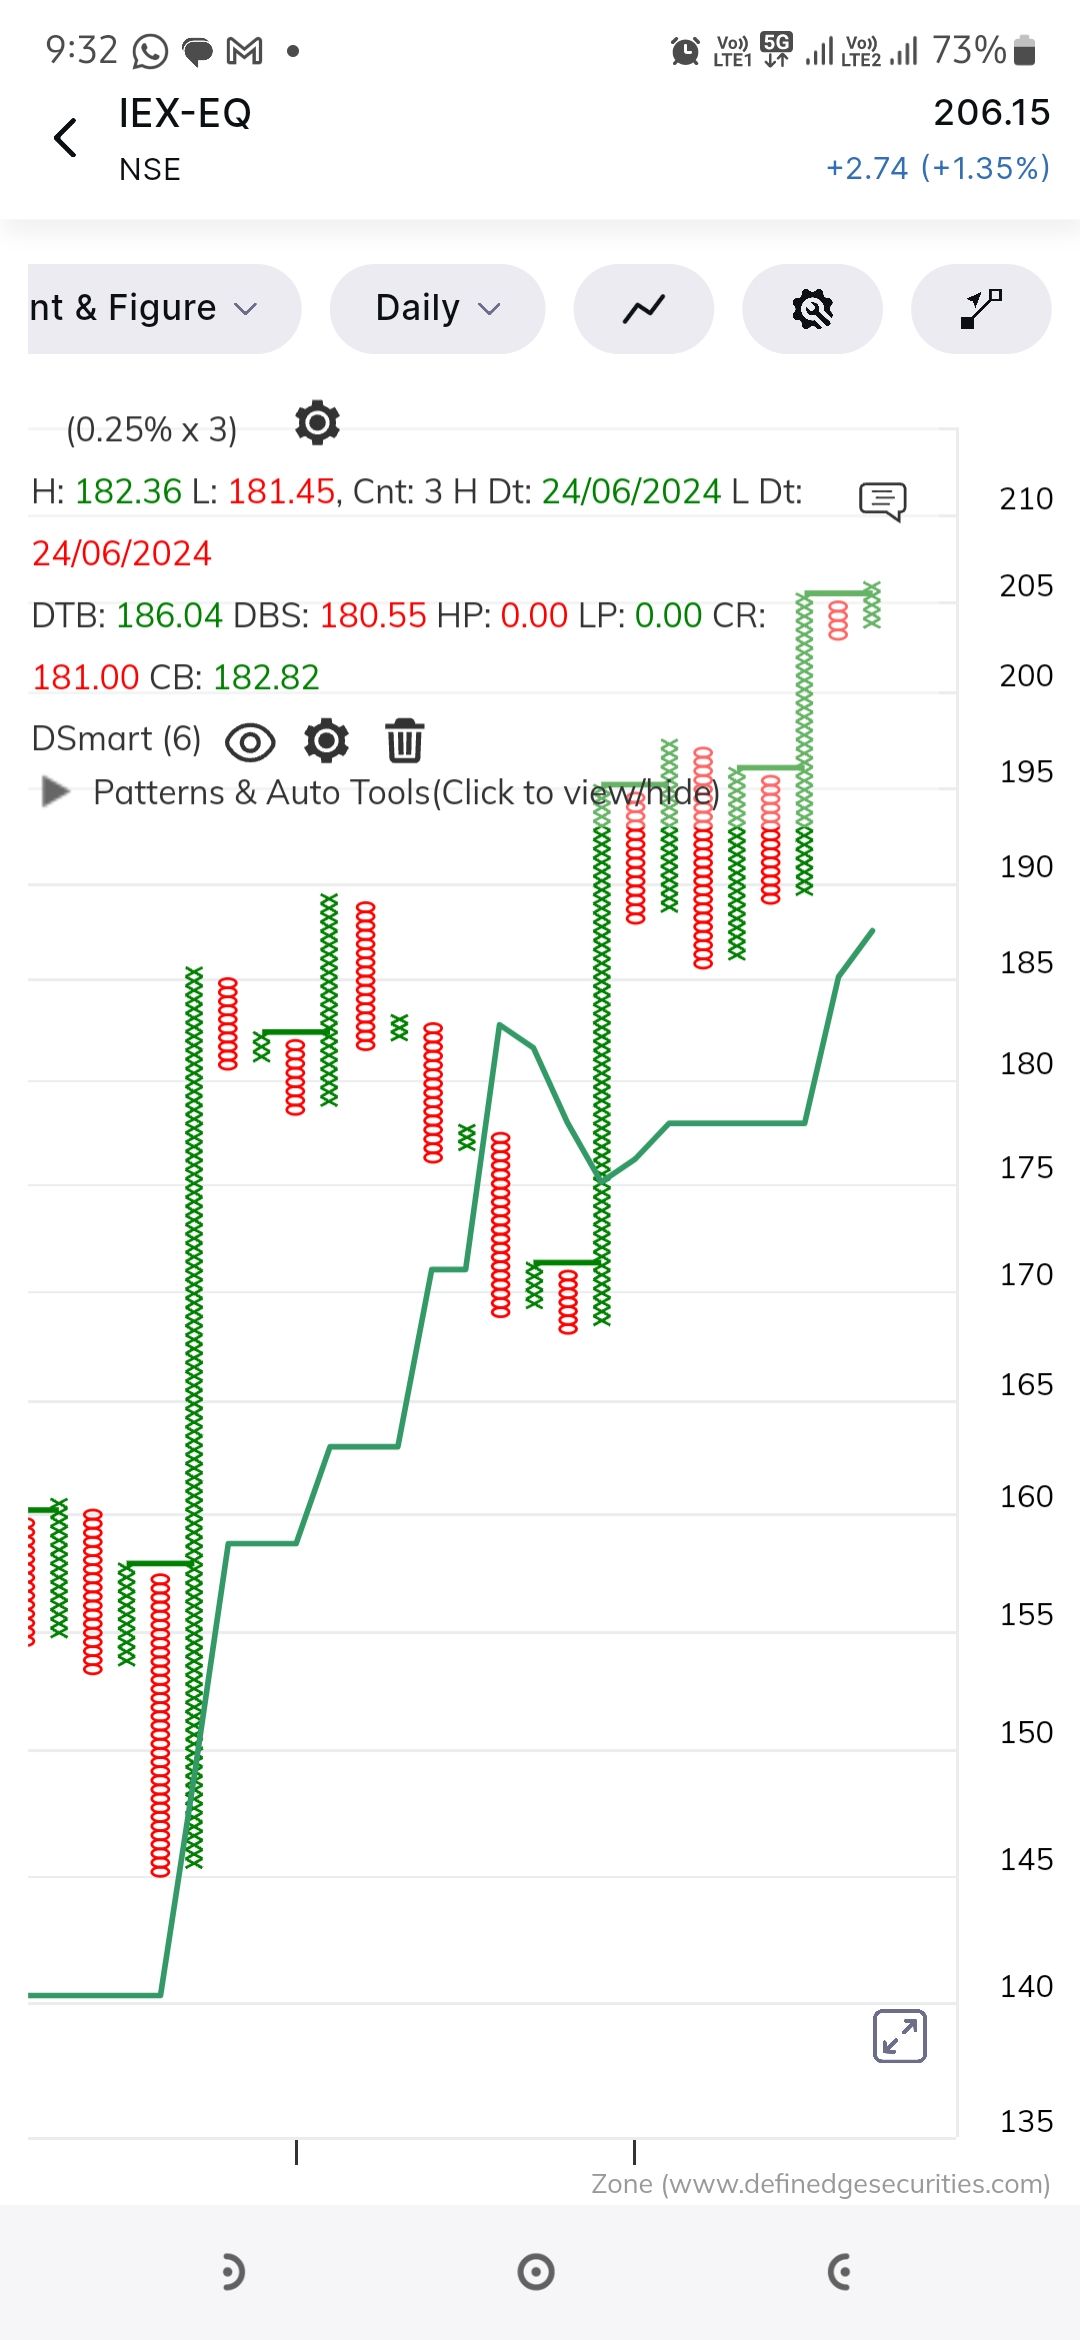
-
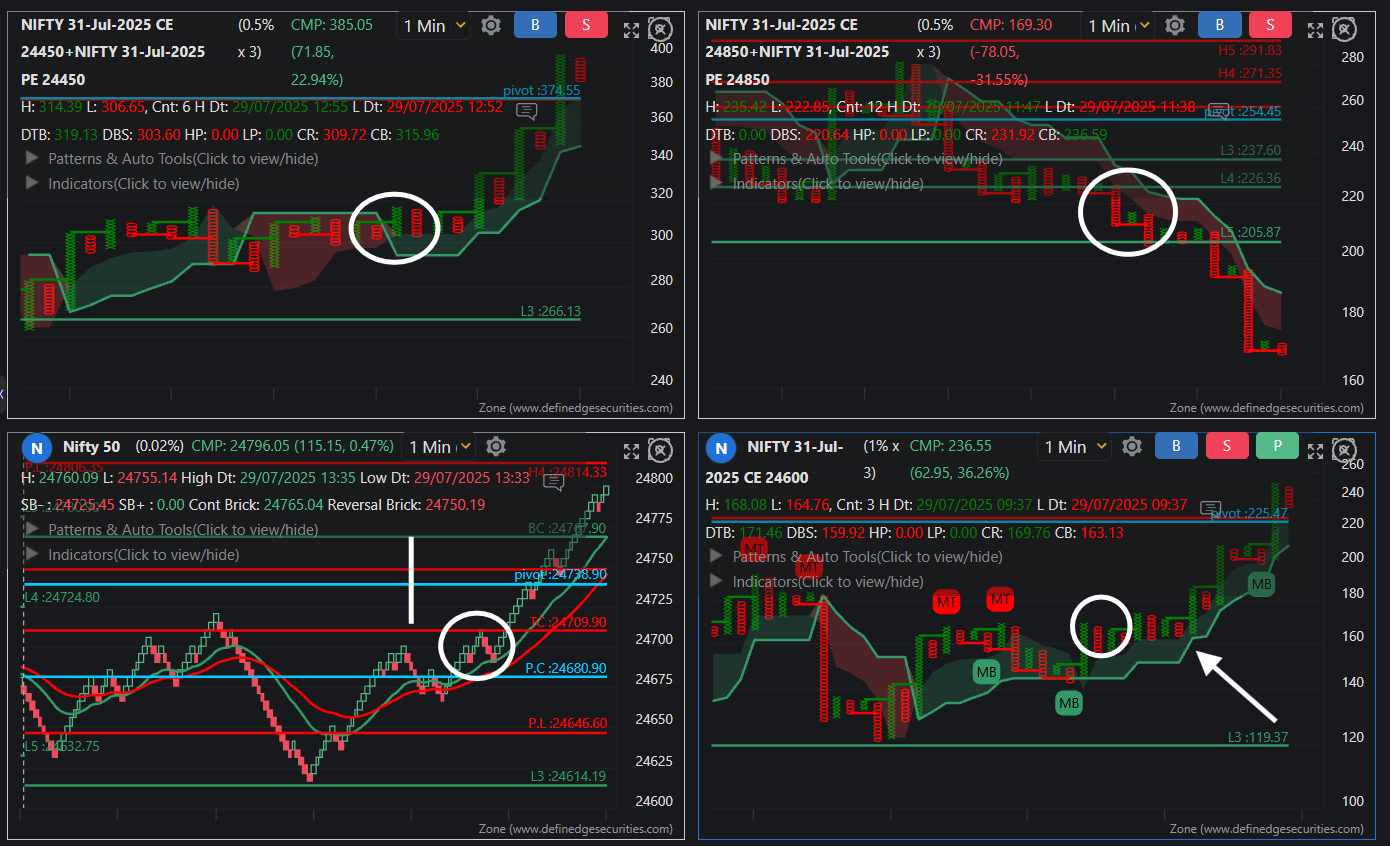
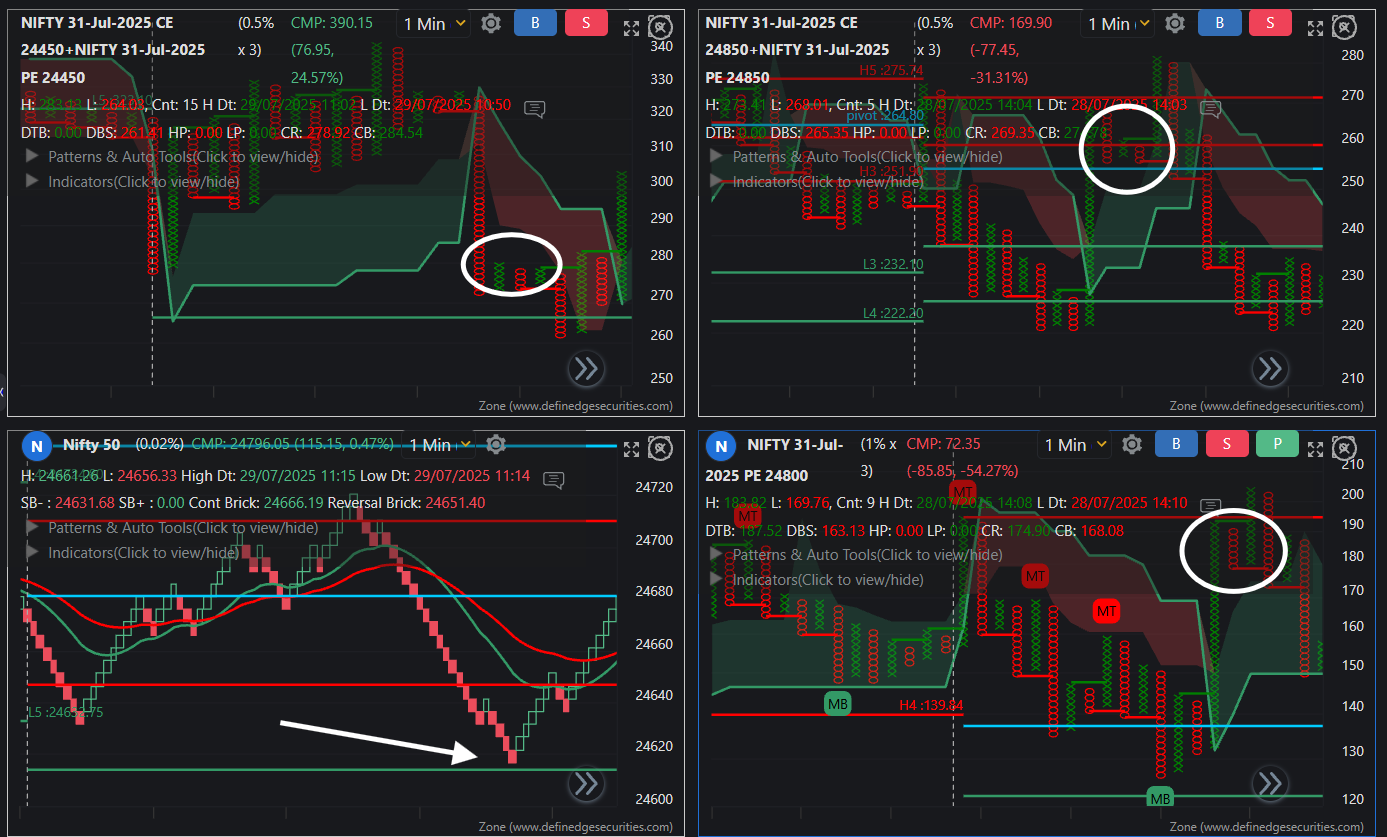
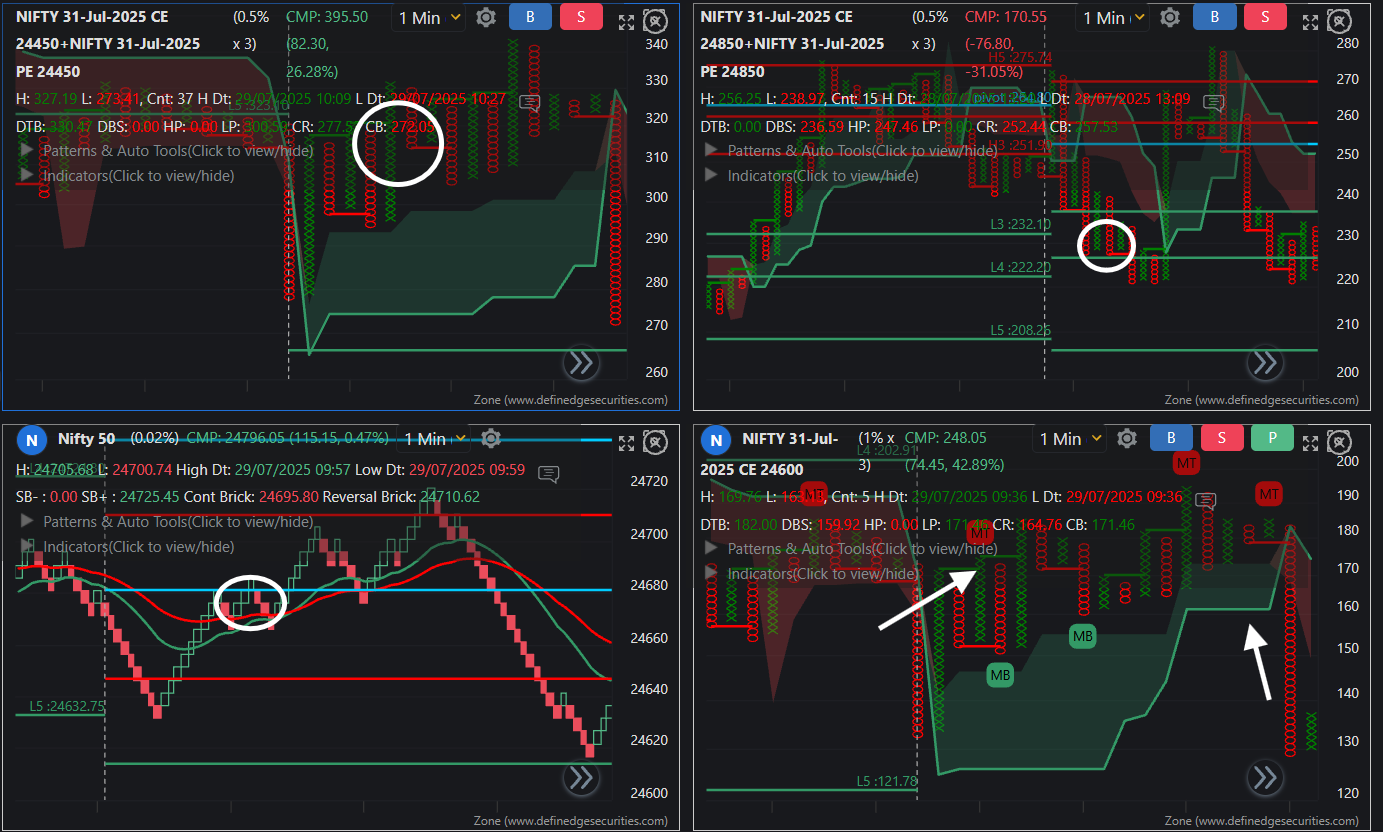 Morning had CE trade from 178 to TSL 160, PE trade could have been avoided as Nifty was right at L3 support, Afternoon had another CE trade from 177 to 252
 -
211++
-
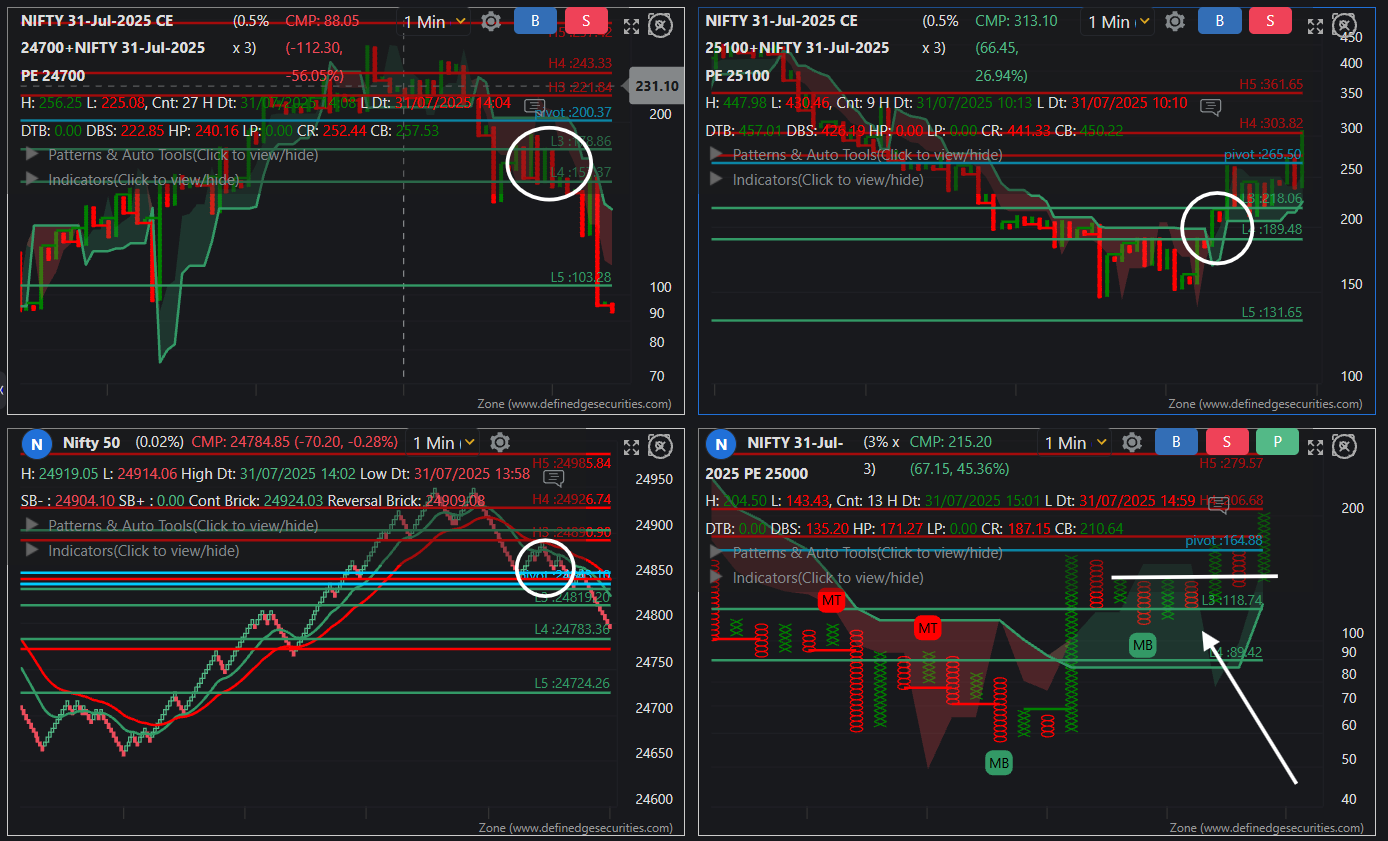 Major move in Nifty changed Straddle strikes, second half PE trade, Nifty from h3 to l3, PE had Triple top buy at 148 with H3 at 177 and H4 at 206
 -
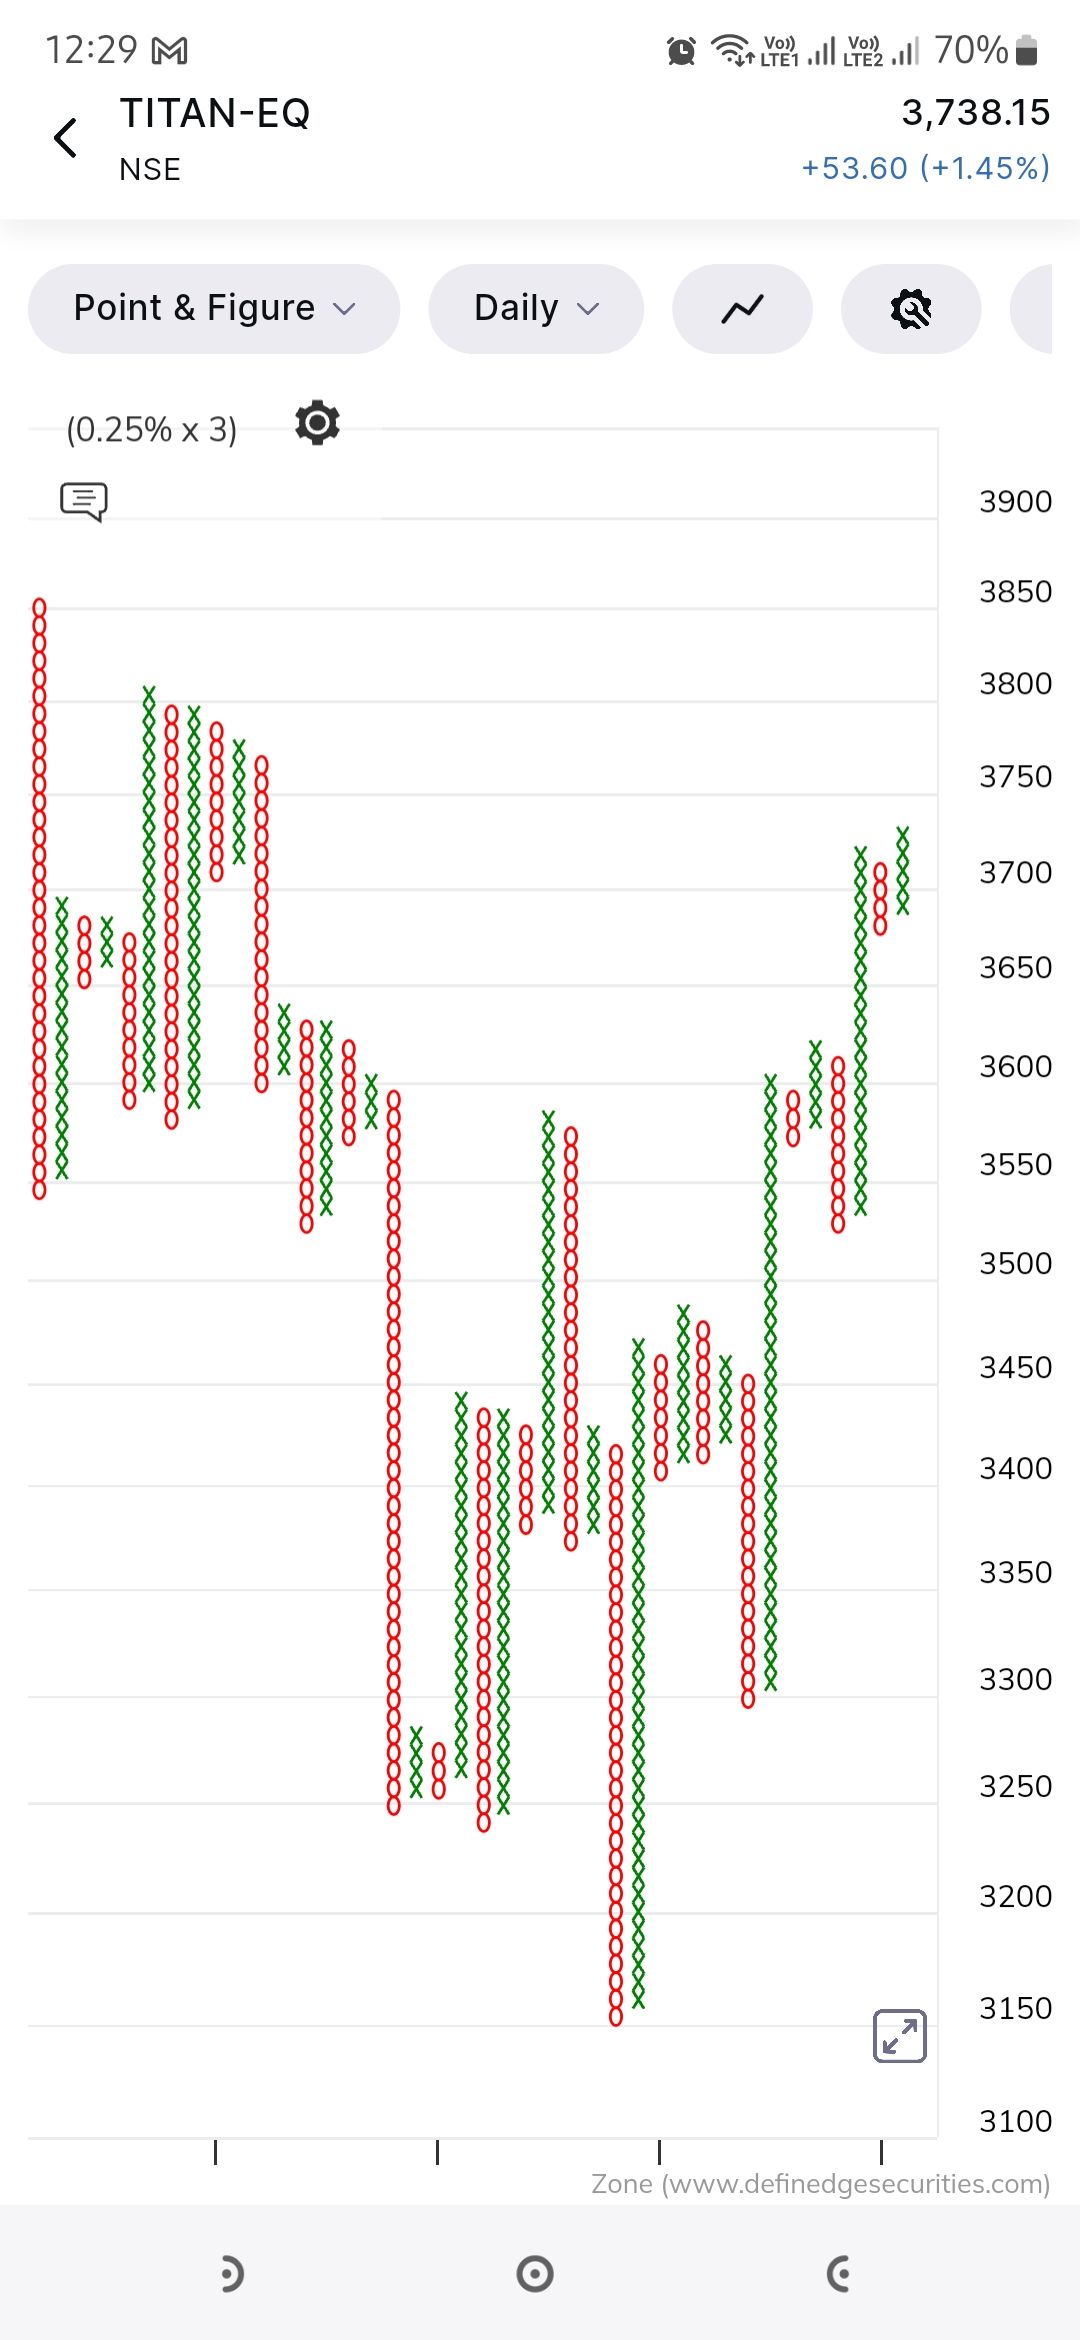
Titan broadening follow through pattern
-
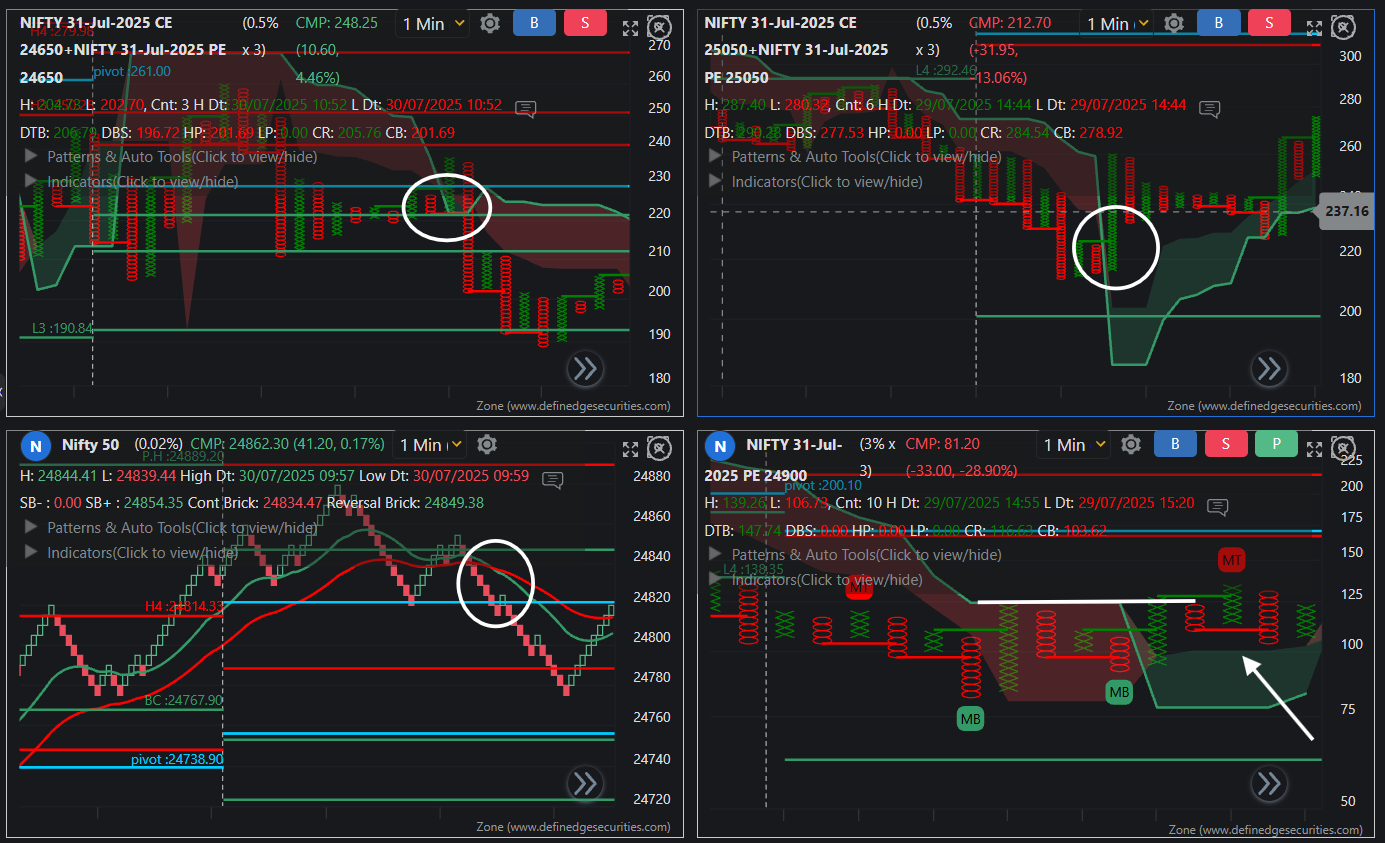
-
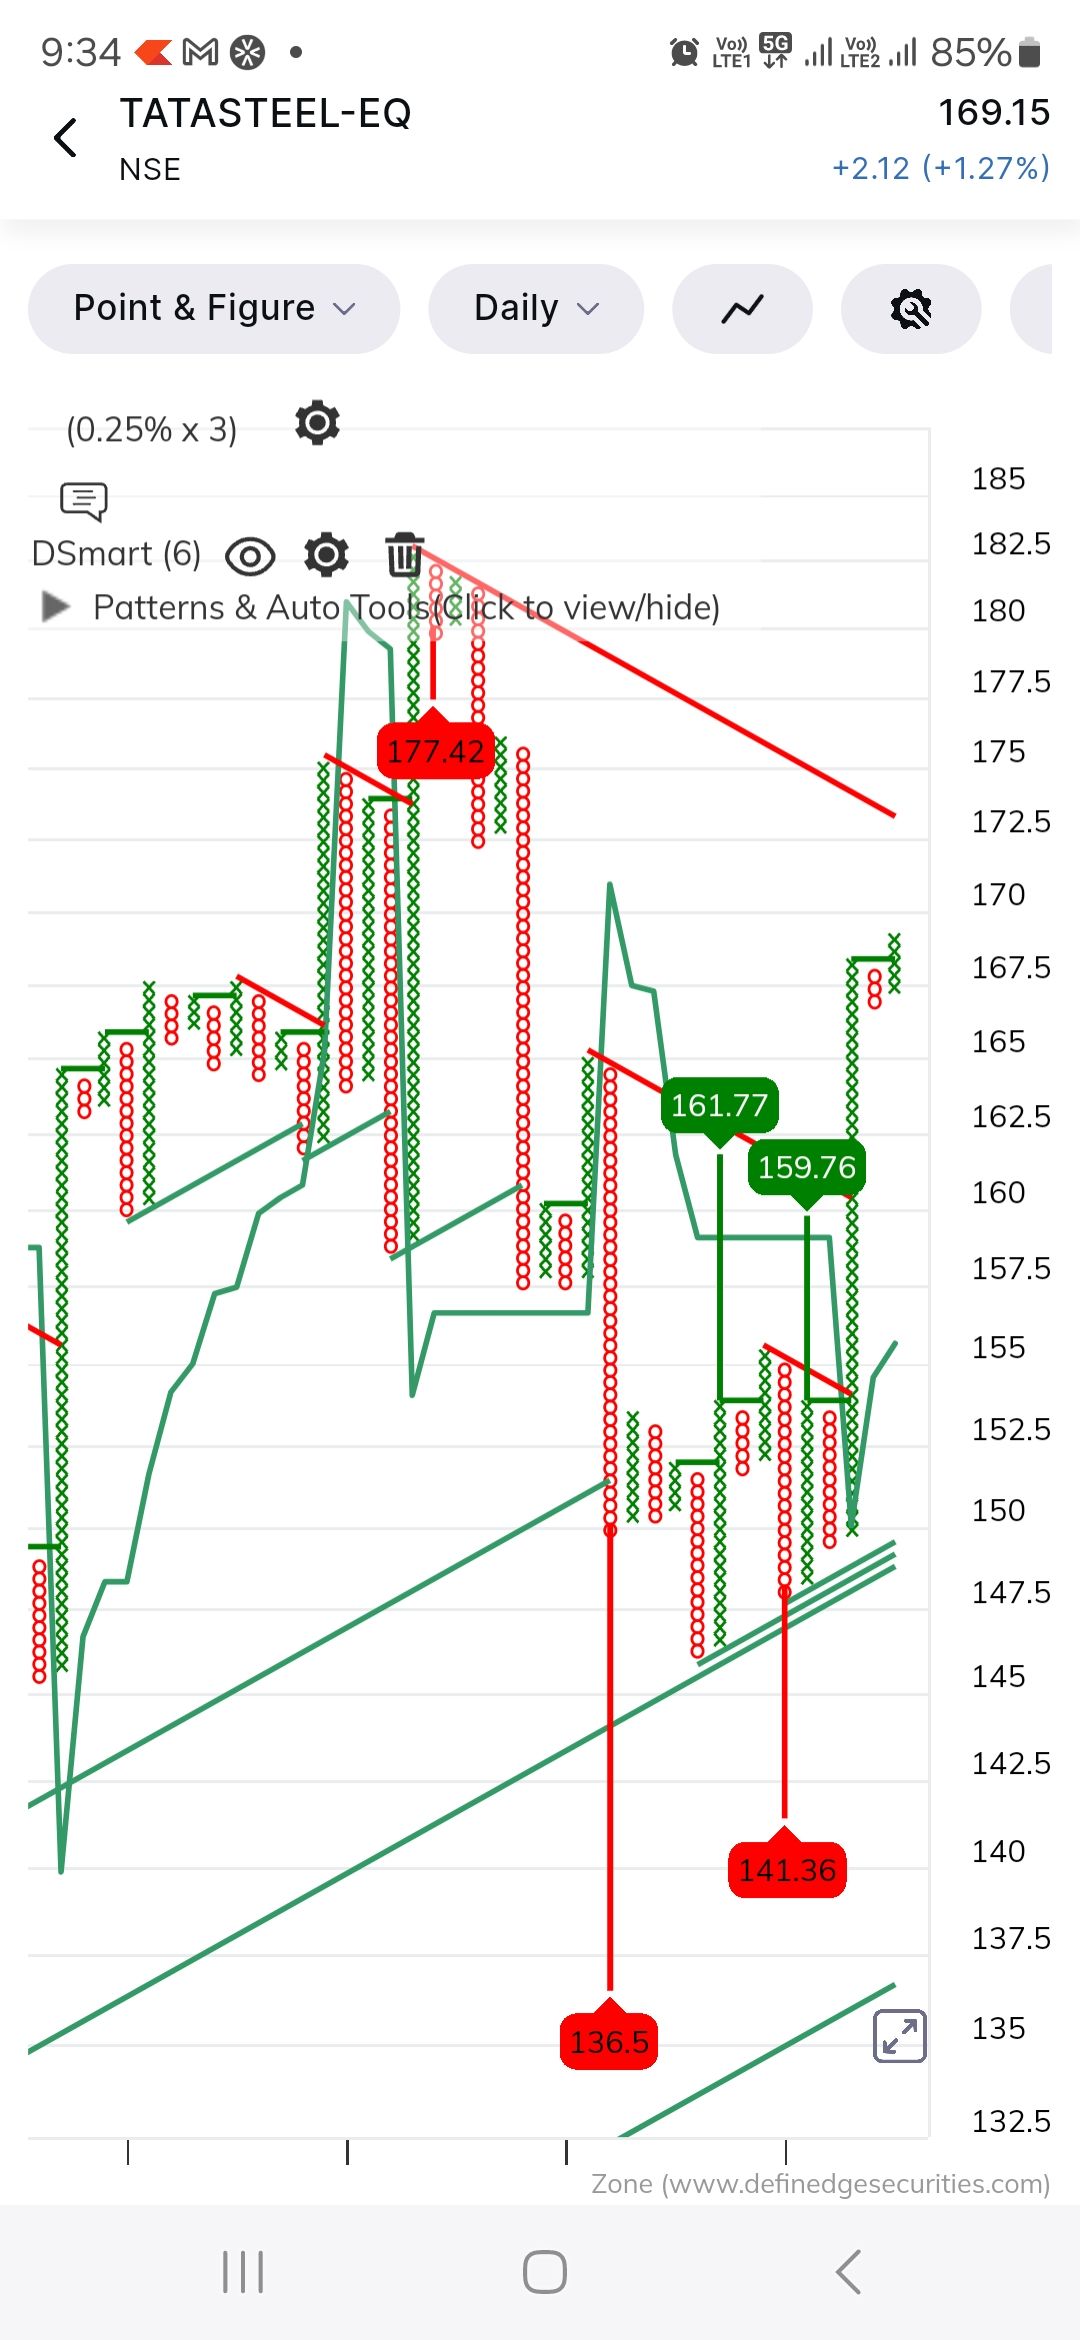
45 degree trendline breakout and followthrough -
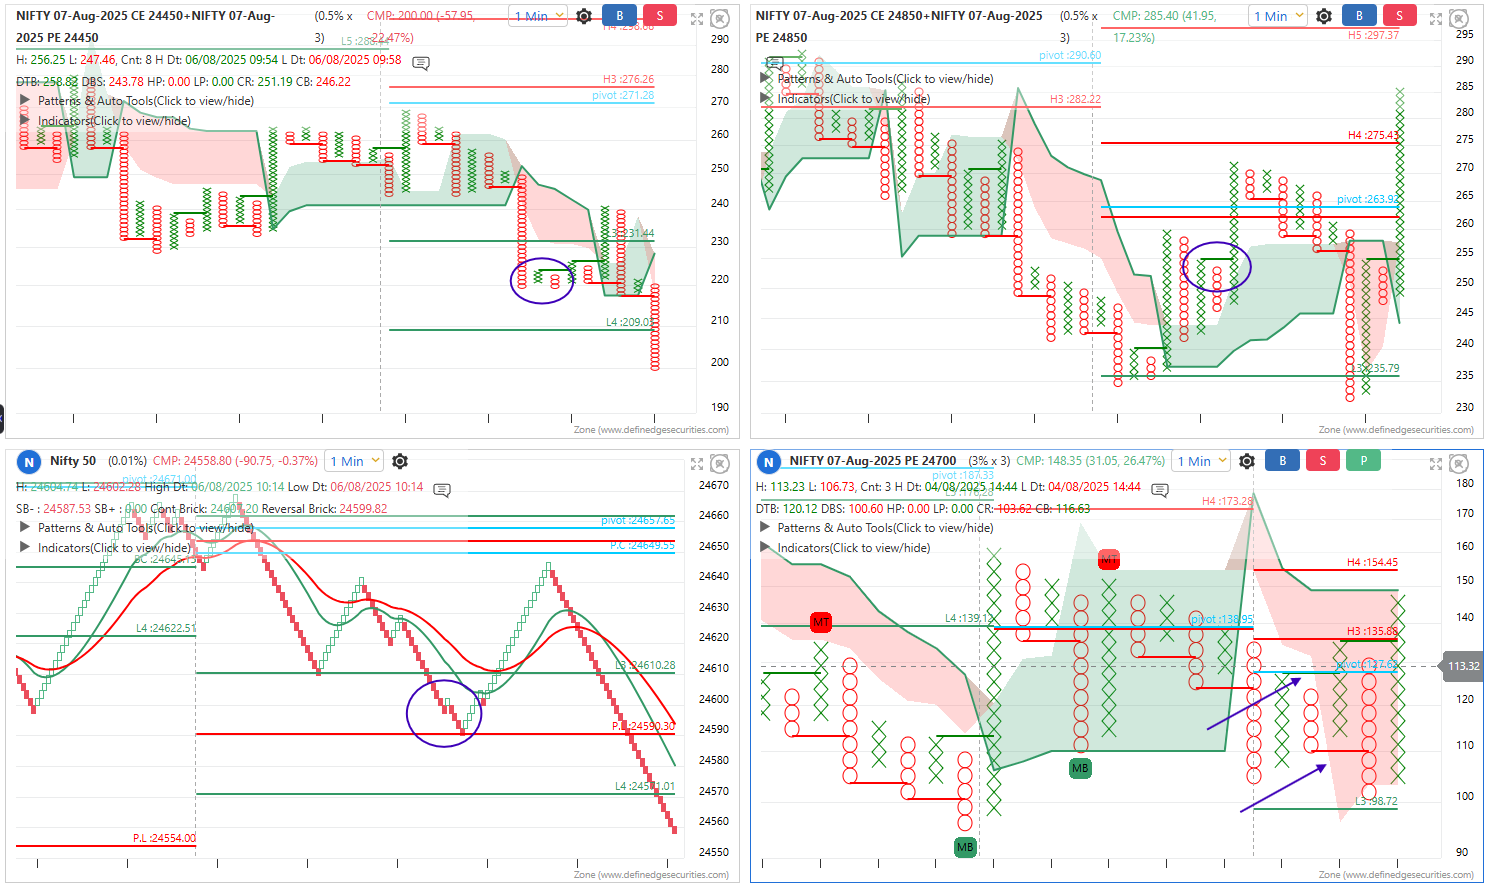 We get a trade on PE side but it first hits SL and then goes towards tgt
 -
Triple top buy FT and 100% pole FT
-
-
Jublfood looks good above 680
200 straddle 23/07
200 straddle 25/07
Cash trade IIFLSEC
 Beyond Premium: 21 Questions Every Short Straddle Trader Must Ask
200 straddle 01/08
Cash trade IIFLSEC
Strategy Ranker in Rzone
200 straddle 04/08
Indigo looks good above 4863
Drawings on charts
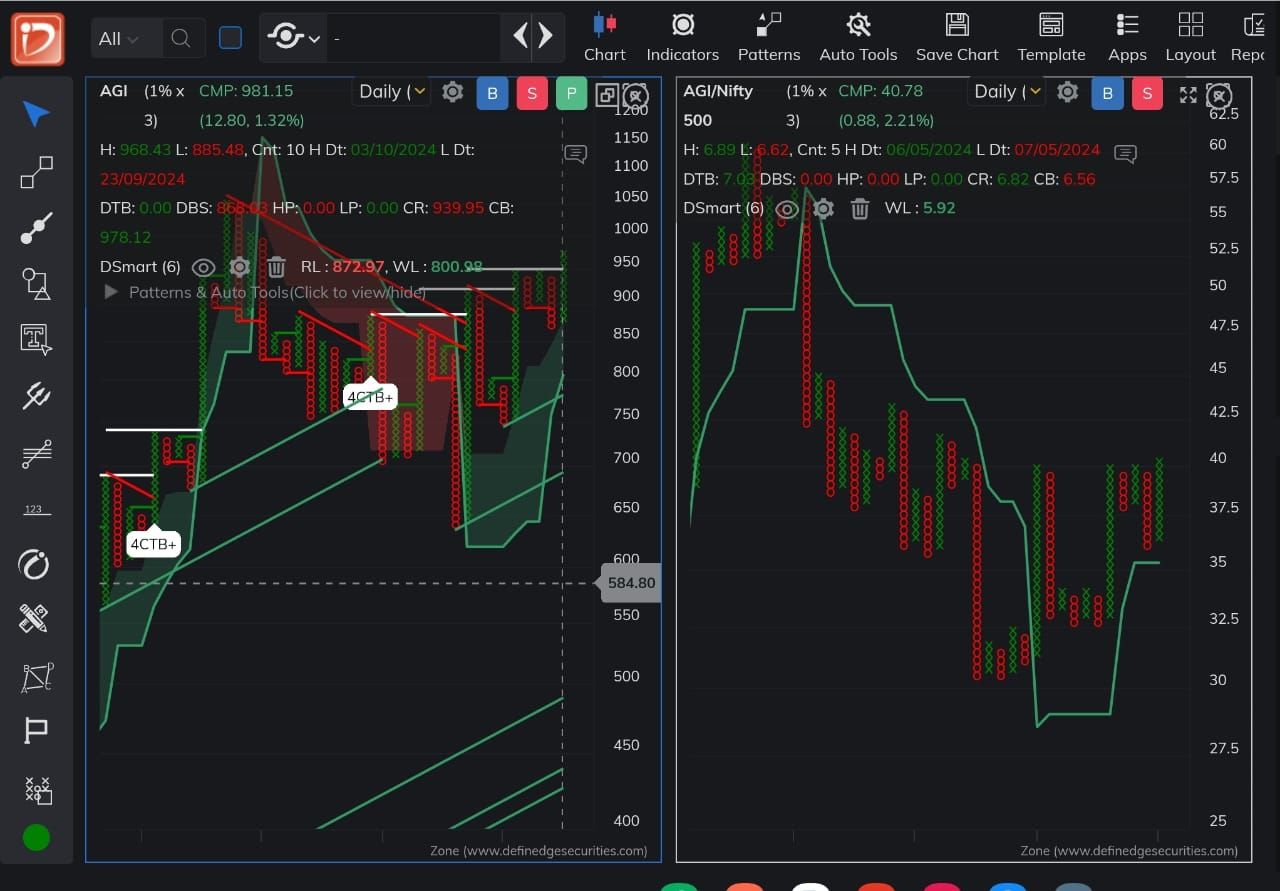
AGI looks good above 980
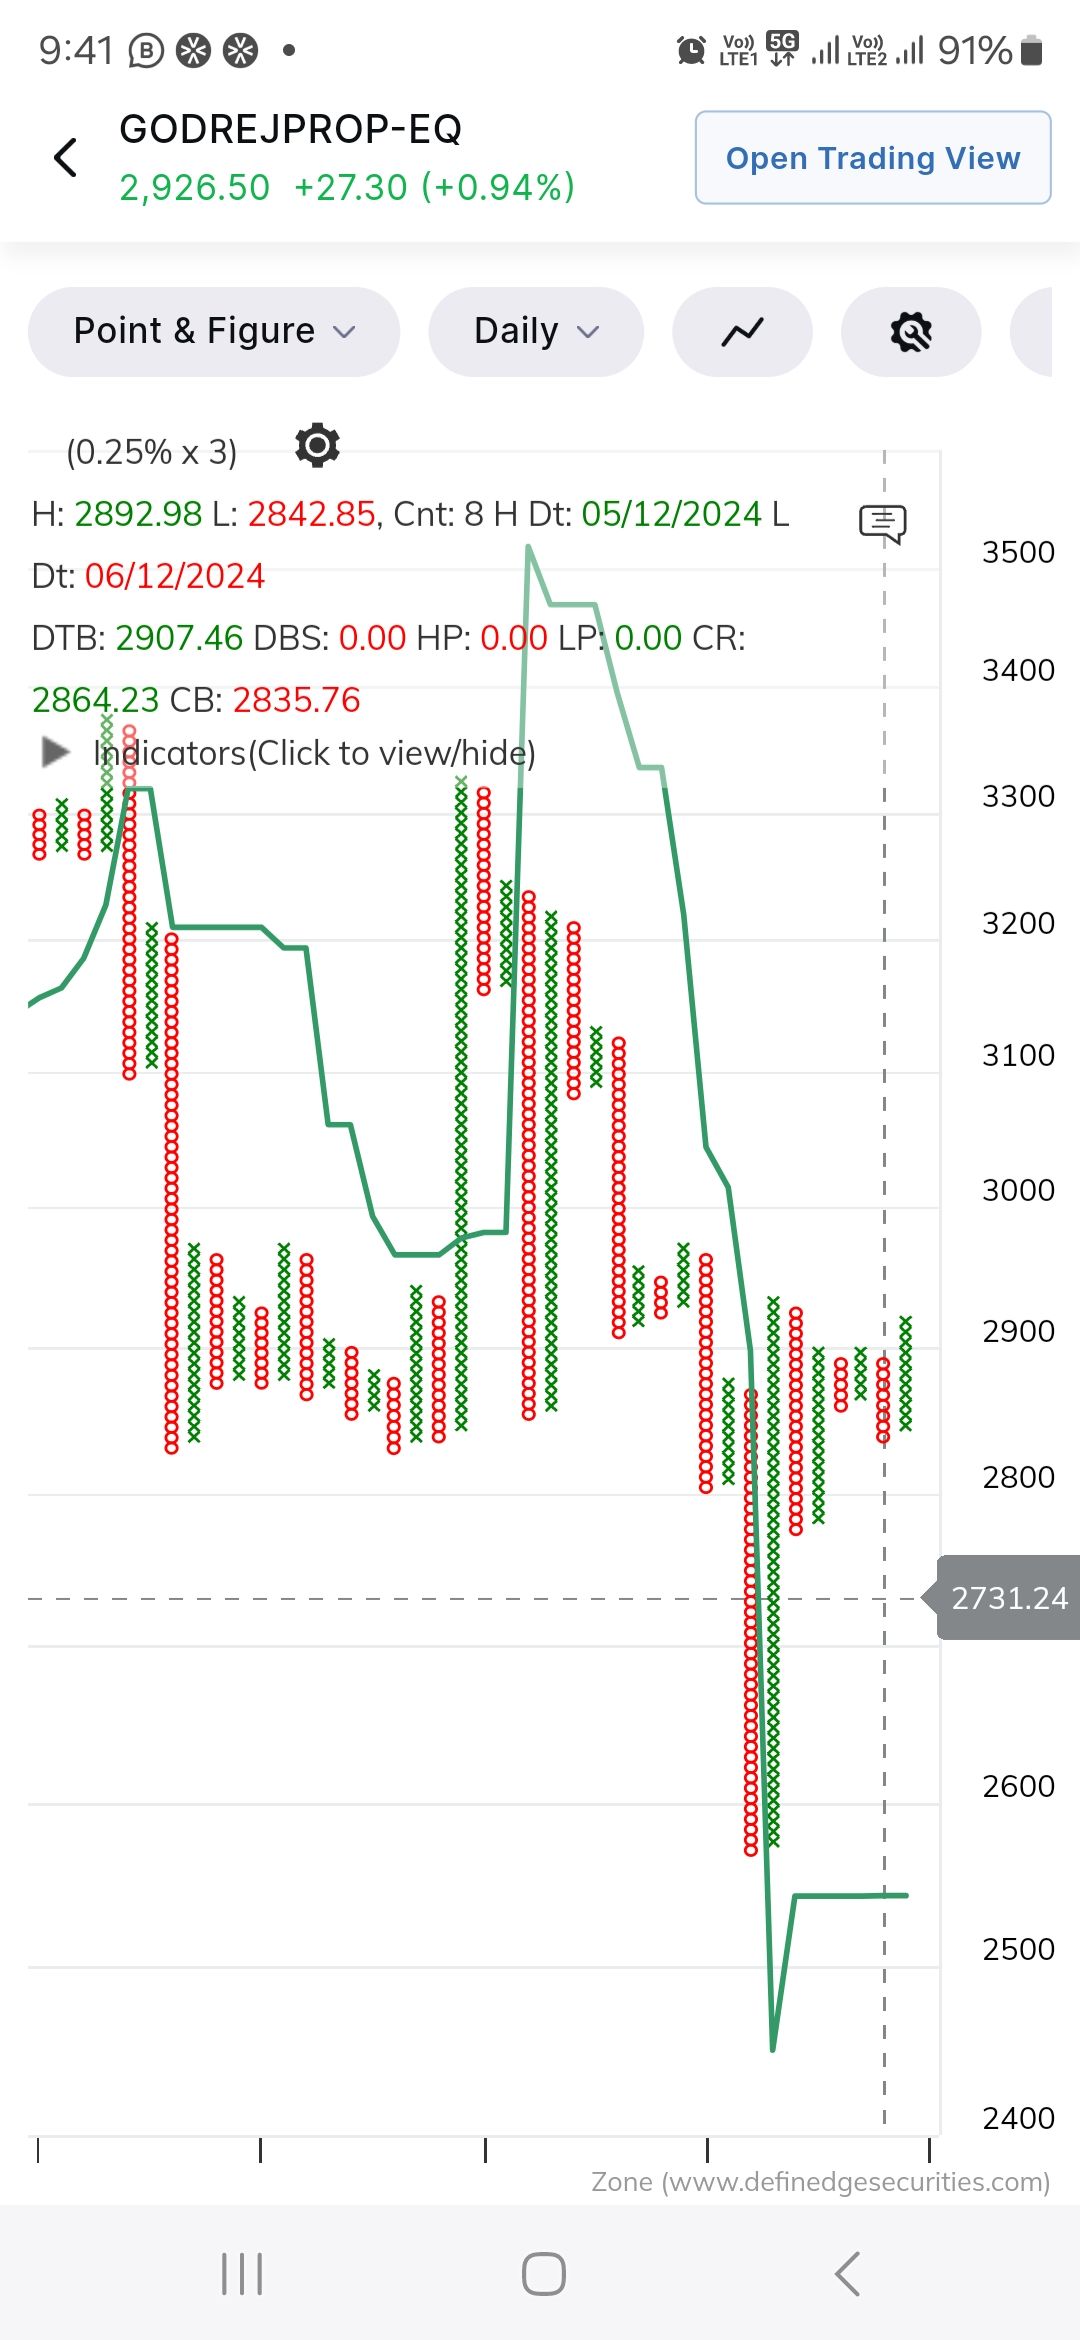
Godrej prop Triple top with bear trap
D Market Report (Snapshot of all the action)
HINDALCO 720 CE looks good at 31
Persistent long setup
HINDALCO 720 CE looks good at 31
Cipla long
IOC PE looks good above 4.8
Cash trade IIFLSEC
HDFCBANK 1650 CE looks good above 50
Infy turtle FT
HDFCBANK 1650 CE looks good above 50
United Spirits looks good above 1453
200 straddle 11/07
IEX looks good above 206.2
200 straddle 29/07
IEX looks good above 206.2
200 straddle 31/07
Titan looks good above 3732
200 straddle 30/07
Tata steel lookg good above 169
200 straddle
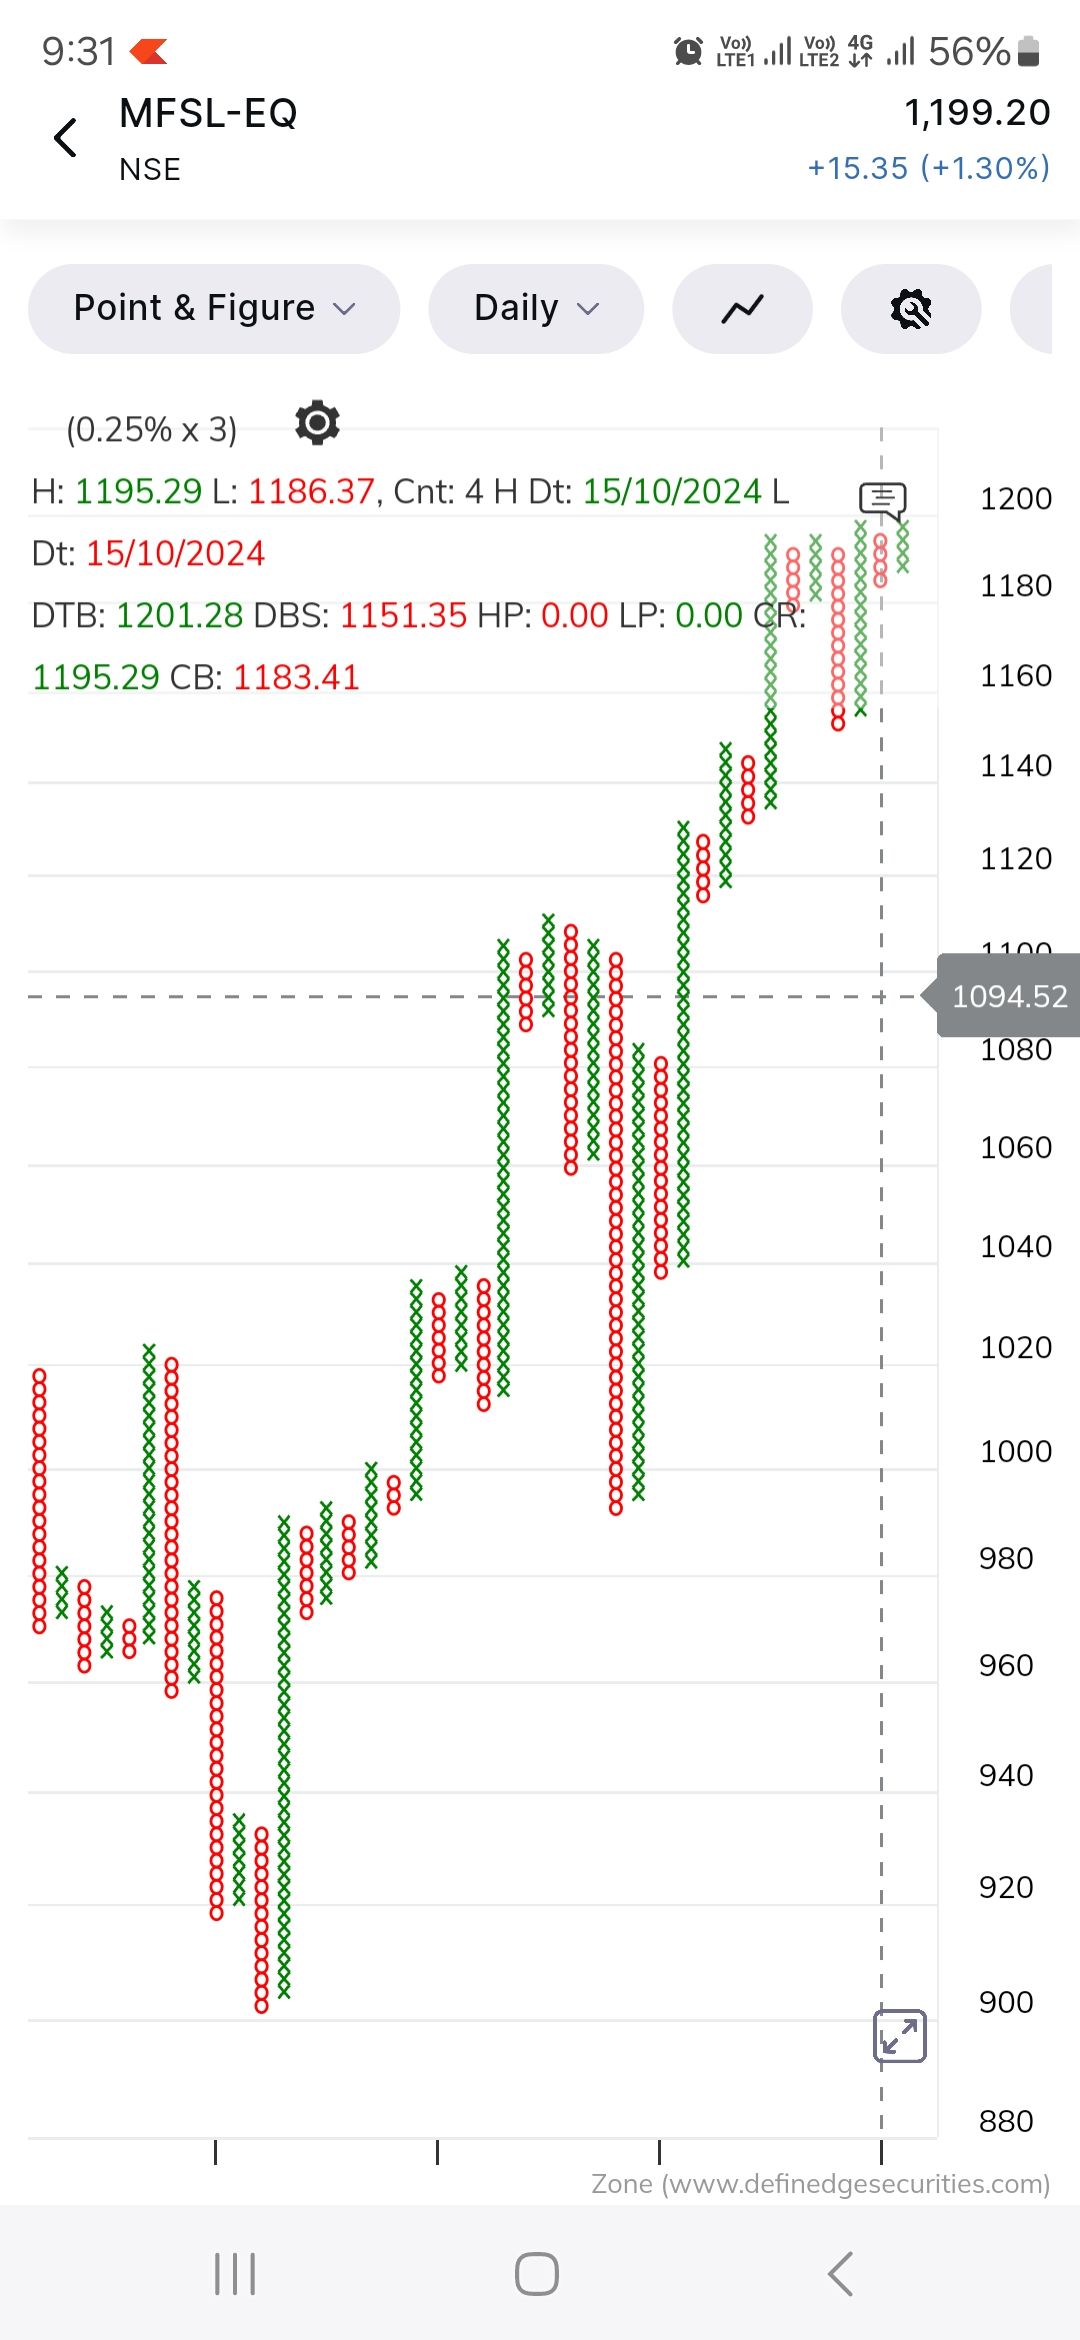
MFSL looks good above 1202
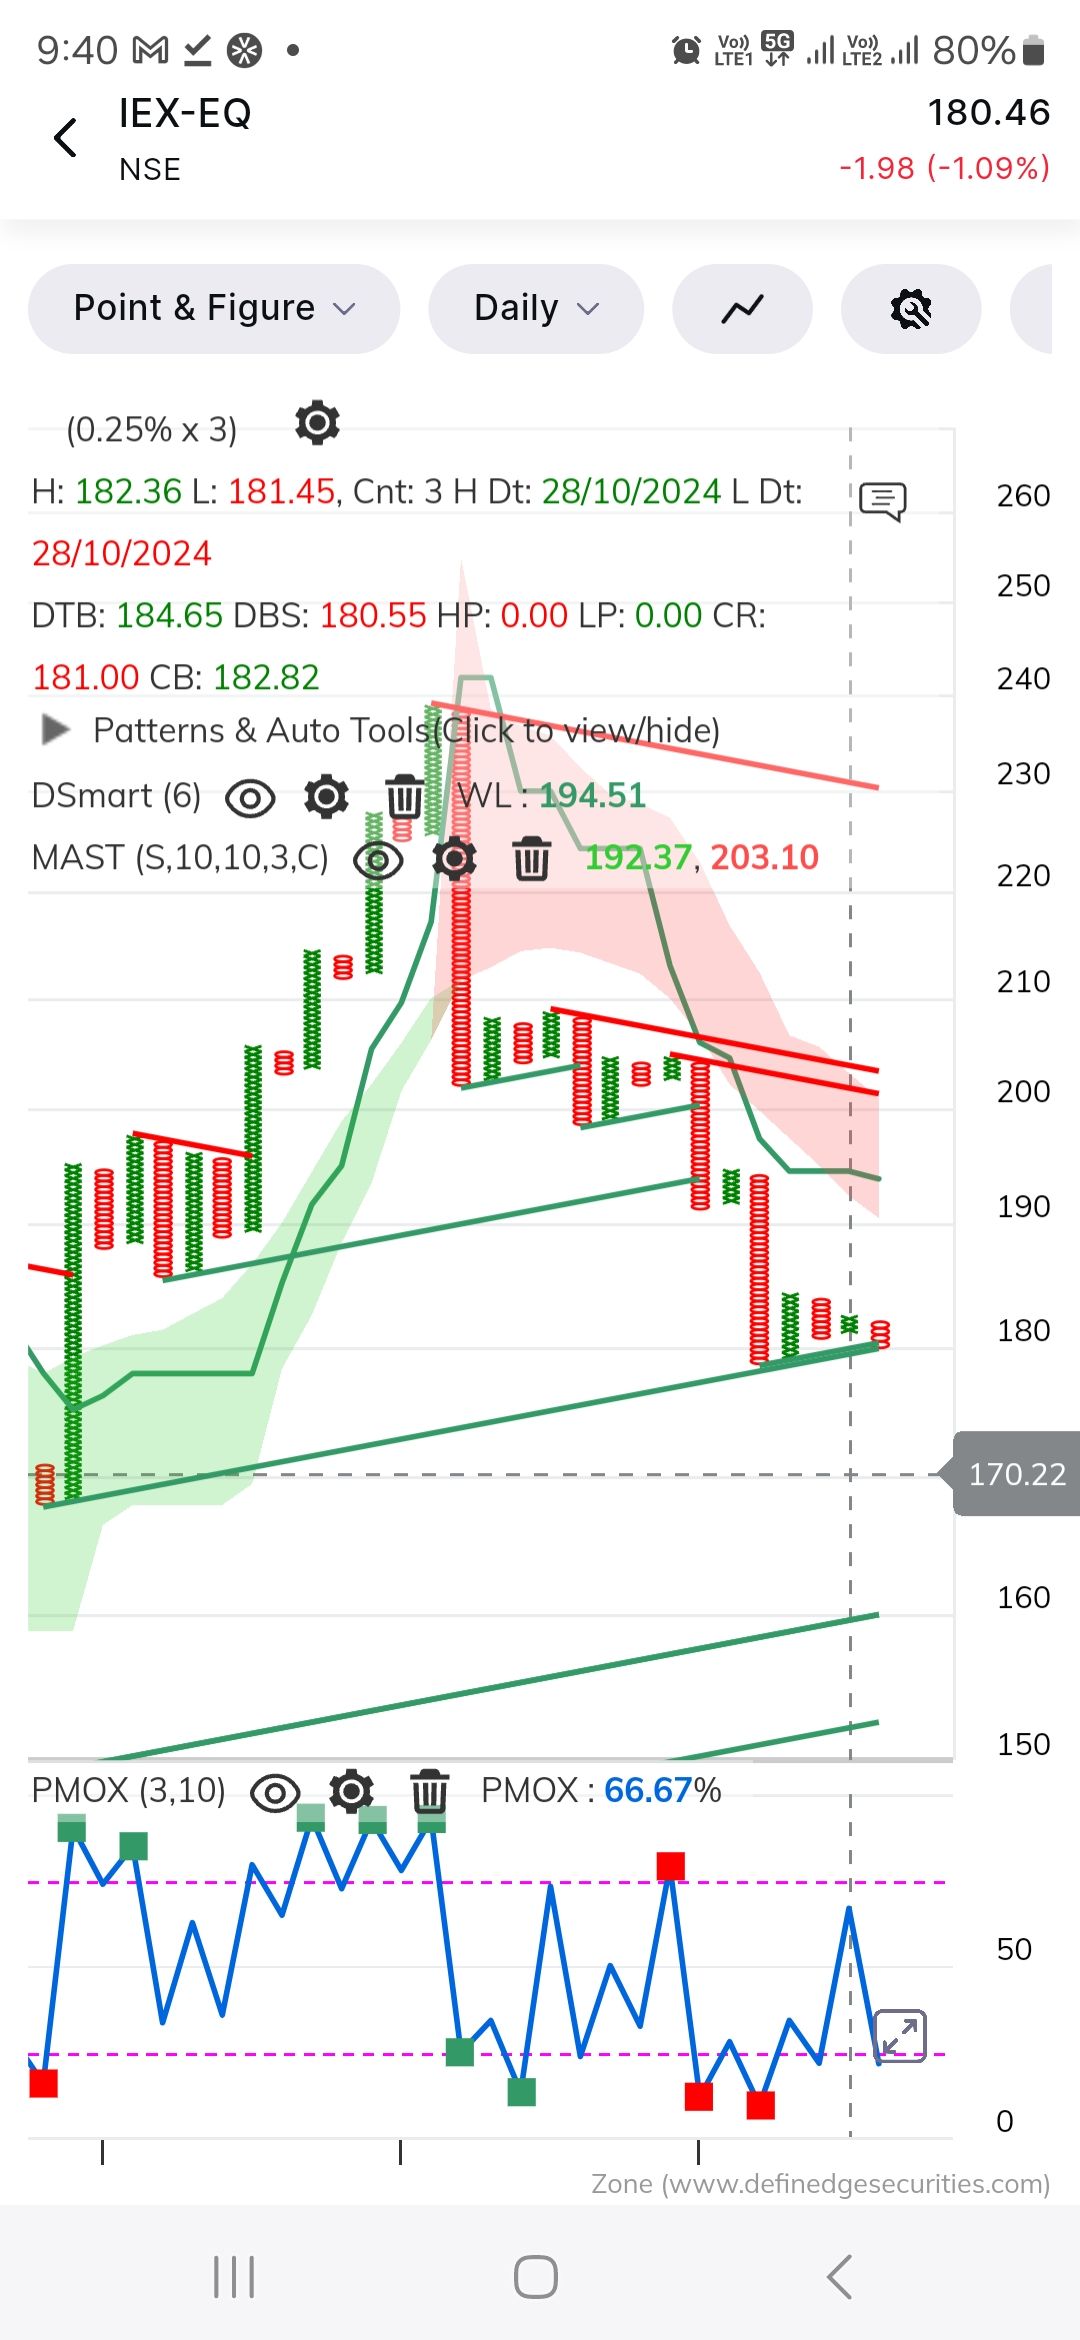
IEX short looks good below 180.55
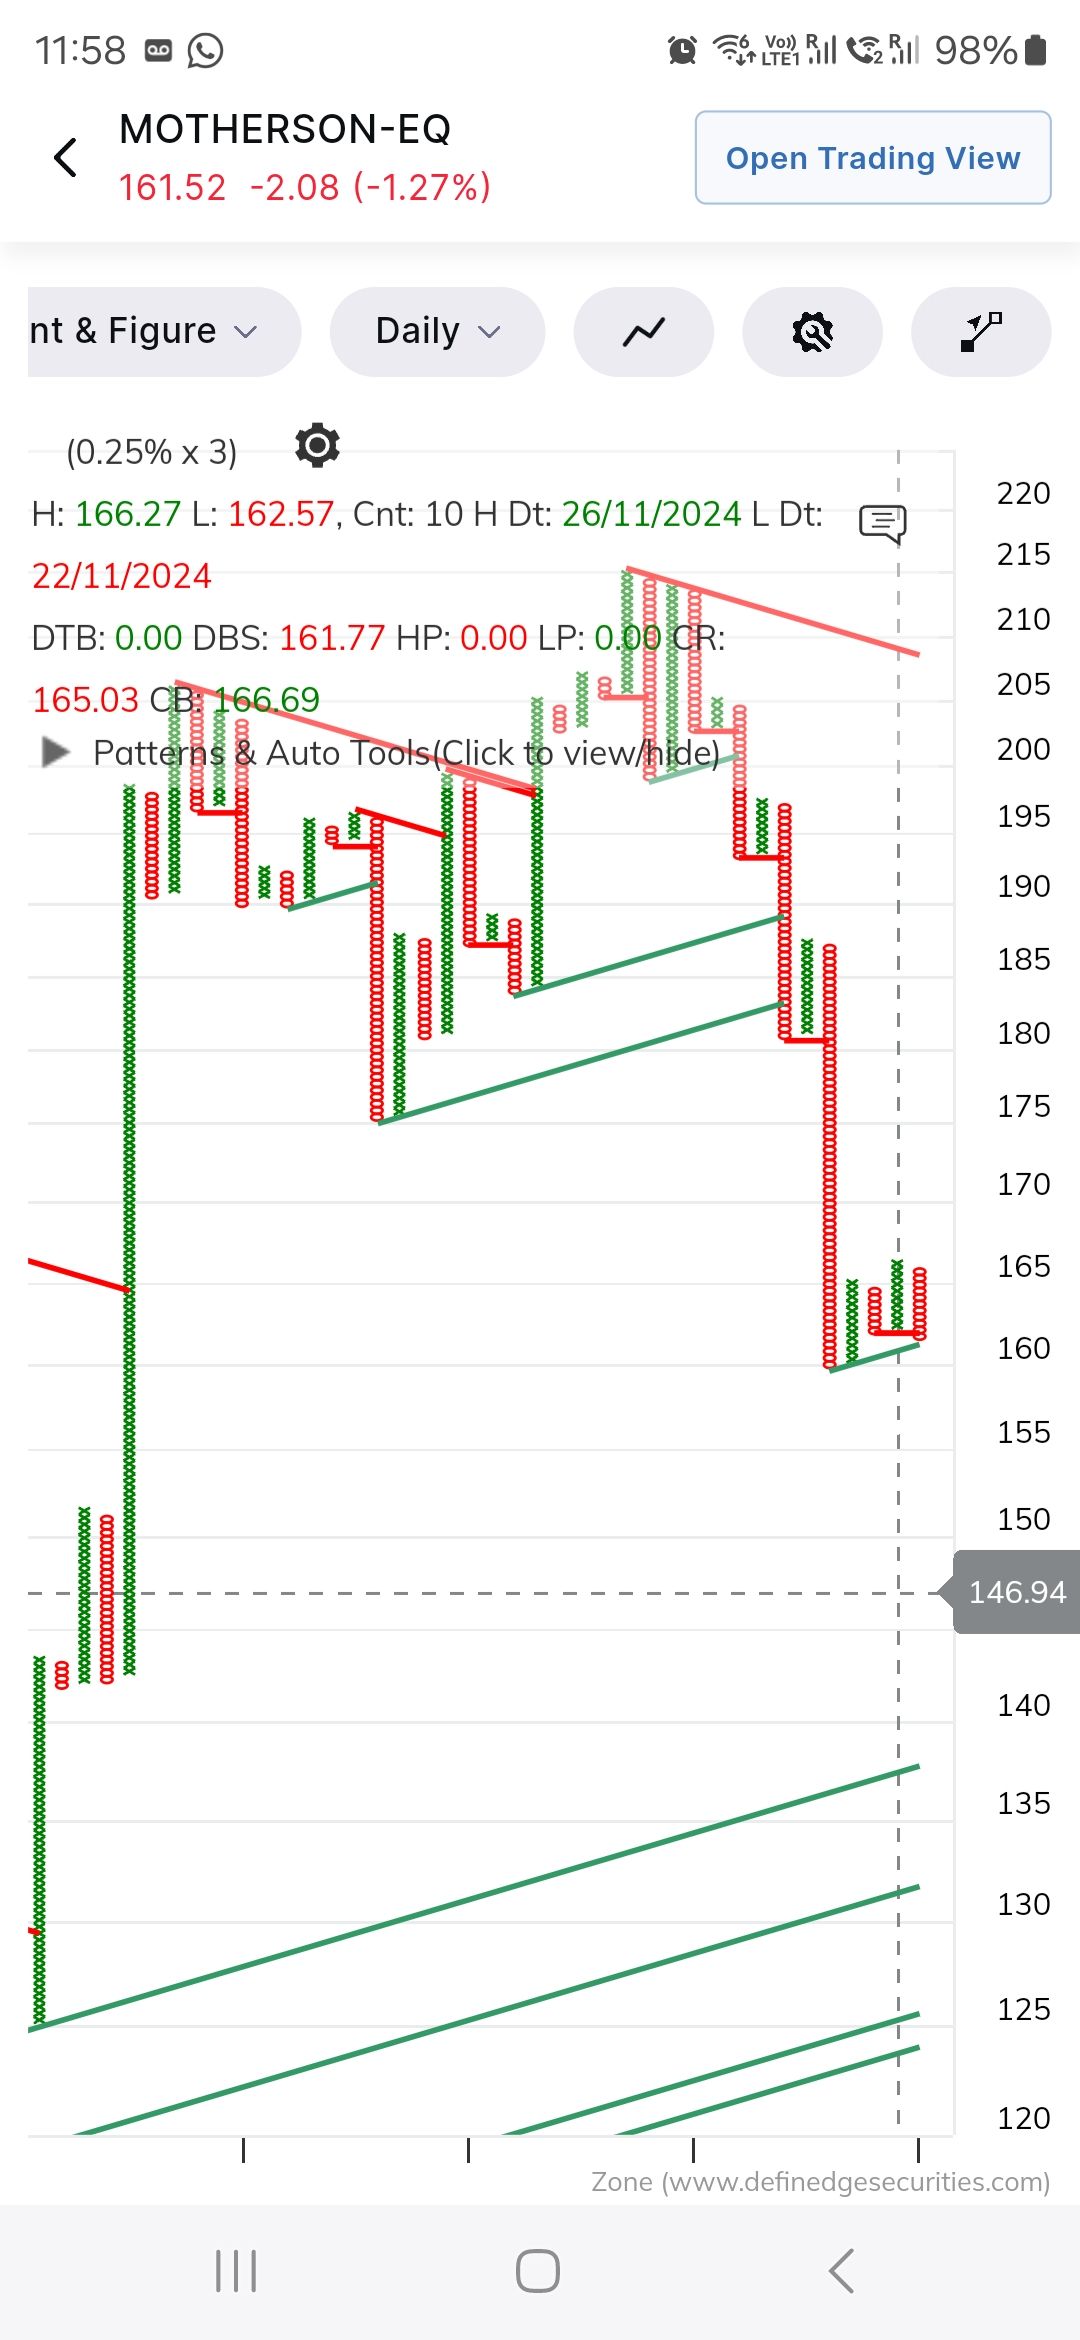
Motherson bearish ABC with bull trap