• Recent
  • Categories
  • 0 Unread 0
  • Popular
  • Tags
  • More
    • Guidelines
    • Disclaimer
  • Users
Skins
  • Light
  • Default
  • Cerulean
  • Cosmo
  • Flatly
  • Journal
  • Litera
  • Lumen
  • Lux
  • Materia
  • Minty
  • Morph
  • Pulse
  • Quartz
  • Sandstone
  • Simplex
  • Sketchy
  • Spacelab
  • United
  • Yeti
  • Zephyr
  • Dark
  • Cyborg
  • Darkly
  • Slate
  • Solar
  • Superhero
  • Vapor
Collapse
Definedge Forum Logo
R

RUSHABH VORA

Pro User

About
Topics
25
Replies
51
Groups
1
Followers
0
Following
0

All Replies

Recent Best Controversial

    Suggestion on incorporating option for adding Exit Condition on multiple charting methods in Momentum Trading Stratagy
  • R RUSHABH VORA

    Dear Sir,

    Currently in Momentum Trading Stratagy, if we choose, entry conditions or core stratagy on one chart type say on Candle stick charts, we have to choose exit conditions also on same charting type. i.e. candle sticks say SL Close below 200 EMA

    1. Could you please give an option to the user to place Exit condition on some other charting method say below D SMART of 1% on PNF or RENKO in above example?

    2. Could you please give an option to the user to exit a stock if it starts underperforming on RS Chart, say below 1% on PNF D SMART 6 on RS Chart against NIFTY 500?


  • Everything about Momentum Investing & Trading
  • R RUSHABH VORA

    @Bhupen M

    Dear friend,

    you would have ticked fundamental scanner condition also. Only 211 out of 500 stocks would have met your Fundamental scanner condition. That's why....


  • Trading stratagy part of Momentify portal
  • R RUSHABH VORA

    @RUSHABH VORA

    Dear Sir,

    1. In Momentum trading stratagy on momentify portal, can you please provide an optional user defined entry condition like e.g. Eagle score need to be say above 15 or Price performance score need to be above say 6 or RS score need to be above 4 or Total performance score say be more than 10 on Price RS Fusion matrix ???? so that user is further sure that his stocks are bullish on price and RS chart on multi time frames

  • Trading stratagy part of Momentify portal
  • R RUSHABH VORA

    Dear Prashant Sir,

    Your session on Momentum investing and trading at recent event at Pune was outstanding.

    I have had already started MI ever since last Nov 2024 DECMA 2024 Event.

    Now I want to use momentify portal for trading stratagies in positional cash equity segment which you discussed in last Pune event. I have already designed trading stratagy on Momentify Portal.

    1. I wish to know when will it be operational?.
    2. And in that you suggested taking positions based on 1% Price chart daily TF and .25% RS chart, right?

  • Anchor Lines in Renko chart
  • R RUSHABH VORA

    Dear Sir,

    Looking at Recent video by A P Sir and Raju Sir on Anchor Support and Resistance lines on P N F Chart, I applied the same on Renko charting method. But on RENKO Charts, ANC (Anchor Lines) Support and Resistance lines both are shown in same colour, say, Red colour. If support and resistence Anchor lines are shown in different colors as it is being shown in P N F Charts, it would be visually be very effective and simple to understand. PFA a screenshot taken from RZONE.Screenshot 2025-02-13 160038.png


  • Difficulty in plotting USDINR/NIFTY 50 PNF Ratio chart
  • R RUSHABH VORA

    Dear Sir,

    I have a difficulty in plotting USDINR/NIFTY 50 PNF Ratio chart. Could you please guide me...


  • How to know when to start or stop the momentum trading strategies?
  • R RUSHABH VORA

    @Nisanth TS

    Dear Sir,

    My back testing results show that Index filter works wel with large cap universe. It keeps max d/d in control without much hampering CAGR. But, index filter hampers CAGR badly in so far as midcap, small cap and micro cap universes are concerned.


  • Momentum Investing
  • R RUSHABH VORA

    Dear Sir,

    1. What is Max drawdown shown in Simulation in Momentum
      Investing Scanner? and is shown on Realised Loss or Total loss including unrealised Loss?

    2. You may also plot comparative benchmark or universe's performance curve over chosen stratagy's performance curve at the end of simulator over the chosen period.


  • Momentum Investing -- does it require a hedge by PUTS? in current scenerio
  • R RUSHABH VORA

    Dear Sir,

    Under the current market situation, when NIFTY 50 is below D Smart on .10x3 PNF Daily chart, is it advisable to hedge Momentum Investing Portfolio by going long in PUTS of NIFTY of next month expiry ATM Strike price ? Please advise as Momentum investing concept is very new to me ......

    or shall I simply continue Rebalancing MI Portfolio as and when due?

    Please advise


  • Momentify Video
  • R RUSHABH VORA

    Dear Sir,

    1. Please throw some light on Momentify platform, its configuration, features, uses, DOs, and DON'Ts, preferably in video format
    2. Further videos in Momentum Investing video series
    3. your much awaited book on Momentum investing and trading

  • Momentum Investing observation sharing cum guidance required
  • R RUSHABH VORA

    Dear Prashant Sir,

    I am a great fan of your Momentum Investing Stratagy. I am in its learning phase.

    When back testing MI on different parameters on different NIFTY universes, I have come across the following observation :

    Filters work wel on all universes and reduce the max draw down on all universes keeping without much compromising on CAGR over a period of time except in case of NIFTY 300 (500-200) Universe where compromise in CAGR is over 12% to 15% over a period of time say 1.4.2001 till date which turns out to be huge amount in final market value of initial investments over a period of 24-25 years, reducing max drawdown from around 21% to 11%. (reduction in max D/D is quite normal as in case of any other universe).

    I wonder What could be reason behind such different behavior of NIFTY 300 alone in giving CAGR with and without filters, given the fact that even NIFTY 500 (of which NIFTY 300 is also a part), does not compromise much on CAGR with filter, even NIFTY 50 or NIFTY 200 for that matter(which are also a part of NIFTY 500)

    Prashant Sir, could you please throw some light in the matter.

    Does it mean that one need not put index or RS filters on NIFTY 300 universe if he is comfortable with max d/d of 20% to 25%, if he wants to compound his investments at a very high rate? I just want to ensure that i don't end up in learning a wrong lesson

    Thanks a lot for introducing Such a wonderful Investment strategy and making it truly automated through Momentify Portal.


  • Nifty - EMA Channel & Candlestick
  • R RUSHABH VORA

    Thanks Sir for great input


  • Nifty - I will Book Profits @ Open {Bullish Harmonic}
  • R RUSHABH VORA

    great observation and thanks for sharing, Sir.


  • Momentum Investing
  • R RUSHABH VORA

    Dear Sir,

    Thanks for launch of this wonderful Momentify platform for momentum investing.

    Please guide on the following:

    1. Nifty is bearish as on date on .10% x3 P&F daily chart. Is it advisable to create momentum portfolio in current bearish market scenerio or wait for NIFTY to turn bullish?

    2. Please notify whenever momentify portal becomes fully functional as I created virtual portfolio but none stocks are appearing in the virtual basket.

    3. Please enable SIP Tab on momentify portal.

    4. It would be nice if you could include features like partial withdrawl (say, for tax on Capital gains etc.) such that we can continue to stay in the same momentum portfolio over a long term at the same time meet out tax commitments arising therefrom.

    5. One thought process could also be to enable SWP in momentify portfolio which the investors can utilise during their retirement period, staying invested in momentum portfolio for the rest of the accumulated amount.

    I know I am asking too much from you. But I must say, you have raised your standards so high that our expectations from you are also becoming very high.♥ ♥ ♥ ♥ ♥


  • Nifty - Traders are Timorous, But...
  • R RUSHABH VORA

    @Brijesh Bhatia yes Sir, you are giving very timely great observations 👌


  • Momentify - launch
  • R RUSHABH VORA

    @Definedge

    Thanks Sir for your valuable feedback and must say, Definedge team work is fabulous

    Please let us know

    1. Where is SIP button? on momentify portal
      2 and do we have to create a seperate portfolio for SIP? or we can add it in same portfolio?
    2. Please also add feature of Partial redemption in momentify and SWP in momentify portal so that it can serve as best alternative to MFs
    3. Where is re investment button on momentify portfolio ?

  • Momentify - launch
  • R RUSHABH VORA

    There is no SIP Button on the momentify site


  • Momentify - launch
  • R RUSHABH VORA

    Please update as to where is Simulator button in above site?


  • PNF charts not working on mobile App
  • R RUSHABH VORA

    Kindly close the query as my problem is resolved by uninstalling and reinstalling the Mobile App. Thanks for your co operation


  • PNF charts not working on mobile App
  • R RUSHABH VORA

    Last update was on 31/10/2024. Still PNF Charts still not working![WhatsApp Image 2024-11-04 at 13.26.59.jpeg](/assets/uploads/files/1730707257399-wWhatsApp Image 2024-11-04 at 13.26.59.jpeg hatsapp-image-2024-11-04-at-13.26.59.jpeg)


  • PNF charts not working on mobile App
  • R RUSHABH VORA

    Dear Sir,

    PNF charts not working on mobile App. Please do the needful.


  • Momentum investing
  • R RUSHABH VORA

    Dear Sir,

    For momentum investing, my thought process is as below:

    1. use Eagle Price and RS Scanner on NIFTY 200 using 1%,2%,3% and 5% as MTF and save Stocks with Eagle score>15.
    2. Invest equal amount in each of top 20 stocks out of above saved group, if 20 or more stocks are qualifying. . so my per trade, investment would be 5% of my portfolio. Keep SL on D Smart on 3% PNF Daily chart in the system by way of GTT. If SL is hit on a particular stock, it is out. but I won't enter any new stock till next monthly scanner in its place
    3. Repeat Eagle scanner as in 1 above every month on a fixed date and if any of my invested stocks does not fall within new month's eagle score of > 15, it would be replaced by new stock > 15 Eagle score in descending order of Total Eagle score.
    4. The process goes on every month
    5. if in any month, my stock universe of eagle score > 15 falls below 20, say to 10, I would be invested in those 10 stocks only and my balance 50 % of portfolio would remain in cash.
    6. So there are 2 exit criteria in my system a. a stock falls below eagle score of 15 or b. stock falls below 3% dsmart WL.

    Prashant Sir, the above is only my thought process. I wish to implement it with modifications, which you may please suggest.

    I don't know whether my above thought process is back testable? plus I want to know whether one needs to include breadth study in above stratagy. If yes, which % box value? Please guide


  • Nifty Futures - Bullish Harmonic on P&F
  • R RUSHABH VORA

    Dear Sir,

    Please give brief on harmonic pattern. May be during DECMA. It appears to be very interesting and innovative


  • Advice sought on NIFTY Long
  • R RUSHABH VORA

    Dear Sir,

    Is it advisable to go long in NIFTY on positional basis ?

    1.even if NIFTY 50 is below D smart on .10%x3 PNF EOD Chart?

    if otherwise it meets other following parameters

    1. Breadth gives bullish cross over and is in neutral zone
    2. There is a DTB on .10% x 3 PNF 1min. chart

    Please guide.


  • DANGER LEVEL OF NIFTY
  • R RUSHABH VORA

    Dear Sir,

    1. Earlier during MKLH Raju Sir was referring to D Smart WL of 21850 as danger level below which if NIFTY falls, may be we can say bear market has started and we have to avoid bullish trades. Currently NIFTY on EOD .10% PNF Chart, NIFTY is below DSMART WL. So has bear phase started? or advise danger level which we can refer to.
      2.We request you to restart MKLH daily regular version as it would help new PNF practitioners like me to get more clarity in trading and investing path. I love you Raju Sir, Prashant Sir, A.P Sir and the whole definedge team.

  • Dabur - Running iH&S
  • R RUSHABH VORA

    I think Sagarji, if you see a POINT AND FIGURE CHART of the script it will be a probable turtle break out, at which level it's formed is not important. If it is formed above d smart or SMA, it's a bullish break out. Disclaimer : I am only a user of RZONE PRO and a Gurukul student


  • Suggestions required for improvement in my trading style
  • R RUSHABH VORA

    Dear Sir,

    Sir please answer all my queries to remove noise in my mind

    Please guide 1. Risk per trade in % terms for positional trades or investment in equity
    2. I am keeping my SL/TSL on D SMART for positional equity since beginning of my PNF journey with you in Gurukul eversince this April. I preferred D Smart for its unique features explained by you in Gurukul. I am able to ride my trade with D Smart but whenever I find breadth is over bought I shift my TSL to NCR.on EOD chart or d smart on 1 minute chart. and I find my TSL is hit in a day or two. And I make a profit of only 4 to 5% on an average where as my initial d smart SL itself is around 6 to 8 %. My success ratio is around 55% in last around 51 trades completed so far. So I end up making 5% profit vis a vis 5 to 6% loss. So my Actual Risk reward ratio ends up very poor below 1:1. Ofcourse my expectancy ratio is positive so I am making some profits Please suggest me some improvement so that I can improve my R : R ratio, and expectancy ratio. Shall I start keeping pattern failure level as
    SL instead or shall I continue to keep my TSL on d smart irrespective of breadth in extreme zone or suggest some improvement.
    3. Which pattern in PNF chart in RZONE will plot All 5 Anchor column family follow through patterns. Please name exact name. Do we have to plot Immediate follow through and AFT Bullish seperately to cover all 5 or AFT Bullish covers all 5. ???.


  • MAST INDICATOR not showing correct results in mobile app
  • R RUSHABH VORA

    ok thanks


  • Do we put SL in system for Positional cash trades
  • R RUSHABH VORA

    Noted Sir. I will stick to SL rules. Thanks.


  • Risk management position sizing and allocation
  • R RUSHABH VORA

    Dear Prashant Sir,

    If you could make video on the captioned subject as promised by you in some of your video I came across, it would be of immense help to your ever expanding noiseless trading community. If you have already released the same which I am unaware, kindly share link here. One more question, I use MAST indicator instead of D SMART on PNF as I find more comfort with MAST and find it giving less whipsaws and enables me to ride trend more. Ofcourse, entry is and exit both are late and initial SL is also more. Is it fine? Please suggest improvements if any. I love your work and dedication a lot ❤️❤️❤️


  • MAST INDICATOR not showing correct results in mobile app
  • R RUSHABH VORA

    On .10% 1 min NIFTY Chart


  • P&F Price Scanner - 45 Degree Trendline Breakout
  • R RUSHABH VORA

    I think you can try public scanner- ABC Bullish (5 col, 7 col and 9 col) also available. This is my personal view. I am only a definedge user and not a staff member


  • Do we put SL in system for Positional cash trades
  • R RUSHABH VORA

    Thanks Sir for your reply


  • Do we put SL in system for Positional cash trades
  • R RUSHABH VORA

    or is it ok if we keep it on paper and execute it on the day on which SL is hit on closing basis? Please guide. In case of nifty bees , will your answer be different?


  • Nifty - Real Struggle for Bulls Begins Now {Wyckoff}
  • R RUSHABH VORA

    Please clearly mention exact spot levels of gap which you are referring to


  • Listen to price pattern or breadth
  • R RUSHABH VORA

    Dear Prashant Sir,

    I went through your video on breadth analysis of your Gurukul course and got my answer. We have to be slow in extreme zone and aggressively book profits and cross overs in extreme zones are effective. In all cases we have to trade price patterns only and once breadth is in neutral zone, We may trade price patterns in outperforming stocks out of outperforming sector and segment. Thanks and correct me Sir, if my understanding is wrong


  • Q&A Thread: Donchian Channel
  • R RUSHABH VORA

    @Prashant Shah

    Ans:

    1. Stock is making lower high and higher lows = consolidating or side ways
    2. Stock is consolidating or sideways
    3. volatility is very high
    4. on renko chart it will show recent 20 bricks high

  • Listen to price pattern or breadth
  • R RUSHABH VORA

    Dear Sirs
    Please guide nifty futures 1min Chart was bullish on last Friday it was above d smart but breadth Chart was not showing positive cross over. So in the situation could we have gone long or wait for positive crossovers on breadth indicator? Please advise


  • Use of Pattern counter Scanner for stock selection
  • R RUSHABH VORA

    Dear Prashant Sir,

    I experimented Pattern counter scanner on .25% PNF Charts on Nifty 100 universe. filtered stocks showing > 50% trend ratio. Further scanned the the filtered group on PNF Fusion matrix and filtered the stock for Total performance score > 0. I now got universe of 11 stocks out of 101, on which now I can can find out break outs or pullbacks using PNF Scanner

    Please suggest improvements in my above process, if any.


  • Suggestion required on Android mobile suitable for viewing RZone breadth and RS and PNF matrix and PNF Charts on Zone mobile app
  • R RUSHABH VORA

    Thanks Nehaji


  • Suggestion required on Android mobile suitable for viewing RZone breadth and RS and PNF matrix and PNF Charts on Zone mobile app
  • R RUSHABH VORA

    Dear Sir,

    I am usually on the "GO" for office work during market hours. So the only hardware easily accessible to me for viewing PNF charts on Zone mobile app and for viewing breadth analysis or selecting stocks based on RS PF Matrix analysis on R Zone is my mobile on hand. So could you please suggest me from your personal experience or from any of our noiseless traders community, any android mobile ( high cost or high end mobiles does not matter), which would serve my purpose of easy accessibility to Zone mobile app for price patterns and R Zone on mobile for stock selection and breadth analysis on the "GO"


  • query on product to use
  • R RUSHABH VORA

    Thanks Nehaji for your valuable feedback


  • query on product to use
  • R RUSHABH VORA

    Dear Sirs,

    I am using multi class analysis, segment analysis and PNF Charts on Zone Web and breadth analysis for timing the market (when to trade and when not to trade) and RS and P &F indicators and matrix analysis for stock selection on RZone for positional cash trades. I also use Zone mobile app for charting purpose. I am not trading in options. for all of above, RZONE, Web zone on browser and mobile are sufficient.

    My query is that shall I get added confirmation before trading from Total Open Interest Analysis on Renko which is possible only on Tradepoint PRO by subscribing it ? or what do you advise?


  • Breadth indicator
  • R RUSHABH VORA

    Dear Prashant Sir,

    Can we buy an outperforming stock selected on PF Fusion matrix with affordable SL, even if breadth indicator is showing NEGATIVE CROSS OVER an it is in neutral zone at around 52 x% ? Please advise.

    Thanks


  • Breadth indicator
  • R RUSHABH VORA

    Dear Prashant Sir/ Raju Sir,

    If breadth is in extreme zone i.e. above 75%, we prefer not to make fresh long.

    Can we buy an outperforming stock selected on PF Fusion matrix with affordable SL, even if breadth indicator is showing negative divergence ant it is in neural zone at around 52 x% ? Please advise.

    Thanks

    Screenshot 2024-05-03 150122.png Screenshot 2024-05-03 145905.png


  • Stock selection using P&F Fusion matrix
  • R RUSHABH VORA

    Thanks a lot Sir for your valuable guidance


  • Futility of using two softwares "Rzone" and "Trade point desktop"
  • R RUSHABH VORA

    The problem with using TOI on OPSTRA is that it gives only line chart and I have become more comfortable with RENKO Chart TOI ON 1 minute timeframe 0.50% box size using DSMART/SMART DON set up recommanded by Raju Sir on market kya lagta hai. It would be nice if you could include the same feature in R Zone


  • Futility of using two softwares "Rzone" and "Trade point desktop"
  • R RUSHABH VORA

    Yes, totally agree with the suggestion that TOI feature plus any other such features which are unique to Tradepoint be made available in RZone as persons like me who are employed in full time job are not allowed to download trade point desktop on company's LAPTOP So we can use only RZone or Webzone or mobile Zone App. Cost is not a problem


  • Stock selection using P&F Fusion matrix
  • R RUSHABH VORA

    Hello Prashant Sir,

    I have done your P&F Course one month back and its fantastic Sir.

    Below is the process which I follow and my querries

    I first look at other market class then at breadth analysis. Then I do index and sector analysis and select outperforming index/sector and then run each of them on P&F Fusion matrix and save Matrix bullish universe and Matrix Pullback universe and then run Matrix bullish universe on price scanner for Strong break out patterns like Multi column break out or AFT or Turtle bullish patterns or TTB or Bullish broadening or bear trap/ variation or any major bull pattern F/T on .25% chart for Frontliners and 1% on others usually keeping SL on WL of D SMART and I run Matrix Pullback universe for Multi Oops or Ziddi Bulls or 123 PB etc. on .25% chart for Frontliners and 1% on others usually keeping SL on WL of D SMART.

    My stock selection has improved exponentially. Thanks Sir.

    My question no.1 is as to whether saving and using Matrix bullish universe and Matrix Pullback universe is more effective?

    or may I save stocks having say Total Performance score above 8 and do the rest of process? or do you suggest any modifications?

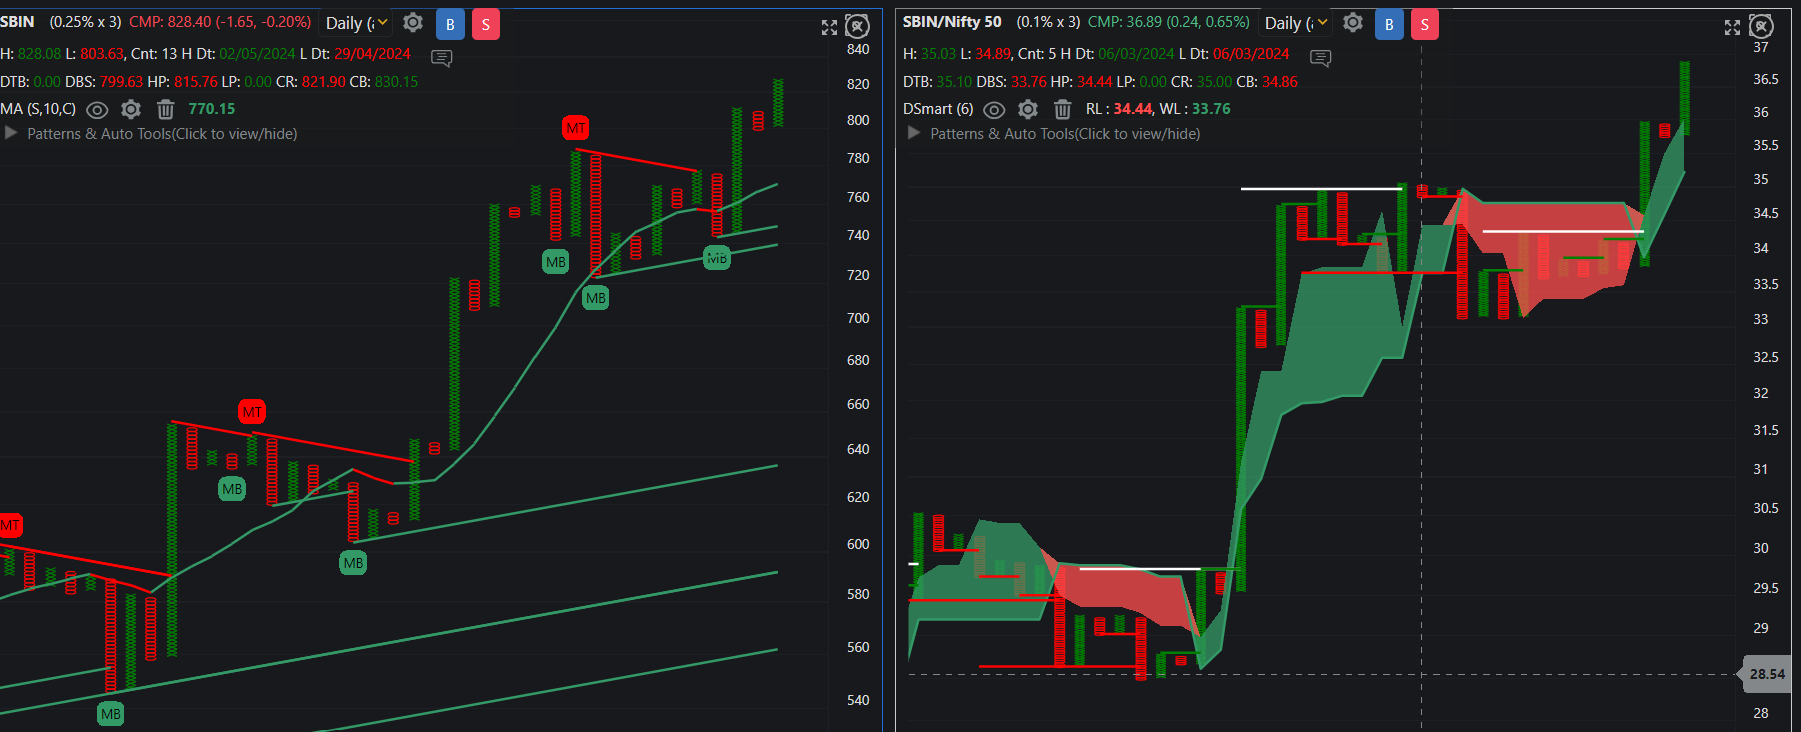
    Why I am telling you this is because although saving and using Matrix bullish universe and Matrix Pullback universe gives good results on a few occasions I have experienced that SUN PHARMA, TCS, DMART, COLPAL which were in 8 + 8 = 16 zone on Fusion matrix at one time, Come down to Total Performance score of 6 and below or even negative 2 and give a DBS on lower time frame whereas Stock like ICICI Bank or SBI which were once showing total performance score of only 3 at one time are now outperforming with total performance score of 9 or even 16 and have given breakouts on lower time frames and giving fantastic results.

    Sometimes I also run the above universes for MAX or BOOST or DIP stratagy on multi time frames.

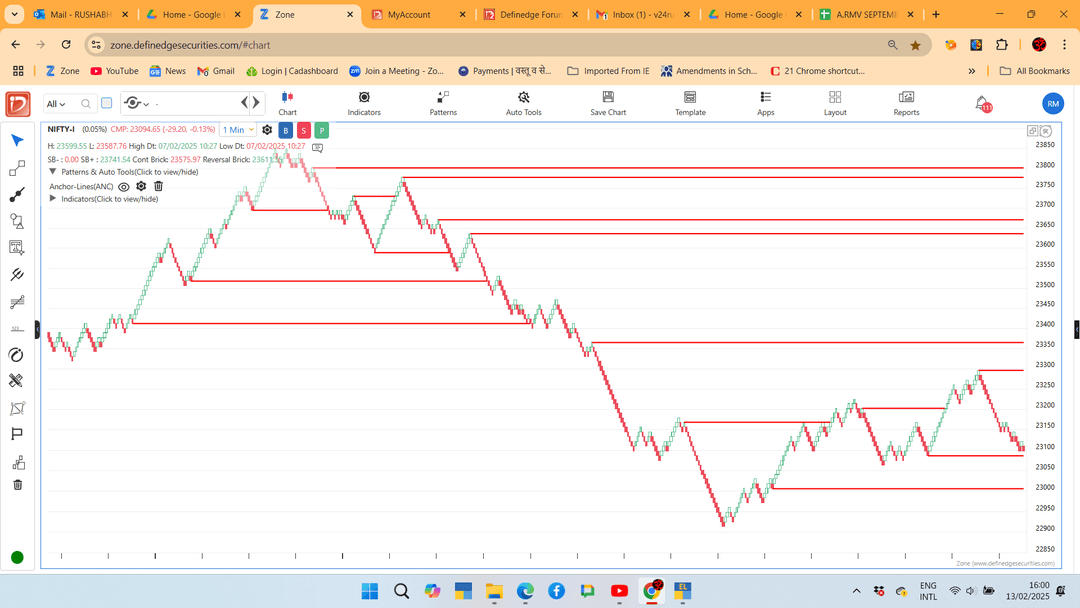
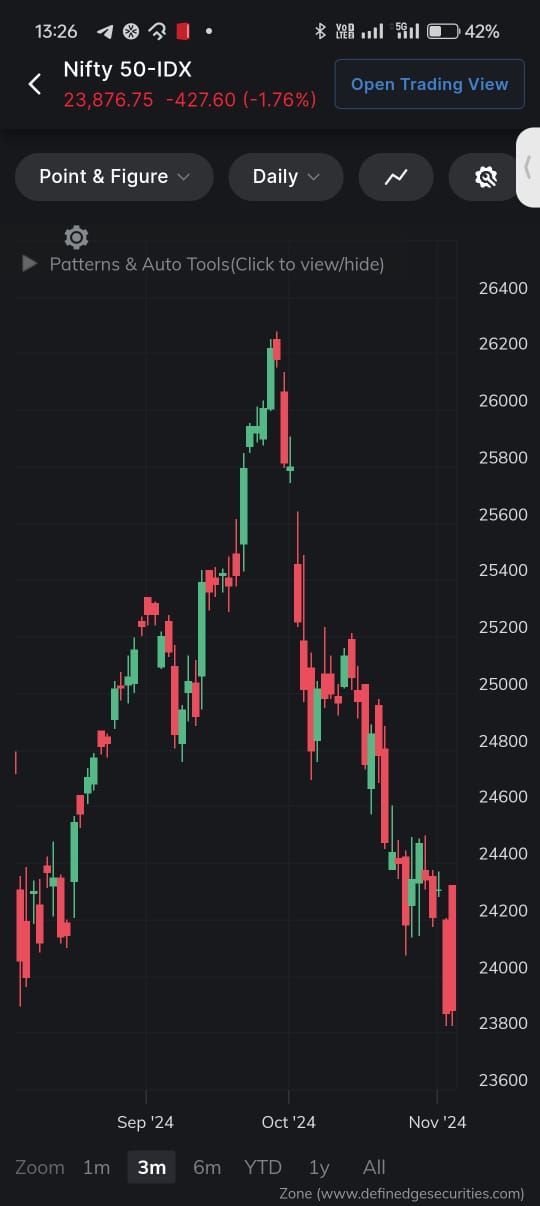
    I use TOI feature on RENKO Chart on set up explained by Shri Raju on Market kya lagta hai and then use price pattern on RENKO CHART 1min .05% on NIFTY Spot and buy NIFTYBEES If both are showing bullishness and Exit NIFTYBEES when reverse happens. I use PNF set up also samew.10% ay. Dsmart is always my SL.

    I want to trade NIFTY BEES (Bullish trades) and for reverse I want to use options (Short calls or buy Puts. Could you please guide me in my this area of trade in NIFTY via NIFTYBEES?

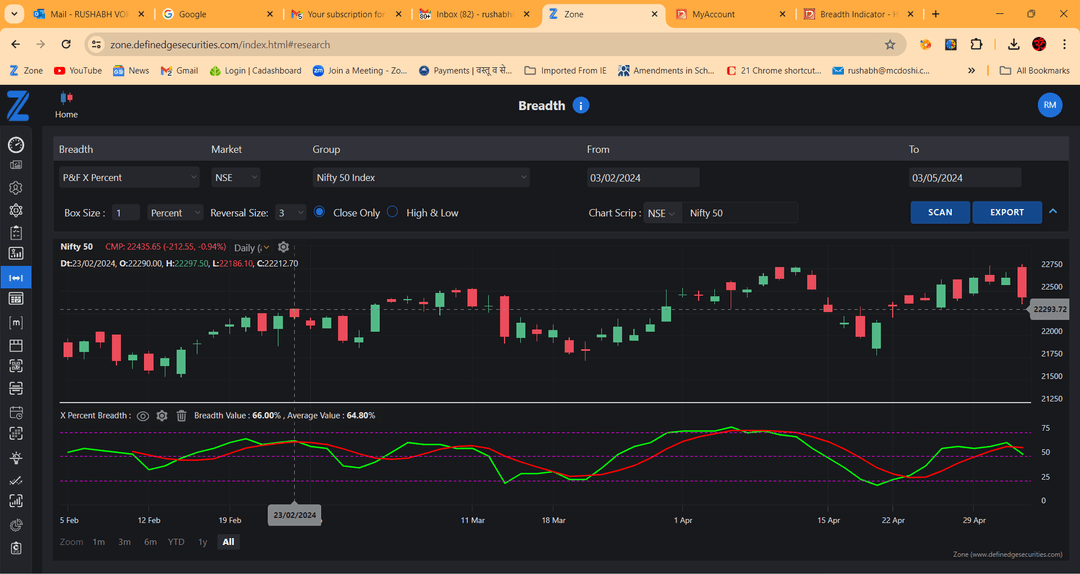
    I have also started rebalancing my overall portfolio Equity and Debt mix, determining market conditions using Breadth analysis, Segment analysis, NIFTY/NIFTY 500 trade setups (bullish/bearish using dsmart on daily time frame .10% p&f chart.

    Looking forward for your valuable guidance Sir. Thanks for everything to you and your entire hardworking, dedicated and selfless team.


  • zone web screen set up
  • R RUSHABH VORA

    how to get commentary box on RHS od zone web screen ?

  • 1 / 1
  • Login

  • Login or register to search.
  • Blog
  • Youtube Videos
  • Refresh
  • First post
    Last post
0
  • Recent
  • Categories
  • Unread 0
  • Popular
  • Tags
  • More
    • Guidelines
    • Disclaimer
  • Users
  • Login

  • Login or register to search.
  • Blog
  • Youtube Videos
  • Refresh