S
Santosh Bahl
Pro User
All Replies
-
-
-
-
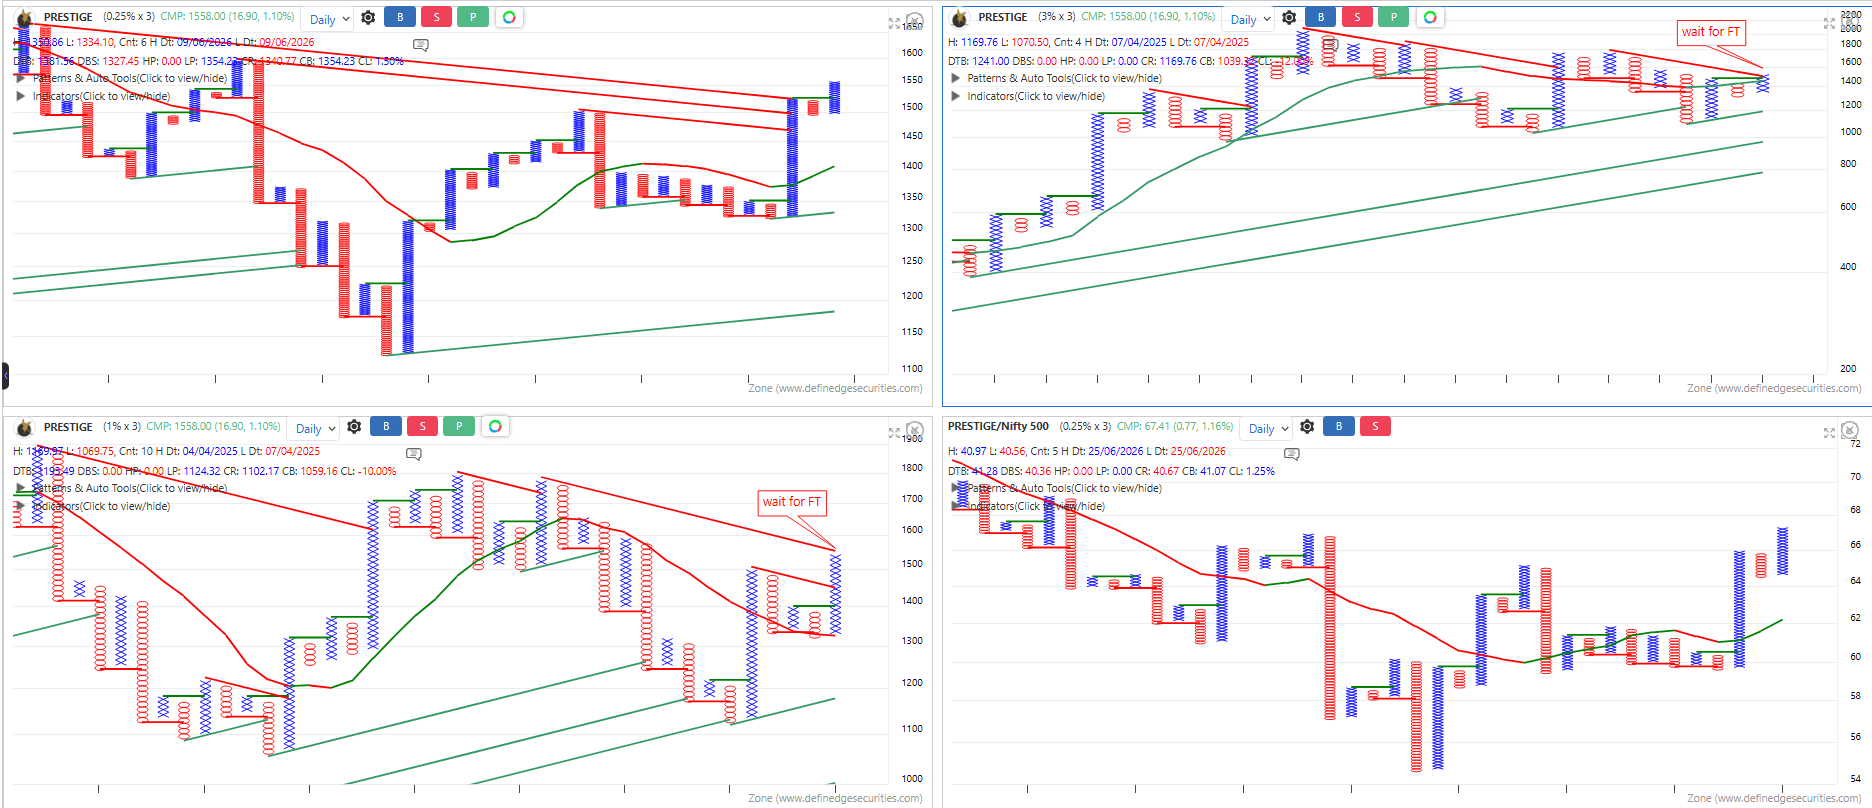
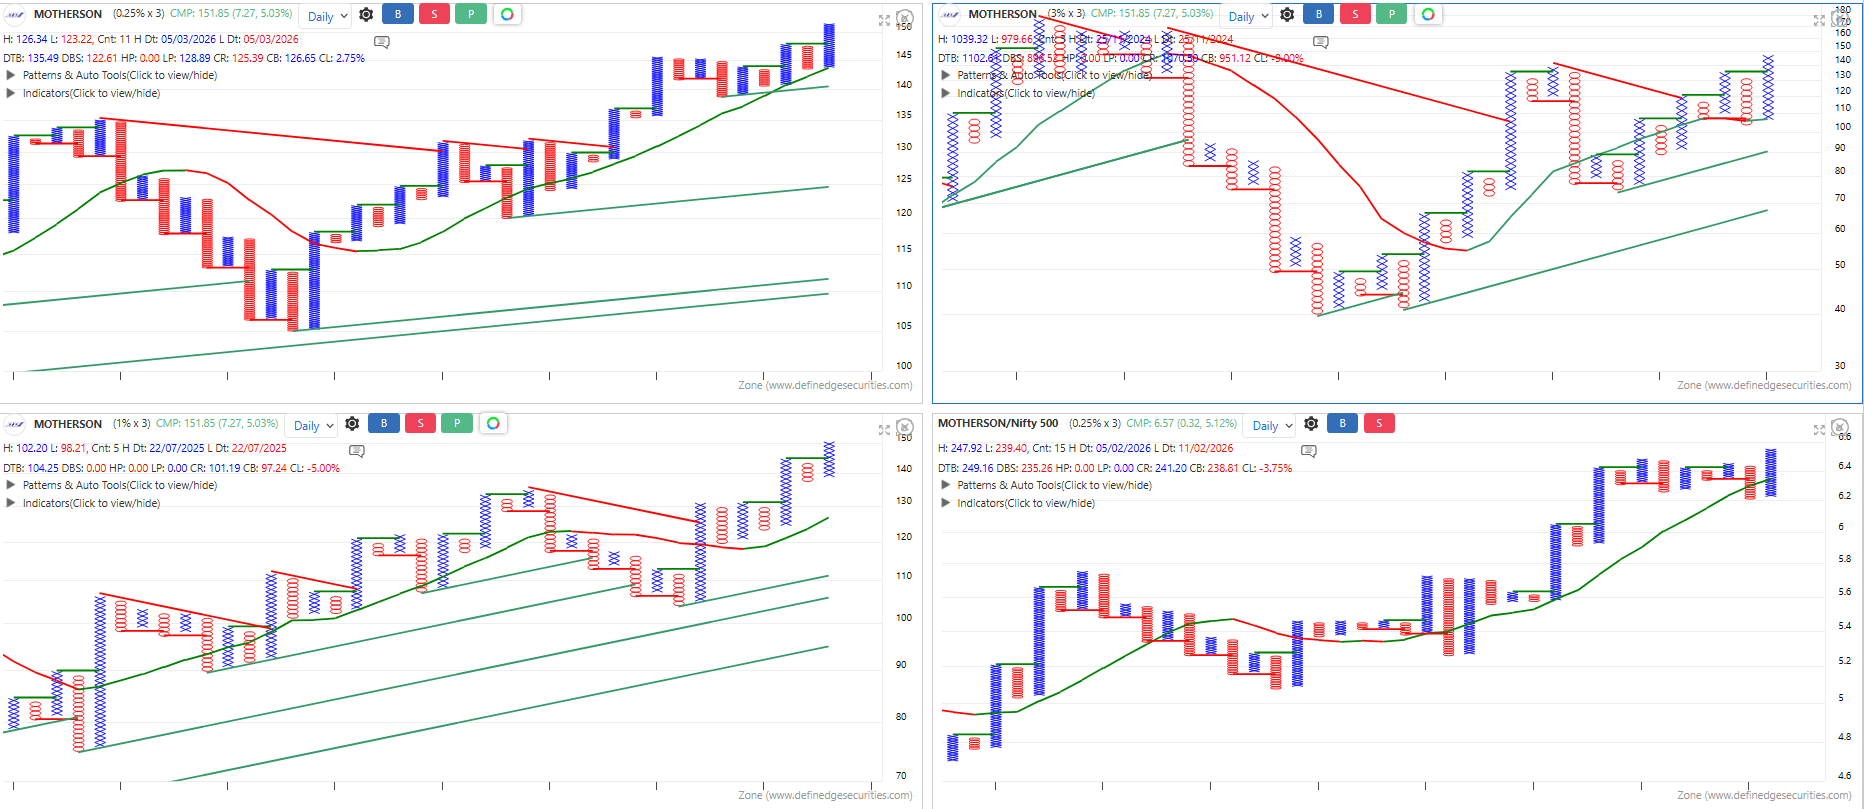
 there is a 45 degree TL on 0.25 and 3 once or two trading secession need for confirmation
 -
-
-
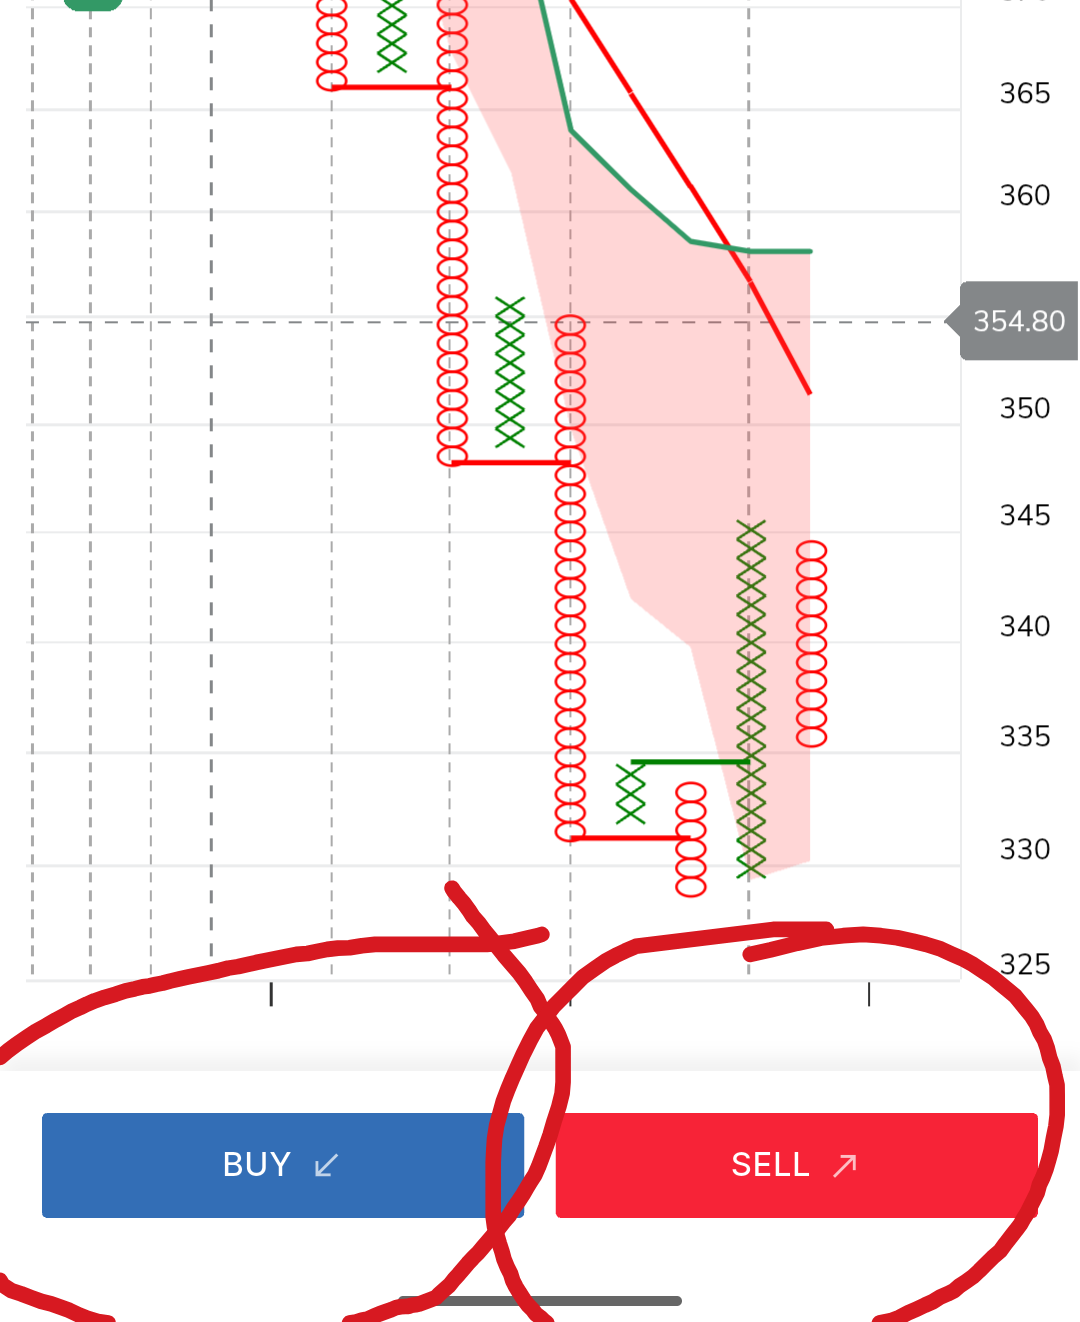
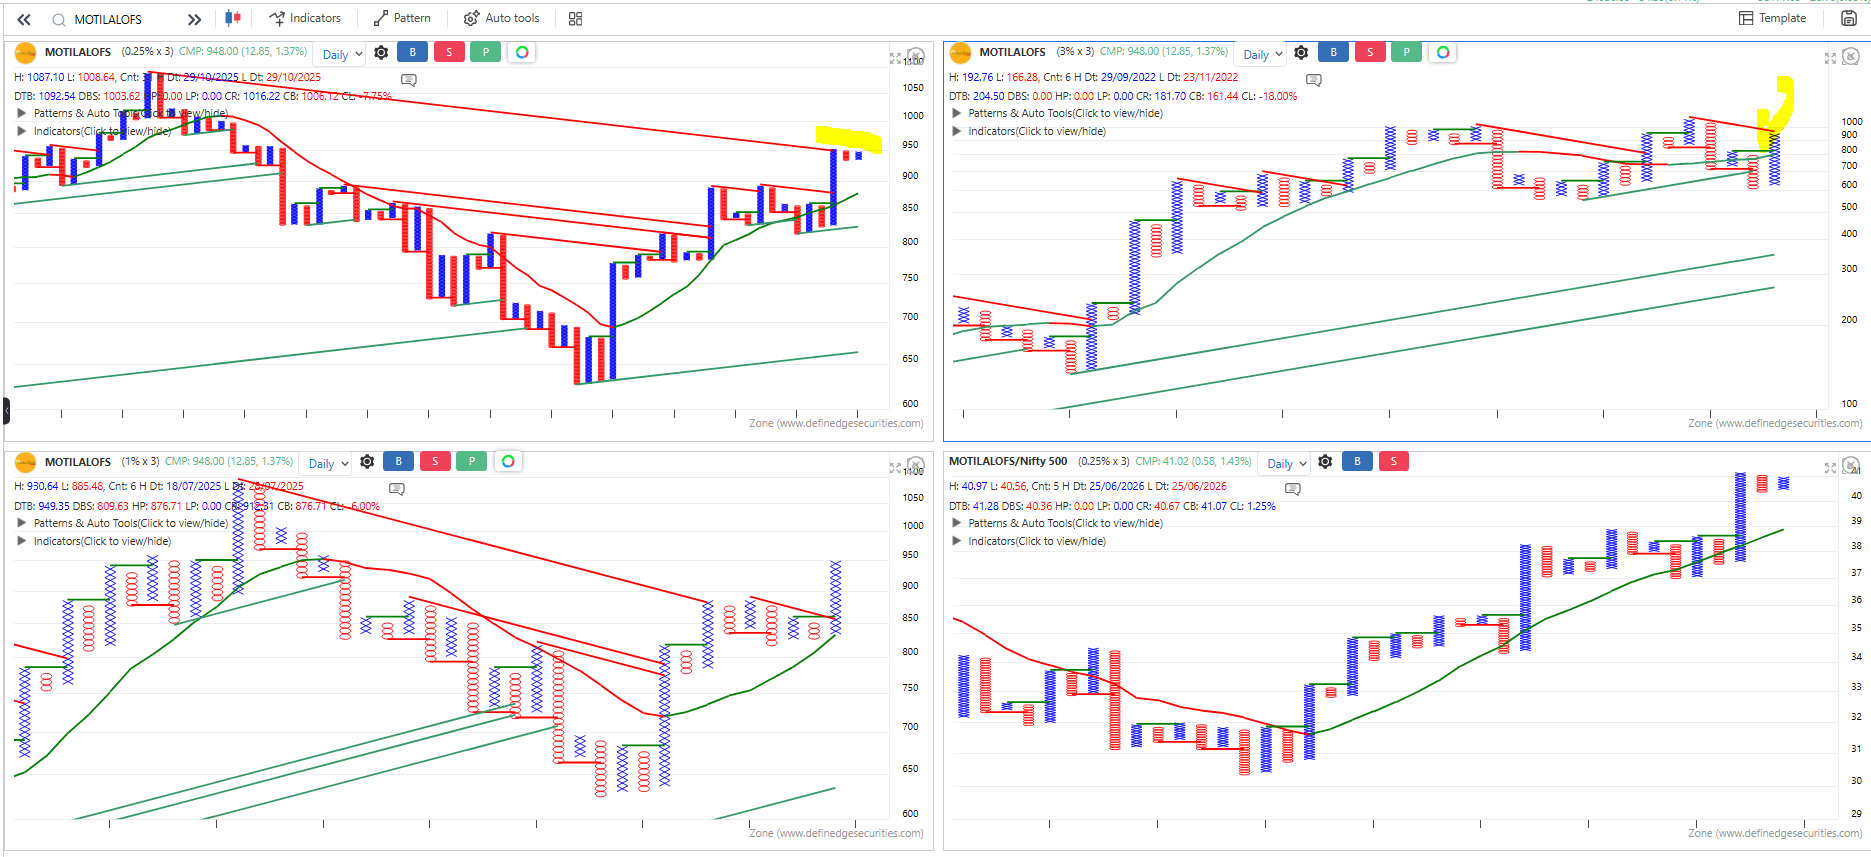
Pls change the arrows, your Buy arrow is down and Sell arrow is up .Have marking done pls check . For the current mkt condition,it is right,what you buy will go down only

Thank you -
I tried all possibility before posting the above post, tried switching to 1 hr TF and adding intraday lines, then figuring it out the start of the month and was looking for vertical line from the quick header, but that was missing
. Basic, then I have to look into tool section, then I found it, I clicked it here comes the next issue with so many intraday lines forgot we're to plot the vertical line, tried to hunt, here when you are using vertical line from tools, the curser does not respond. .
I had even made a request last time, to add absolute ₹ value next to your %box size example if I am trading 0.25% I need to check what is the value of 0.25% box, in terms of money, I cannot keep checking previous day close price then calculate it into %. And I got a reply from your team to check high of the column and then add continue box value you get box % value, is this the way you answer. If we only have to do this calculation what is the point in taking definedge dmat account.
As a trader what difficulty I feel have expressed it, when things are clear and legible people acceptance is followed -
Hello definedge team,
Why you are not providing monthly vertical line in trade point, as it's visible in month wise in Rzone web and mobile app. You have vertical lines in trade point but they don't do what has to be done neither give a view for the month or so. By just looking at separater you come to know what was high and low for the previous month or so. Basics of charting are ignored. Pls add this a request
-
New zone web looks great with lots of improvements. And look sleek, UI looks great and nice. Keep it up guys
-
Hello Definedge team,
The midvalue is missing in Rzone Pnf charting method, request to Pls add this option also.
Thank you -
The advantage of this is I can enter at lower levels even on daily TFrame. @3% box size.
Here the Apollo Tyres is bullish and in coloum of X on all box size, and given BTB on 3% also -
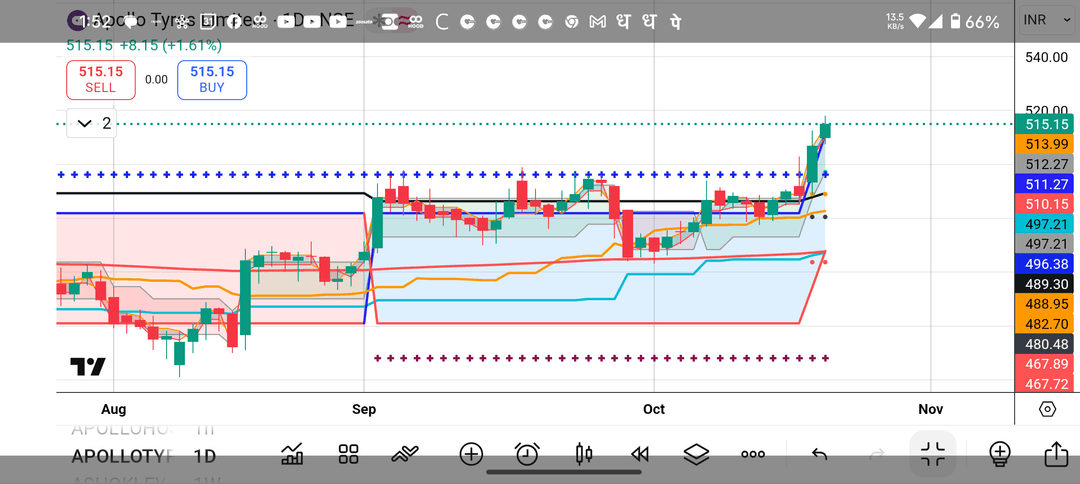
Have made a indicator which has 0.25%,1%,3%which can be manually entered your desire box size, which work on any lower Time frame from 1 day to intraday timeframe.
Have also made sma10 visible of all the boxsize. Can have 6 box size working all the time on any time frame. -
Would appreciate if it's explained..
Thank you -
"Hello Definedge Team,
I would like to request a feature enhancement: syncing drawings from higher time frame candle levels to at least the daily time frame. This would greatly improve analysis efficiency and accuracy.
Could you consider implementing this feature in future updates?
Thank you for your time and consideration.
regards -
@Brijesh-Bhatia sir here I am looking to make this scanner,but not able get. Request to help in making it ..

Condition 1 EOD day 1 =close >Open
Condition 2 EOD. Pday= day1 close >Pday 2 Open
Condition 3 EOD pday2 = Pday 2 close > pday3 open
Need 1 and 2 and 3
Request to help me in this -
Yes I also had mentioned about this any % we take we should know one box plotted any direction it's value in ₹ also, rather looking at previous day close price then multiplying it with the % of box price taken .. it's really a very big task. Above that you don't have previous day close price also displayed, if we take scrolling option from above to skip charts, how will I come to know close price of previous day ..
Only traders can find the pain.
Only traders can give you the valid feedback ..
Try to solve this issue. Definedge team -
Yes thank you..
Hope I made the requirement needed was understood by the team. And hope to be implemented in future charts -
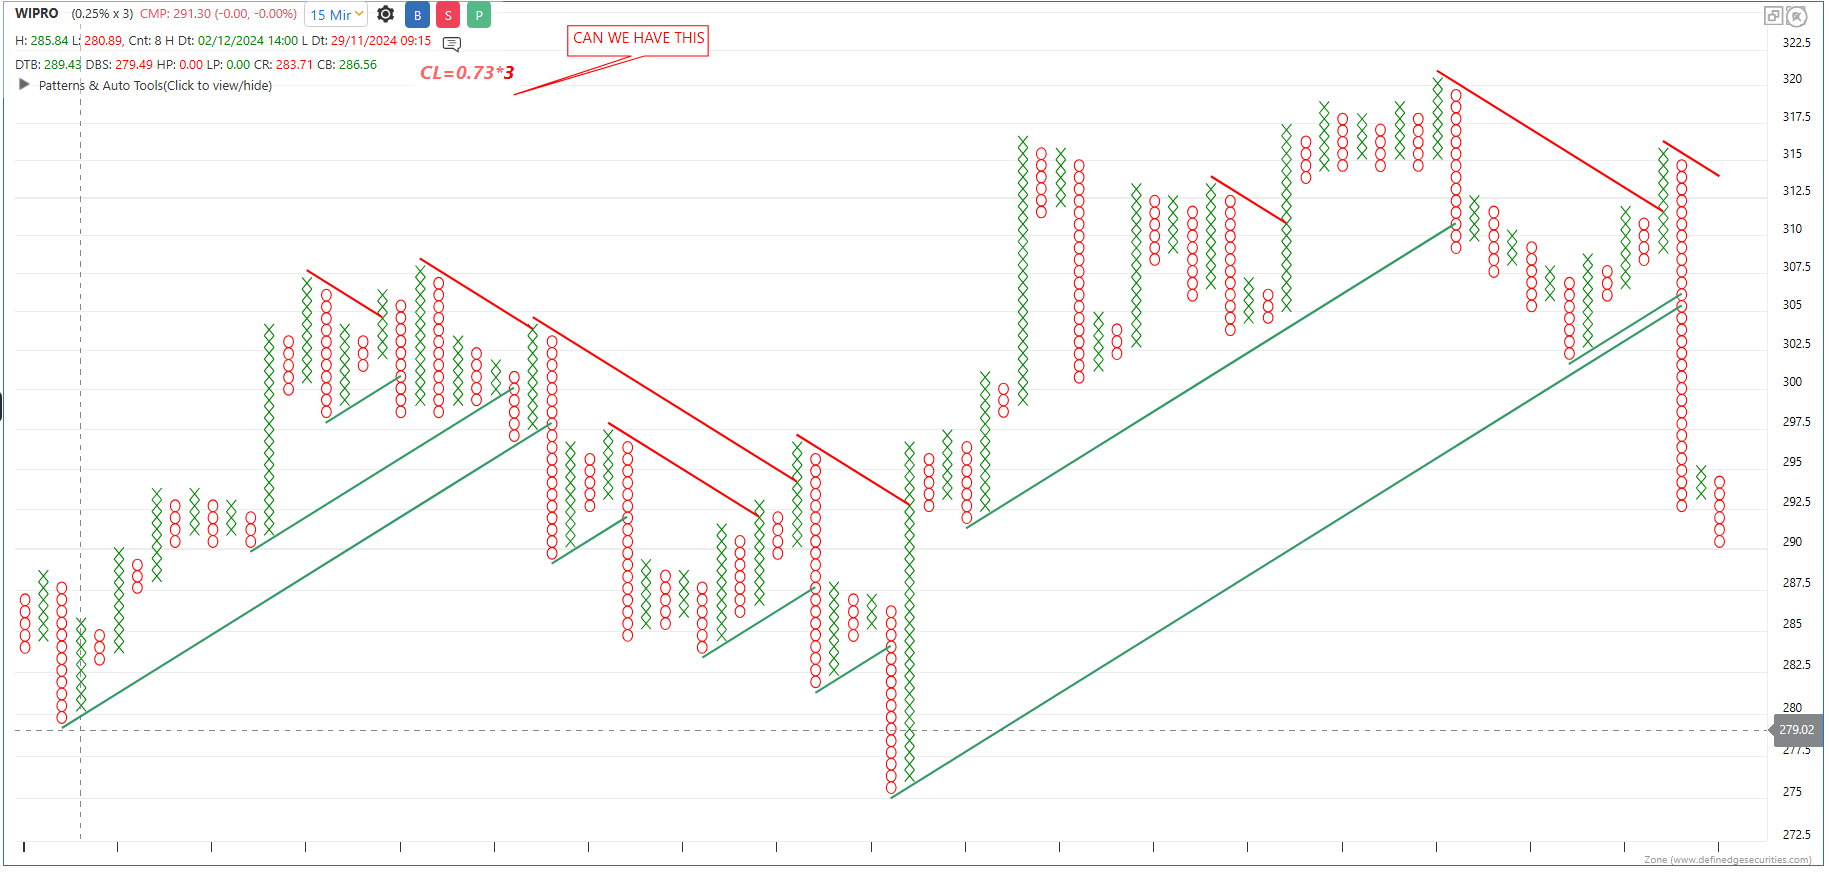 PLZ Request to add this on charts along with desire % box size, the % we change the CL = *3 will also change as per %, this gives one X or O value. And here Y axis value is also missing when curser is placed behind column on web version, it's available on trade point..
Thank you -
Hello sir,
Request you to understand the construction of Pnf charting method.
Books for reference to understand this in detail of Pnf, read prashant sir book. Go to shelf section in your login dashboard and look for pnf book. You can read all the book published there..
Thank you -
Hello definedge team
Request you to add previous day closing price in commentary, as you have column high and column low price. Pls also request box value price visible.If I am taking any % of box value So it will be easy to calculate if a move by so many ₹ the box will be plotted either direction. In trade point you have close in %, I request you all to Pls add this request..
Thank you -
Definedge team,
Requesting to add ultimate multi price performance score EOD, also as you have given ultimate RS matrix .. -
Request team to provide add stocks to watchlist option also, from scanner,it will be easy to add only that stocks bullish or bearish on pnf % as desired by client. I hope the easyiest way to update stocks on daily basis for trading or investment..rather looking daily for the universe of stocks ..
Thankyou and regards
Sunny behl -
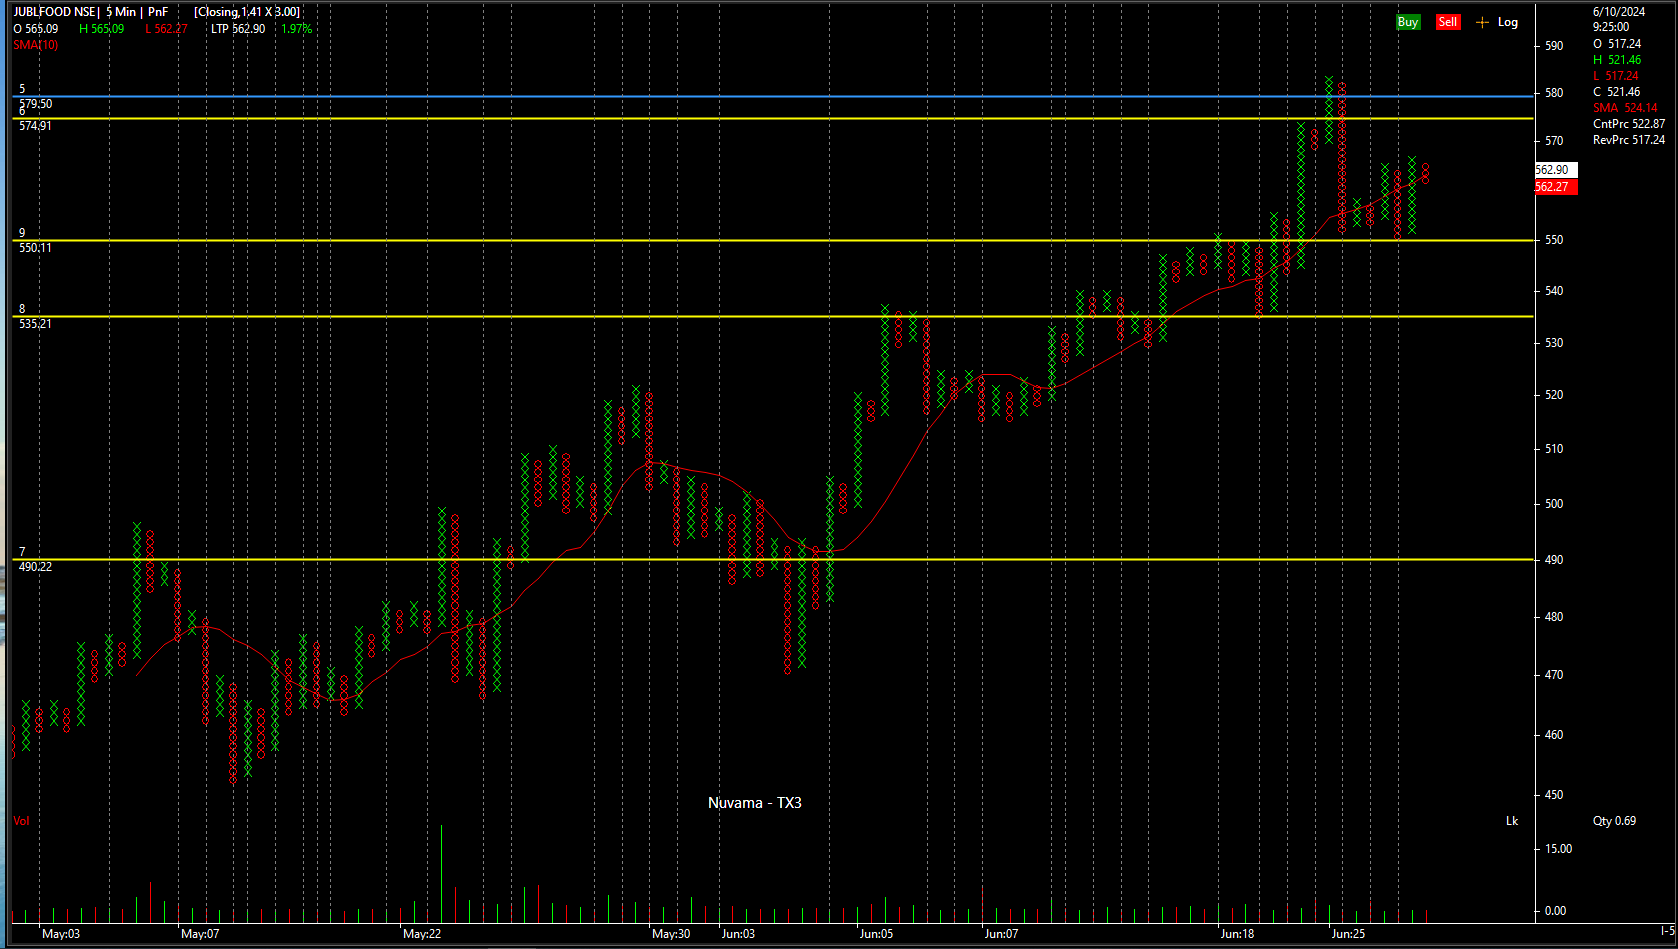
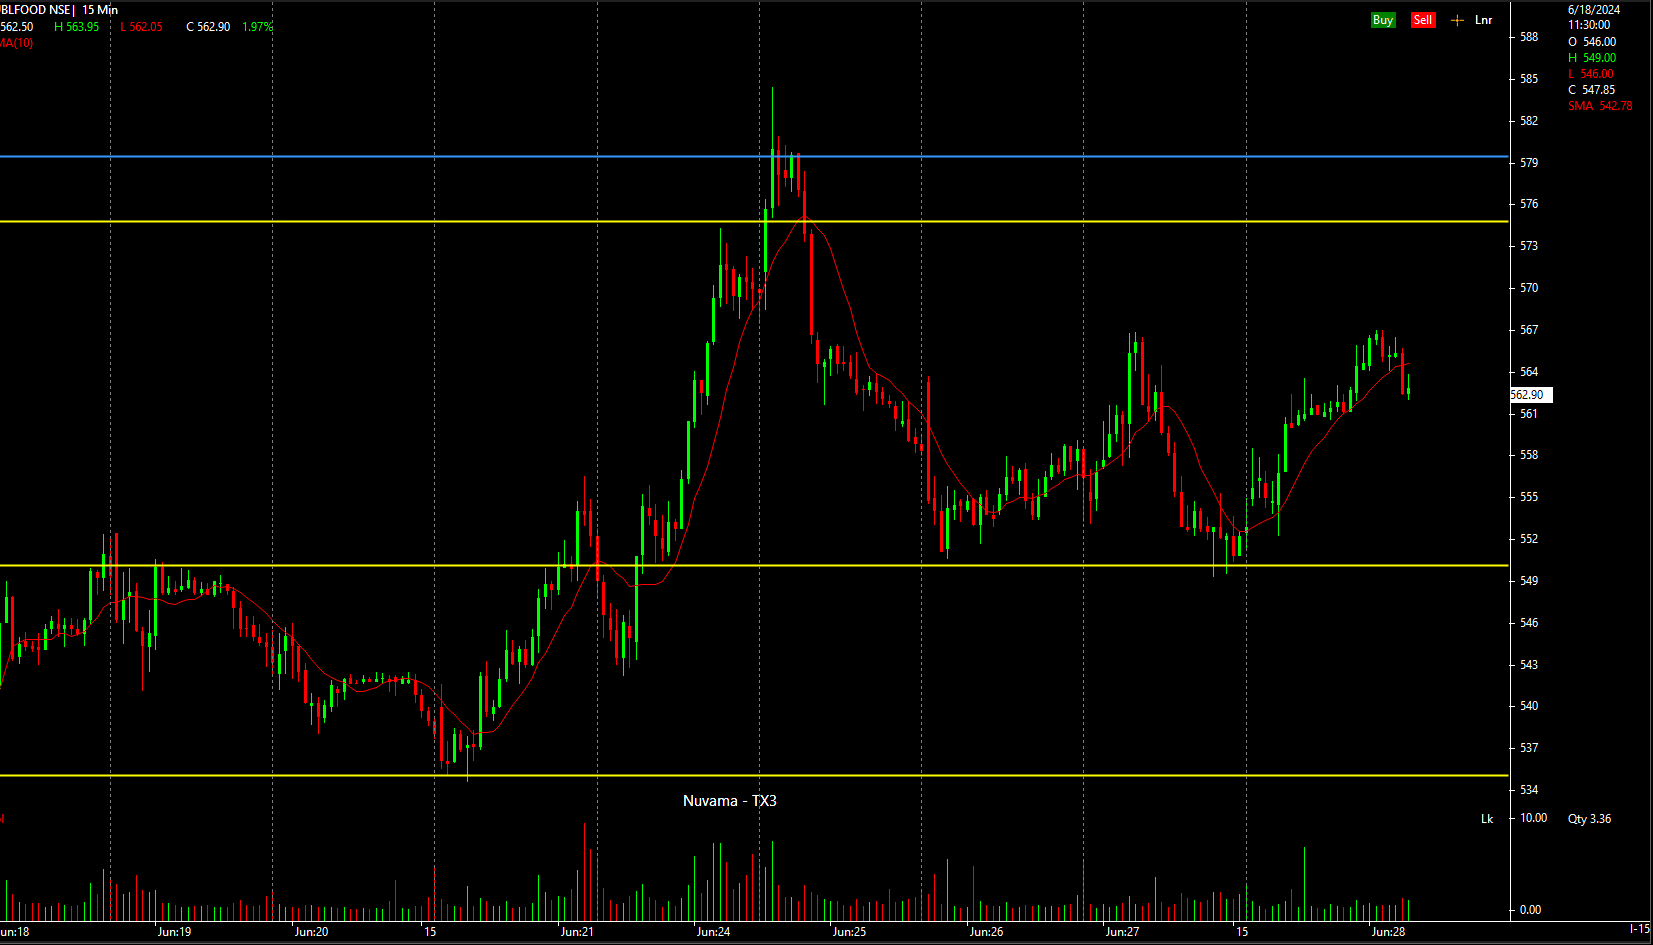
hello defineedge, here with sharing the concept to make you all understand what i am looking for, and request you guy one again to implement it in your platform,
here i am making anchor support\ resistance from daily 1 % box size in this software and marking this as short term resistance support, and drilling down to 60 min tf and marking with yellow lines box size is 0.25% , my markings are saved automatic here, and when i convert it into candlestick charting method,there are still available in that type of charting method, why cant your system adopt such easy concept. i have tweeted on X Dm also and made the team understand what is needed for a trader and investor, received the call also from your backend team. I am still waiting for the major update in your platform, I Feel my request is not falling to the ears of developer . Most of the things are adapted from TX3 NUWAMA why not thisThank you
-
hello definedge team,
can we have zig zag indicator based on percentage basis which can be plotted on candle and other charting tool, the reason is as we have to draw support and resistance on different box size on pnf and save. The save chart list is getting so big, have to keep scrolling and keep hunting . By plotting we come to know were is the swing low and high of the desire box size.Thankyou
-
Guys drawing on daily TF candlestick chart and saving the layout and switching to 15 or 60 min intraday timeframe nothing is seen
. Again back to daily TF then also my drawings are vanished, again have to go to save charts and again apply then it appears..
Guys your product in charting is very very low..
But your product to Pnf and Renko is good,but need to update linking higher % charts to lower % charts so that mkt are dynamic in nature ,changing layouts and looking what's happening..till than the damage is done. Hope you guys understand..and come to some fair solution.
Thank you -
Hello Vishal ji
Open your charts on the top you have a template,you can add in template your indicators and save it ..
Add indicators on the chart right click and save as template. What ever you save on charts with indicator that will be your default if you have only saved .. like this you can add what ever study with indicator and save as template ..
Hope I could help you -
Definedge team,
But TV plots Pnf,Renko only on daily Time frame
LowerTF possible if you have paid subscription of TV ..
You guys can try chartIq also -
Hello,
ultimate Matrix score ..
Were each sector performance is compared with other sector -
Hello definedge
Request you to link what ever we are drawing on HTF charts on Renko,pnf, candle to appear on ltf charts,it's easy to take decision to stay in the trade or exit. Drawing from HTF will avoid us to
open so many charts in real time ..which will reduce time of a trader. As a full time trader it is really some time pain looking all the stuff are in sink. And your tradepoint if making markings need to close and reopen and make a new marking, is really a pain ..
Request you all to take a look at the requirements mentioned..
Thankyou
Sunny Bahl
Pune
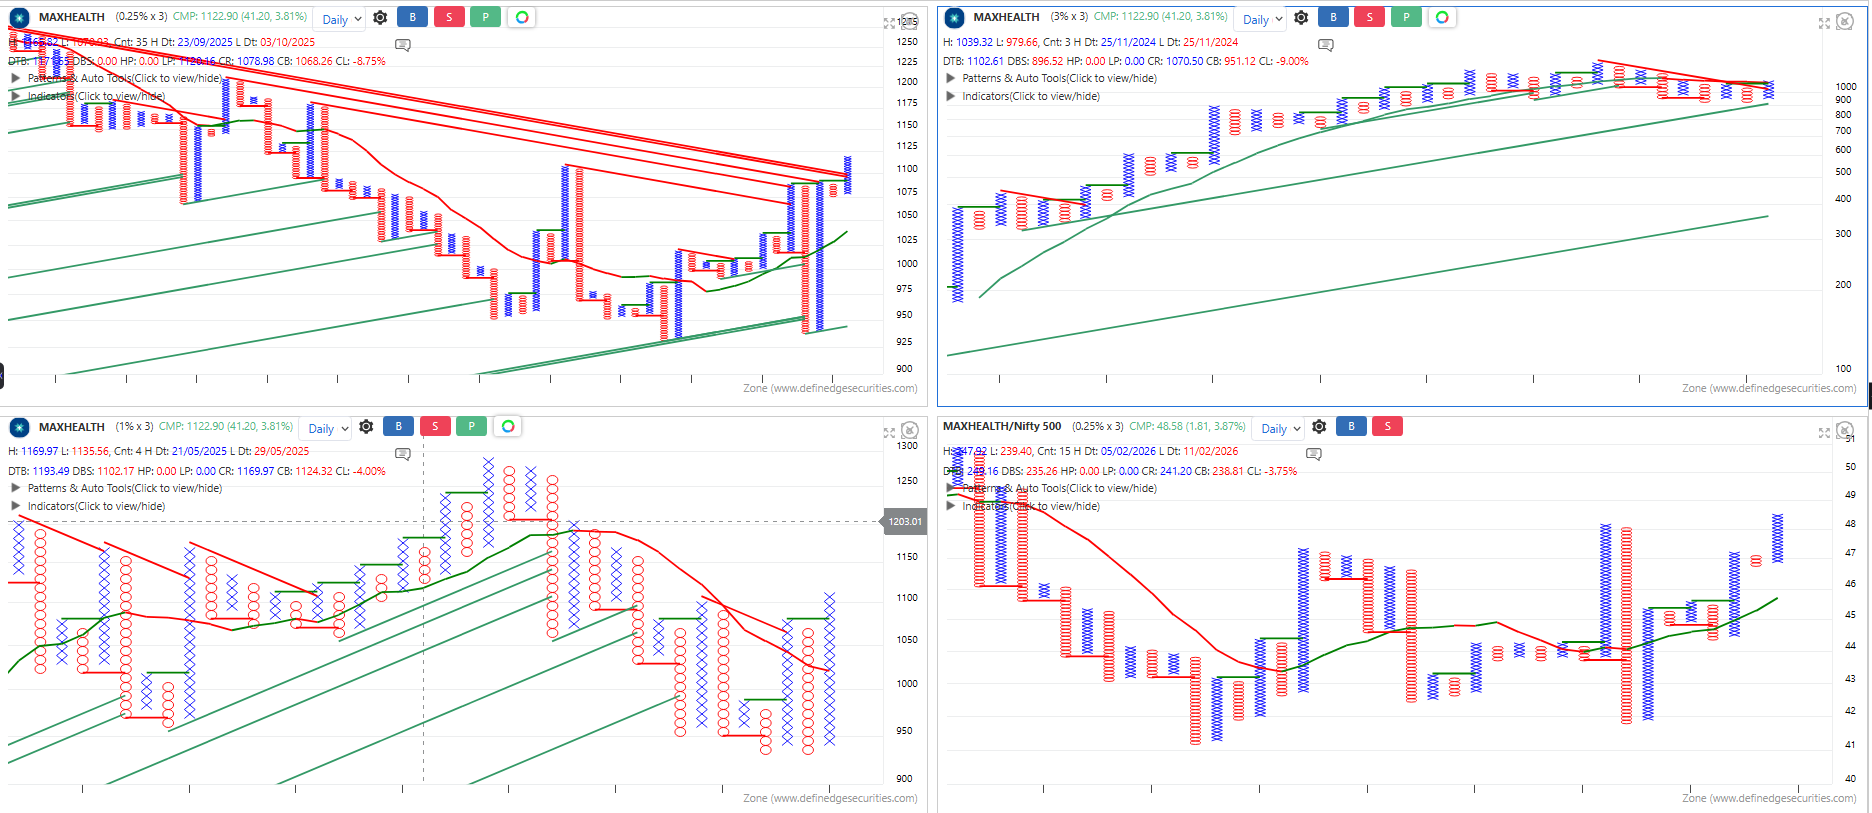
positive on all box size
positive on all box size
positive on all box size
positive on all box size
positive on all box size
positive on all box size
Basic to be corrected
Trade point candlestick charts
Trade point candlestick charts
New zone web
Midvalue missing in Rzone
Pnf indicator made on candlestick chart on TV
Pnf indicator made on candlestick chart on TV
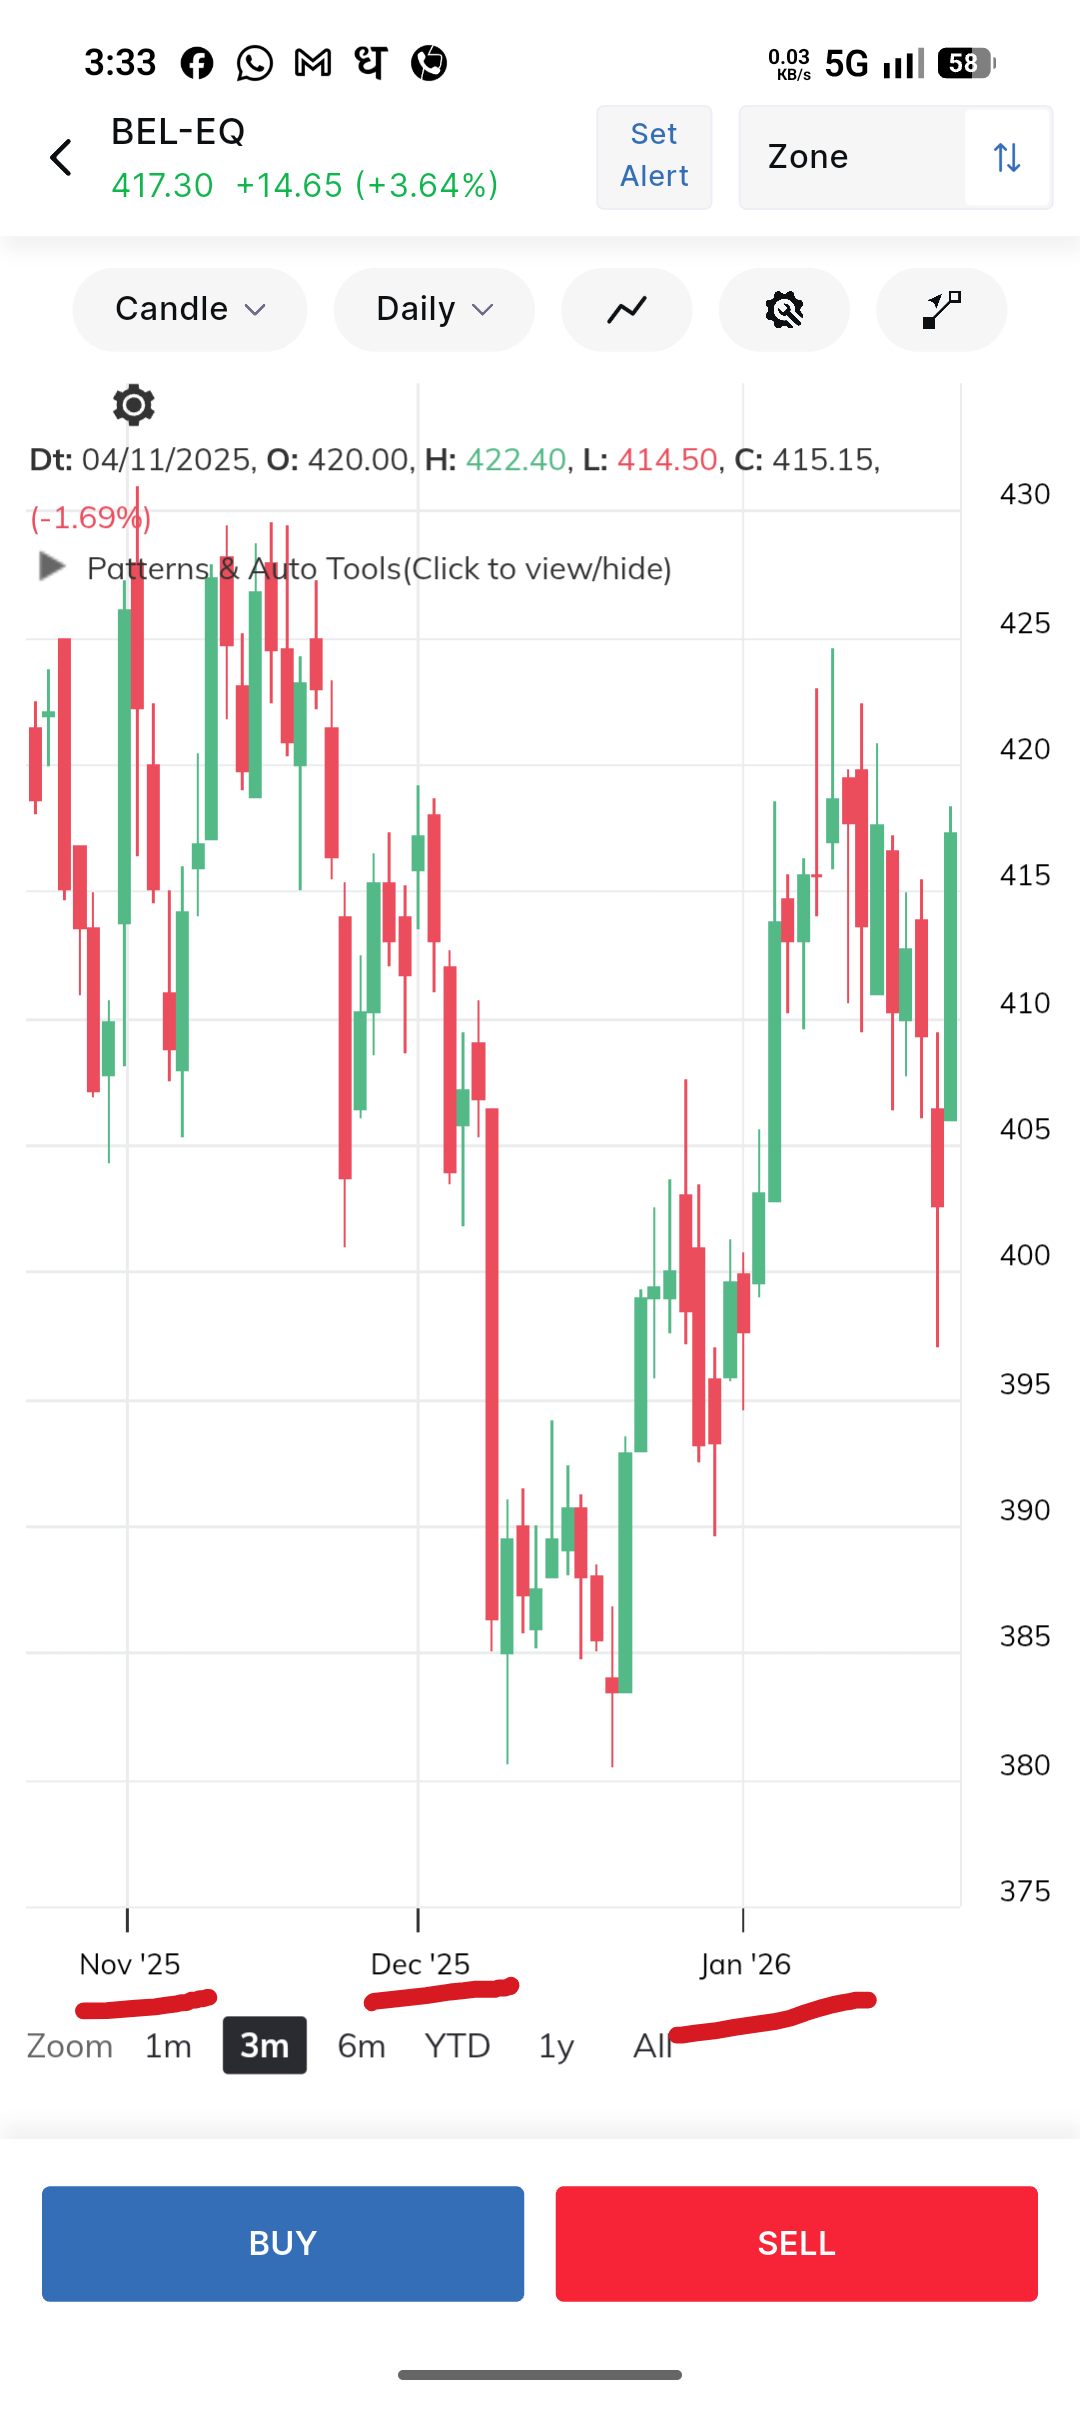
How to scroll left or move charts up and down
Linking of drawings from HTF
Scanning, condition need help
High and Low value difference and Box size value in Rupees wrt %
request to add this on charts
request to add this on charts
Doubt with Low value of coulmn shown on zoneweb
Request to add previous day closing price in commentary.
Request for performance score
Request to add stocks tab direct from scanner to watchlist
this is what i am requesting from ages
indicator request
Drawings on ohlc
How to set a Default Chart Template in Zone Web / R Zone?
Tradingview Integration
UM Score in Mobile zone scanner
Linking MTFcharts drawing on LTF