• Recent
  • Categories
  • 0 Unread 0
  • Popular
  • Tags
  • More
    • Guidelines
    • Disclaimer
  • Users
Skins
  • Light
  • Default
  • Cerulean
  • Cosmo
  • Flatly
  • Journal
  • Litera
  • Lumen
  • Lux
  • Materia
  • Minty
  • Morph
  • Pulse
  • Quartz
  • Sandstone
  • Simplex
  • Sketchy
  • Spacelab
  • United
  • Yeti
  • Zephyr
  • Dark
  • Cyborg
  • Darkly
  • Slate
  • Solar
  • Superhero
  • Vapor
Collapse
Definedge Forum Logo
T

Tapan Jani

Pro User

About
Topics
12
Replies
24
Groups
1
Followers
5
Following
0

All Replies

Recent Best Controversial

    Anatomy of a trend via iChimoku
  • T Tapan Jani

    20230930104134.png

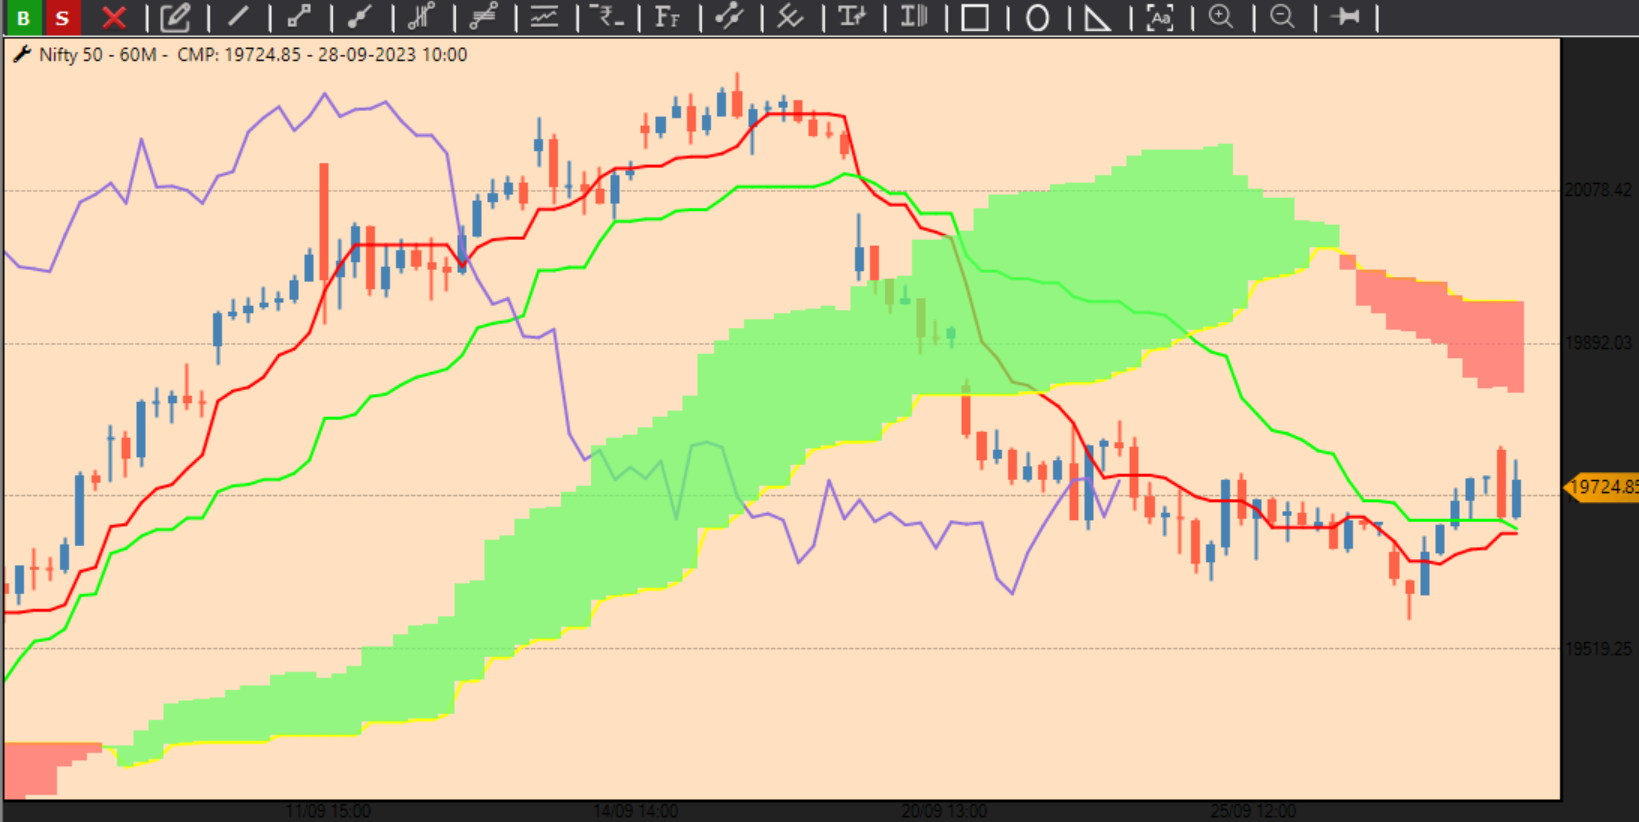
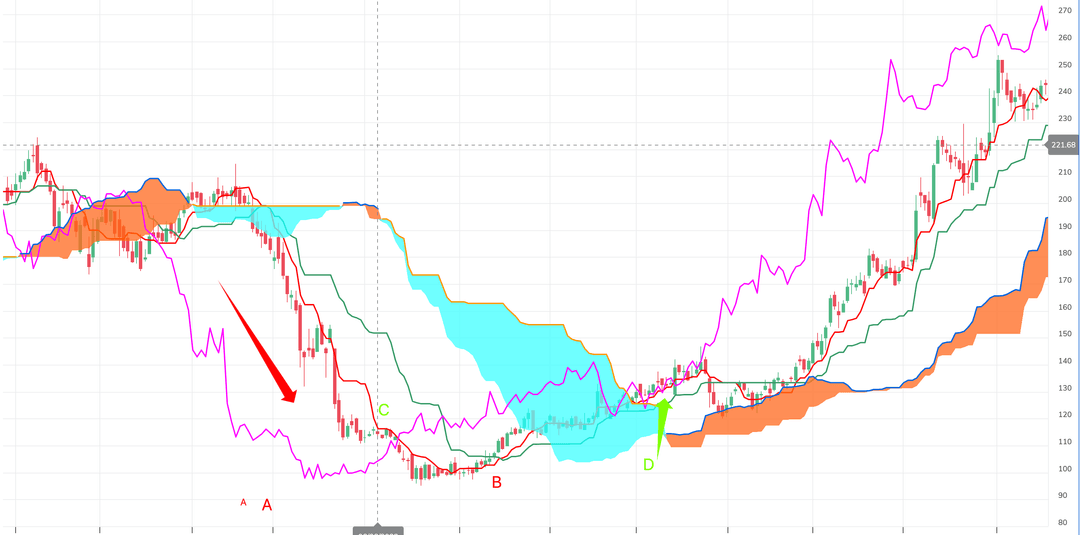
    This post is with reference to the chart on the right to understand various stages that a trend/instrument "TYPICALLY" goes through... Each stage offers opportunity for us to take a trade. The environment or the type of trade will vary and that is what we have to decided. We have to decide what kind of trader we are are we trend continuation type of trader? then we can take "Bearish trade" at point A. If we are someone who would like to take "COUNTER TRADE" i.e. take opposite to the current trade then we can take "BULLISH" trade at point B where TSKS are crossing positively but BELOW the cloud.

    If you are someone who likes to take "Counter Trend" trade but with confirmation we can take our trade at point C where CK has become bullish for the first time post this bearish trend.

    If you are a breakout trader with a trend then we can take a breakout trade at point D when price has crossed the ichimoku cloud for the first time post the bearish trend.

    Lastly if you are someone who is looking for confrimation + Pullback you can take a trade once CK is also above price and above the cloud.

    One can also do the similar analysis to know what the instrument is doing on multiple time frames and use that knowledge to take trade at our executing time frame based on the type of trader you are...

    Hope this article helps you a bit in understanding iChimoku in a better manner.

    Have a good weekend 🙂


  • Ichimoku
  • T Tapan Jani

    36db9bc0-e0e4-40aa-bd9b-80c7533add66-image.png

    The beauty of this chart is multfold.

    1. Look how smoothly has ck gone up on a weekly chart where it has not touched price even once in last 1 year.
    2. Look how smoothly the cloud has moved up with a slope where we havent had a single bearish cloud in last 1 year.
    3. Look how tk and ks have been moving up together , displaying a perfect requirment of a healthy trend.

    These are the types of candidates we should look for while we are looking for setup. We can take trades based on renko or p&F...

    #ichimoku


  • Simple Way to Find Strong Ichimoku stocks
  • T Tapan Jani

    Go to indicator digger and run ichimoku scanner. Select only those stocks that have status as strong uptrend (the pullback crossover column should be blank).

    Now on the list of stocks on the strong uptrend , look for trades based on your P&F or Renko scanner.

    8464387a-a7a5-4904-89ba-216e35a510e8-image.png


  • Phoenix Looks Good
  • T Tapan Jani

    d06ddb38-756a-4fe4-86b8-b0228513f481-image.png

    All boxes tick.. looks good...


  • Nifty Hourly #ichimoku
  • T Tapan Jani

    ed1f2b0b-d15c-4df6-9705-74381cff507d-image.png

    Look at the chart of Nifty on 1 hr. If price manages to go above high of preavious candle , it will push TK up, creating TSKS Cross also this will lead to CK above candle. All boxes ticked for reversal !


  • P&F Fusion Matrix
  • T Tapan Jani

    Here i am running Fusion Matrix on all 750 Stocks. I am a positional trader and hence i am using box size of 1,2,4 and 5. Here i have short listed stock where the Risk is less than 10%. Please remember this is on 1 %. We can also try to find stocks that belong to sectors which are outperforming the index like. PSU, or Rrealty...
    20230724200825.png


  • Nifty 1 hr iChimoku
  • T Tapan Jani

    3ced14ce-13fc-4292-aaa7-8acc9f732afd-image.png

    It is an hourly time frame that is going to give us clue what does nifty wants to do and what does it eventually do... For bulls two things must have TSKS cross for this nifty has to create a new hourly long (amongst last 9 candles) + ck has to go above price.

    For bears CK needs to go below price and everything will be bearish again... let us see what is in store for us


  • KK's Corner - Simple Santa Strategy - Revised
  • T Tapan Jani

    sir few questions. 1) when using the high low retracement what % should we keep? 2) while running the 10-20 ema we should use daily time frame or weekly?

  • 1 / 1
  • Login

  • Login or register to search.
  • Blog
  • Youtube Videos
  • Refresh
  • First post
    Last post
0
  • Recent
  • Categories
  • Unread 0
  • Popular
  • Tags
  • More
    • Guidelines
    • Disclaimer
  • Users
  • Login

  • Login or register to search.
  • Blog
  • Youtube Videos
  • Refresh