
30 Years of Nifty Data: The Quarter That Consistently Wins
-
Most people look at the stock market one year at a time. We wanted to see what happens if you split each year into its four parts and compare them.
The Indian financial year runs from April to March, so it splits like this:
April to June
July to September
October to December
January to MarchWe took the Nifty's return for each of these quarters over 30 years, from FY1997 to FY2026, and compared them. One quarter came out on top: October to December.
The average gain
On average, the Nifty gained about 5.1% in the October-December quarter. The others look like this:
April-June: about 4.5%
July-September: about 3.6%
January-March: about 0%The January-March quarter gave almost nothing over 30 years. October-December was clearly ahead of it.
How often does it go up?
In 19 of the 30 years, the Nifty finished higher in October-December. It fell in 10 years and stayed flat in one (exactly 0.0%).
Ten falls is the lowest of any quarter. April-June was close behind with 11 falls, and it also went up 19 times out of 30. So the race there is tight. But on both the average gain and the number of falls, October-December comes out slightly ahead.
When it falls, it usually falls small
In the 10 years the quarter went down, the fall was usually modest: -4.7%, -3.9%, -2.3%, -0.6%, -0.6%, -1.5%. The average fall across all 10 years was about 5.8%. In the 19 years it went up, the average gain was about 11%. So the good years paid roughly twice what the bad years took away.
Is it just one lucky year?
Every quarter has one very lucky year that pushes its average up. So We took out the best year from each quarter and checked again:
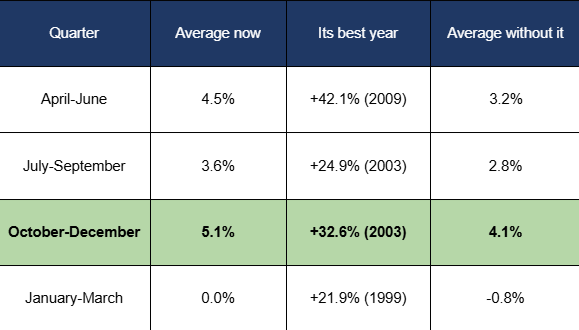
October-December is still on top, and its lead grows. April-June drops the most, because it depended heavily on one huge year, the 2009 recovery after the crash. October-December still averages about 4.1% without its best year.
January-March goes slightly negative. Without its best year, it has lost money on average over 30 years.
One more point: 2003 was the best year for both July-September and October-December, because the market rose strongly through the whole second half of that year. If you remove 2003 from all four quarters instead, October-December and April-June both land at about 4.1%. So the honest summary is that October-December is the best, with April-June very close behind.
But it is not safe
The worst fall in this quarter was -24.5%, in October-December 2008, during the global financial crisis. That is a big loss in just three months. A more recent weak year was 2024, when the quarter fell 8.4%.
The best was +32.6% in October-December 2003.
Has it still worked recently?
Over the last 10 years, October-December went up 6 times and down 4 times. That is a bit weaker than the full 30-year record. The pattern has not disappeared, but it is not a guarantee either.
Why might this happen?
Honestly, nobody knows for sure. Some people point to the festival season, when spending picks up and companies often report better business. Others say it is just luck and the pattern will fade. We can't prove either explanation, so we would treat it as something interesting, not as a rule.
What should you take from this?
Over 30 years, October to December has been the best quarter for the Nifty, with April to June close behind.
It went up about 2 out of every 3 years.
It still fell 10 times, and once very badly.
January to March has given almost nothing on average.
These figures are for the Nifty's price only, without dividends.