Top-down approach: Effective Sector analysis and Stock analysis using RZone & TradePoint
-
There was a question about sector analysis and the top-down approach in the Definedge platform RZone.
There are many scanners and studies available in RZone to perform that. If you are new to the platform and the subject, here is a simple guide to help you get started.
Sector analysis
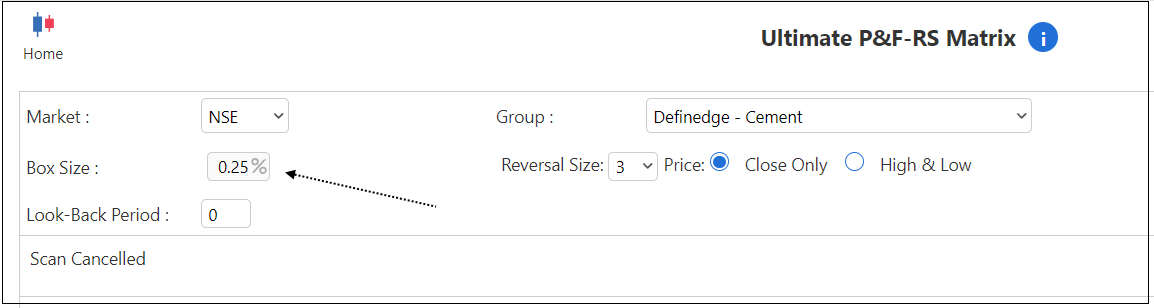
Go to Rzone -> Matrix: Price & RS -> Ultimate P&F – RS Matrix
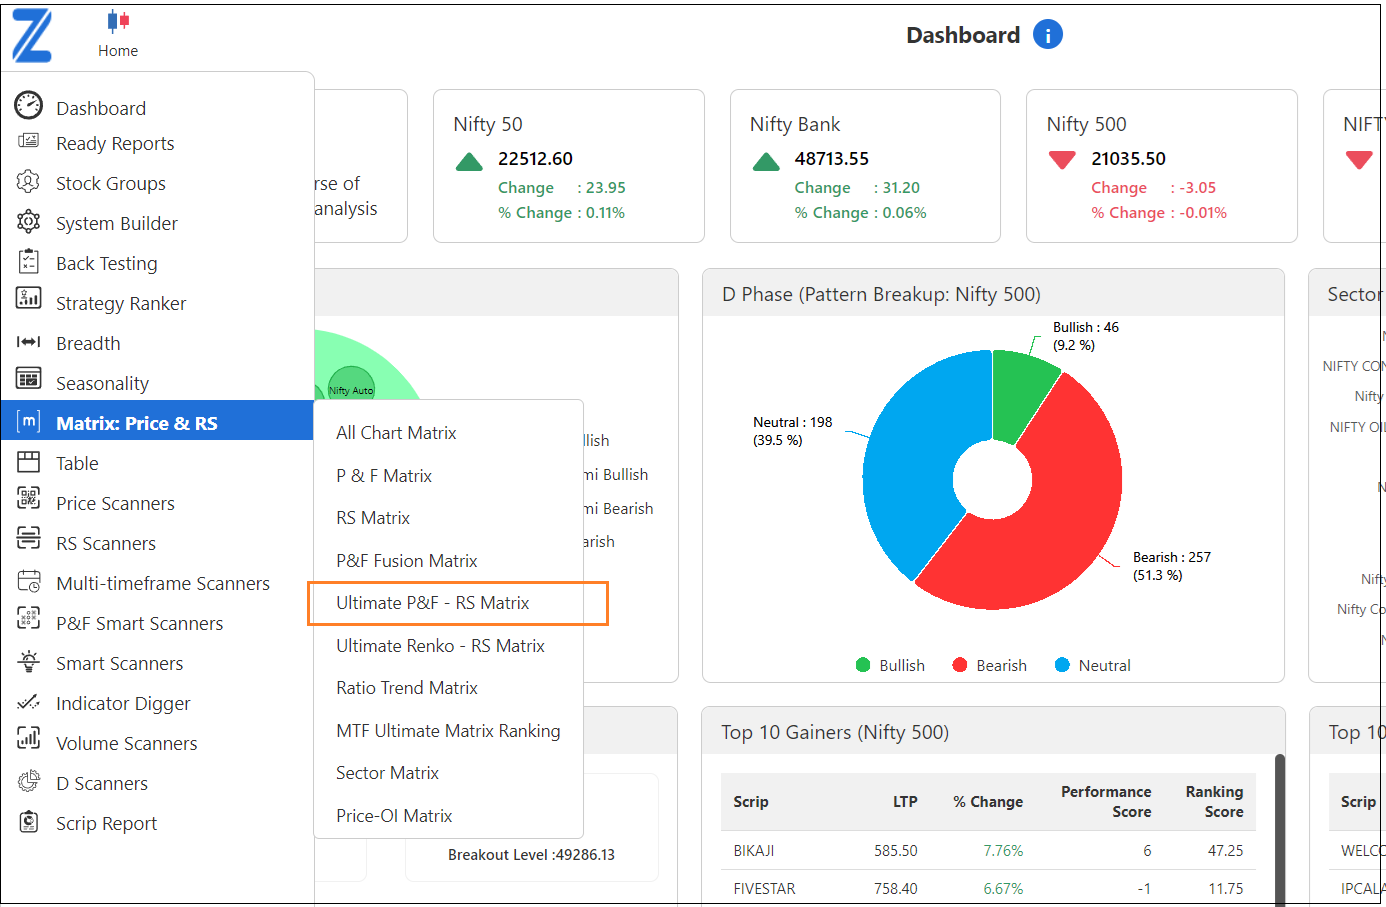
Select the group 'NSE All Sectors' and scan.
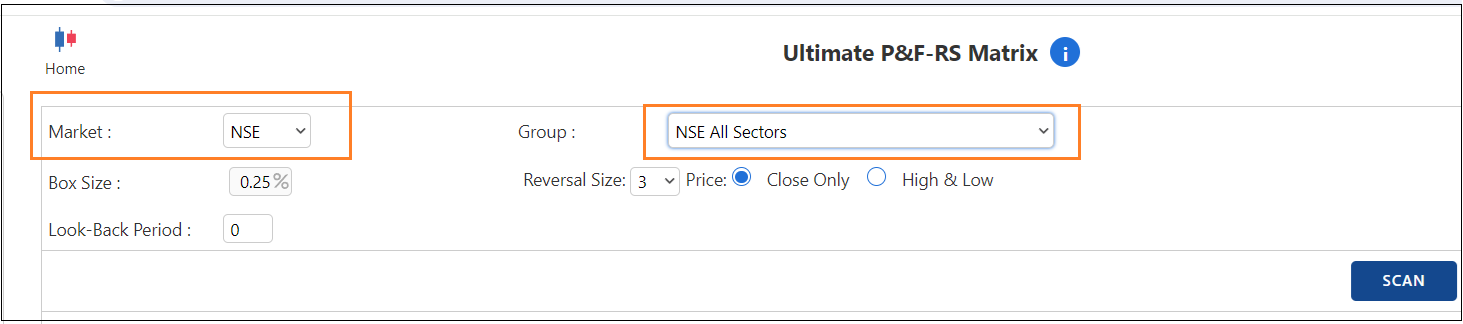
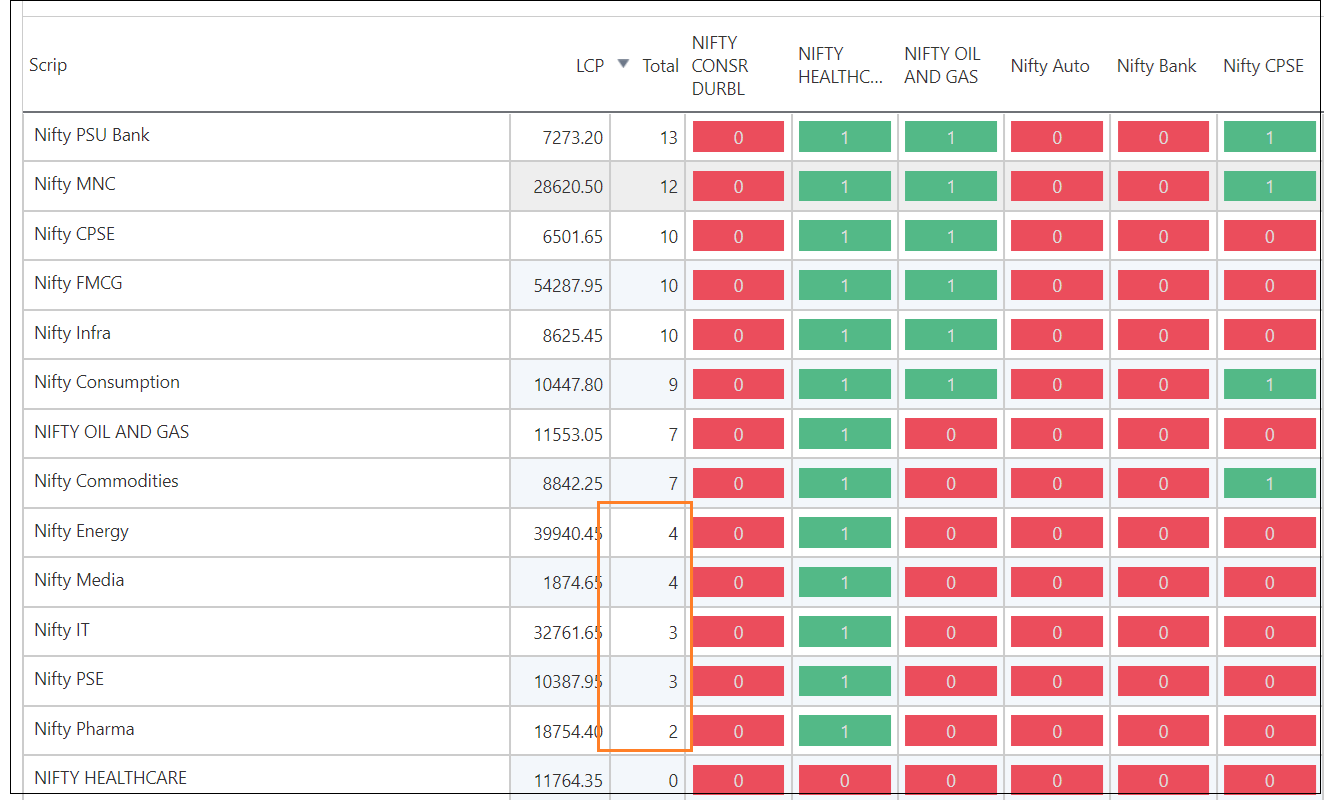
A scanner will compare the performance of each sector with that of all other sectors within the group. The performance is calculated based on the price pattern and momentum, not on the period returns. As a result, it is very unique and useful.
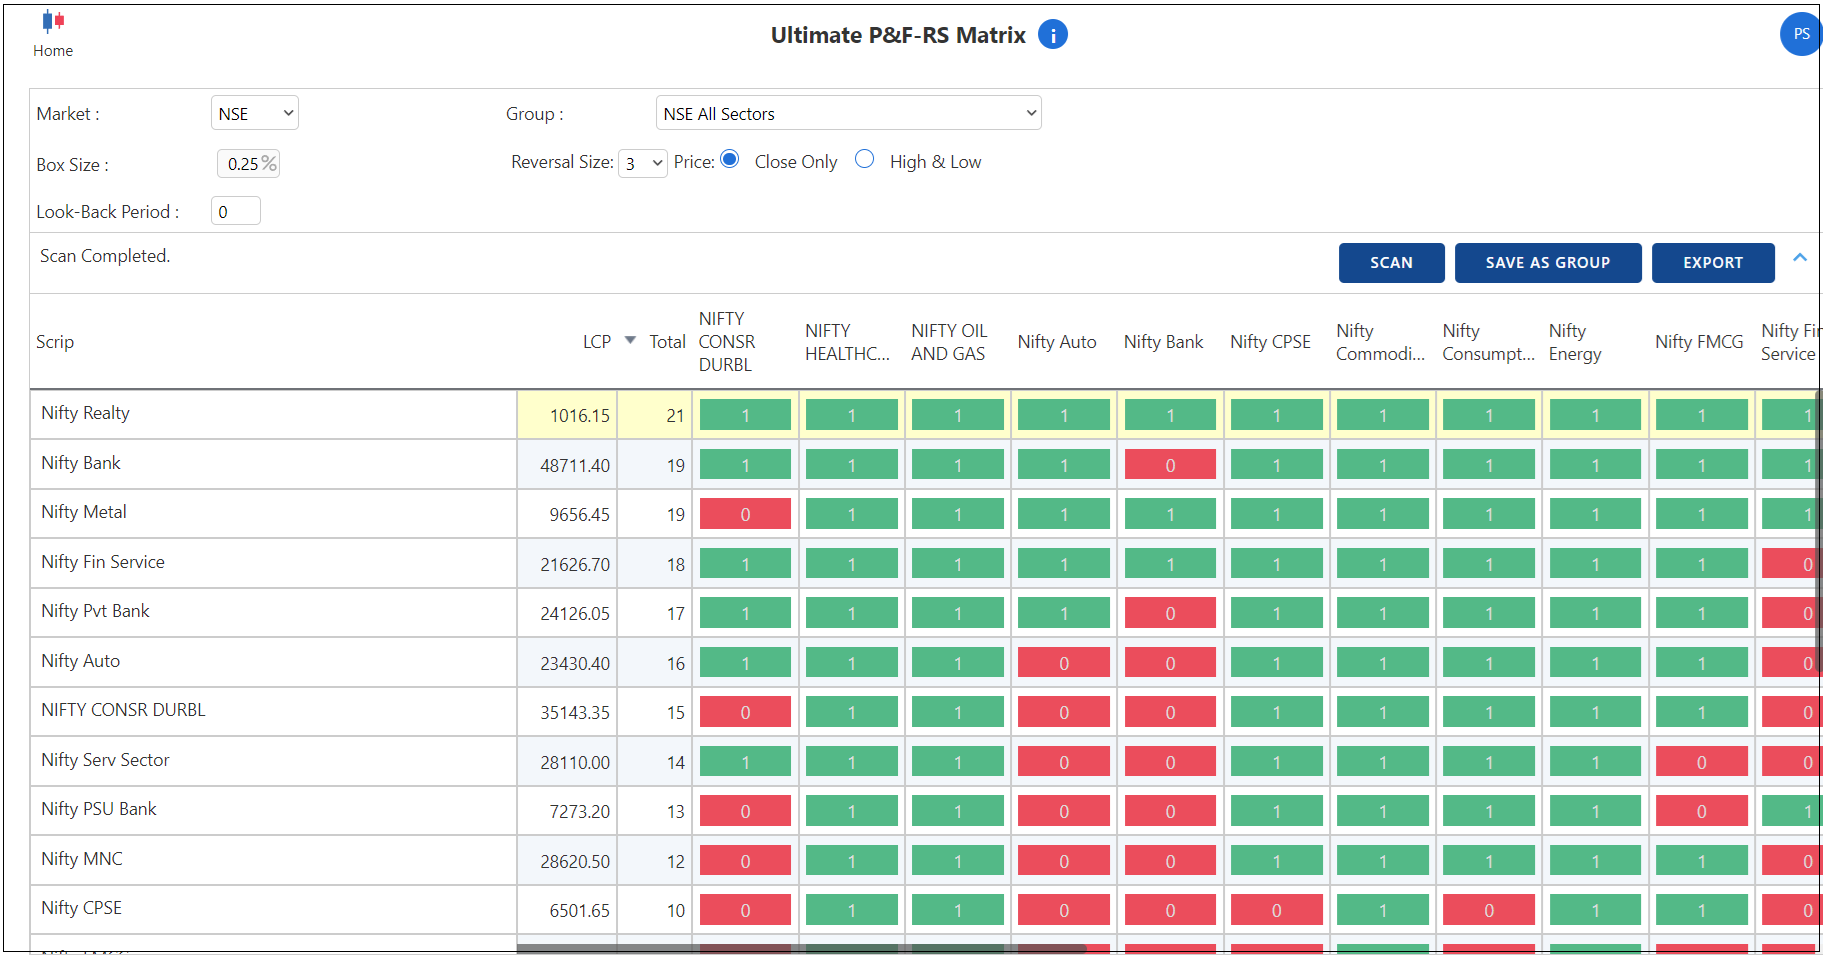
The score will be 1 if there is outperformance and 0 if there is underperformance.
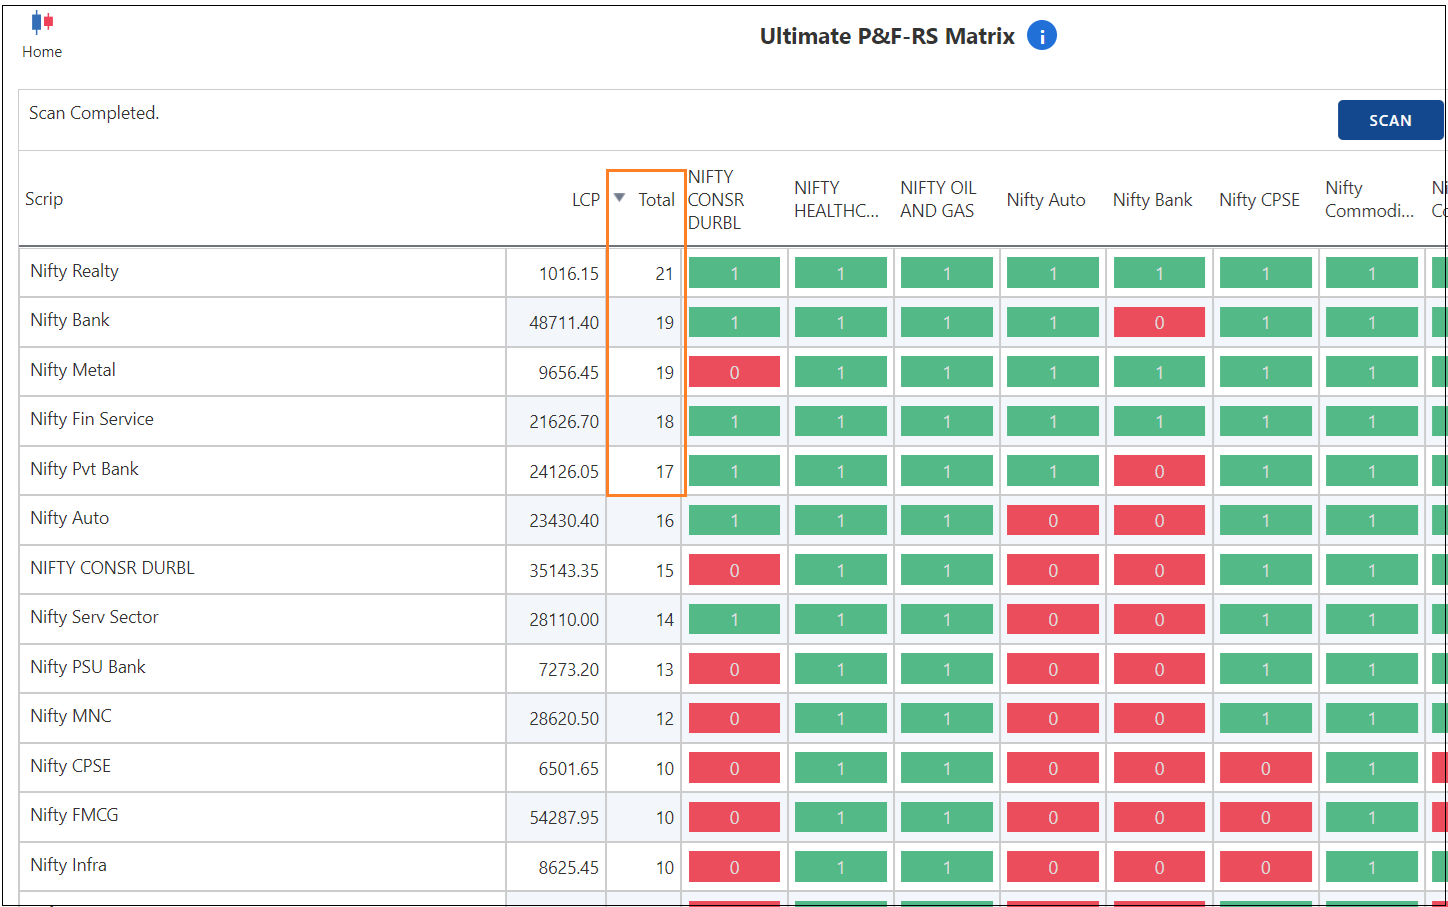
The sector with the better score is outperforming most other sectors. The list of sectors can be sorted according to the total score.This allows you to gain an understanding of the top three to four performing sectors (with high scores). Underperforming sectors are those with lower scores at the bottom.
These are NSE sectors. A total of 23 NSE sectors are maintained by NSE.
Apart from that, there are 65 other sectors maintained by Definedge. It takes into account almost all stocks in listed in NSE.In the same scanner, select EQW market and select group 'Definedge all sectors'.
It will take some time for the scanner to calculate the performance of 65 sectors.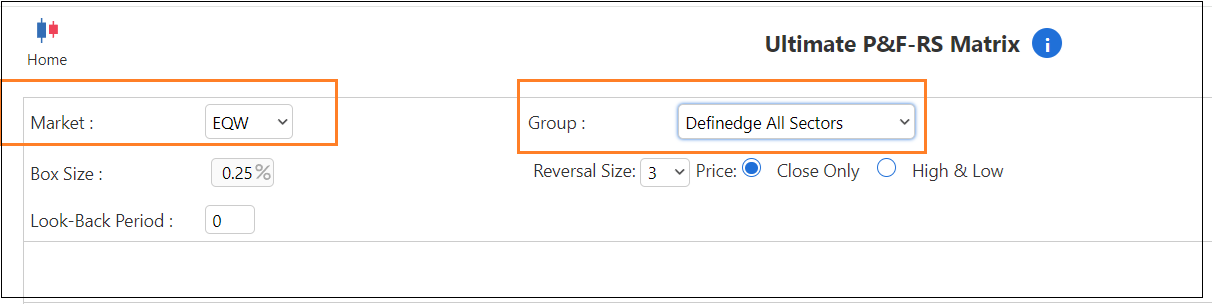
Sectors will high score are the outperforming sectors and sectors with low score are underperforming sectors.
This way you will come to know which sectors are doing better than others.
Stock anlaysis
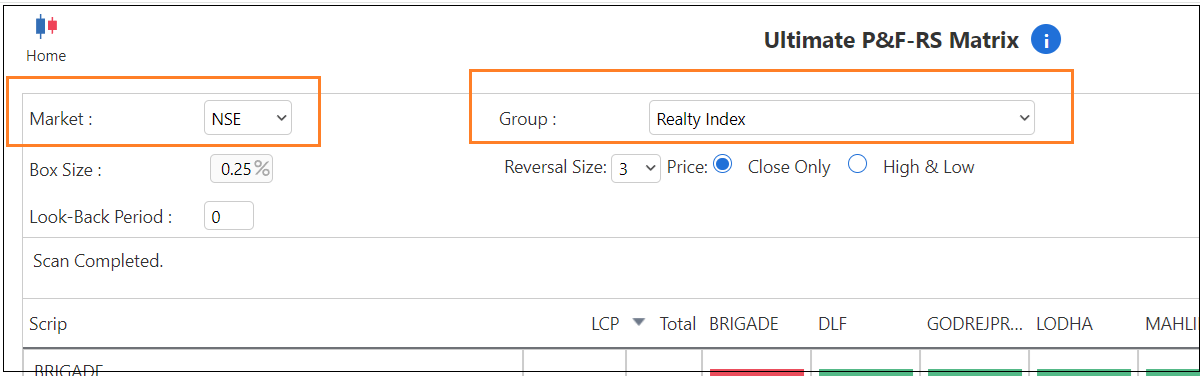
Now that you have identified the outperforming sector, select the sector name from the market group for identifying the top performing stocks in the sector. For the sector name, select the NSE market. Run the ultimate matrix scanner.
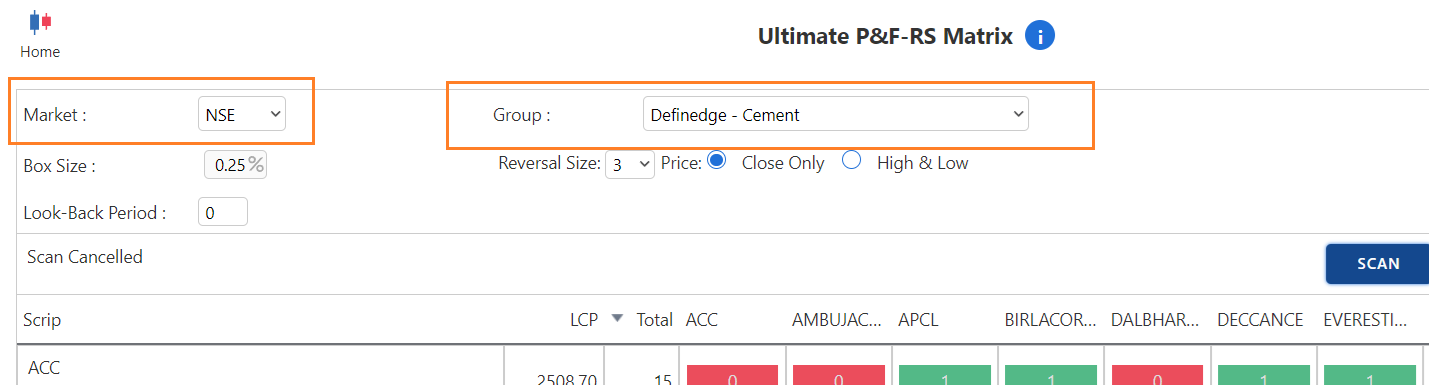
Stocks with high scores are outperformers in the sector. Stocks with low scores are underperforming.
Price analysis
Next step is to identify the prominent price patterns and strategies in those stocks and trade based on their risk-reward potential.
My recommendation in this case would be to use major P&F and Renko patterns with manageable risks.
This is a simple yet very useful and time-tested approach to effective stock selection.
The box size should be 0.25% for short-term, 1% for medium-term, and 3% for long-term.Regards,
Prashant -
Thanks for this. What are the other methods for this using candlestick? Can we use this scanner and then trade stocks based on candlestick? Also, since it doesn't consider returns in a period, it means we can get stocks at good entry points instead of stocks that may have already run a lot?