• Recent
  • Categories
  • 0 Unread 0
  • Popular
  • Tags
  • More
    • Guidelines
    • Disclaimer
  • Users
Skins
  • Light
  • Default
  • Cerulean
  • Cosmo
  • Flatly
  • Journal
  • Litera
  • Lumen
  • Lux
  • Materia
  • Minty
  • Morph
  • Pulse
  • Quartz
  • Sandstone
  • Simplex
  • Sketchy
  • Spacelab
  • United
  • Yeti
  • Zephyr
  • Dark
  • Cyborg
  • Darkly
  • Slate
  • Solar
  • Superhero
  • Vapor
Collapse
Definedge Forum Logo

Breadth charts in Point & Figure

Scheduled Pinned Locked Moved Suggestions & Feedback
6 Posts 3 Posters 411 Views
    • Oldest to Newest
    • Newest to Oldest
    • Most Votes
Reply
  • Reply as topic
Log in to reply
This topic has been deleted. Only users with topic management privileges can see it.
  • D Offline
    D Offline
    Davinder Sachdeva

    Pro User

    wrote on last edited by
    #1

    At present market breadth charts are available only in line charts and not in Point & Figure, please add this feature, it will be very useful and easy to interpret the market breadth. Also ,in trade point desktop, in Market breadth, the Bullish % indicator is not available, request you to add it.

    1 Reply Last reply
    0
  • Neha Pandey Offline
    neha.pandey@definedge.comN Offline
    Neha Pandey

    Definedge

    wrote on last edited by
    #2

    For now, you can follow the below steps to add market breadth charts in Point & Figure:

    1. In TradePoint terminal Select the preferred Breadth scanner
    2. Select Preferred Market Segment > Preferred group > Chart Input type > Time range >Scan to plot the breadth indicator
    3. Right-click on the Breadth Line chart > Export to CSV
    4. Store the CSV file in MyMkt file of TradePoint folder > Change Date format according to the MyMkt date format.
    5. To check MyMky date format > Setting > manage data > MyMkt ( EOD date format )
    6. Save the file & Close it.
    7. Select P&F chart chose market segment as MyMkt > Scrip name as CSV file name > Press Ok
    8. You will be able to see Breadth indicator values in P&F chart format.

    We will make this simpler and make breadth chart data readily available in P&F and Renko format.
    Bullish % will be available on the desktop soon. This feature is currently available in the RZone (web version).

    1 Reply Last reply
    0
  • RAGUNATH_AG Offline
    agragunath@gmail.comA Offline
    RAGUNATH_AG

    Pro User

    wrote on last edited by
    #3

    This feature is currently available in the RZone (web version).

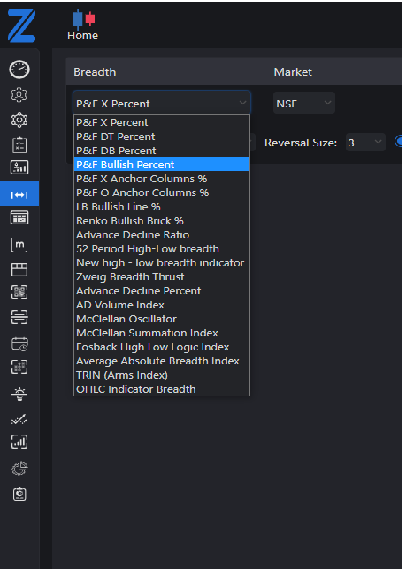
    How to plot in Zone?

    1 Reply Last reply
    0
  • Neha Pandey Offline
    neha.pandey@definedge.comN Offline
    Neha Pandey

    Definedge

    wrote on last edited by
    #4

    You can follow the below path:
    Login to https://zone.definedgesecurities.com/ -> RZone -> Breadth -> Breadth Chart -> select P&F Bullish Percent from the dropdown

    1 Reply Last reply
    0
  • Neha Pandey Offline
    neha.pandey@definedge.comN Offline
    Neha Pandey

    Definedge

    wrote on last edited by
    #5

    P&F Bullish Percent.png

    1 Reply Last reply
    1
  • D Offline
    D Offline
    Davinder Sachdeva

    Pro User

    wrote on last edited by
    #6

    @Neha-Pandey @Prashant-Shah Any update on my request.

    1 Reply Last reply
    0


Recent Posts

  • manzandu123@gmail.comM
    Daily Setup 12th MAY 2025 (MKLH)
  • V
    REBALANCING
  • P
    Issue in quarterly option - Momentum Investing
  • DefinedgeD
    Friday webinar
  • J
    Open vertical counts target price selection
  • Login

  • Login or register to search.
  • Blog
  • Youtube Videos
  • Refresh
  • First post
    Last post
0
  • Recent
  • Categories
  • Unread 0
  • Popular
  • Tags
  • More
    • Guidelines
    • Disclaimer
  • Users
  • Login

  • Login or register to search.
  • Blog
  • Youtube Videos
  • Refresh