How can I draw trendline, horizental or vertical line on indicators
-
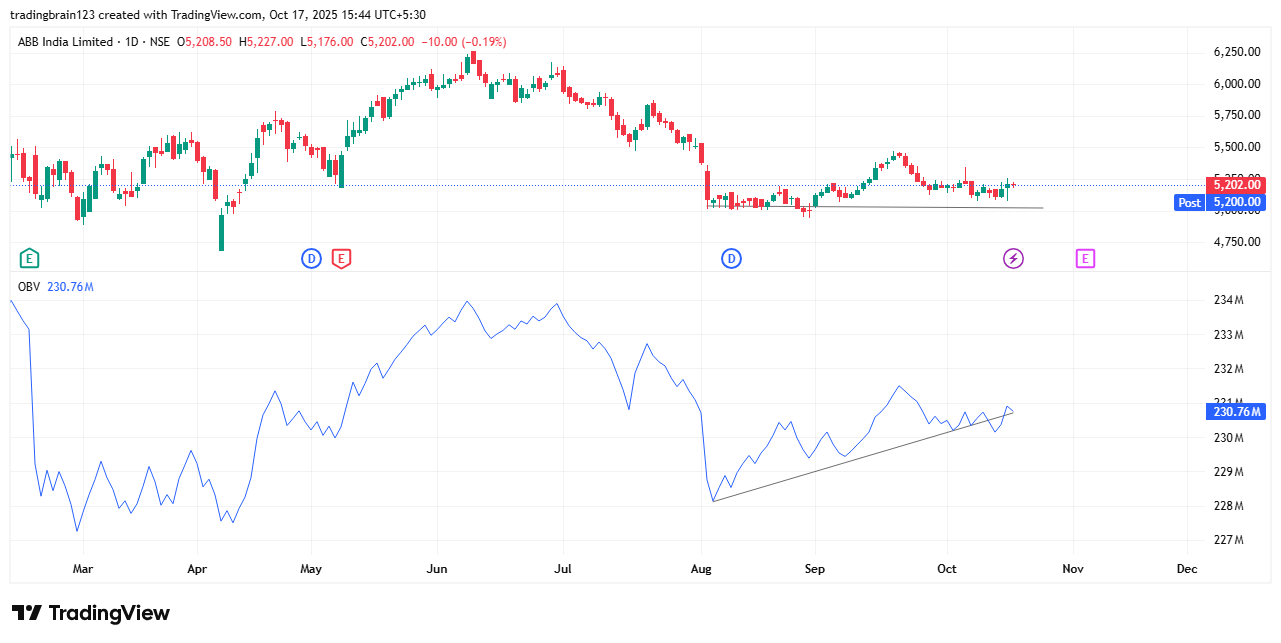
I am trying to learn OBV and some other indicators and want to find out the relation between indicator and price.I need to draw some trendlines and S/R lines in indicator area but I couldn't. please let me know how can I do that
-
-
the above screen shot is from Trading View or Definedge?
-
It's tradingview screenshot
-
@Radhakanta Samantara it's tradingview screenshot I want the same in trade point or zone