#VGM Pick – GVT&D
-
#VGM Pick – GVT&D
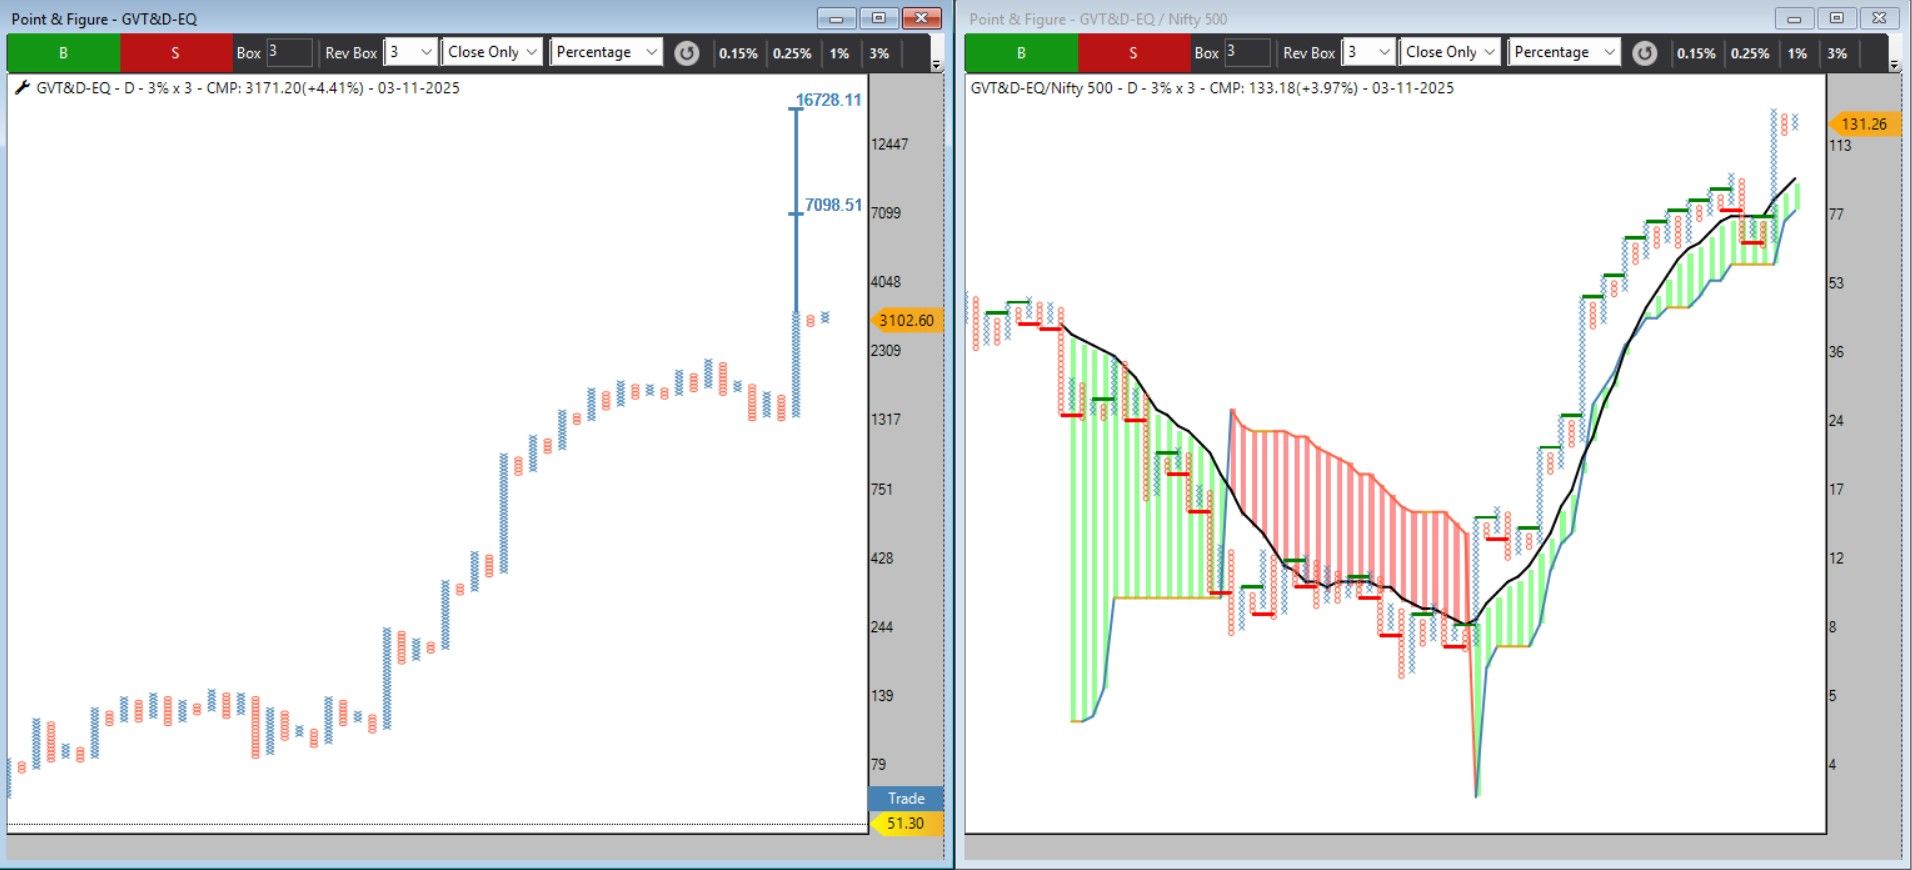
The stock has shown a strong bear trap → Bullish Anchor Column → Probable Super Pattern progression on both Price Chart and Relative Strength (RS) Chart.
This structure indicates that bulls are currently in control of the directional momentum.
Key Technical Highlights:
On Price Chart → OOPS Bullish, followed by Anchor Column, and now a Probable Bullish Super Pattern forming.
On RS Chart → Bullish Anchor Column + Super Pattern Setup confirms strength relative to the market.
MAST Indicator is bullish on both Price and RS.
Entry & Risk Management Plan For RS Or Price based Trade
Enter 50% position when PCR signal triggers.
Enter remaining 50% on DTB (Double Top Buy) confirmation.
Primary Stop-Loss: DBS (Double Bottom Sell) level.
→ This ensures rule-based risk control with momentum confirmation.This is a clean, rule-based setup backed by both price action and relative strength momentum.
Nishesh Jani,CFTe
#VGM #MomentumTrading #RelativeStrength #PointAndFigure #TechnicalAnalysis #AnchorColumn #SuperPattern #StocksWithStrength #nisheshjani #AhmedabadNest