Continuation Pattern
-
Hi,
I couldn't find any of the continuation patterns like Bull Flag, Pennant, Ascending Triangle, Rectangle - How can I scan stocks for such patterns?
Thanks
-
@Vinubhai Patel You can scan the Super Pattern or Anchor Column Follow Through pattern for the Flag and Pennant in the P&F scanner.
For Triangle, there is a Triangle scanner in P&F.
For Rectangle, you can scan Triple Top or Quadruple.
-
Thanks for your quick response @Brijesh-Bhatia.
I have few other questions regarding the system builder if you can help with :How can I filter stocks with following criteria
1.
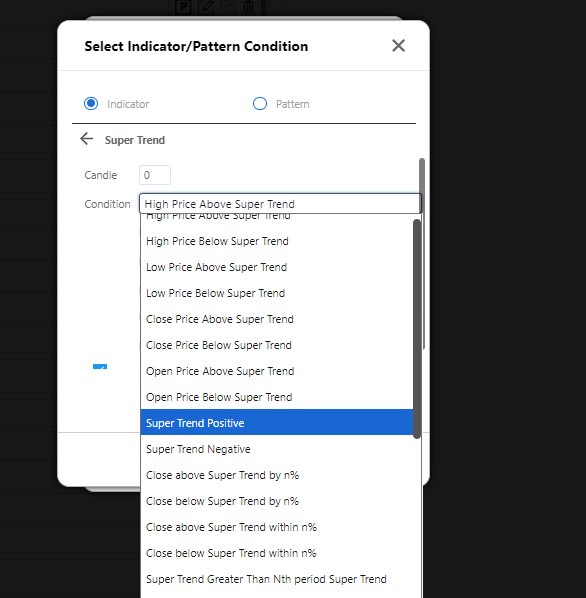
Supertrend turned positive
High of the above bar where the super trend turned positive/green is broken20 EMA is broken down
Low of the above bar where 20EMA is broken down is breachedHow can I exit on the breach of the low of the bar on which we have entered into the position?
Thanks
")
-
@Vinubhai Patel You can create the scanner in the system builder.
-
@Brijesh-Bhatia - appreciate your help
i.e. - If I created momentify strategy with some strategy and want to exit at the low of the buying candle - how do I create it in the system builder?
Similarly, how do I create a scanner in the system builder to filter the stocks based on following criteria:- Supertrend turned positive
- High of the above bar where the super trend turned positive/green is broken
As always - grateful to you and the team

-
-
Regarding the exit strategy, how will the system decide which candle low?
-
Regarding Super Trend turned Positive, there is a criterai in the system builder.
-
Add Super Trend turned Positive at 1 and add High above the Previous Bar from the system builder.
-
-
@Brijesh-Bhatia
I thought we execute trade through momentify so the system know which candle we entered the trade and so it can decide which candle low to exit onFor Supertrend, What I noticed is that - most of the time - supertrend turns green and then it does not cross the high of that candle on very next day and it may take from 1 day to few weeks or more - so we don't know the exact timeframe between it turned green and it crosses the high. Is there a way to achieve that? Thanks