• Recent
  • Categories
  • 0 Unread 0
  • Popular
  • Tags
  • More
    • Guidelines
    • Disclaimer
  • Users
Skins
  • Light
  • Default
  • Cerulean
  • Cosmo
  • Flatly
  • Journal
  • Litera
  • Lumen
  • Lux
  • Materia
  • Minty
  • Morph
  • Pulse
  • Quartz
  • Sandstone
  • Simplex
  • Sketchy
  • Spacelab
  • United
  • Yeti
  • Zephyr
  • Dark
  • Cyborg
  • Darkly
  • Slate
  • Solar
  • Superhero
  • Vapor
Collapse
Definedge Forum Logo

Vriddhi Strategy {Long Only}

Scheduled Pinned Locked Moved Charts
11 Posts 5 Posters 915 Views
    • Oldest to Newest
    • Newest to Oldest
    • Most Votes
Reply
  • Reply as topic
Log in to reply
This topic has been deleted. Only users with topic management privileges can see it.
  • Brijesh Bhatia Offline
    bbrijeshB Offline
    Brijesh Bhatia

    Pro User

    wrote on last edited by bbrijesh
    #1

    The primary objective of the Vriddhi strategy is to identify and capitalize on bullish opportunities in the stock market. The strategy focuses on stocks in a bullish trend by meeting two critical criteria: being above their long-term 200-Day Exponential Moving Average (200DEMA) and signalling bullish momentum through a positive crossover of the Adaptive Relative Strength Index (ARSI).

    Here is the backtesting result on the current Nifty50 stocks:
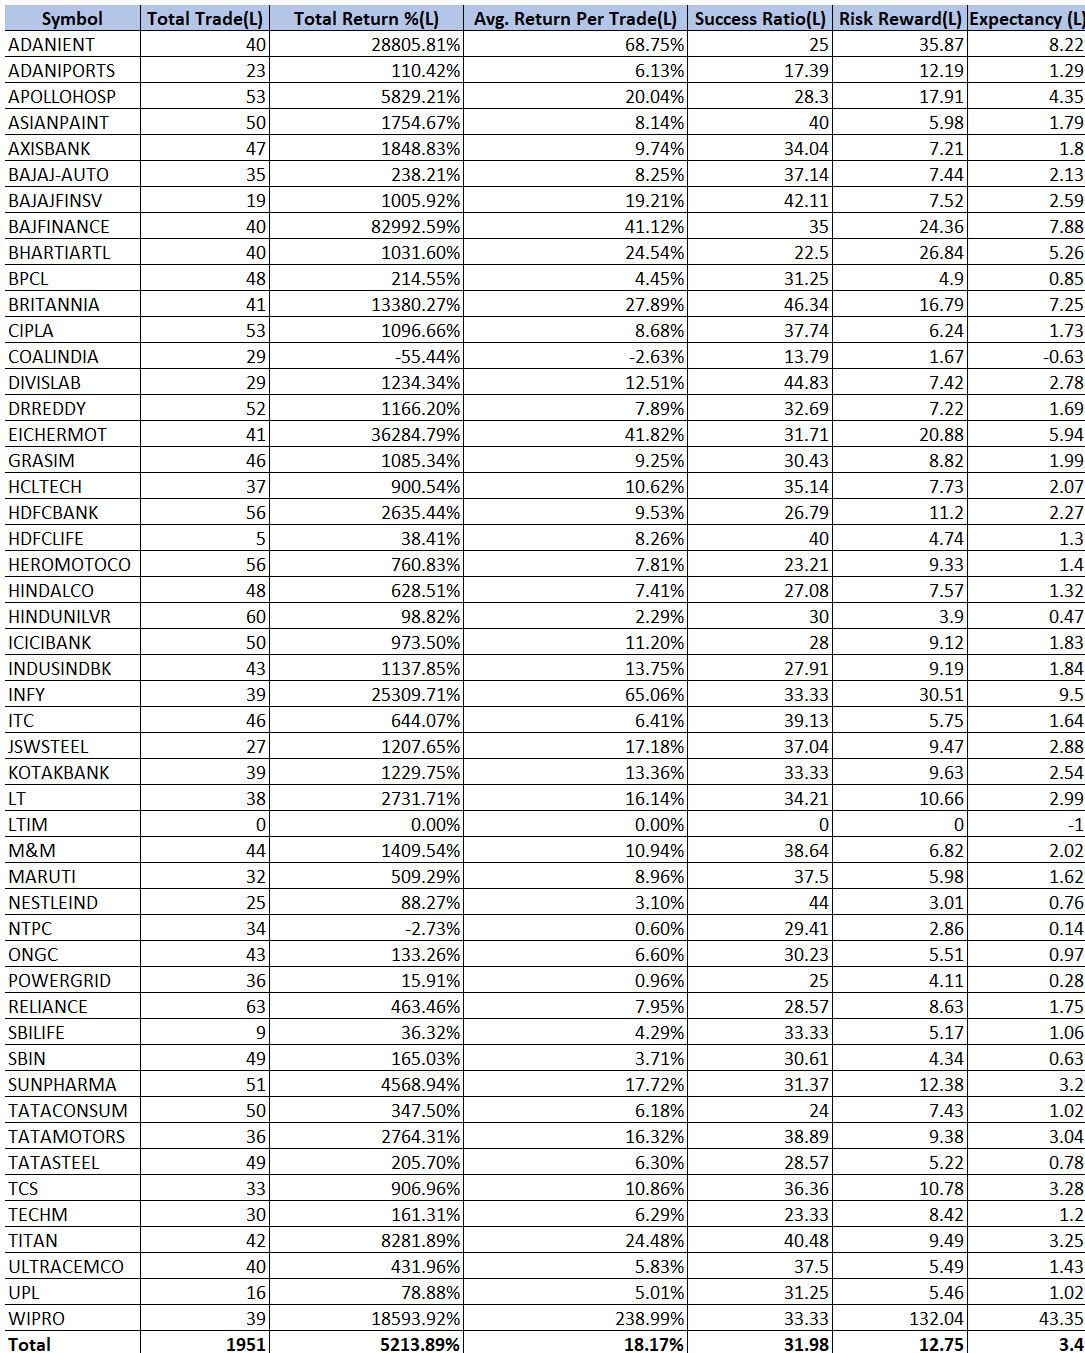
    50353271-668b-45ba-b716-95335897a440-image.png
    Source: Definedge Scanner

    This scanner will be available soon to existing Definedge Securities users.

    Regards,
    Brijesh Bhatia,
    Definedge Forum.

    1 Reply Last reply
    8
  • S Offline
    S Offline
    Somen Sangani
    wrote on last edited by
    #2

    Is there a video for the s strategy ?

    bbrijeshB 1 Reply Last reply
    0
  • Brijesh Bhatia Offline
    bbrijeshB Offline
    Brijesh Bhatia

    Pro User

    replied to Somen Sangani on last edited by
    #3

    @Somen Sangani Not yet.

    Regards,
    Brijesh Bhatia,
    Definedge Forum.

    1 Reply Last reply
    0
  • L Offline
    L Offline
    Lata Sachdeva
    wrote on last edited by
    #4

    any specific reason for choosing N50 universe? also whats the exit criteria?

    1 Reply Last reply
    0
  • Brijesh Bhatia Offline
    bbrijeshB Offline
    Brijesh Bhatia

    Pro User

    wrote on last edited by
    #5

    Nifty50 was just an example to highlight. You can select any group or your group.

    We have an inbuilt scanner for Entry and Exit in RZone Scanners, you can explore it.

    Regards,
    Brijesh Bhatia,
    Definedge Forum.

    1 Reply Last reply
    0
  • S Offline
    S Offline
    Sugapriya Thimma
    wrote on last edited by
    #6

    image.png

    I got different result when I do the backtest. Please help to check it out Sir

    bbrijeshB 1 Reply Last reply
    0
  • Brijesh Bhatia Offline
    bbrijeshB Offline
    Brijesh Bhatia

    Pro User

    replied to Sugapriya Thimma on last edited by
    #7

    @Sugapriya Thimma As the data date changes, the back testing results will change for any strategy.

    Regards,
    Brijesh Bhatia,
    Definedge Forum.

    1 Reply Last reply
    0
  • O Offline
    O Offline
    OMESH YADAV
    wrote on last edited by
    #8

    Sir Can you please explain the various results obtained in back testing. What value ranges are called good results in back testing in risk reward and expectancy. Alternatively what all parameters are of utmost importance to be seen while analysing the backtested results as the same in not mentioned anywhere. I am a new user at Dwfinedge with customer ID 1246020, Kindly advise

    bbrijeshB 1 Reply Last reply
    0
  • Brijesh Bhatia Offline
    bbrijeshB Offline
    Brijesh Bhatia

    Pro User

    replied to OMESH YADAV on last edited by
    #9

    @OMESH YADAV
    Risk-Reward Ratio is a measure of the potential profit compared to the potential loss in a trade. It is calculated by dividing the potential reward (profit) by the potential risk (loss). Anything above 2 is considered good.

    Expectancy is a measure of the average amount of profit or loss that can be expected per unit of risk over a series of trades. A positive value implies that, on average, each trade contributes positively to the account balance. The higher the positive expectancy, the better.

    Regards,
    Brijesh Bhatia,
    Definedge Forum.

    1 Reply Last reply
    0
  • O Offline
    O Offline
    OMESH YADAV
    wrote on last edited by
    #10

    Thanks Sir for clarification. I have designed a system and backtested on Nifty 650 Wef 1990 with entry and exit inputs. The results are Total Trades (20.9), Total % profitable (77), Avg Return per trade (3.69) Risk Reward( 1.7) Success Ration (81.43) Expectancy (1.2). As per your clarification the system seems to be good to me. Am I correct in my analysis or do I need to look into it further. Request assist

    1 Reply Last reply
    0
  • O Offline
    O Offline
    OMESH YADAV
    wrote on last edited by
    #11

    The same system when run on bullish momentum stocks of Define edge has produced results as Total Trades (30.37), Total % profitable (106.23), Avg Return per trade (3.5) Risk Reward( 2.18) Success Ratio (80.14) Expectancy (1.55).

    1 Reply Last reply
    0


Recent Posts

  • manzandu123@gmail.comM
    Daily Setup 13th MAY 2025 (MKLH)
  • DefinedgeD
    Feature Request : Personalized Dashboard in RZone
  • A
    Momentify - Increase/Decrease allocation
  • A
    Requesting to add Exit Criteria for Simulator
  • C
    DeMap
  • Login

  • Login or register to search.
  • Blog
  • Youtube Videos
  • Refresh
  • First post
    Last post
0
  • Recent
  • Categories
  • Unread 0
  • Popular
  • Tags
  • More
    • Guidelines
    • Disclaimer
  • Users
  • Login

  • Login or register to search.
  • Blog
  • Youtube Videos
  • Refresh