"Hunting the Pulse: Highest OI & Volume Straddle Among 10 NIFTY Straddle Pairs"
-
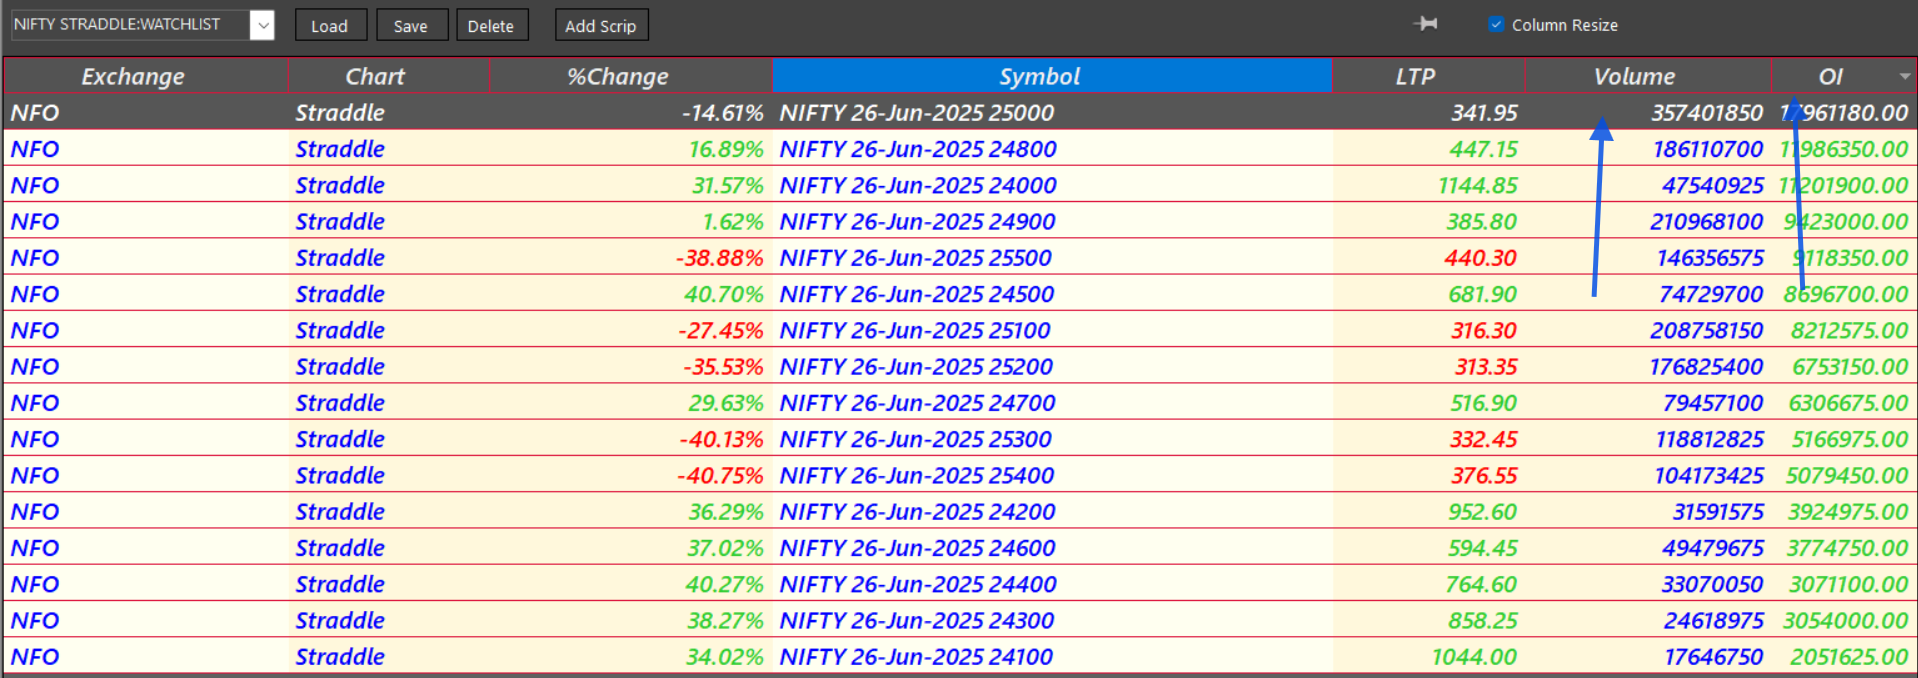
In the dynamic world of options trading, identifying where the smart money is moving is key. Open Interest (OI) and Volume serve as the twin pillars of market participation and conviction. This article dives deep into analyzing the straddles with the highest OI and volume from my carefully curated watchlist of 10 Up-Down Straddle Pairs—a tactical approach to detect potential breakouts, premium absorption zones, or consolidation traps.
 Purpose of This Study:
To track relative OI and volume buildup intraday.
To identify which straddle pair among the 10 is attracting the maximum institutional attention.
To infer whether premium writers or buyers are in control.
To support range identification, momentum bias, or mean reversion opportunities.
Purpose of This Study (Enhanced with PDH/PDL & Camarilla Levels)
This study is crafted to deliver a multi-layered understanding of how the market behaves around straddle zones with the highest open interest (OI) and volume. The aim is to not only monitor where institutional participants are concentrating their positions but also to understand how those zones interact with key structural levels like the previous day’s high (PDH), low (PDL) and Camarilla pivots. Together, these components serve as a dynamic blueprint to assess whether the market is preparing for compression, expansion, or reversal.1. Tracking Real-Time Straddle Buildup
By observing how OI and volume build intraday across a set of 10 NIFTY straddle pairs — typically placed around the current spot price — we begin to understand where market participants are actively committing capital. When a particular straddle pair consistently shows rising OI and significant volume, it becomes a center of gravity, a zone of maximum attention and expectation. This straddle acts as the pulse of the market.But this pulse doesn’t beat in a vacuum. When that high OI straddle lies close to PDH or PDL, or aligns with critical Camarilla pivot levels like H3, L3, H4 or L4, the market is telling a deeper story. These levels function like spiritual pressure points — areas where past momentum met resistance or exhaustion. When the current day’s option buildup overlaps them, the message becomes clear: something meaningful is being prepared.
2. Locating the Market’s Center of Pressure
Among the 10 straddles, one often emerges as the clear heavyweight — the zone where volume and OI peak together. This zone is not just technical; it’s psychological. It reveals the strike around which premium writers are trying to contain the market, and often it also becomes the testing ground for breakout attempts.When this high-congestion straddle sits near PDH or PDL, it adds weight to the possibility of a mean-reversion bounce or rejection. On the other hand, if it overlaps with outer Camarilla bands like H4 or L4, it might indicate that premium writers are bracing for a breakout, defending the last line of equilibrium before volatility erupts.
3. Understanding Who’s in Control — Writers or Buyers
The real purpose isn’t just to find where the market is concentrated, but to assess who has control — the premium writers who want range, or the buyers seeking breakout.When price hovers within the highest OI straddle zone and remains inside Camarilla’s core (H3 to L3), it suggests that option writers are in control, keeping price on a tight leash and profiting from time decay. However, if price begins to escape this zone with strength — particularly from H4 or L4 — and that movement happens while OI is still rising, it indicates that buyers are overpowering the structure, potentially setting up for a one-directional expansion.
And when such moves happen in the proximity of PDH or PDL, they carry even more credibility, because the market is not just breaking the intraday cage — it’s also breaching the memory of the previous day’s limits.
4. Finding Range, Momentum, or Reversal Zones
This study supports three strategic outcomes: identifying reliable range setups, recognizing early momentum ignition points, and catching potential mean reversion opportunities.If the price remains glued within the high OI straddle zone, inside yesterday’s high/low and the Camarilla H3–L3 region, then the market is likely engaged in premium decay — ideal for short straddle strategies or fade setups. On the other hand, if the price tests and decisively breaks past the high or low of the dominant straddle, especially in tandem with PDH/PDL or H4/L4 breakouts, it often signals that the market is transitioning from equilibrium to expansion — a fertile moment for directional entries with controlled risk.
In certain cases, the price may momentarily break a Camarilla or PDH/PDL level, only to return inside the straddle zone. This behavior signals a premium trap or false breakout, which can be a powerful clue for fade or mean reversion trades.
🧠 In Essence
This study transforms the otherwise static numbers of open interest and volume into a living, breathing map of market pressure. By combining the institutional footprints of straddle positioning with the emotional memory of PDH/PDL and the equilibrium structure of Camarilla pivots, we unlock a framework that is both deeply strategic and intuitively human.You are not merely watching numbers. You are listening to the story the market is telling, and aligning yourself with the zones where conviction meets consequence.
(Expanded with Previous Day Straddle Data, PDH/PDL & Internal Structural Continuity)
This study is not just a snapshot of intraday OI and volume behavior — it is a continuum of institutional memory and market structure. By observing the 10 selected NIFTY straddle pairs, we aim to recognize not only where the market is currently positioning but also how today’s positioning evolves from yesterday’s footprints. This includes decoding whether the zones with previously highest OI and volume are being defended, broken, or ignored, and how the internal structure — defined by PDH, PDL, and price movement ranges — reflects a net gain or loss in control by buyers or writers.
1. Tracking Straddle Continuity: OI-Volume Shift Over Time
Market structure is not born fresh every morning — it carries memory. If a particular straddle pair showed the highest OI and volume buildup yesterday, its behavior today becomes critical.Are we seeing:
Price respecting the previous high OI straddle level?
A breakout above or below that zone?
A complete shift in OI concentration to a new straddle?
These answers help determine whether the previous day’s institutional bet is still valid, being challenged, or completely unwound. Such tracking gives us insight into who is gaining ground structurally — buyers or sellers — across sessions.
2. Evaluating Today’s Action Through Structural Response
Today’s behavior is not judged in isolation. We analyze it in terms of:Whether price remains within its own PDH–PDL, signaling containment or premium defense.
Whether price breaks its own PDH/PDL around the straddle zone, implying expansion or liquidation.
Whether internal structure (measured by swing high/low formation, breakout-followed-by-failure, or range contraction) shows gain or loss in premium control.
For example, if today’s price respects the same straddle that held strong yesterday, it indicates defended structure and premium control by the same institutional participants. However, if today breaks that level and sustains outside it, the structure has shifted in favor of a new directional bias, and the premium control has likely changed hands.
3. Detecting Structural Gain or Loss: The Real Story of Price
Beyond price movement alone, this study captures which side — calls or puts, buyers or sellers — is structurally winning or losing. This is evaluated through:Whether price action confirms or negates the previous day’s high OI/volume zone.
Whether new OI and volume concentration appears at a fresh strike, and how it behaves against its own intraday PDH/PDL.
Whether internal highs/lows are expanding or being defended — telling us whether the market is anchoring or escaping.
If price repeatedly returns to a previous high OI strike but fails to break away, it shows premium trap or equilibrium maintenance. But if price breaks and then retests that zone and continues further, it reveals a structural shift — a gain in control for the breakout side.
4. Fusing Past with Present: A Complete Intraday Narrative
This study fuses:The historical significance of yesterday’s most crowded straddle,
The live OI and volume formation of today, and
The behavior of price within its own PDH/PDL and intraday architecture.
Together, this creates a narrative of structure, continuity, and pressure — not just where the market is, but why it is there, and who is forcing the outcome.
It supports:
Identifying if the market is attempting to repeat, defend, or break away from yesterday's setup.
Executing trades in sync with the directional shift or premium re-alignment, using tools like Renko confirmation, PRB zone structure, and VWAP control logic etc .
🧠 Final Essence
This study becomes your market diary, not of price alone — but of institutional intent, structural memory, and pressure resolution. You're not just watching today’s trades unfold — you are tracking a multi-day struggle for control, where every straddle and every PDH/PDL carries the echo of what came before and the possibility of what comes next.The trader who listens to these echoes moves with clarity. The trader who only watches today, without yesterday’s imprint, moves in noise.
 ️ Disclaimer
This study is intended solely for educational and informational purposes. The analysis, observations, and strategies discussed are based on personal research and trading methodology and do not constitute investment advice, stock recommendations, or a solicitation to buy or sell any financial instruments. Options trading involves significant risk and may not be suitable for all investors. Please consult your registered financial advisor or do your own due diligence before making any trading decisions. The author and publisher of this study are not liable for any financial loss or damages resulting from the use of the information provided herein. -
nice
-
 S SANTANU BEZ-1707666167730 referenced this topic