Renko | Long Options using DC, BI and Divergence
-
Concept:
I believe that a good and reliable way to consistently make money (intraday) by going long is entering in undervalued zones and exiting when the price is overvalued/overbought. This can be true irrespective of strategy/setup/indicator. Fundamental analysis has methods to determine if the instrument is undervalued and a good buy. What are the methods to determine value using technical analysis? There are many ways as listed here: ([https://tinyurl.com/u6vyhp3a](link url)). Among them, I find 'support levels' and 'oversold indicators combined with divergence' to be of great help. In this strategy, I have used Donchian Channel to identify support and Brick Indicator to find oversold areas. Add to this the key ingredient of divergence.Setup:
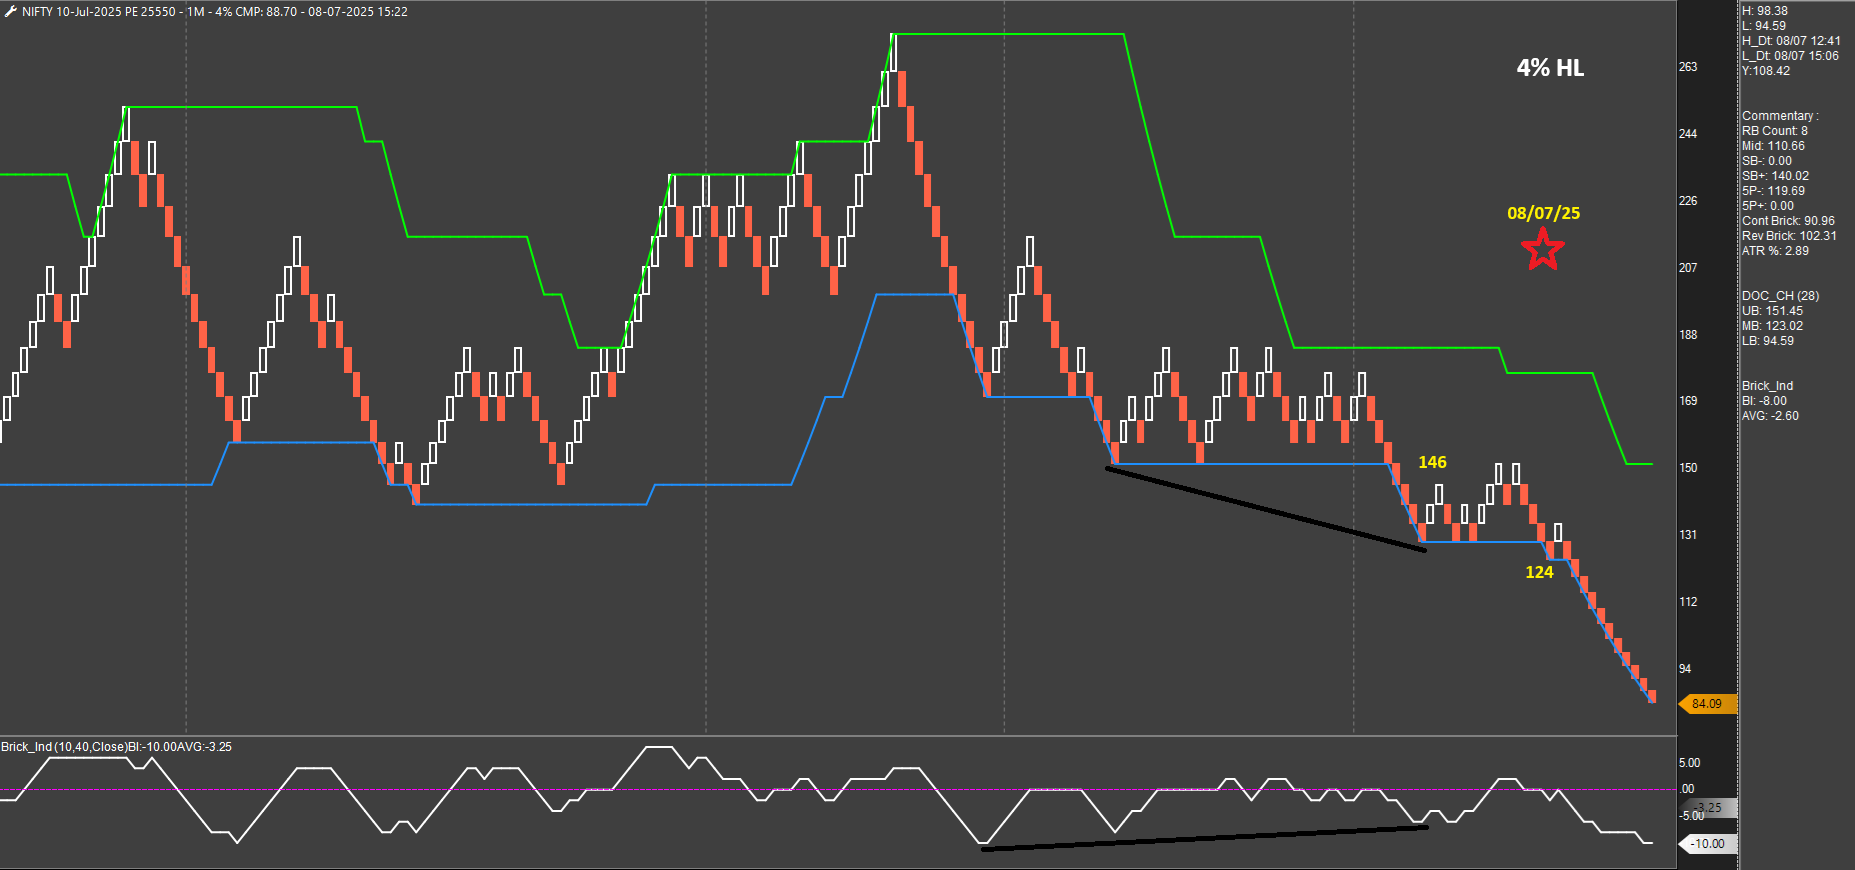
Entry: Look for a positive divergence on the Brick Indicator when it goes to -4 or below. Scan left (4-5 sessions) to ensure the price is near a support zone. Enter on a bounce of 2 bricks from the DC LB.
SL: 3 brick-back (i.e. 1 brick below DC LB).
Trail/Exit: I book half at 1:1. For the rest, I move SL to entry and trail until a negative divergence appears between price and Brick Indicator OR exit at 3:20 pm if none of that happens.Observations:
- A divergence happening when the Brick Indicator value is at least -4 or less (-6, -8, -10) is good. Any higher values (-2, 0 etc.) generally result in false signals.
- The DC part is totally objective. Scanning divergence on BI is clear and objective in most instances. Rarely, it can appear subjective but regular practice makes it easier to interpret.
- Using High-Low charts is recommended for Intraday as prices move fast and entry/SL orders can be entered in advance.
Conclusion:
This setup should work very well across instruments and timeframes. I would love to hear feedback/observations from anyone reading this thread and applying it to their trading instrument(s). I will keep posting my charts here regularly.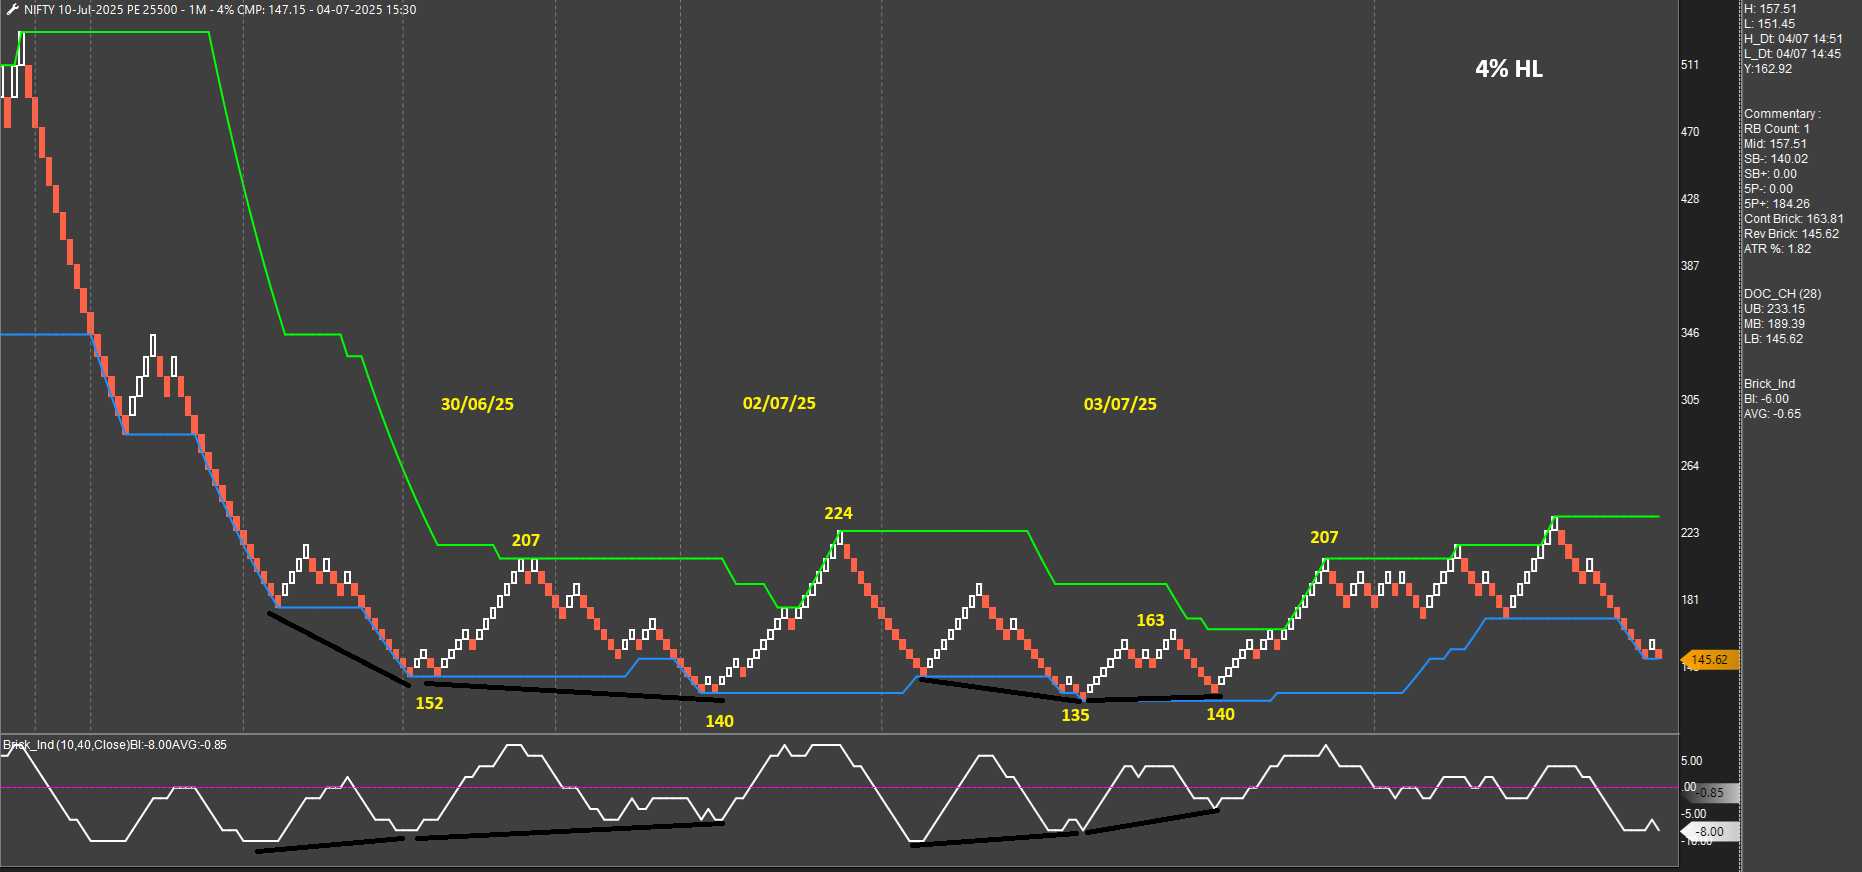
-
How do you read the divergence? Do you follow the direction of BI to take trade? Or is it always a bullish trade when there is a divergence between price and BI?
-
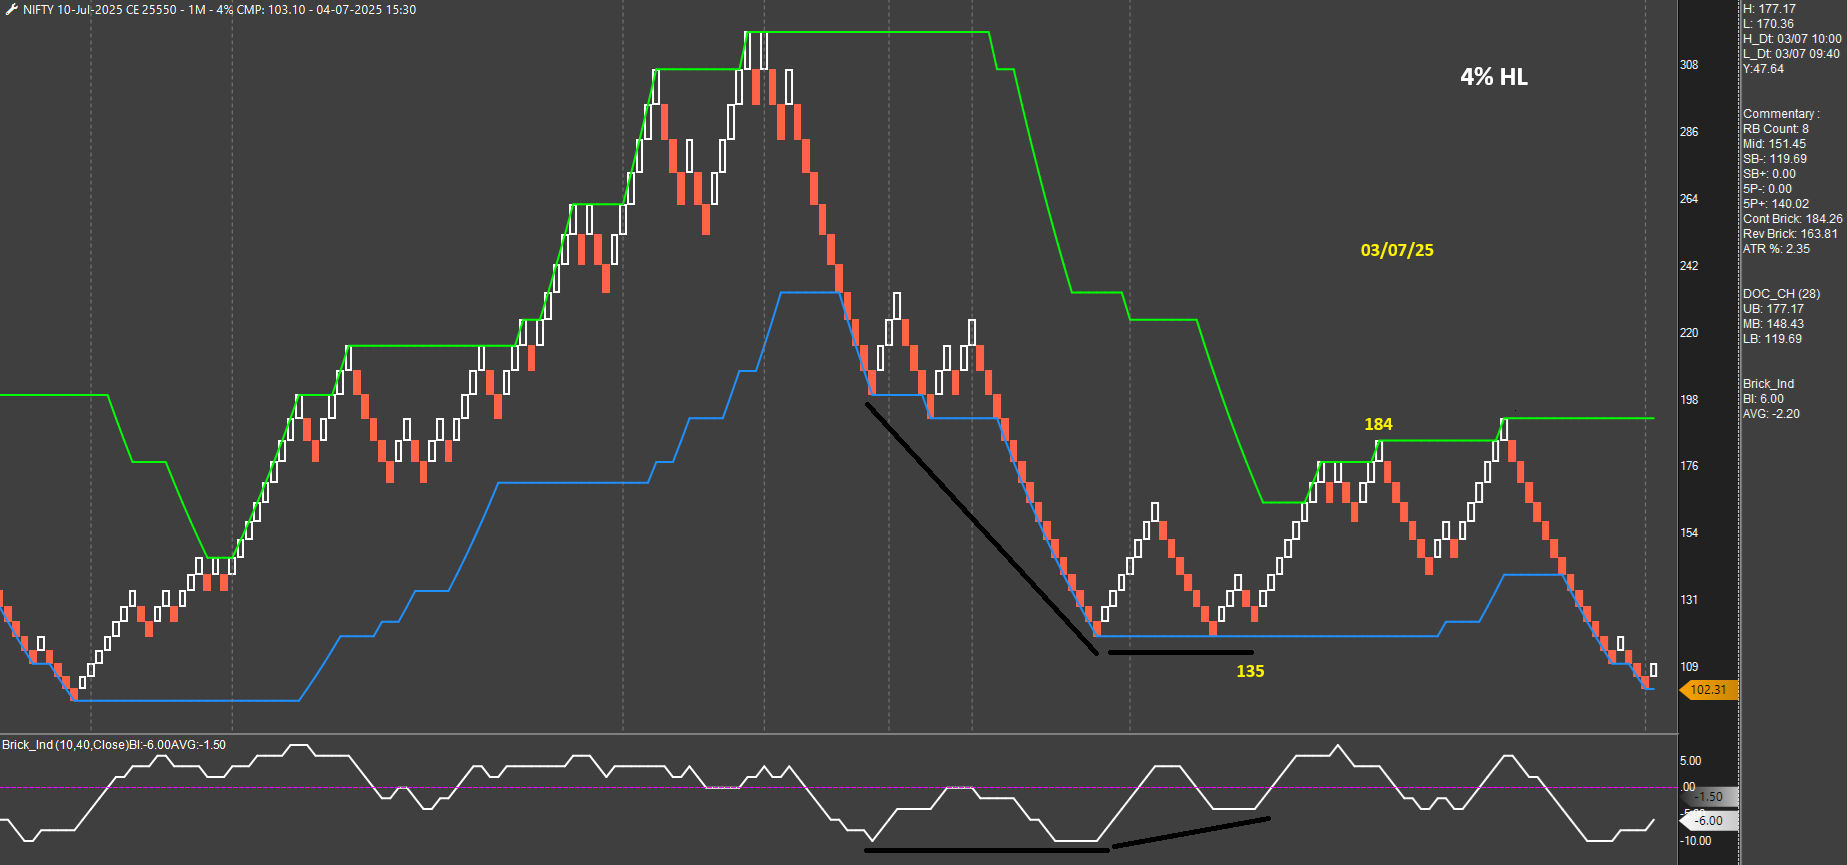
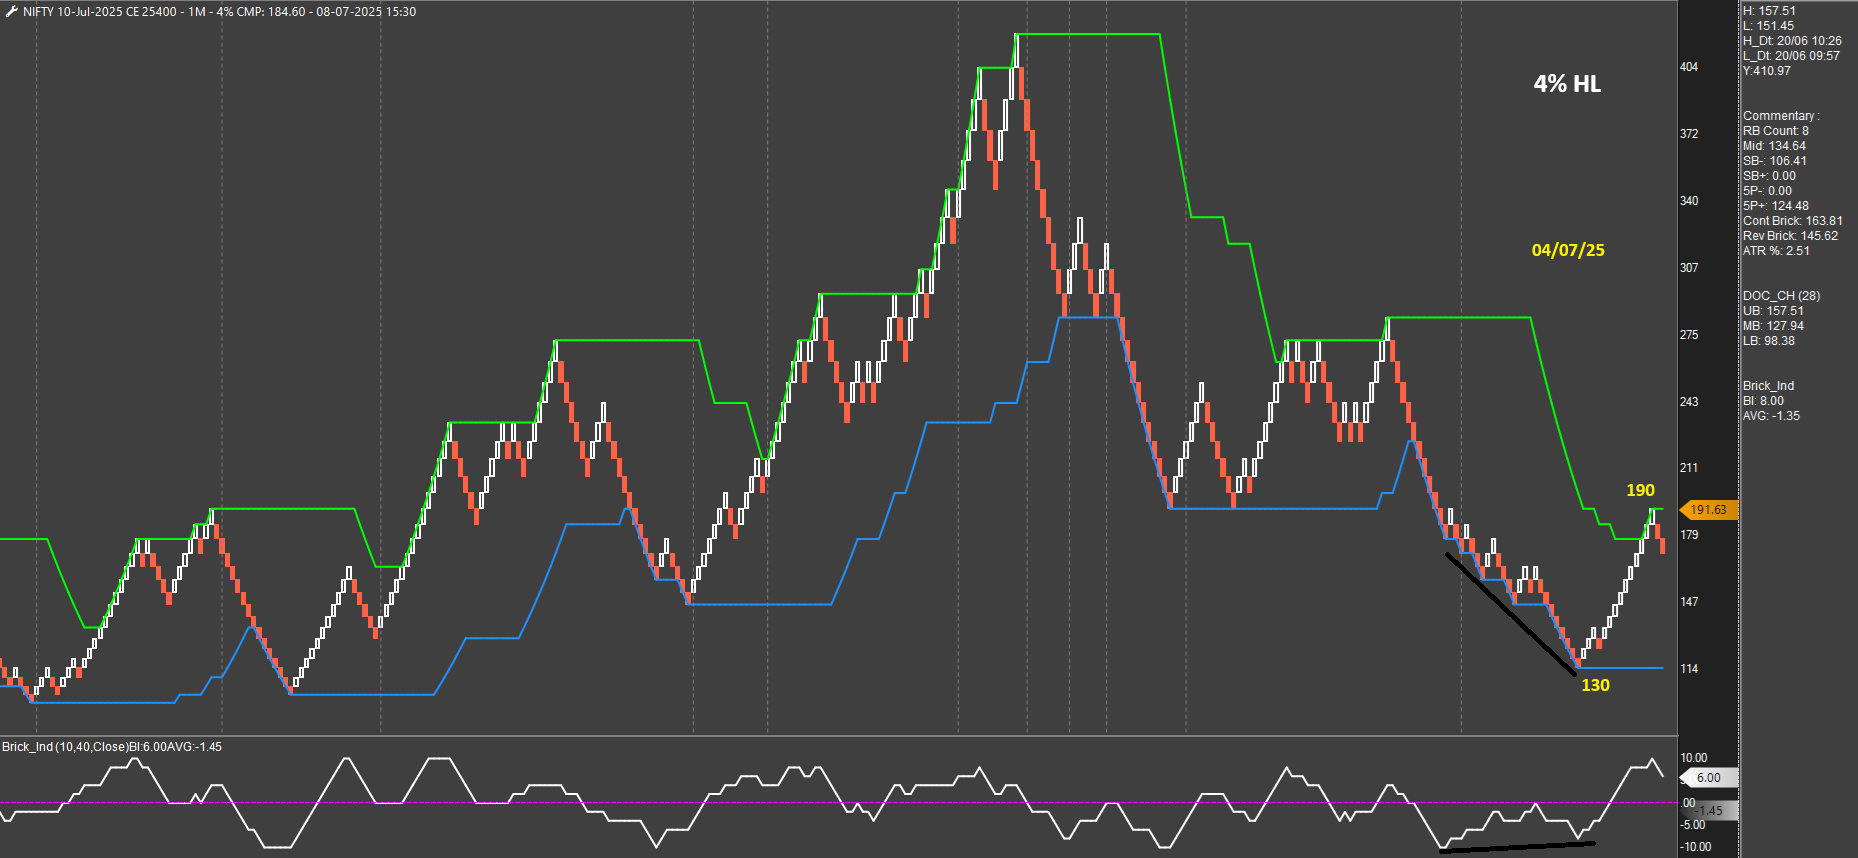
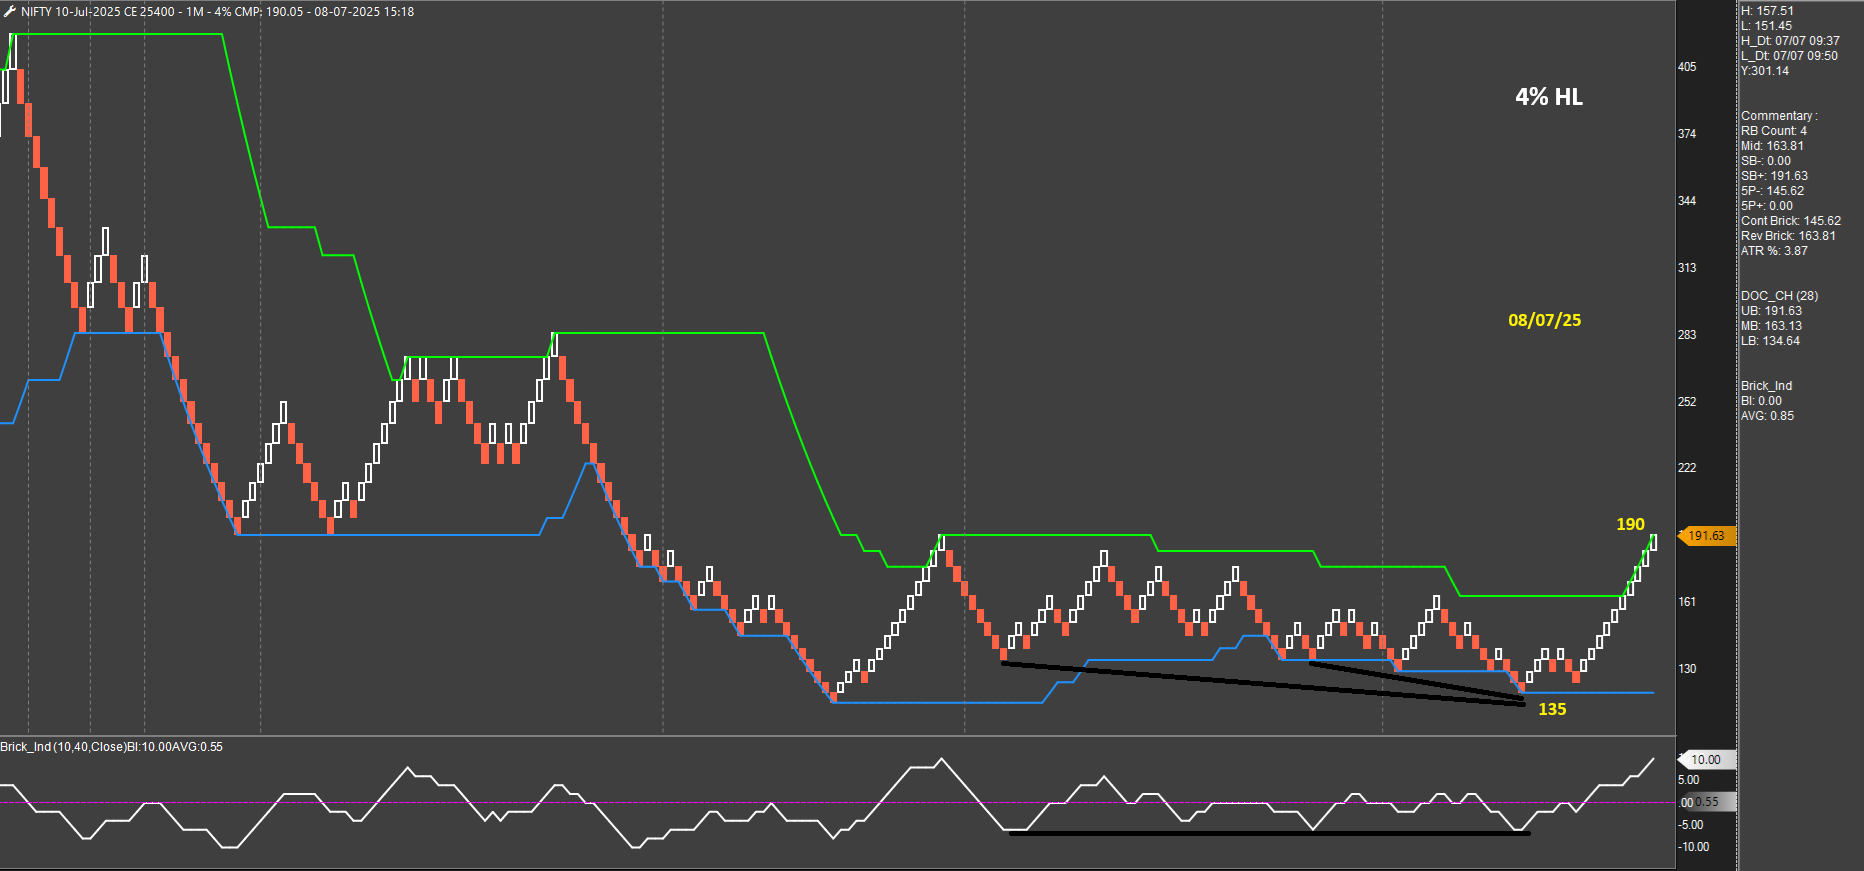
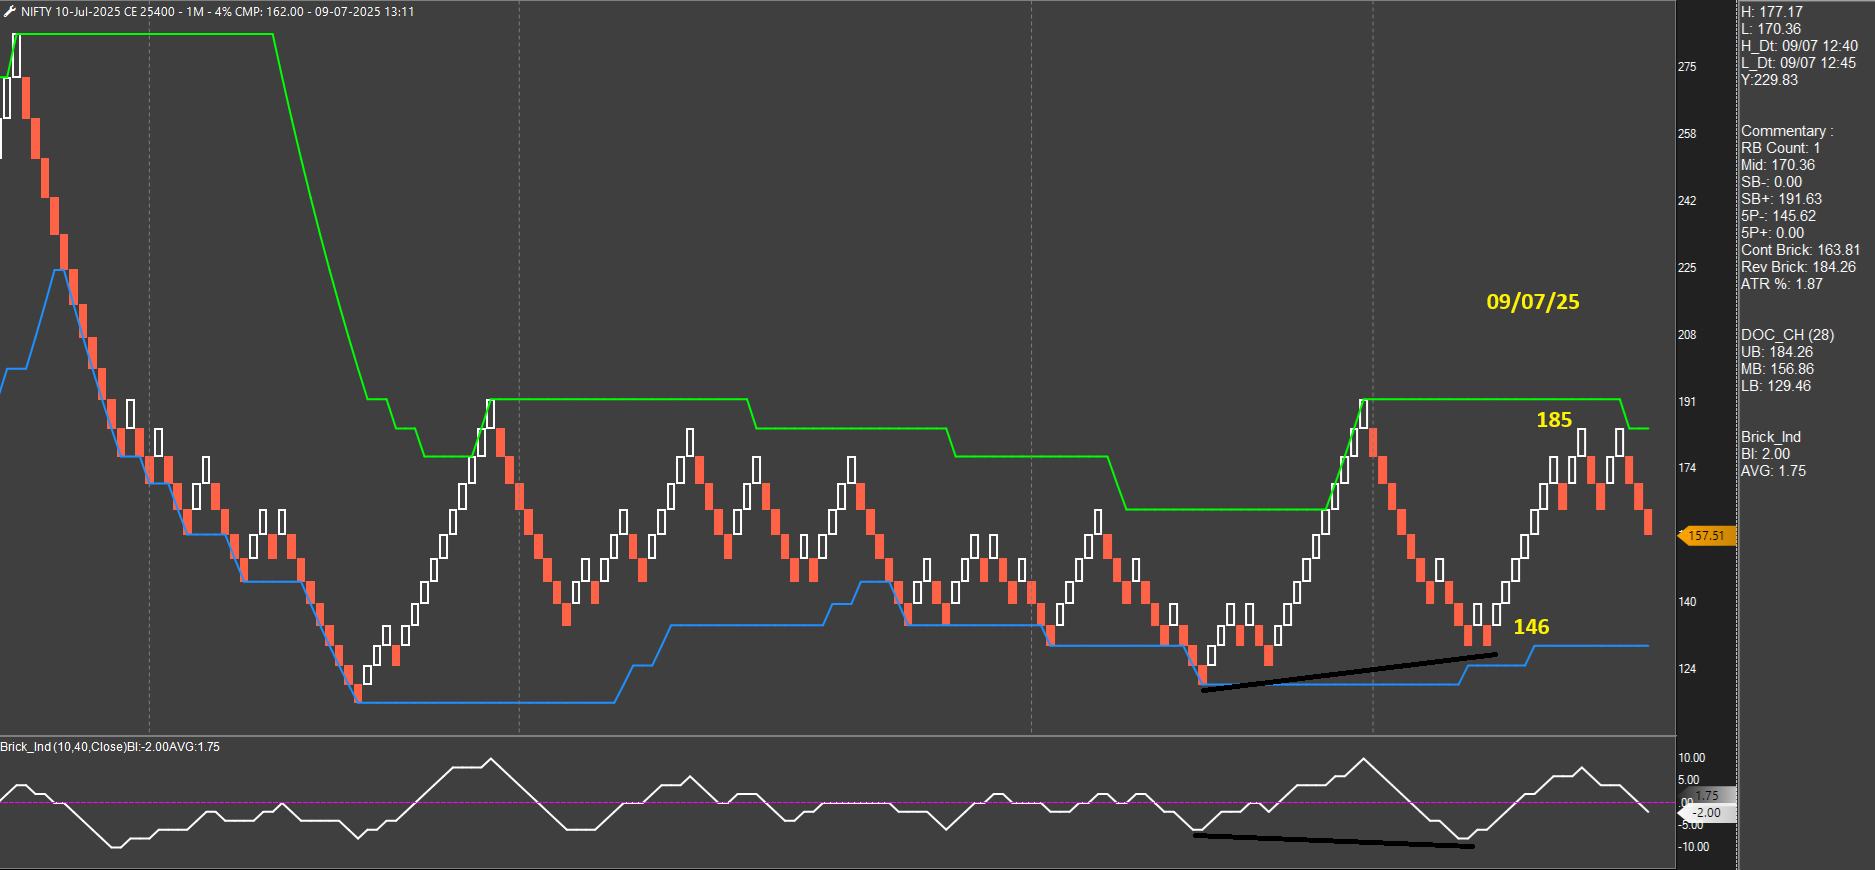
Divergences are of 2 types - regular and hidden. Mostly you will find regular divergences, i.e. price has made a LL whereas BI has made a HL. A few times hidden will happen (like today morning, 25400 CE) wherein price has made a HL and BI has made a LL. I will take both.
-
Thanks Sundeep for sharing this system. If possible share some more charts as the setup comes in the upcoming trades as well.
-
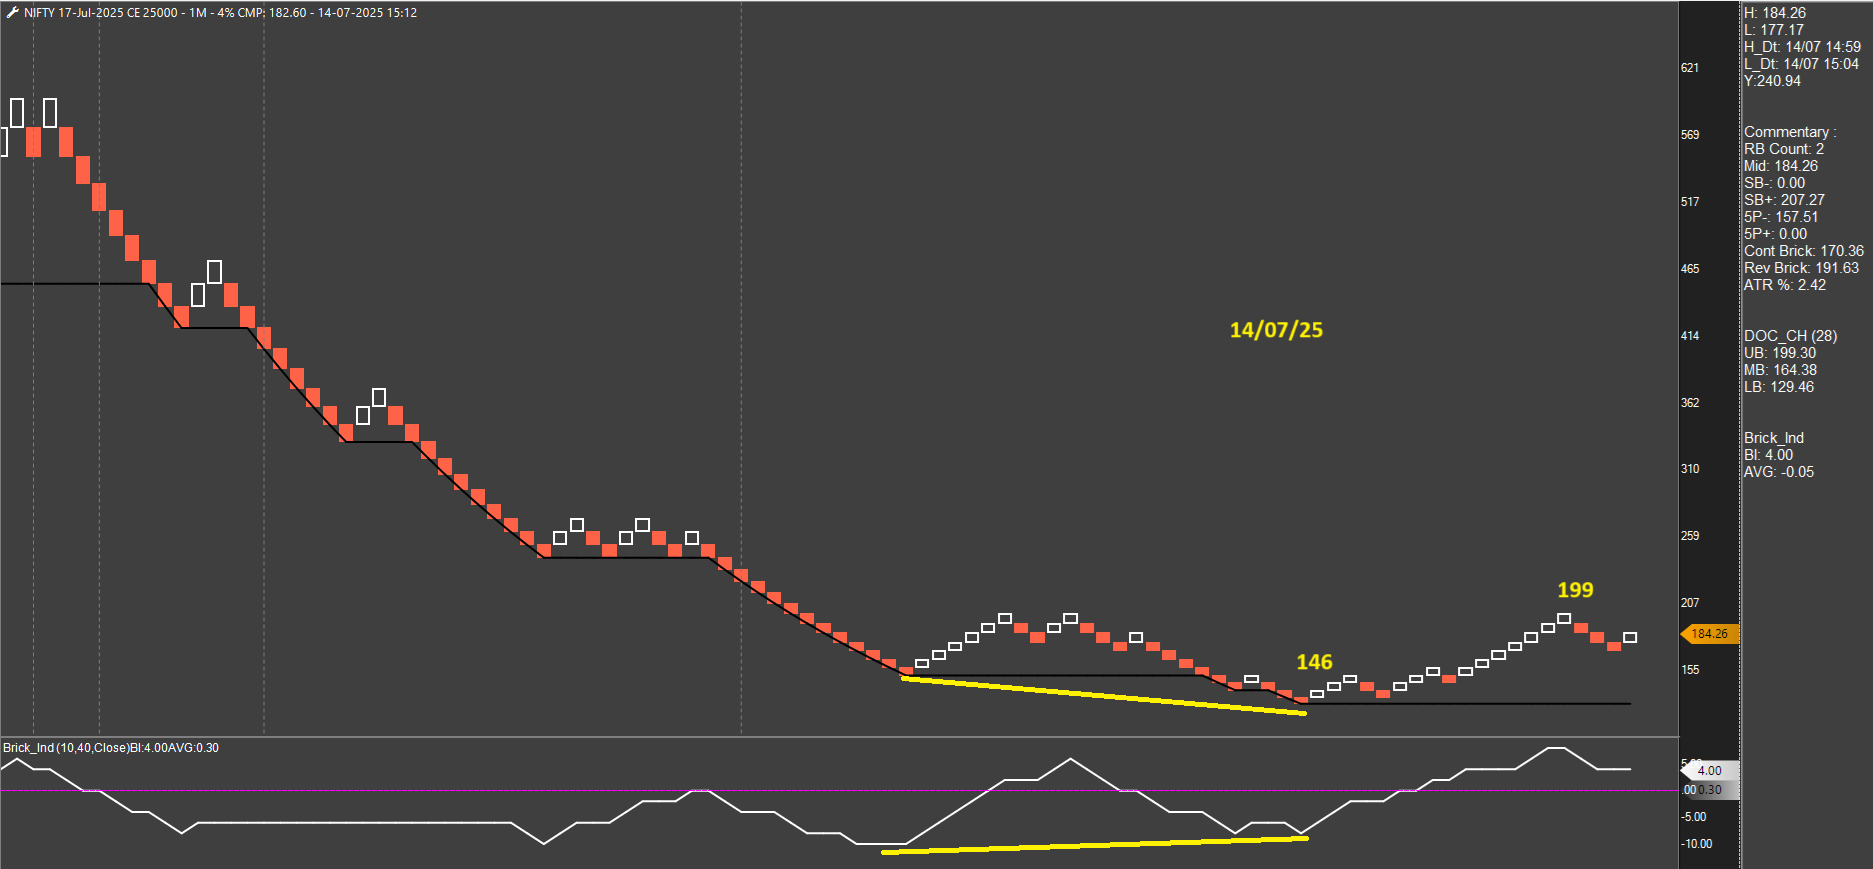
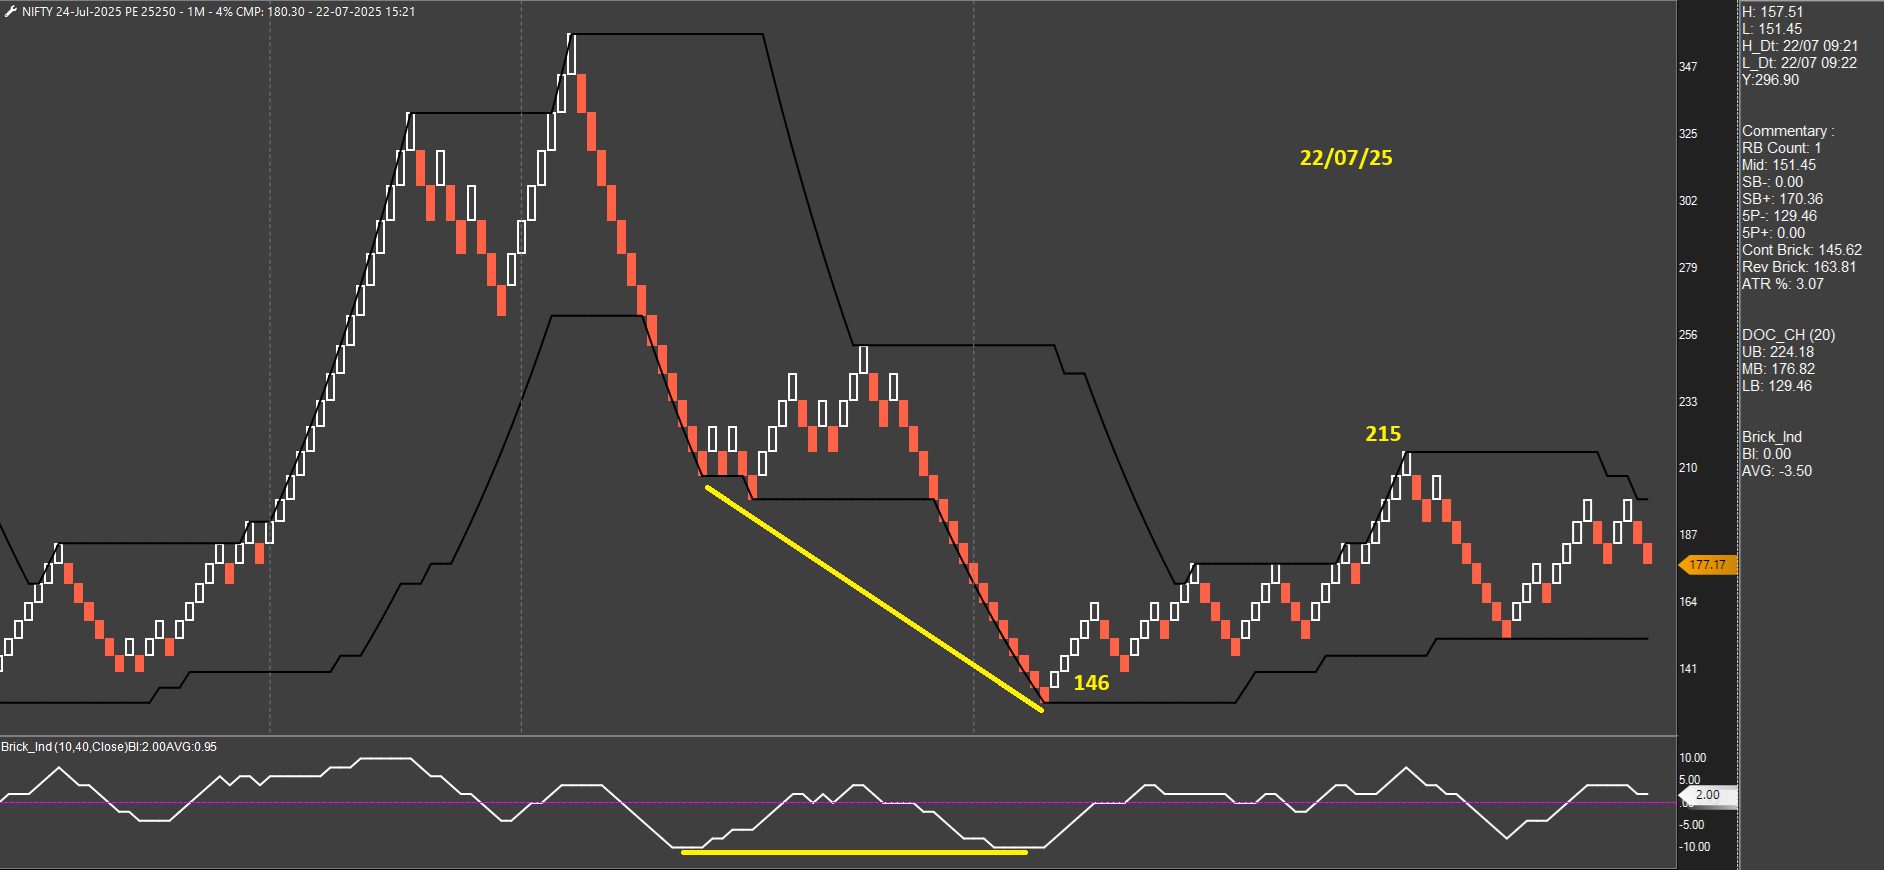
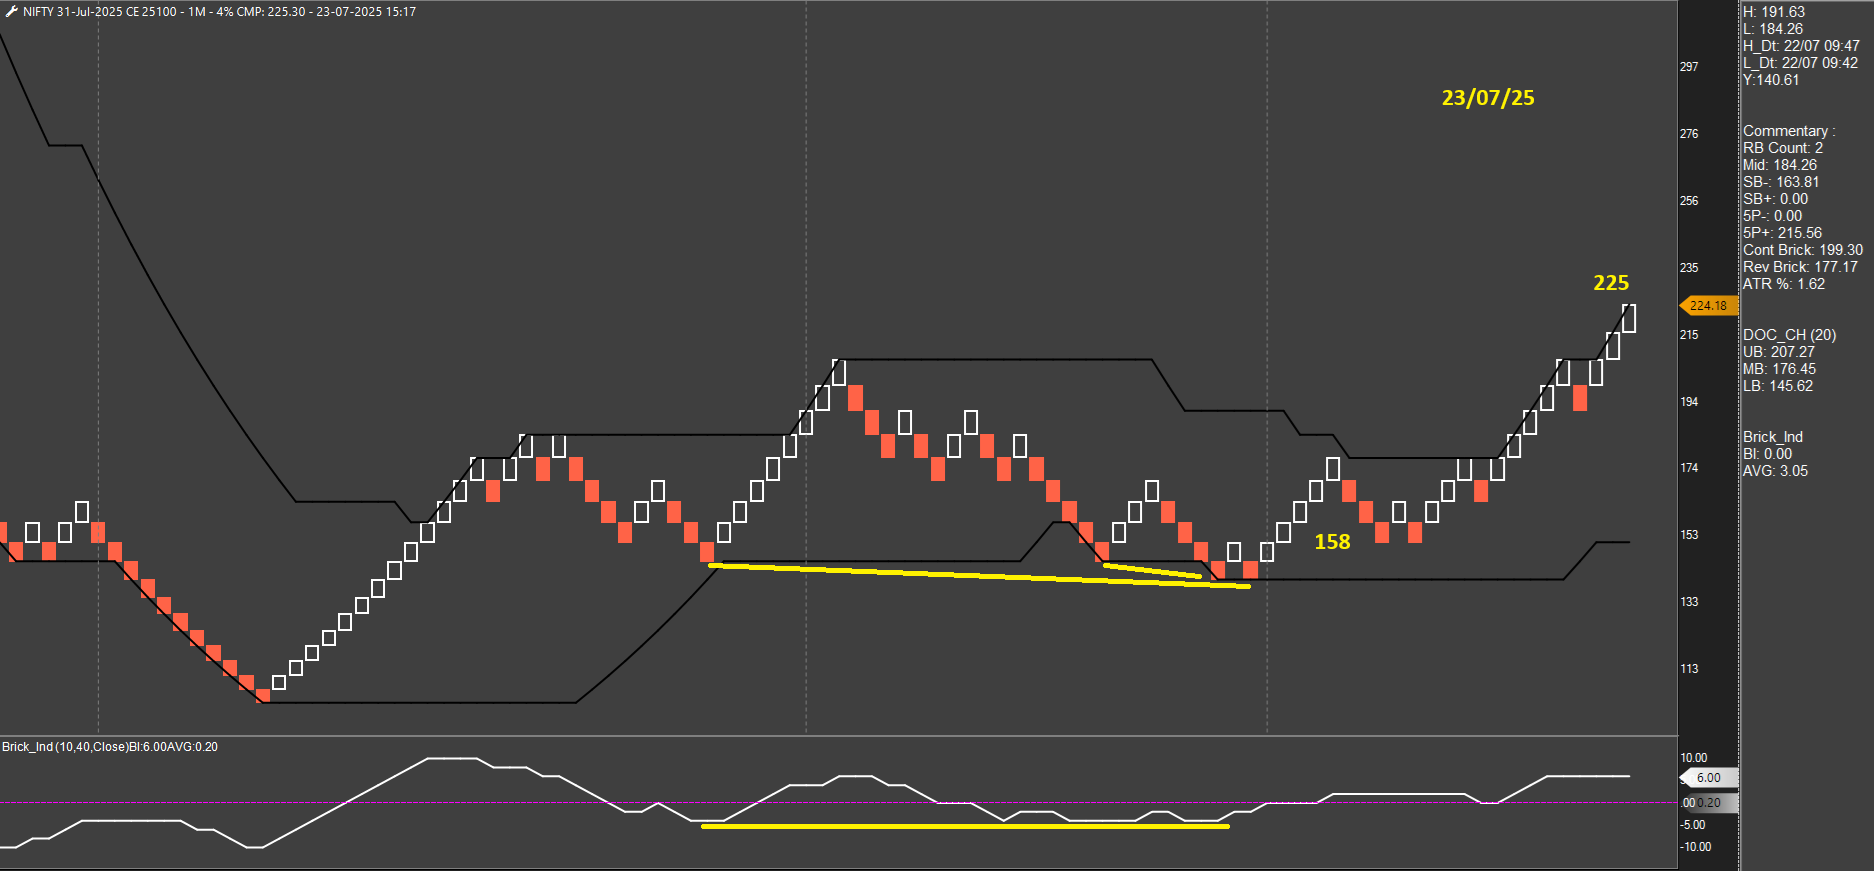
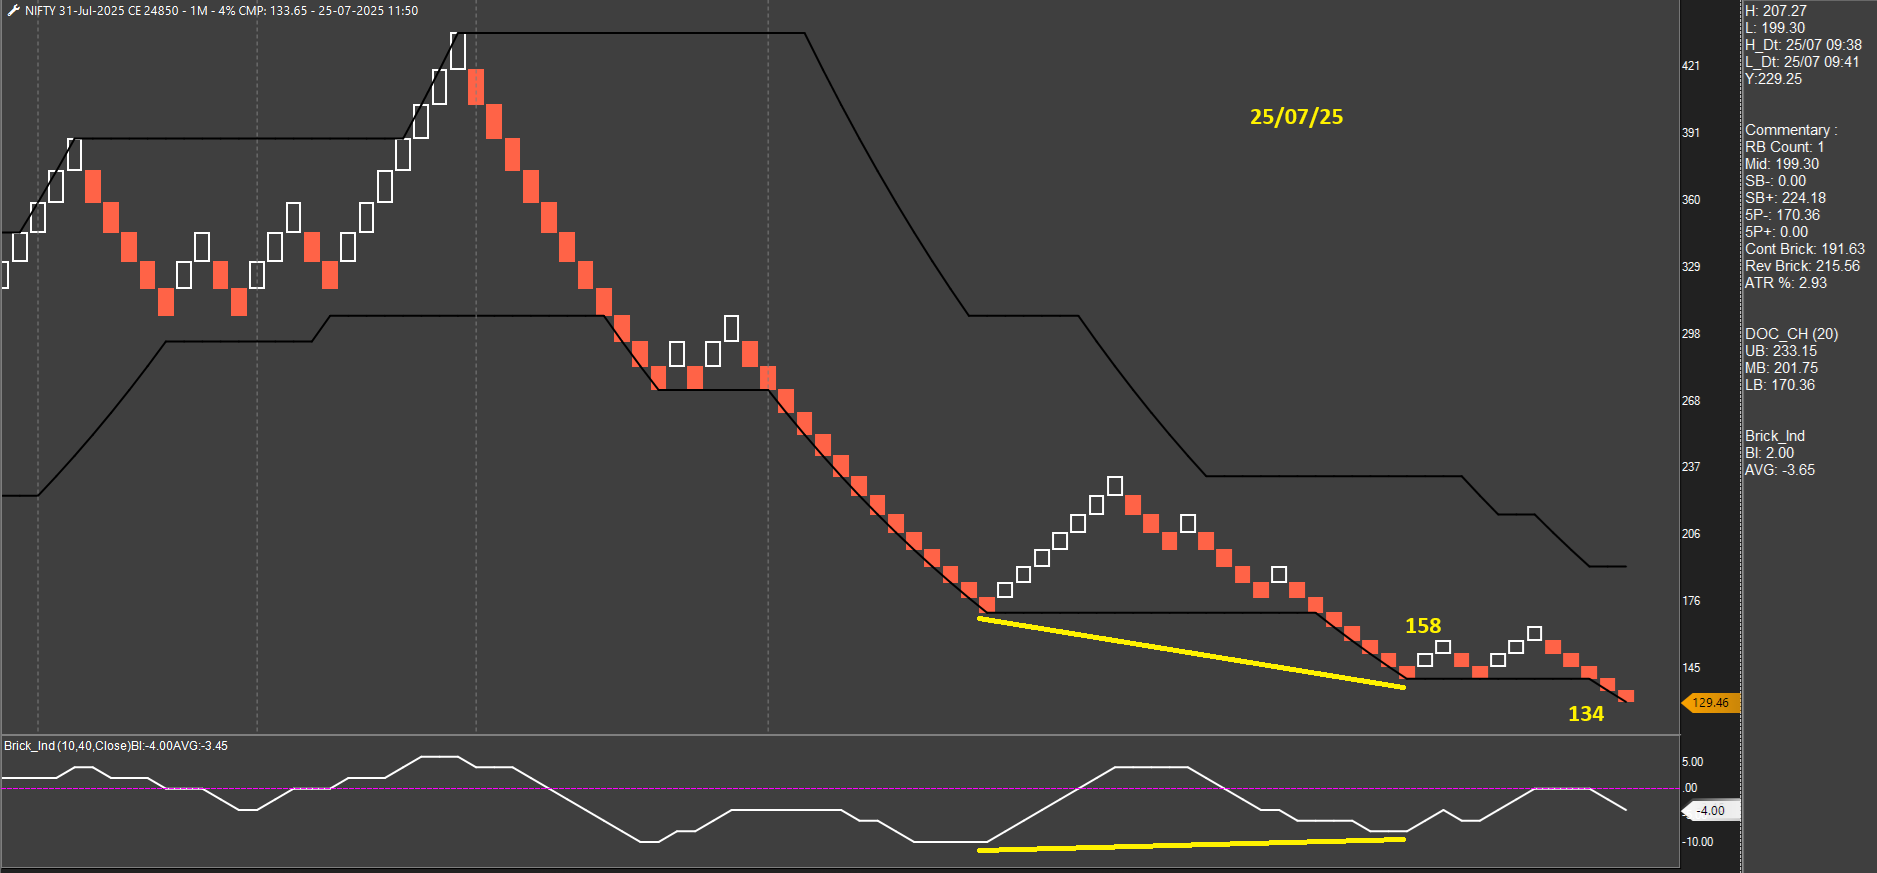
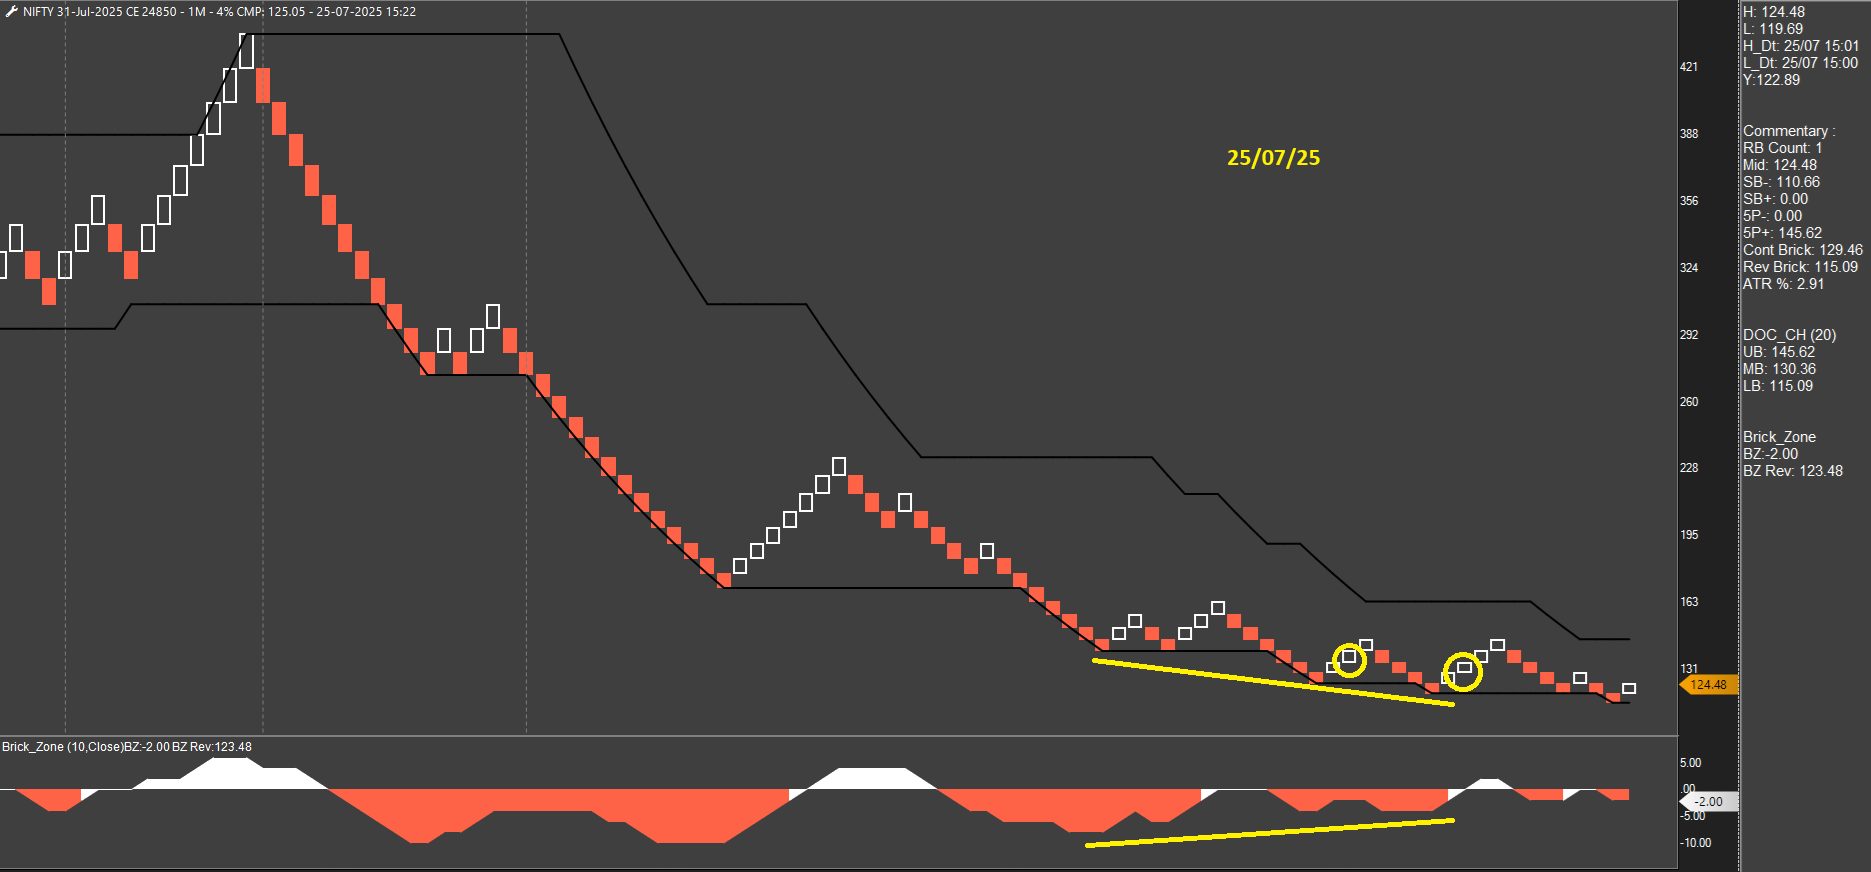
2 trades for the day.
-
An important point missed under 'observations' in the initial post - avoid trading current expiry on the expiry day as those options become volatile and chances of hitting SL increases greatly, especially when trading HL. Switch to next week expiry on the current expiry day. No trades so far today. Let's see, a couple of hours to go.
-
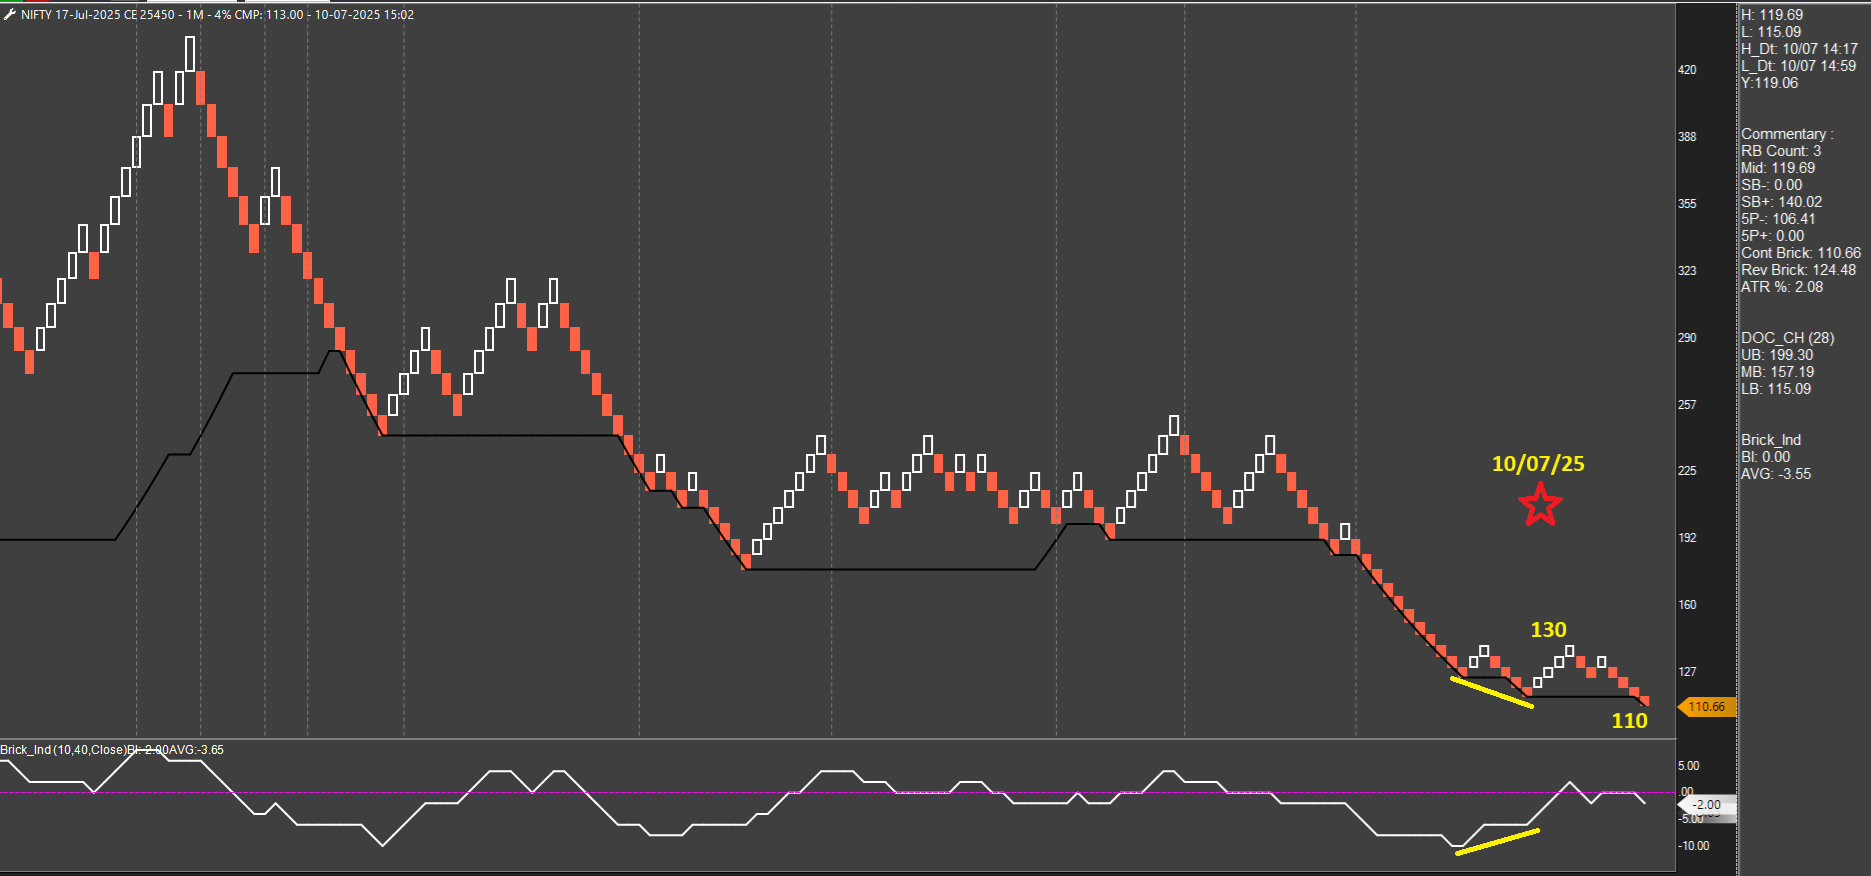
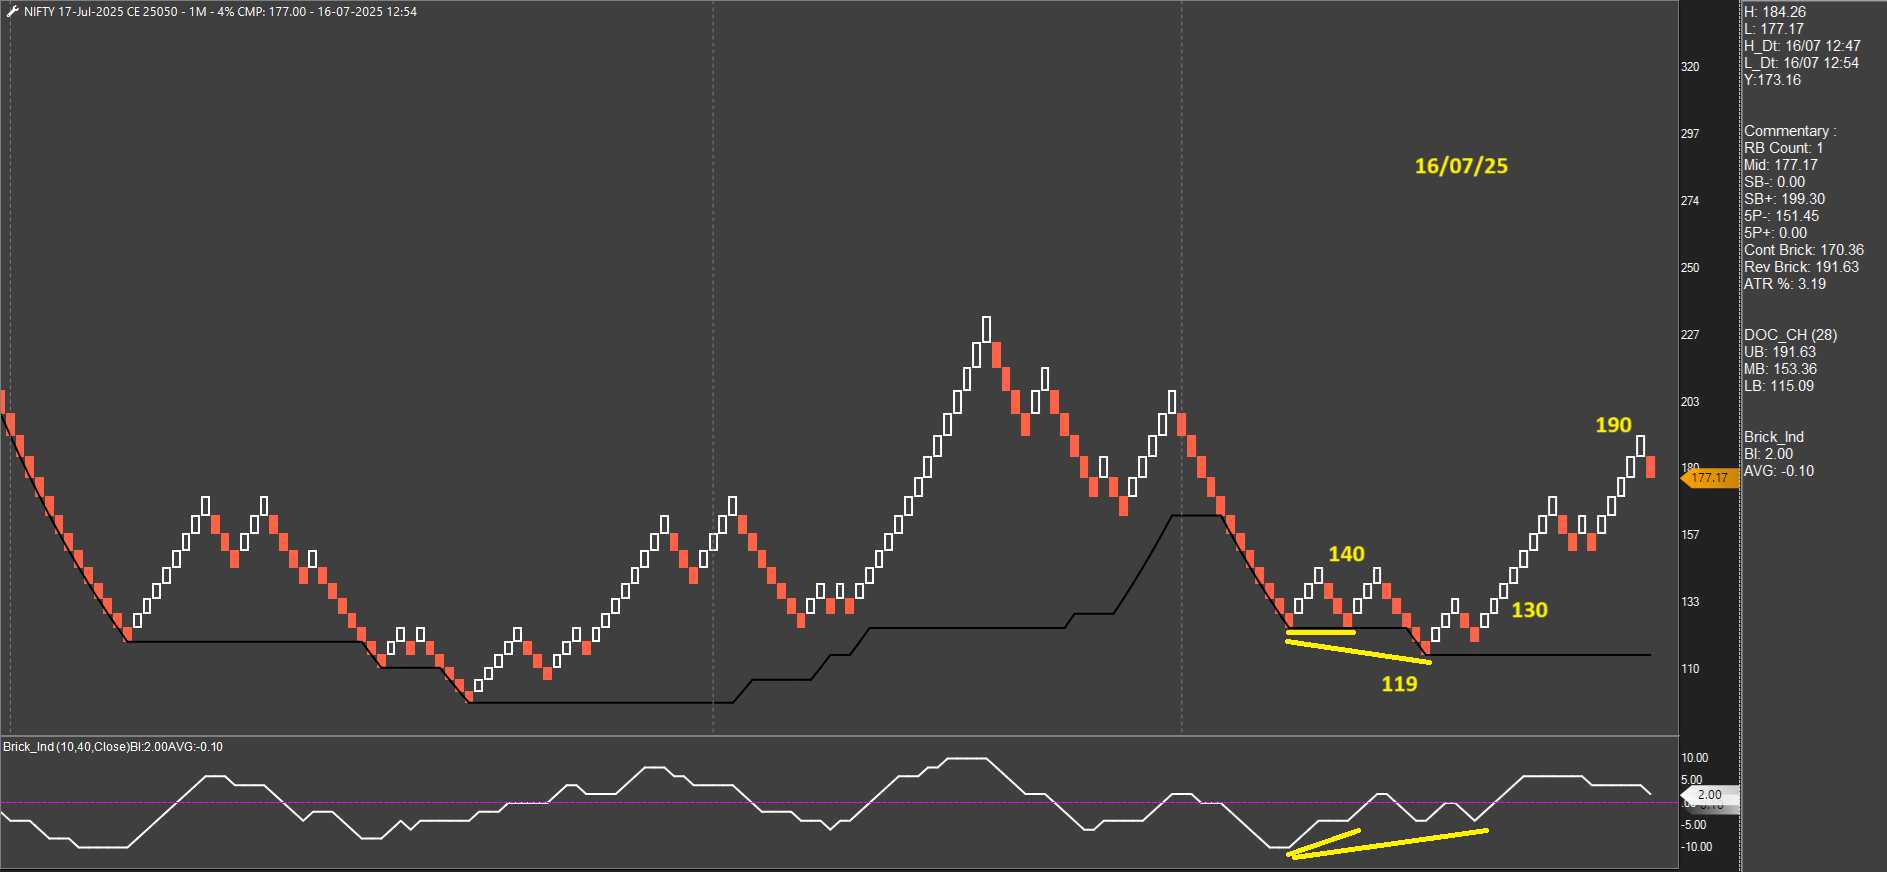
SL hit for NIFTY 17-Jul-2025 CE 25450. The only trade of the day.
-
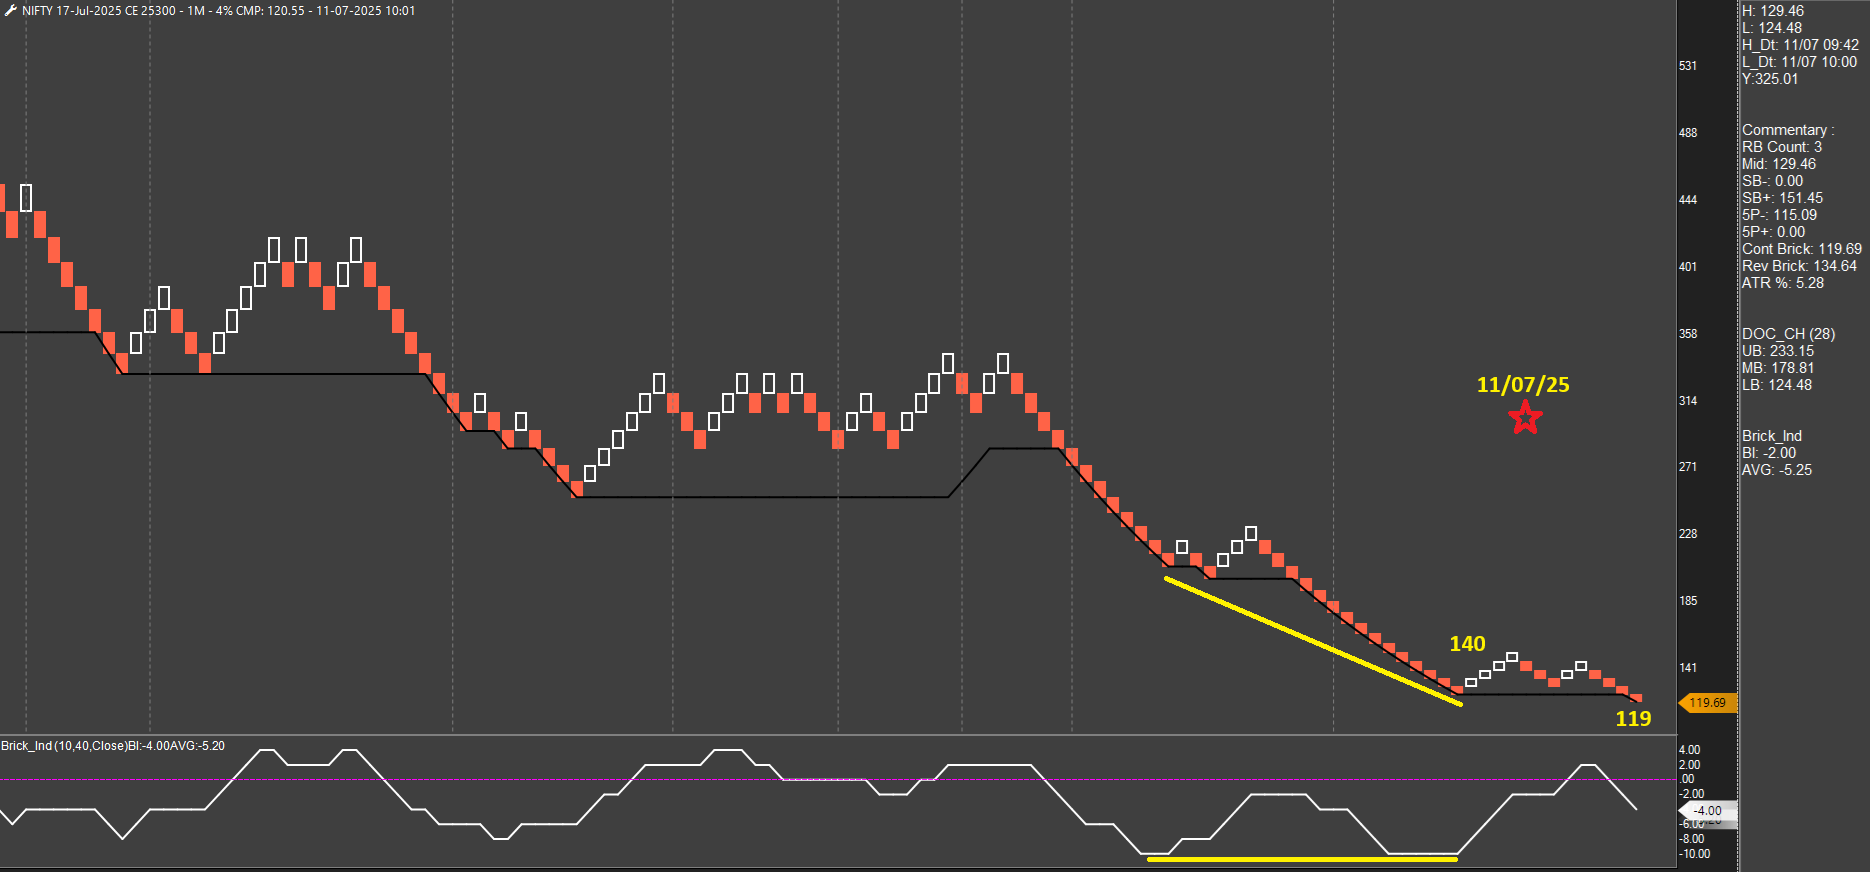
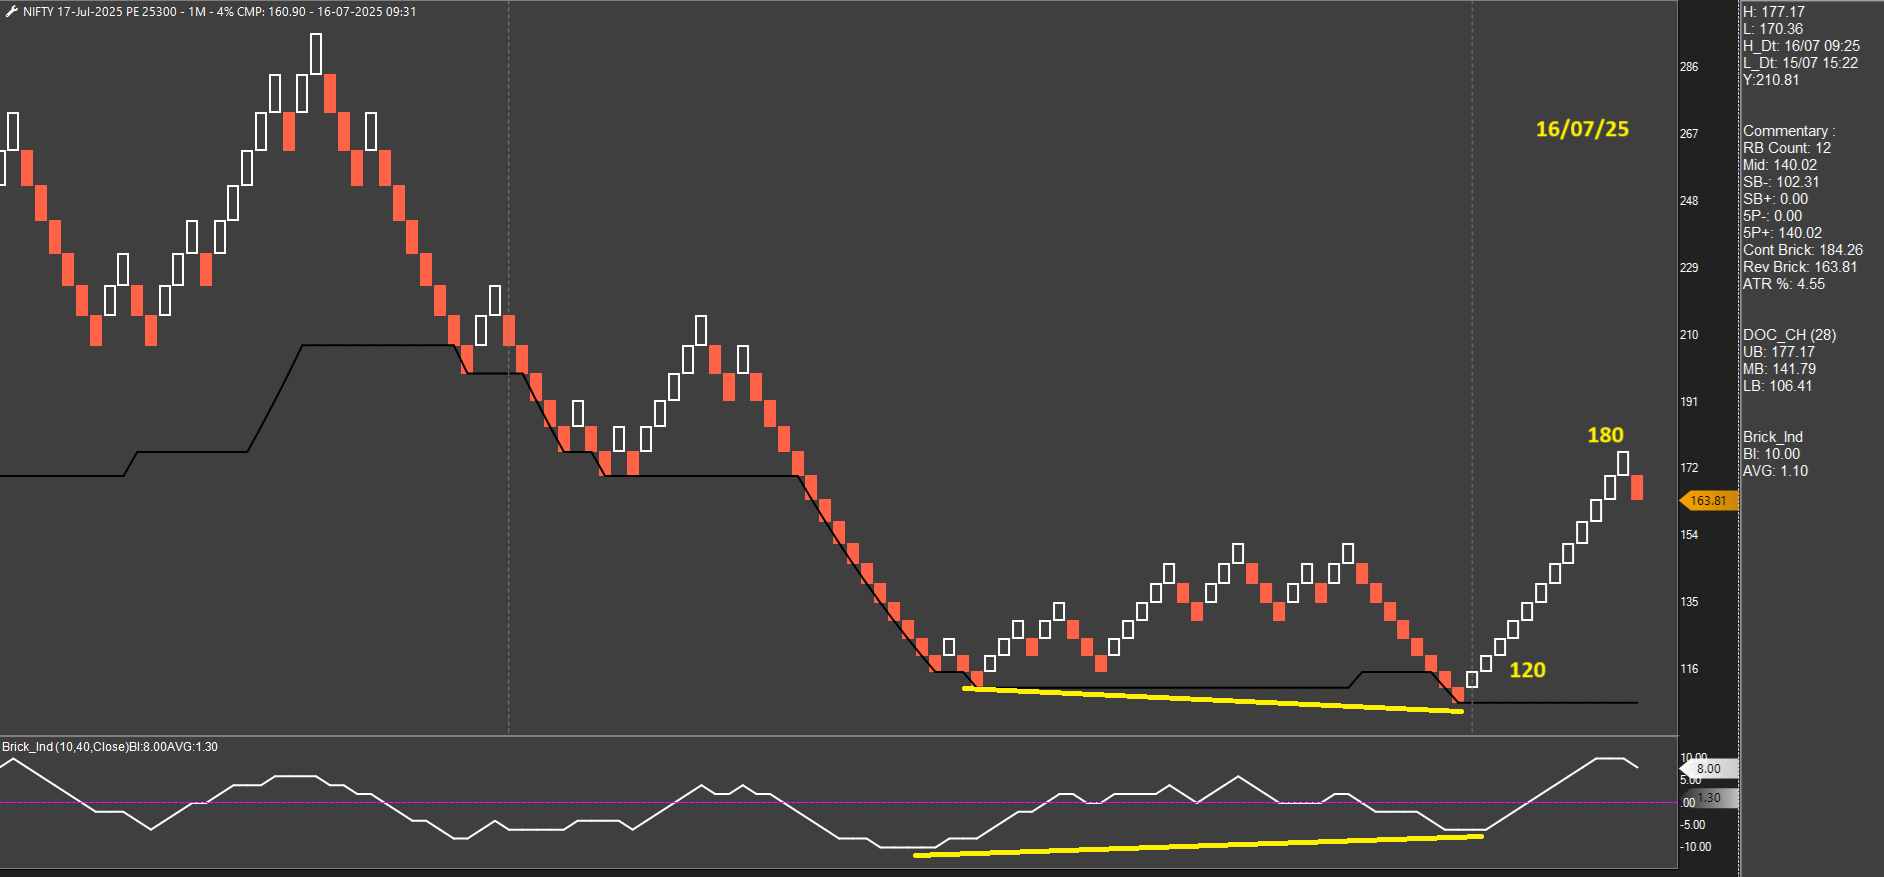
SL hit for NIFTY 17-Jul-2025 CE 25300.
-
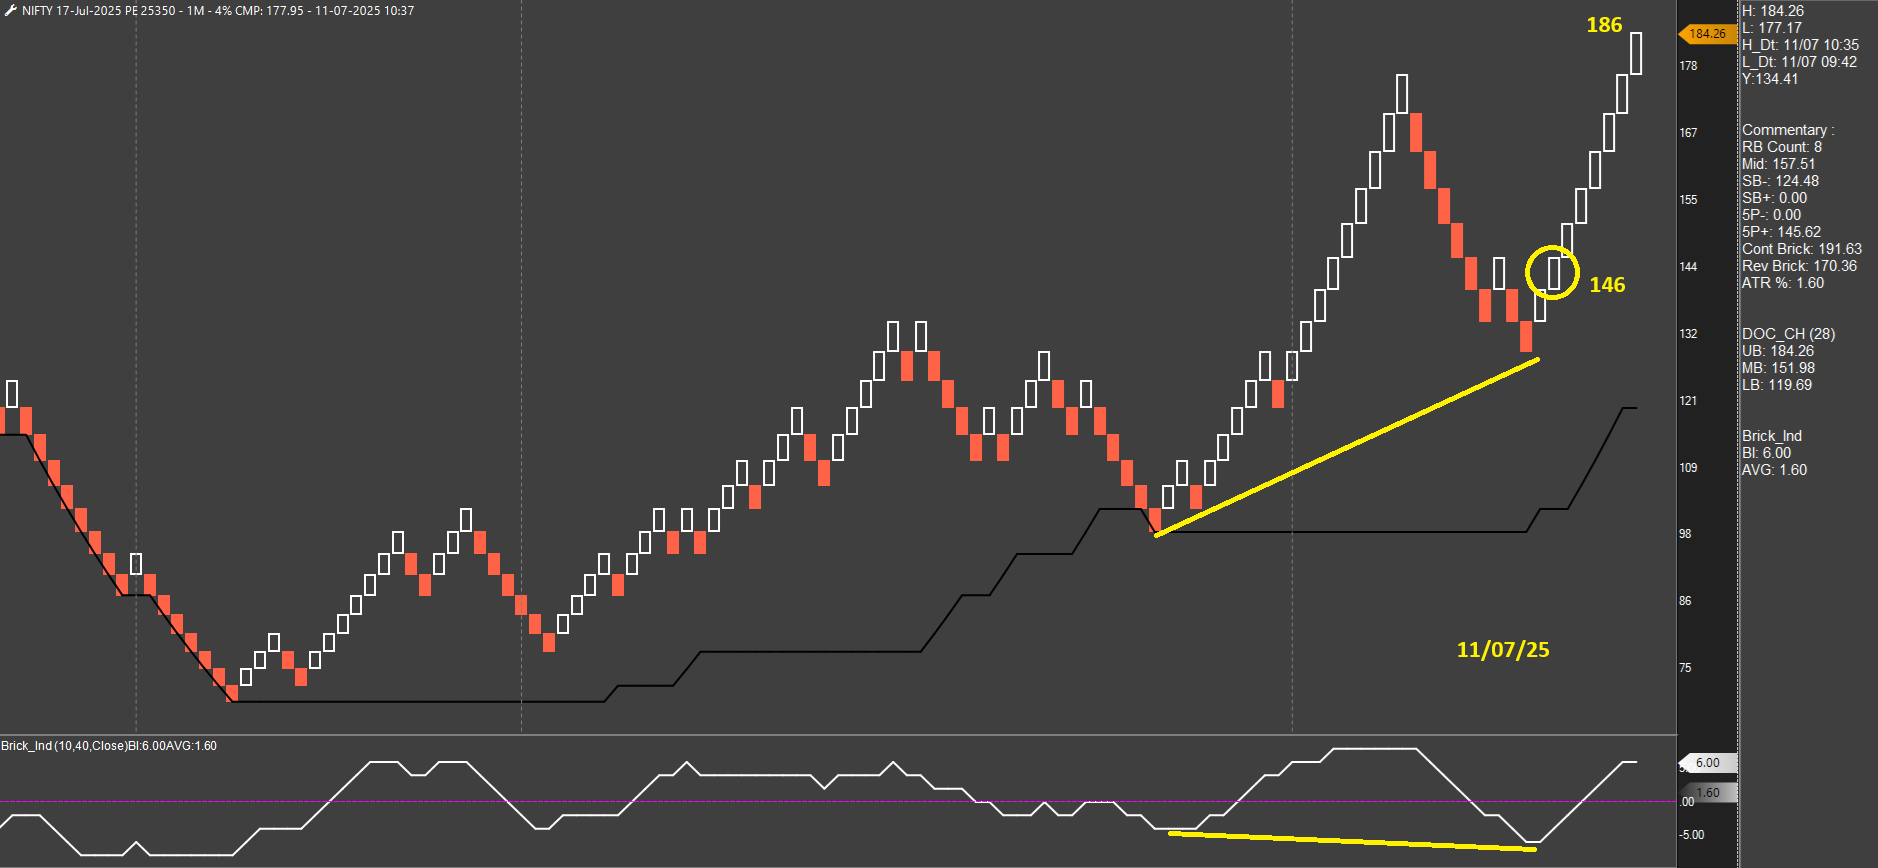
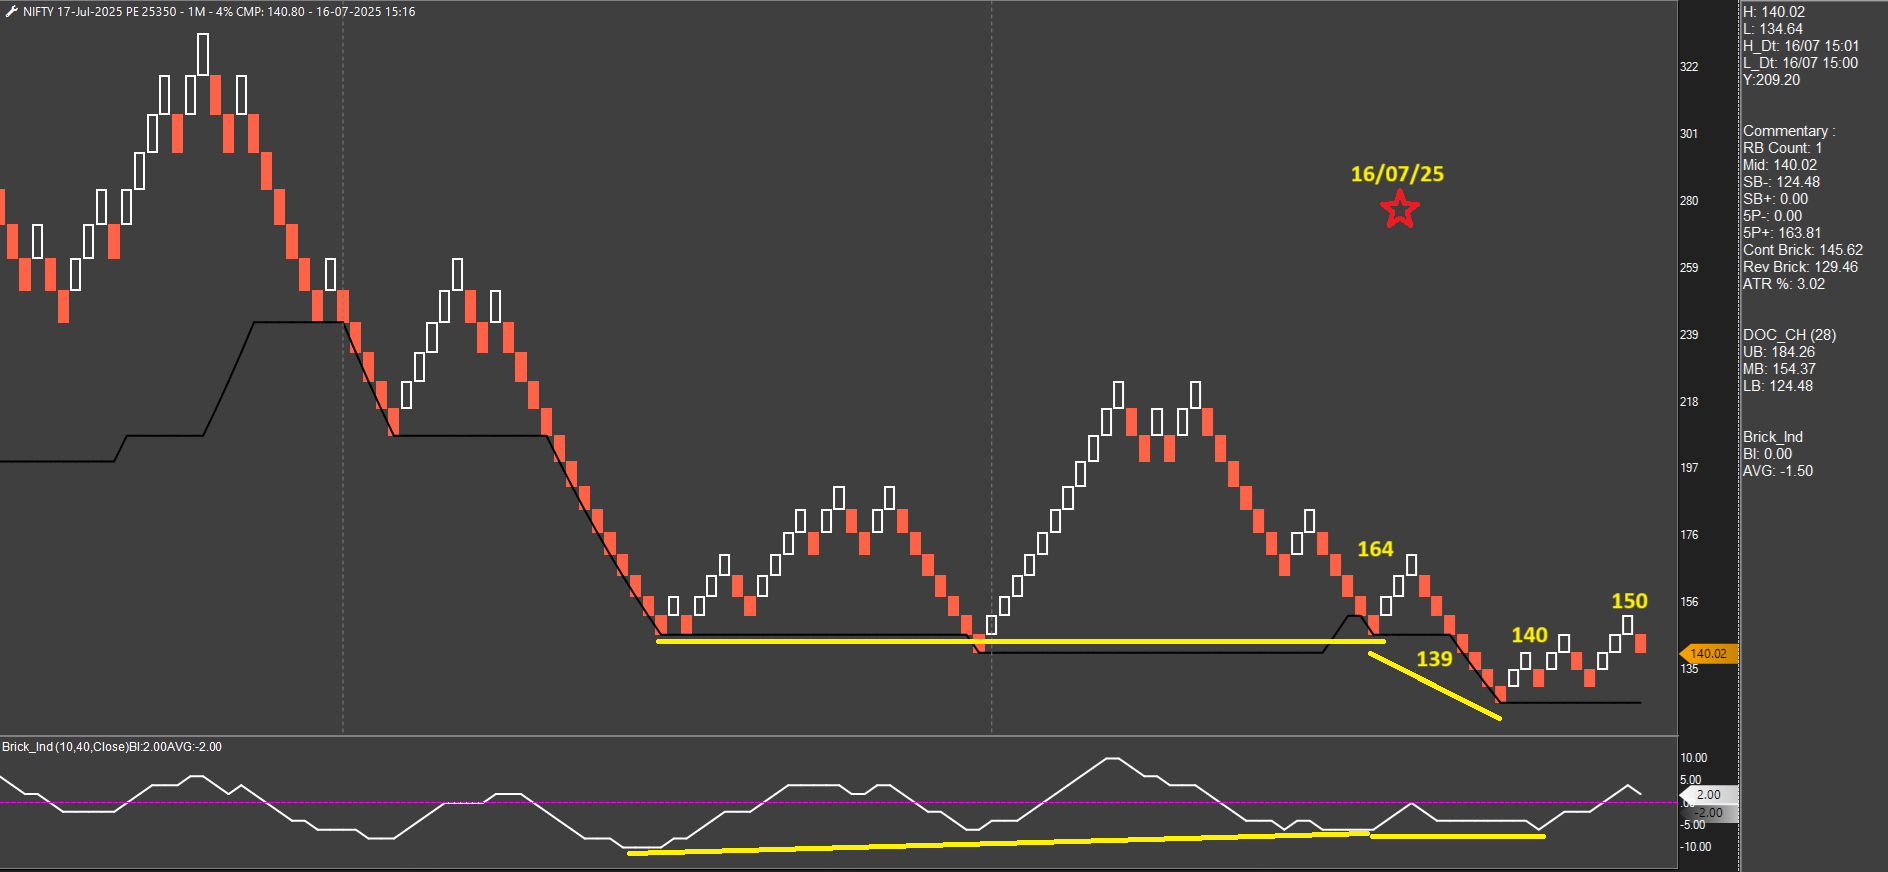
Missed this entry in 25350 PE while the SL hit in the earlier trade. Perfect hidden divergence which generally occurs in the direction of the main trend. Price will not always be at/near DC LB when the trend is strong and one has to keep an eye for hidden divergences. This makes me re-think the necessity of having DC as part of the setup. Regular divergence can be spotted without DC too. Will continue to track this.
-
awesome trade with soild logic
-
@SANTANU BEZ, Pinches a little to miss this. Made high of 240 and still not over. But there will be many more such trades in the future
")
-
yes my 25100 still also drifting , menas still it's not over
-
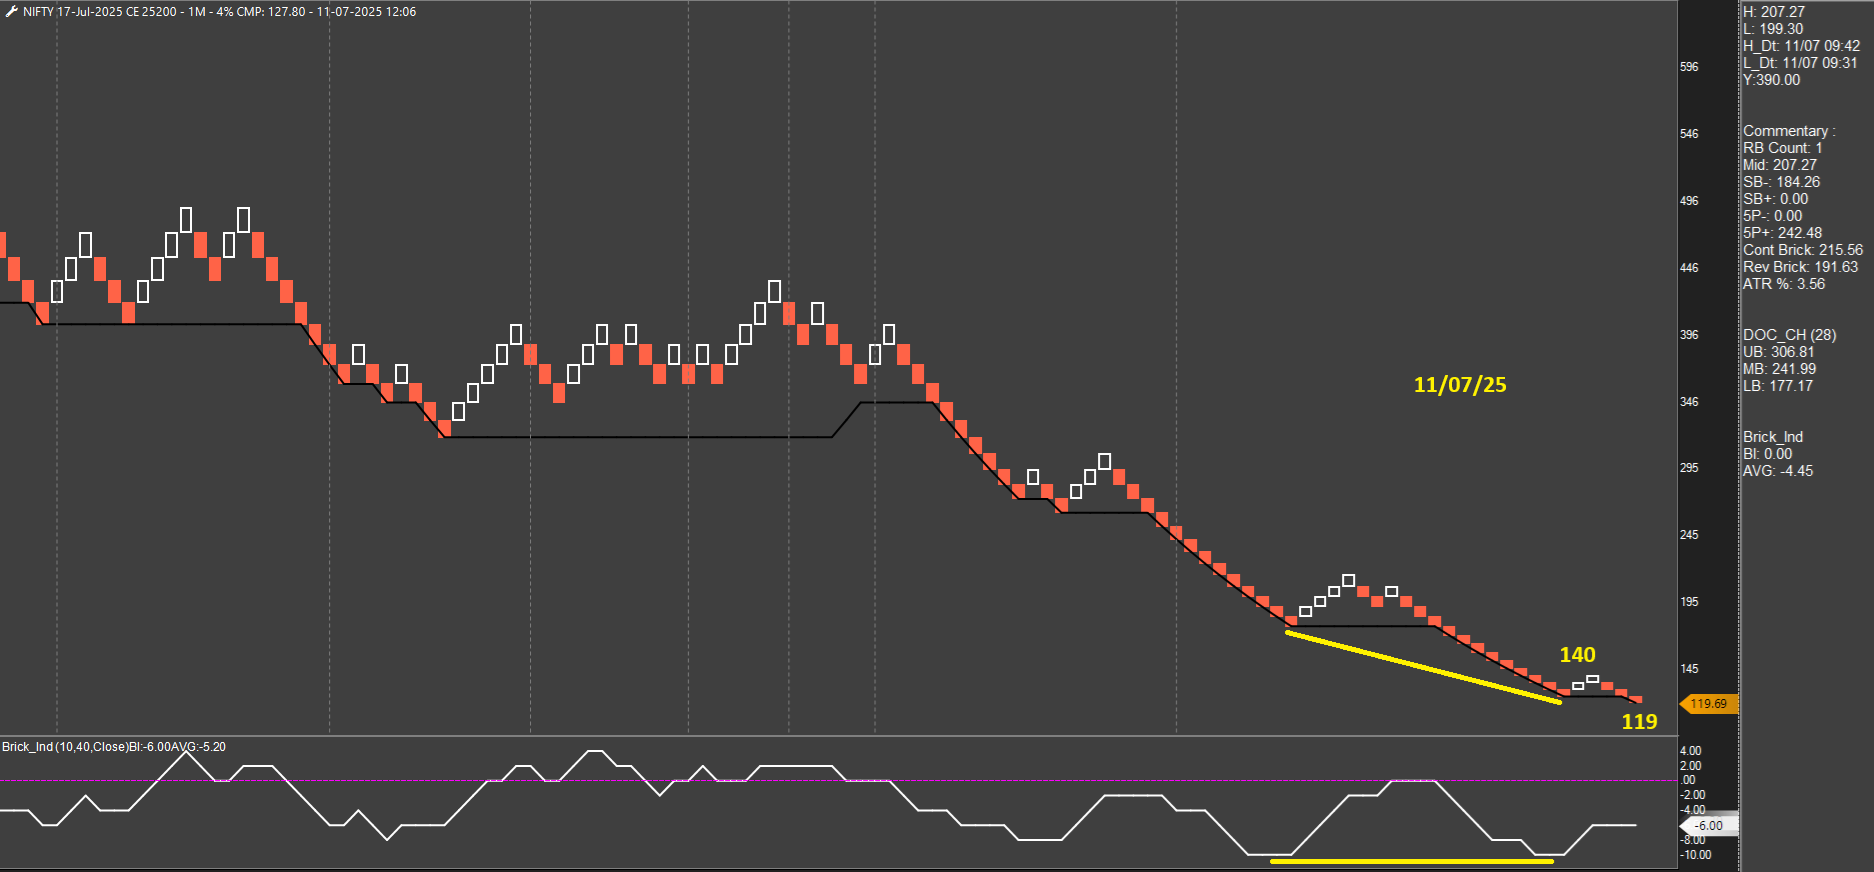
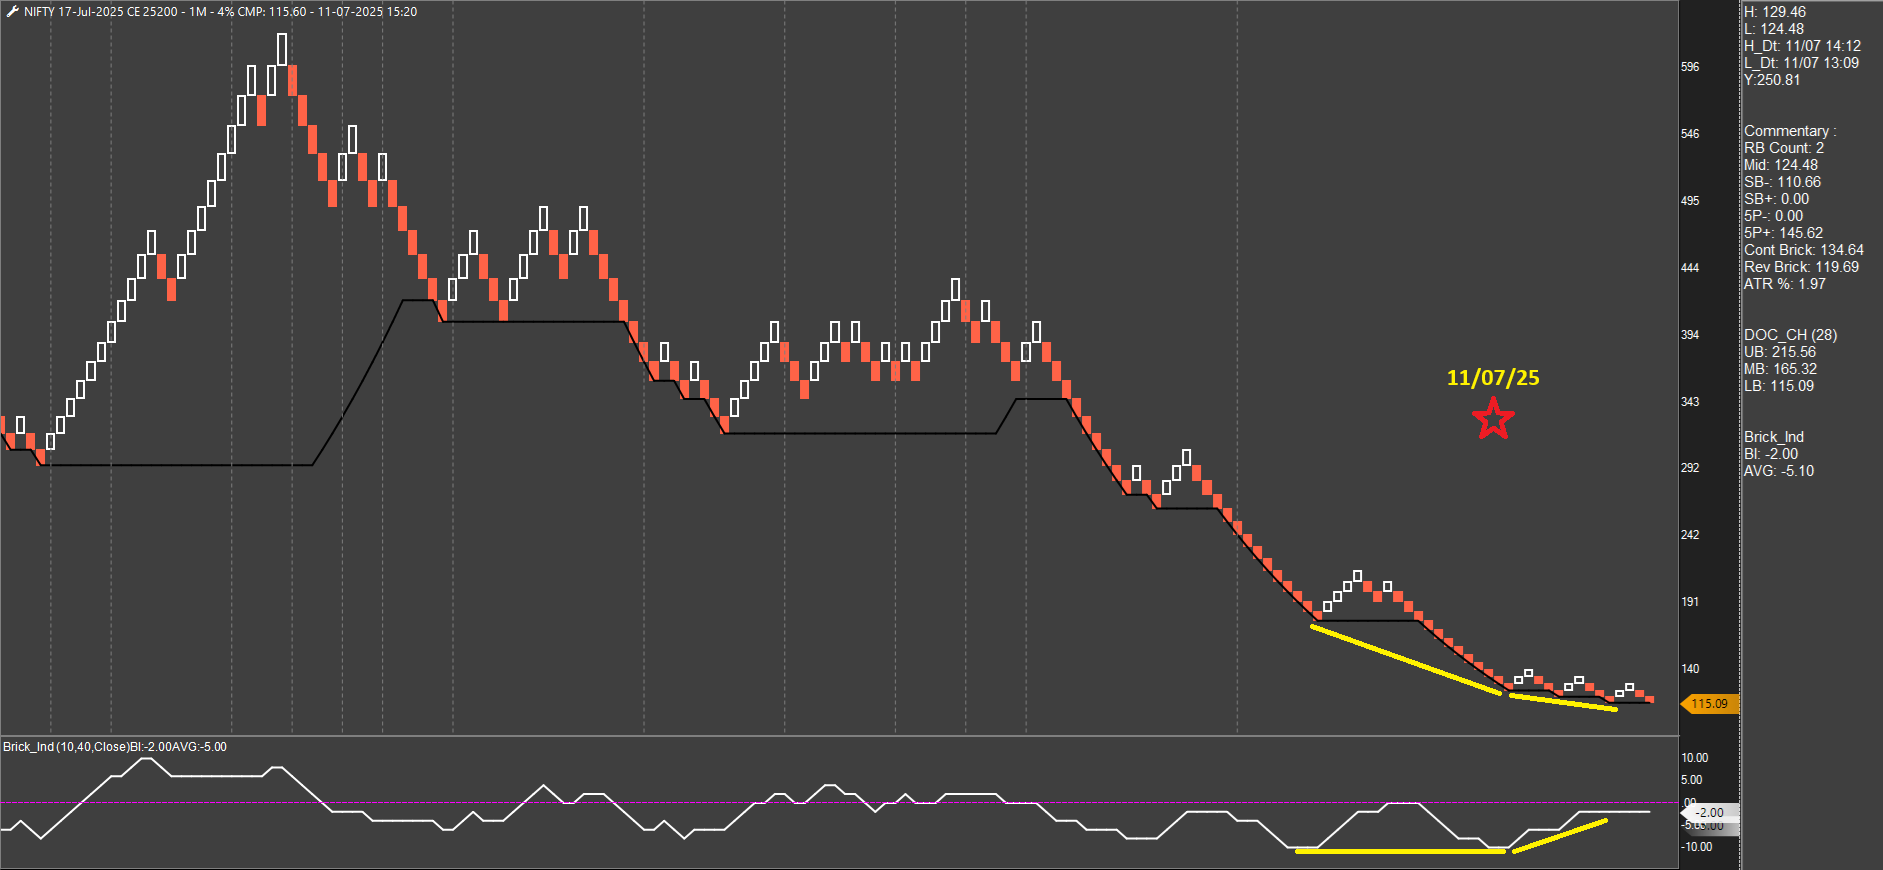
SL hit for NIFTY 17-Jul-2025 CE 25200.
-
3 consecutive hits. The system aims to pick up reversals and it is tough when the trend is strong. This is a good time to test and gather insights for future improvements. Overall a good week. Looking forward to the next week.
-
Sir, do you also trade bearish trades according to this method ? also if we can consider intraday brick zone % instead for Brick Count and trade divergence ?
-
@Harpreet Singh, by bearish trades I assume you are referring to short options? If so, I am not very comfortable working with negative divergences. Probably just a frame of mind developed over the years. Also, I wanted to develop an intraday long options system that would complement my other short options swing trading system.
Intraday brick zone% is a slightly different indicator in that it only focuses on the day's action irrespective of what has happened in the previous session(s). It does not provide any insight on divergences.
-
Hi Sundeep sir,
Which srikes price you are selcting ATM?
Did you change parameters of DC and BI? -
25050 CE
-
@Ashish Talekar , DC is 28 and BI is 10.
I select a strike having premium in the range of 130-150. -
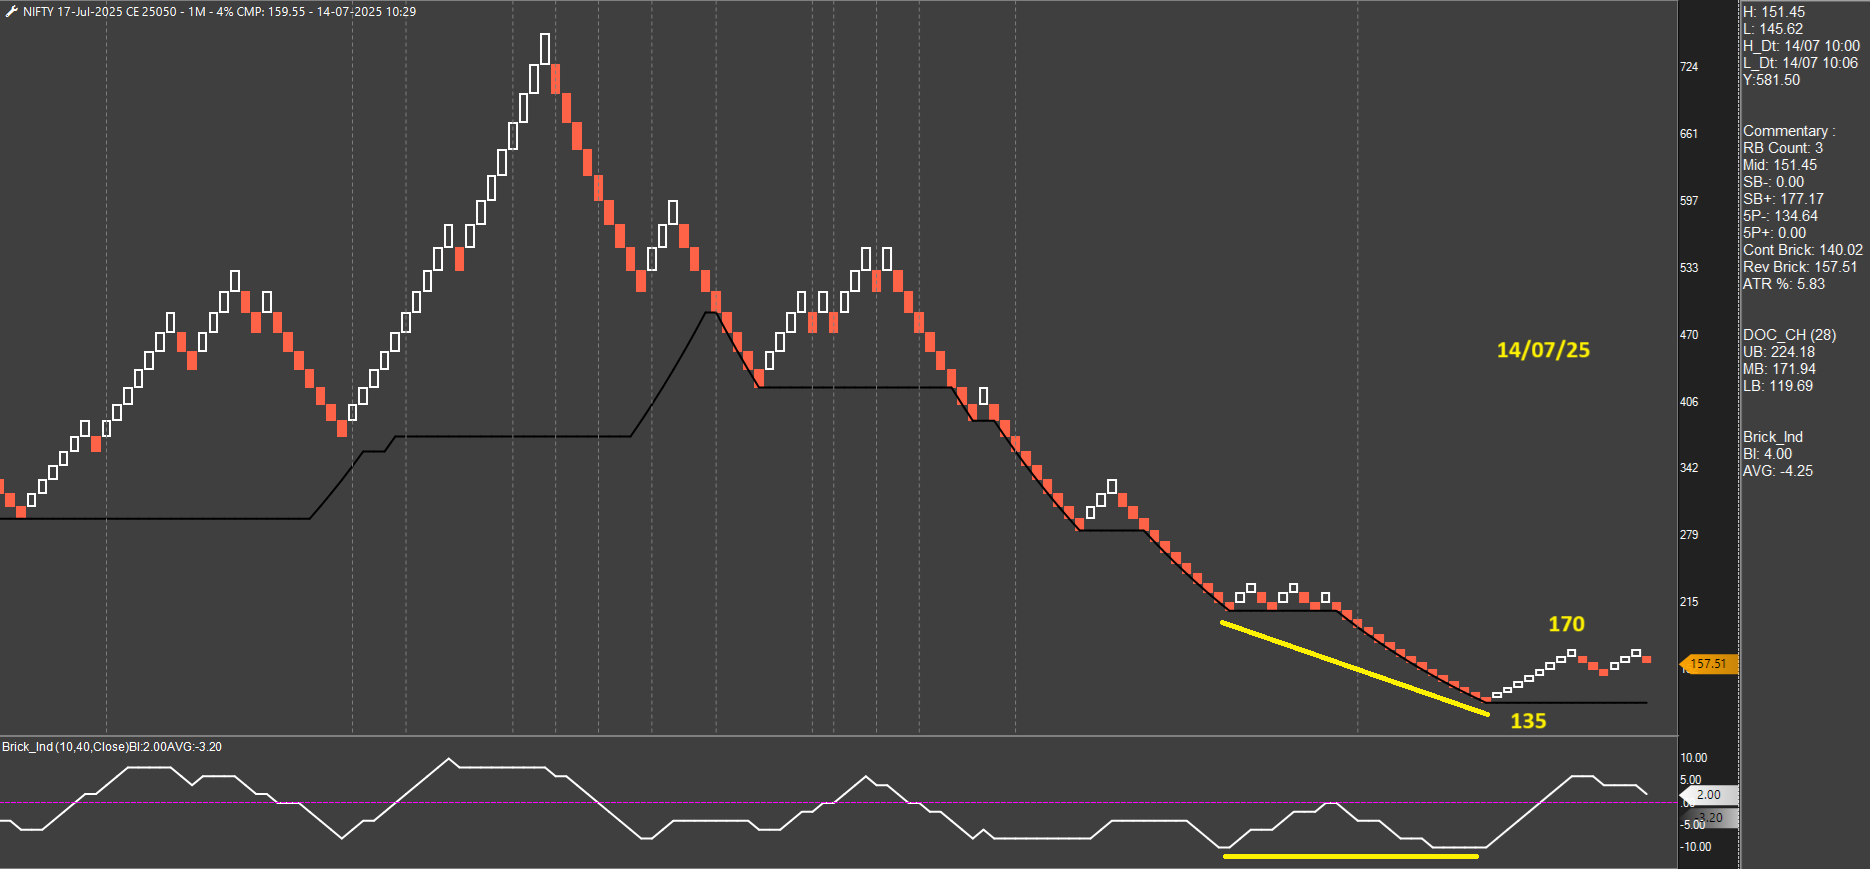
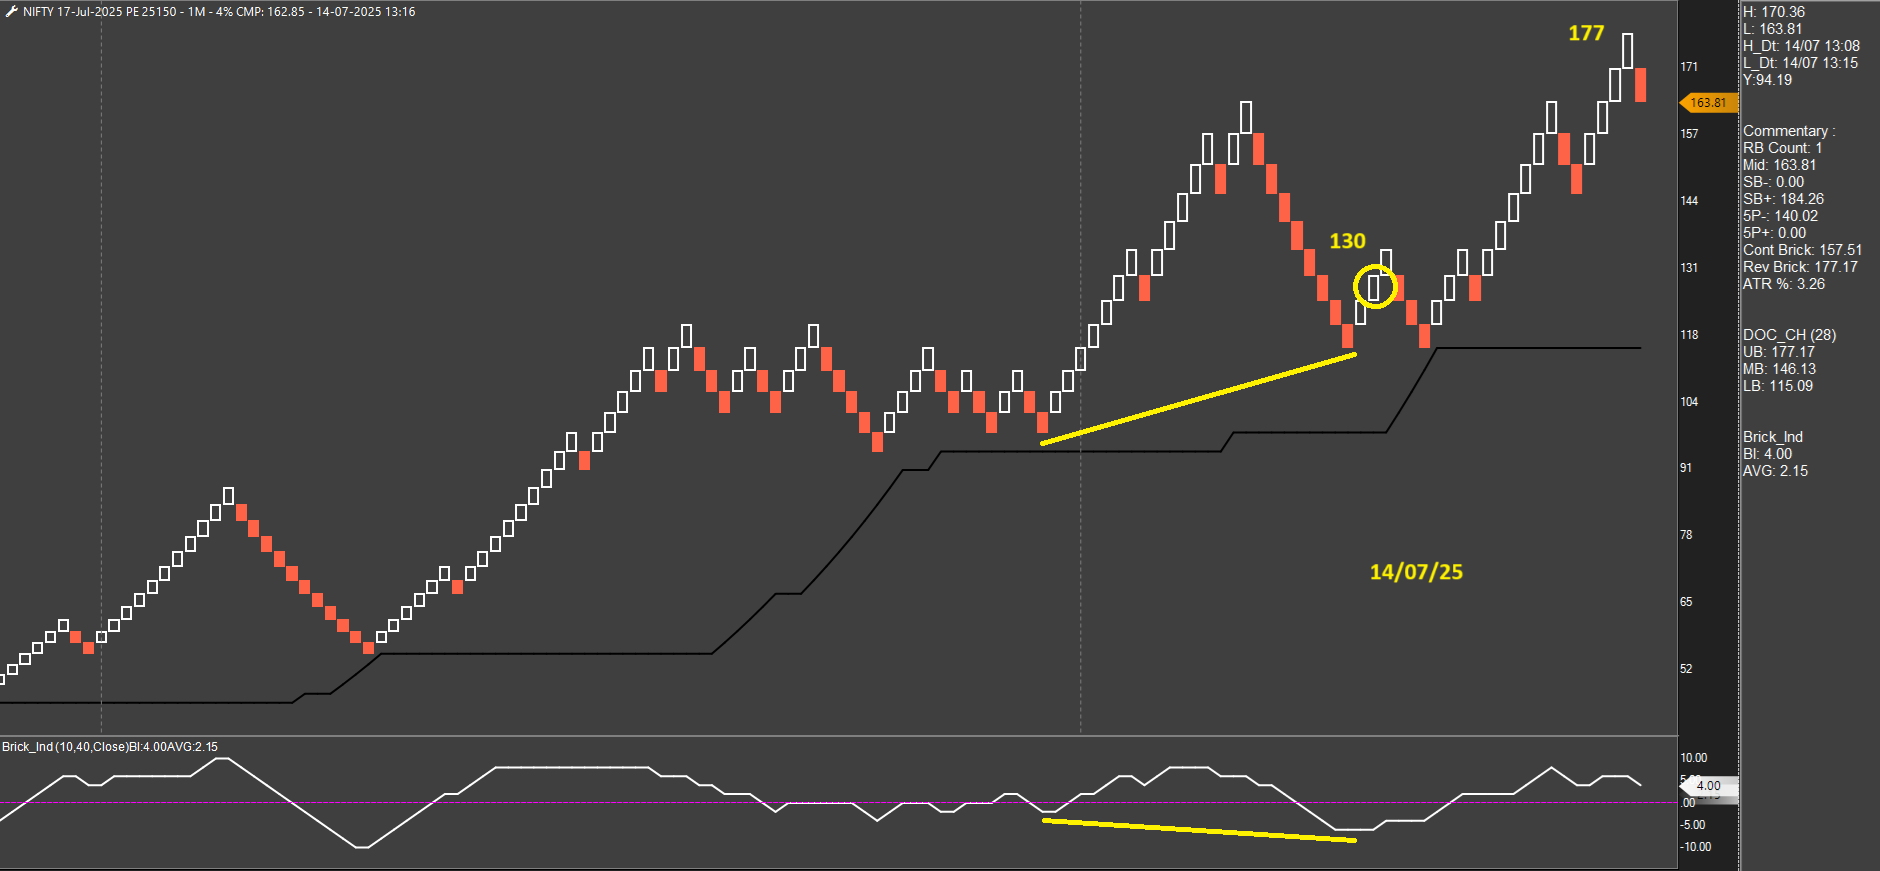
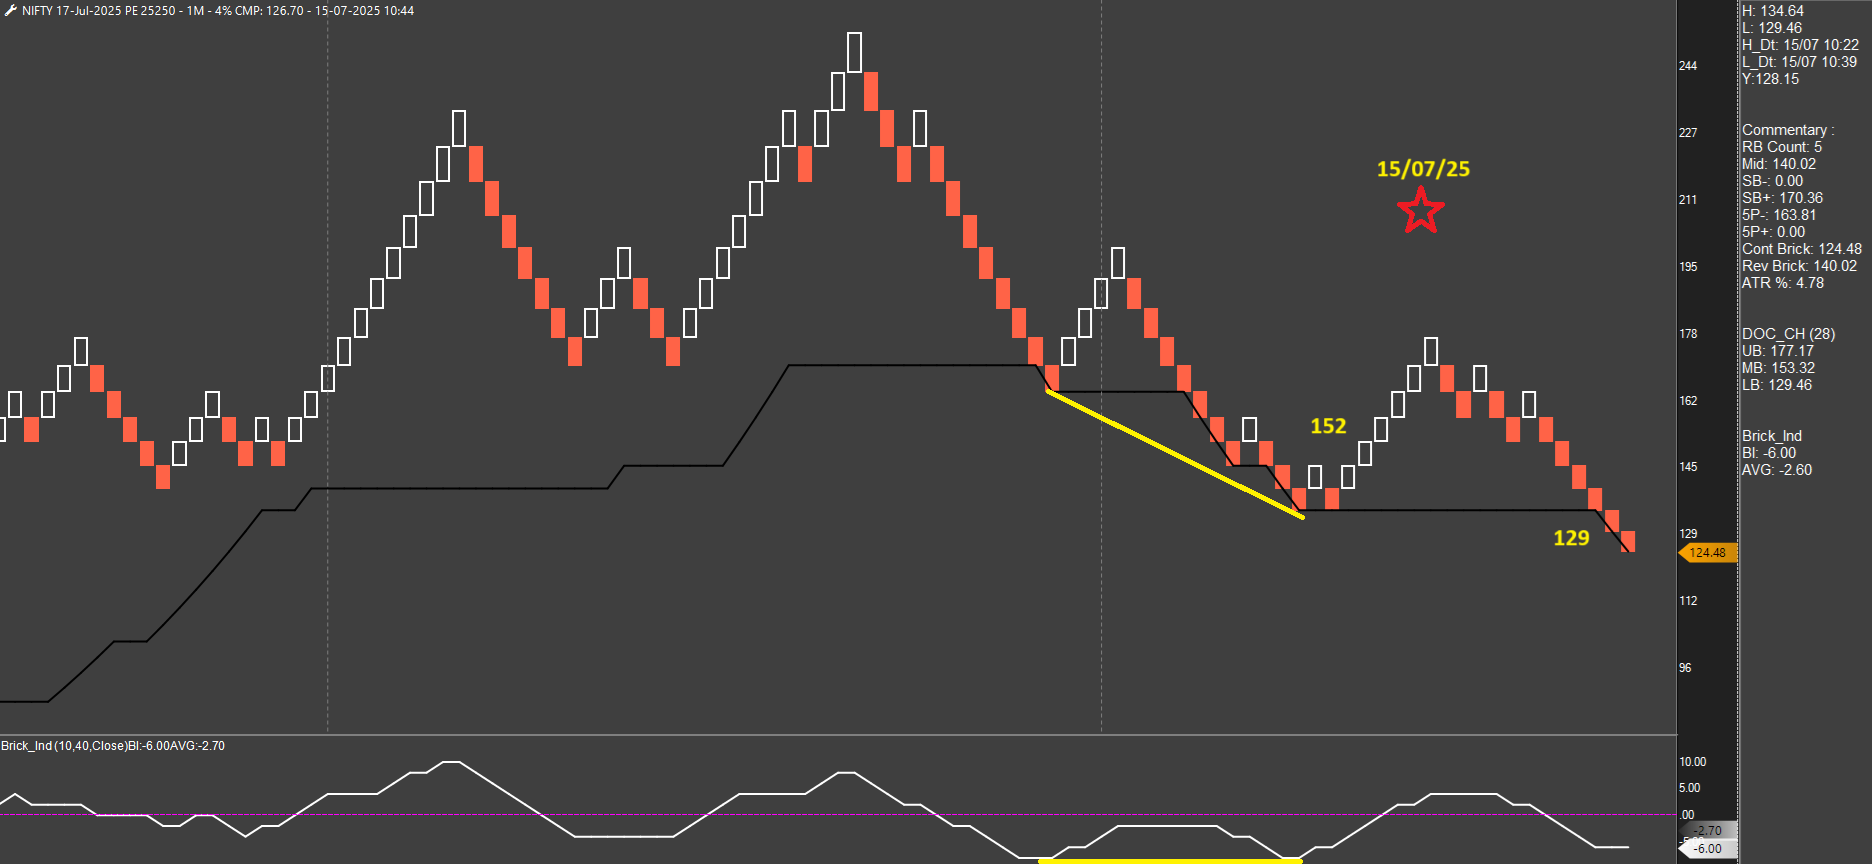
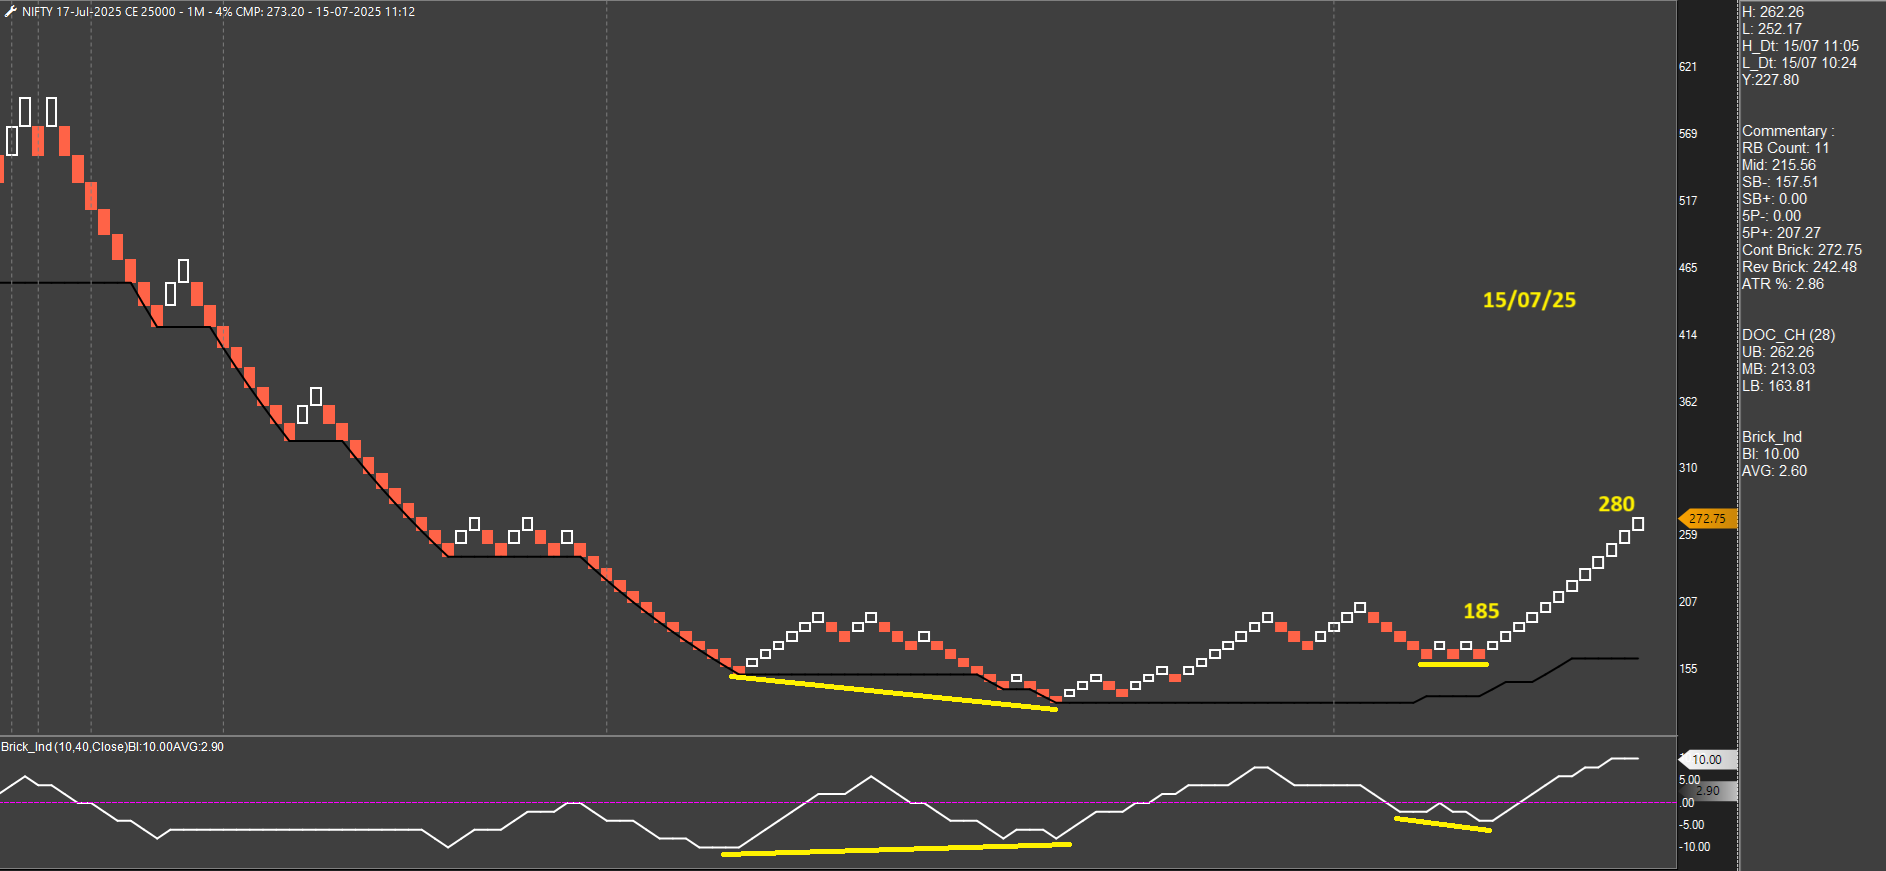
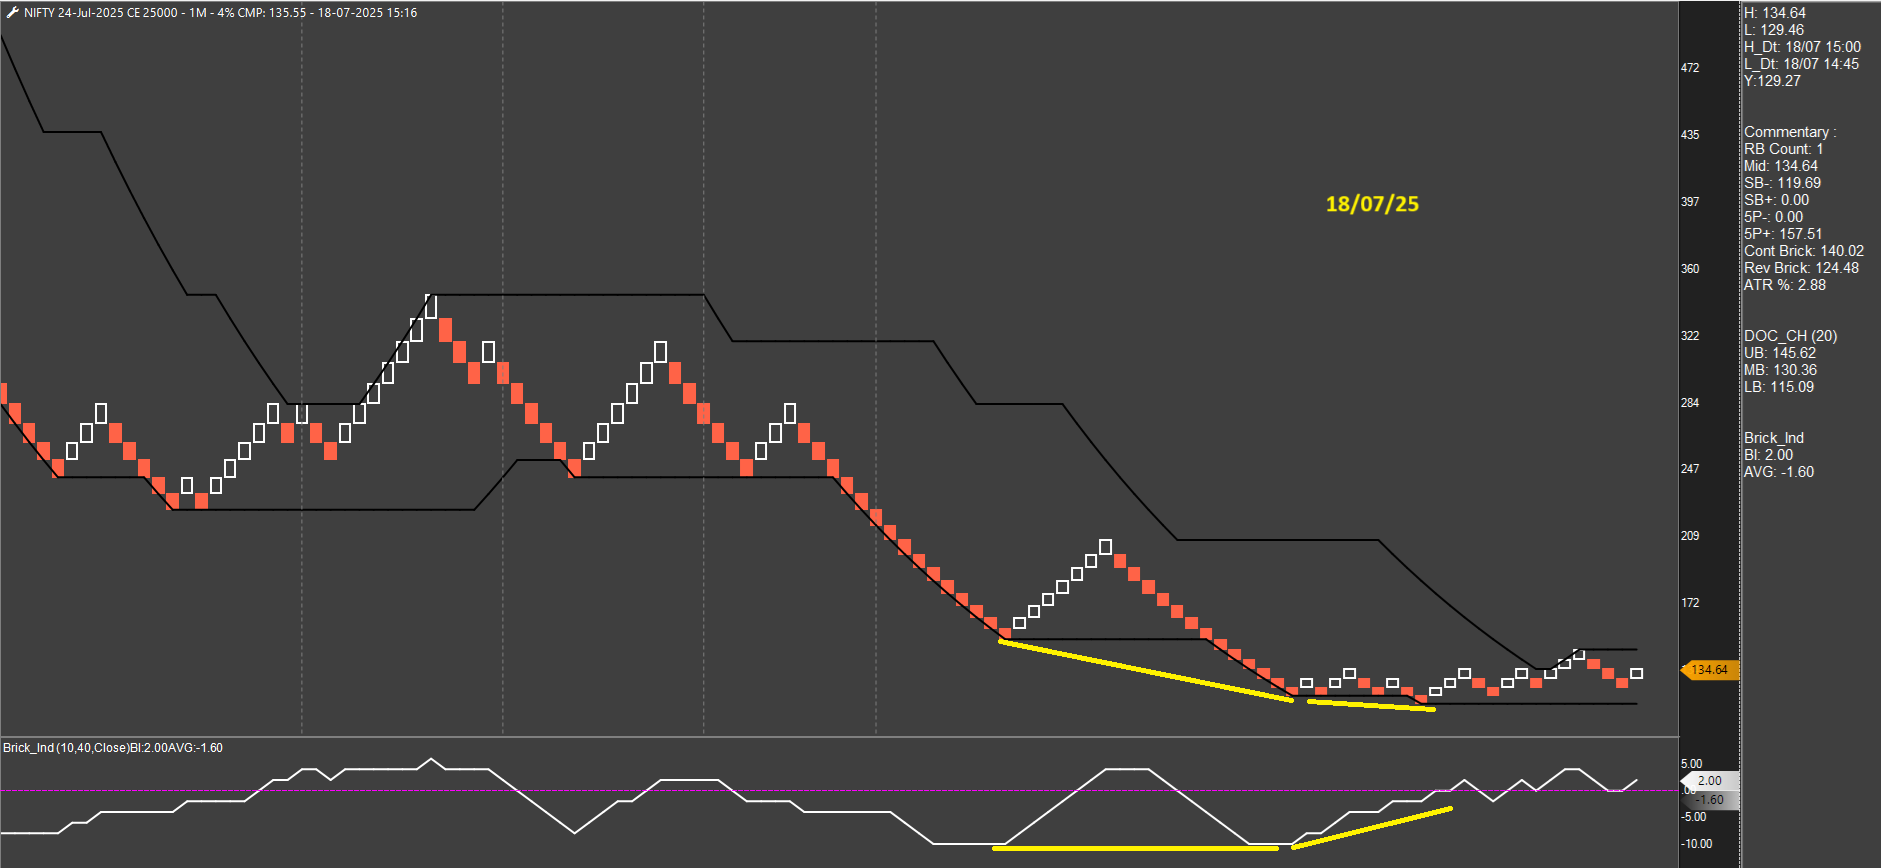
2 more trades. 25150 PE triggered first. Later 25050 CE triggered while PE was still on. Both done now.
-
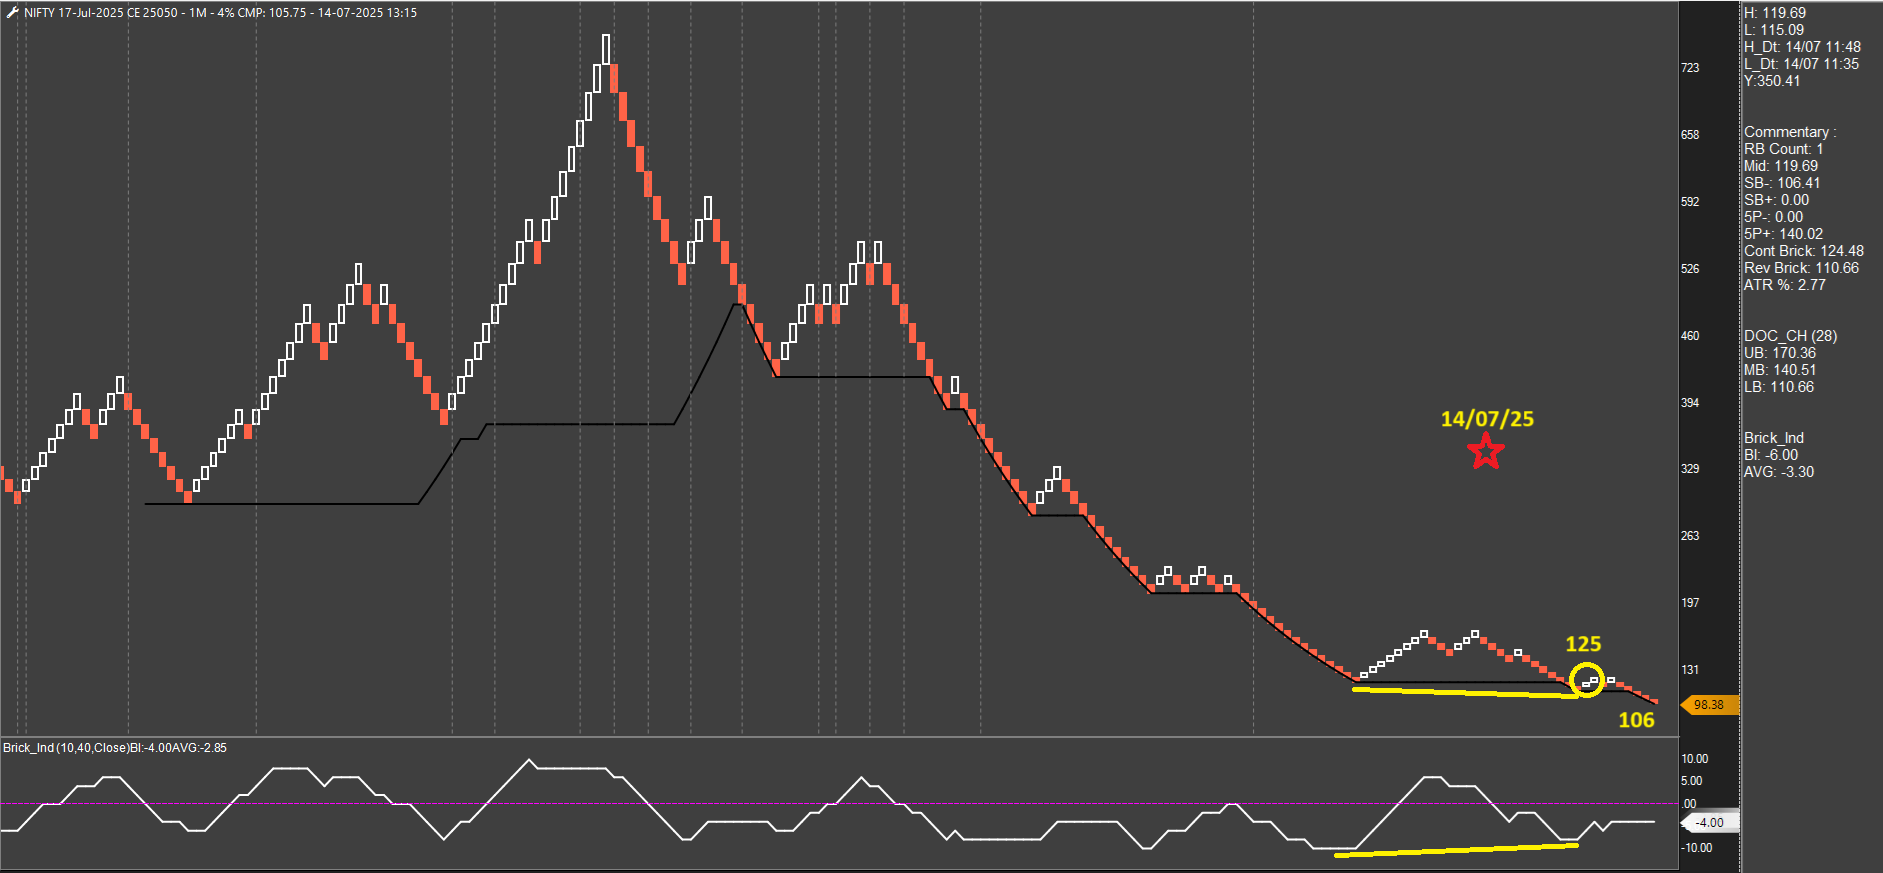
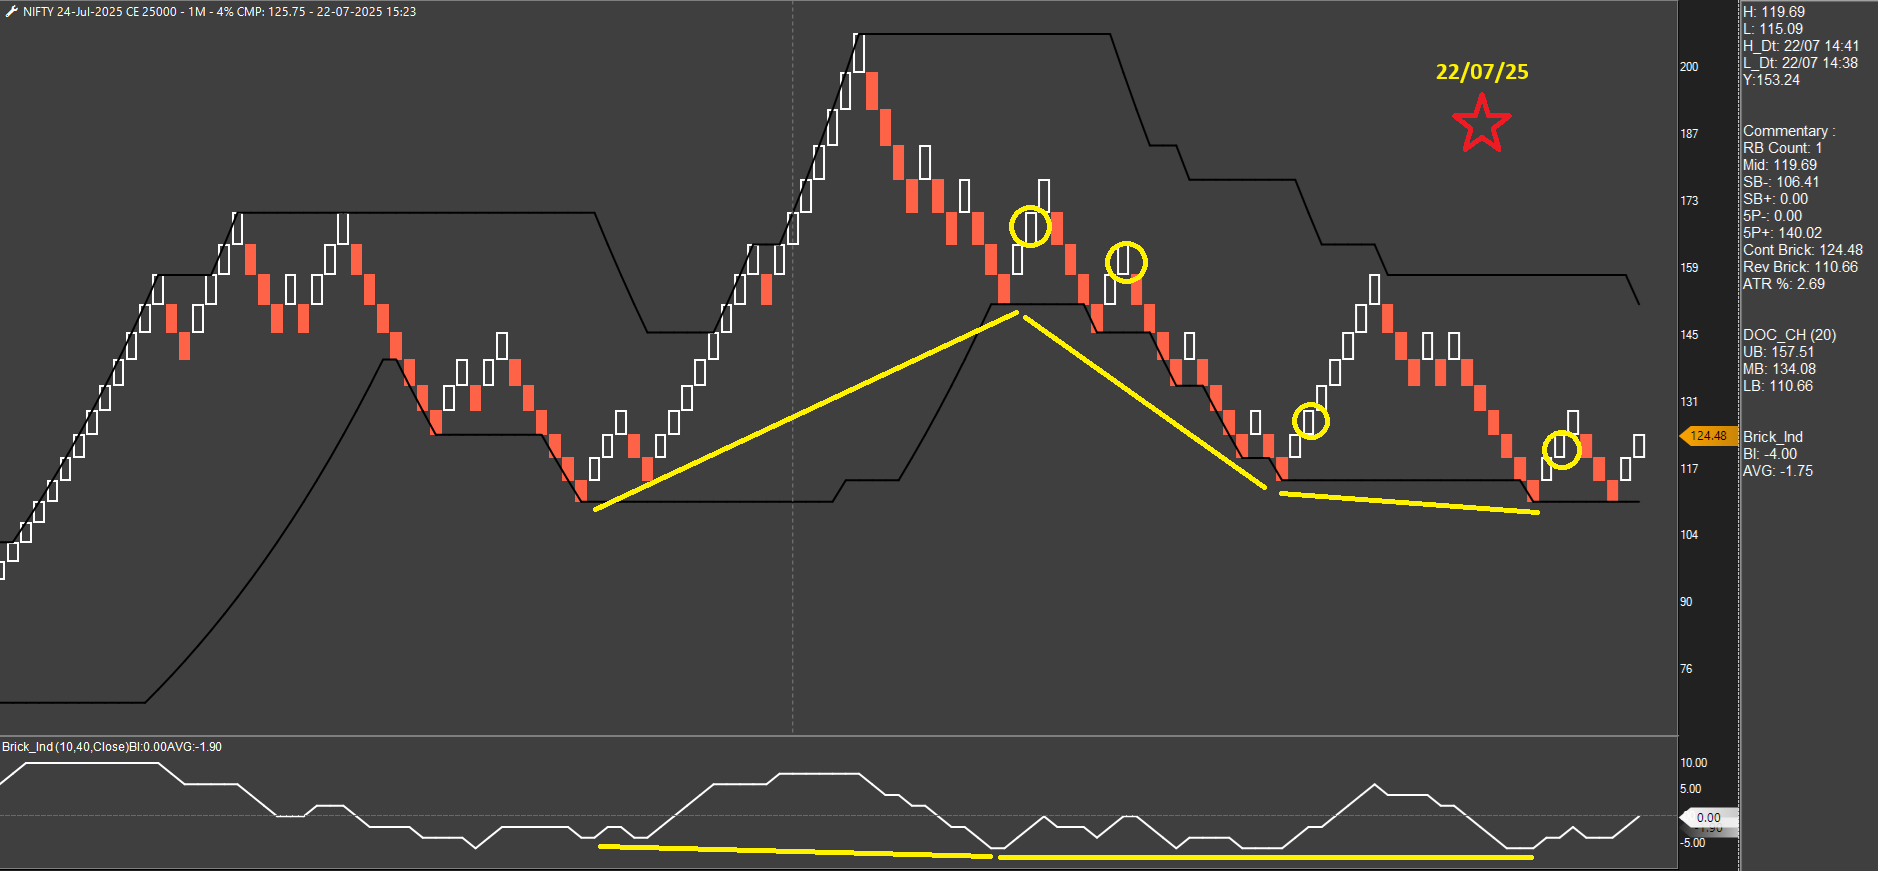
Last trade of the day, 25000 CE
-
25250 PE - good effort but couldn't sustain.
-
25000 CE - almost 100 pts! Missed this trade due to a couple of reasons:
- This system depends on divergence as displayed by BI. Now the issue is that divergence is based on the price action of the instrument and each strike has its own action going on. Not every strike will exhibit divergence. I was looking at 25050 CE and it gave no signal.
- Even if I was looking at 25000 CE, the initial SL was beyond my limit so wouldn't have taken the trade. In hindsight, I could have gone with half qty.
All good learnings and food for thought. Helps improve the system. The thought process behind this system is working very well and that is consolation enough.
-
I don't usually trade based on divergence, but here is a suggestion that might help:
Try tracking divergence on the Nifty 50 chart instead of option charts. It gives earlier signals, so you can enter CE or PE before the move begins.
Option charts show more divergences because of volatile price action, which leads to too many signals. More trades often mean lower success rates.If you track divergence on Nifty 50 instead, the signals will be fewer but more reliable. Once the divergence is confirmed on the underlying, you can take an options trade using your own stop-loss criteria.
-
This post is deleted!
-
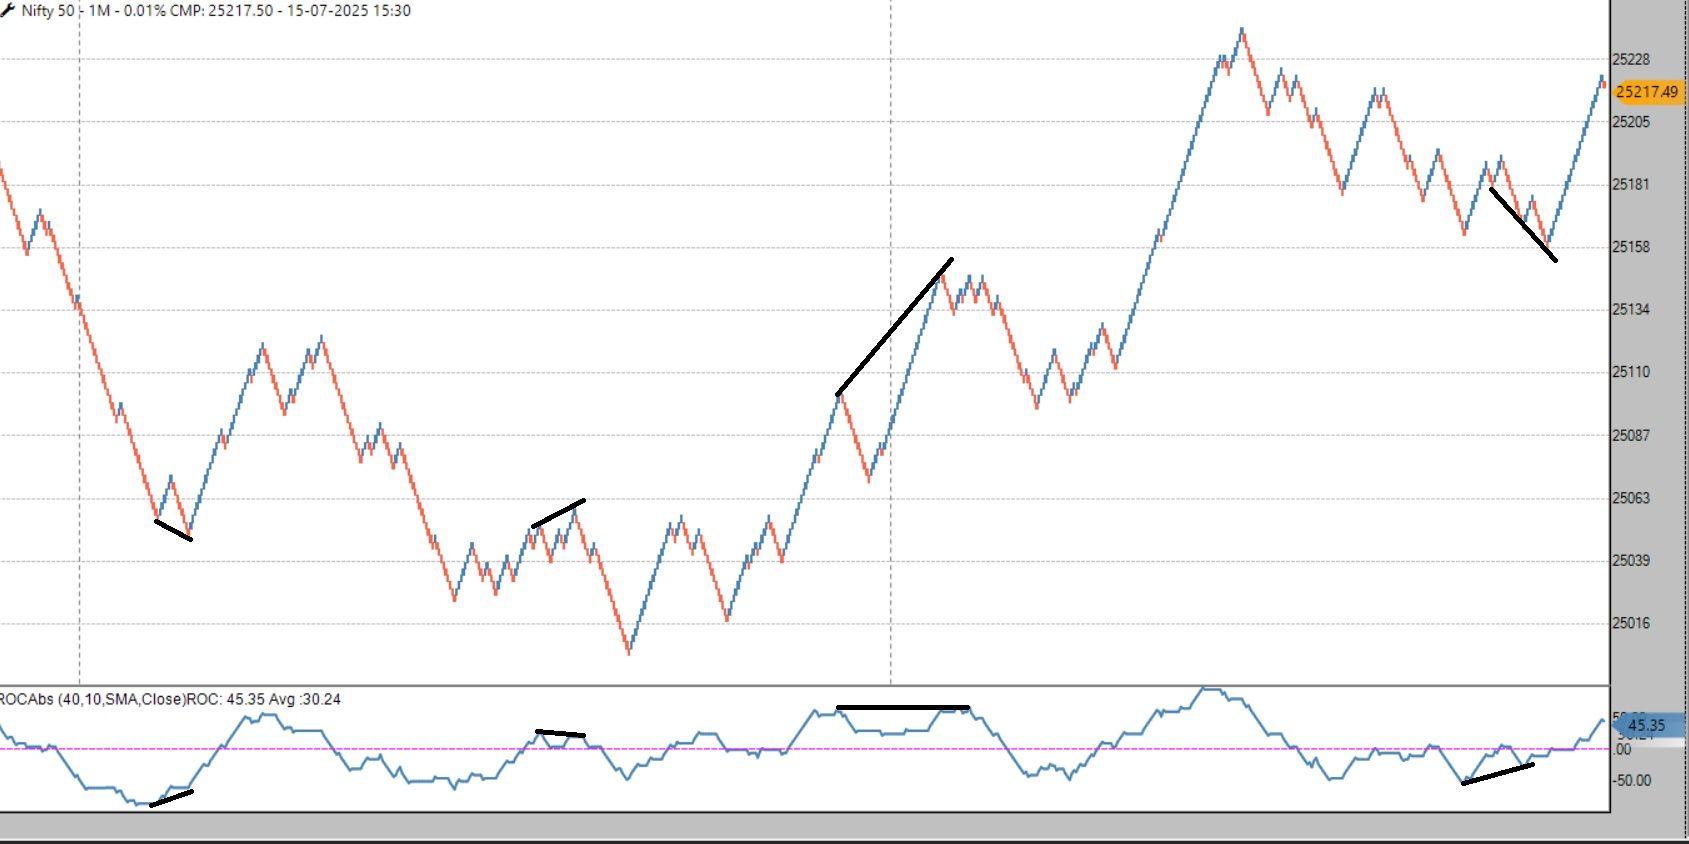
Something like this
-
@Ravi Shinde, in my observations from the past, I have consistently seen that options exhibit signals earlier than spot/fut. However, I hadn't looked at the underlying charts on a very small brick size. This is surely interesting, and I'll observe this for the next few days. Maybe I'll change it to 0.02% H-L to avoid re-painting on close. Intraday will need fast action. But again, thanks for your comment
 . This is why I've started posting on this forum - hoping to get suggestions/feedback and improve further.
 -
That's great. Looking forward for your observations.
-
25300 PE - another one for the records but not tradeable. Morning gap leaves you helpless. SL is off-limits and all you can do is leave it and wait for the next trade.
-
25050 CE - first attempt failed. Second attempt did great.
-
25350 PE - 2 trades to end the day.
-
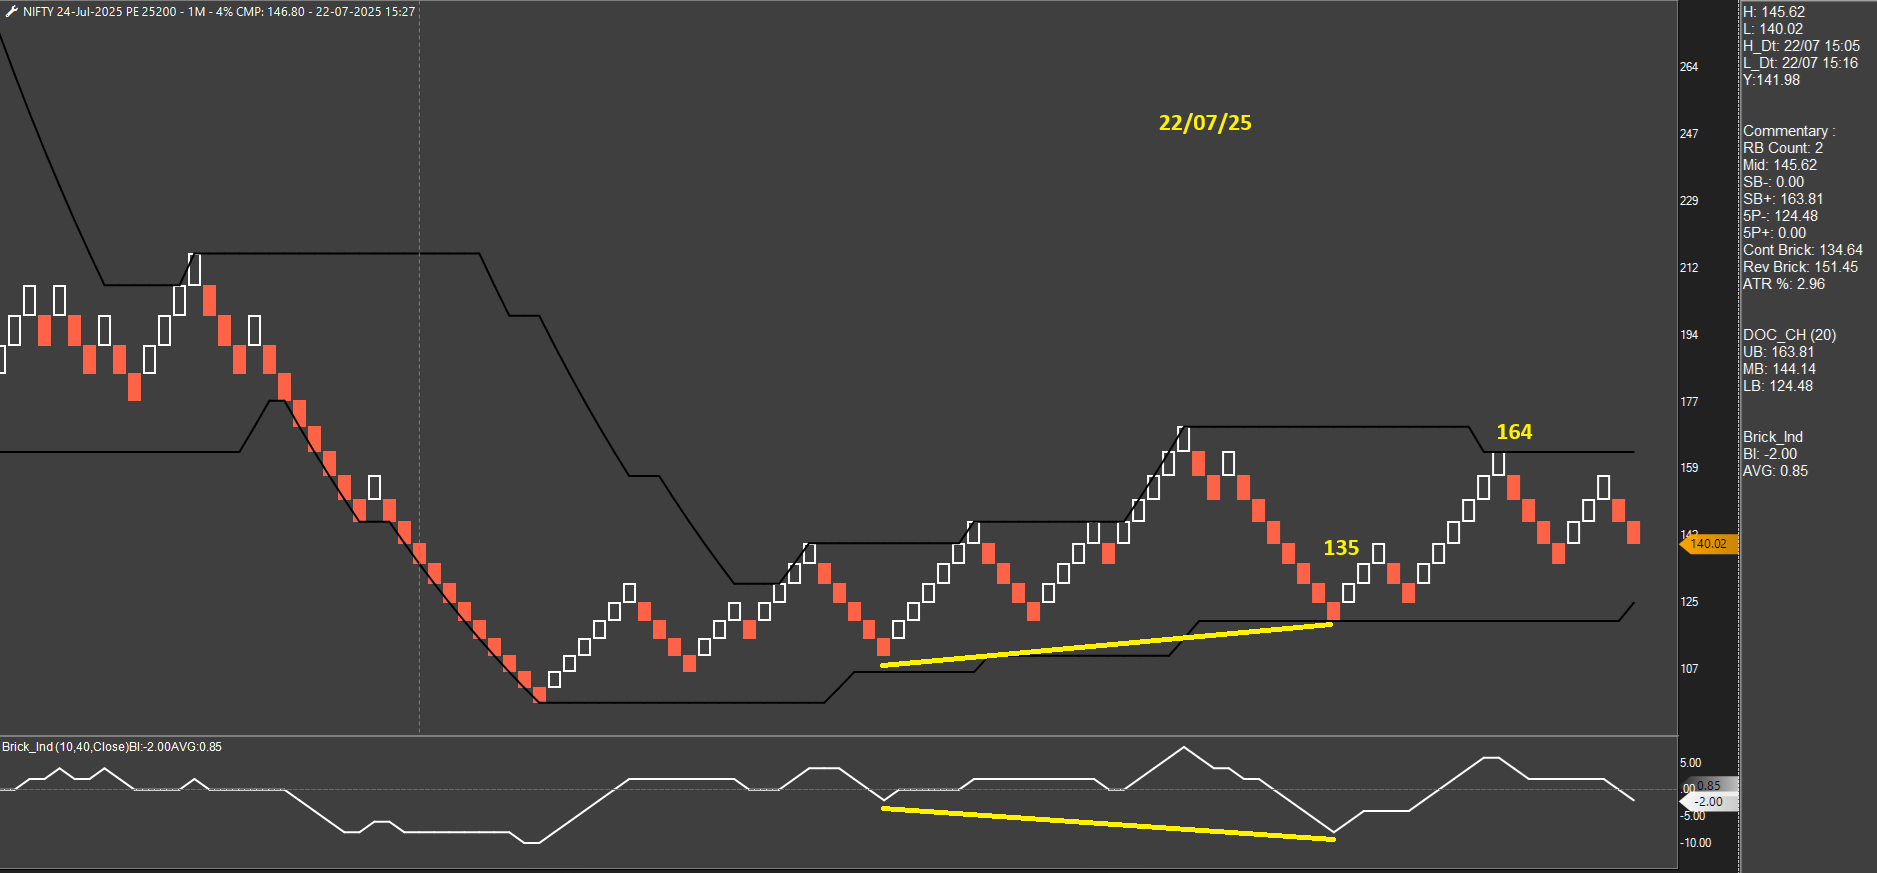
25250 PE
-
25000 CE - 1 hit and 1 BE. Difficult times for long options - very low IVs, grinding moves. But system has to be followed cause tides can change without advance notice.
-
Good start to the week.
-
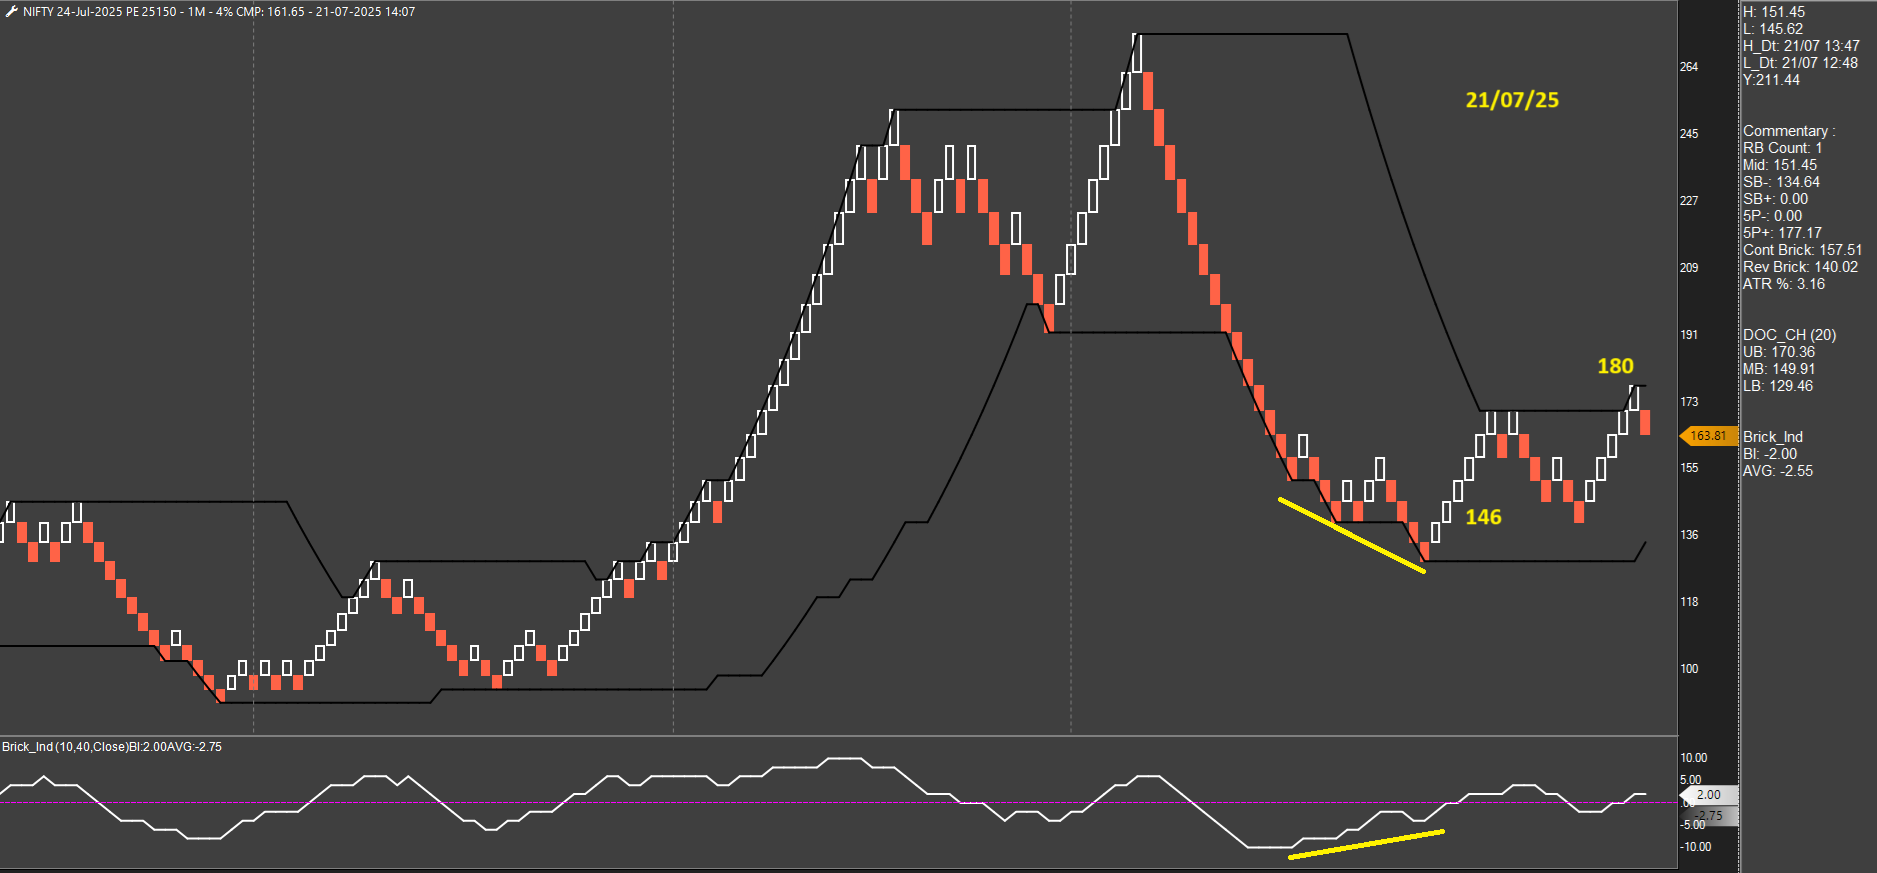
25150 PE
-
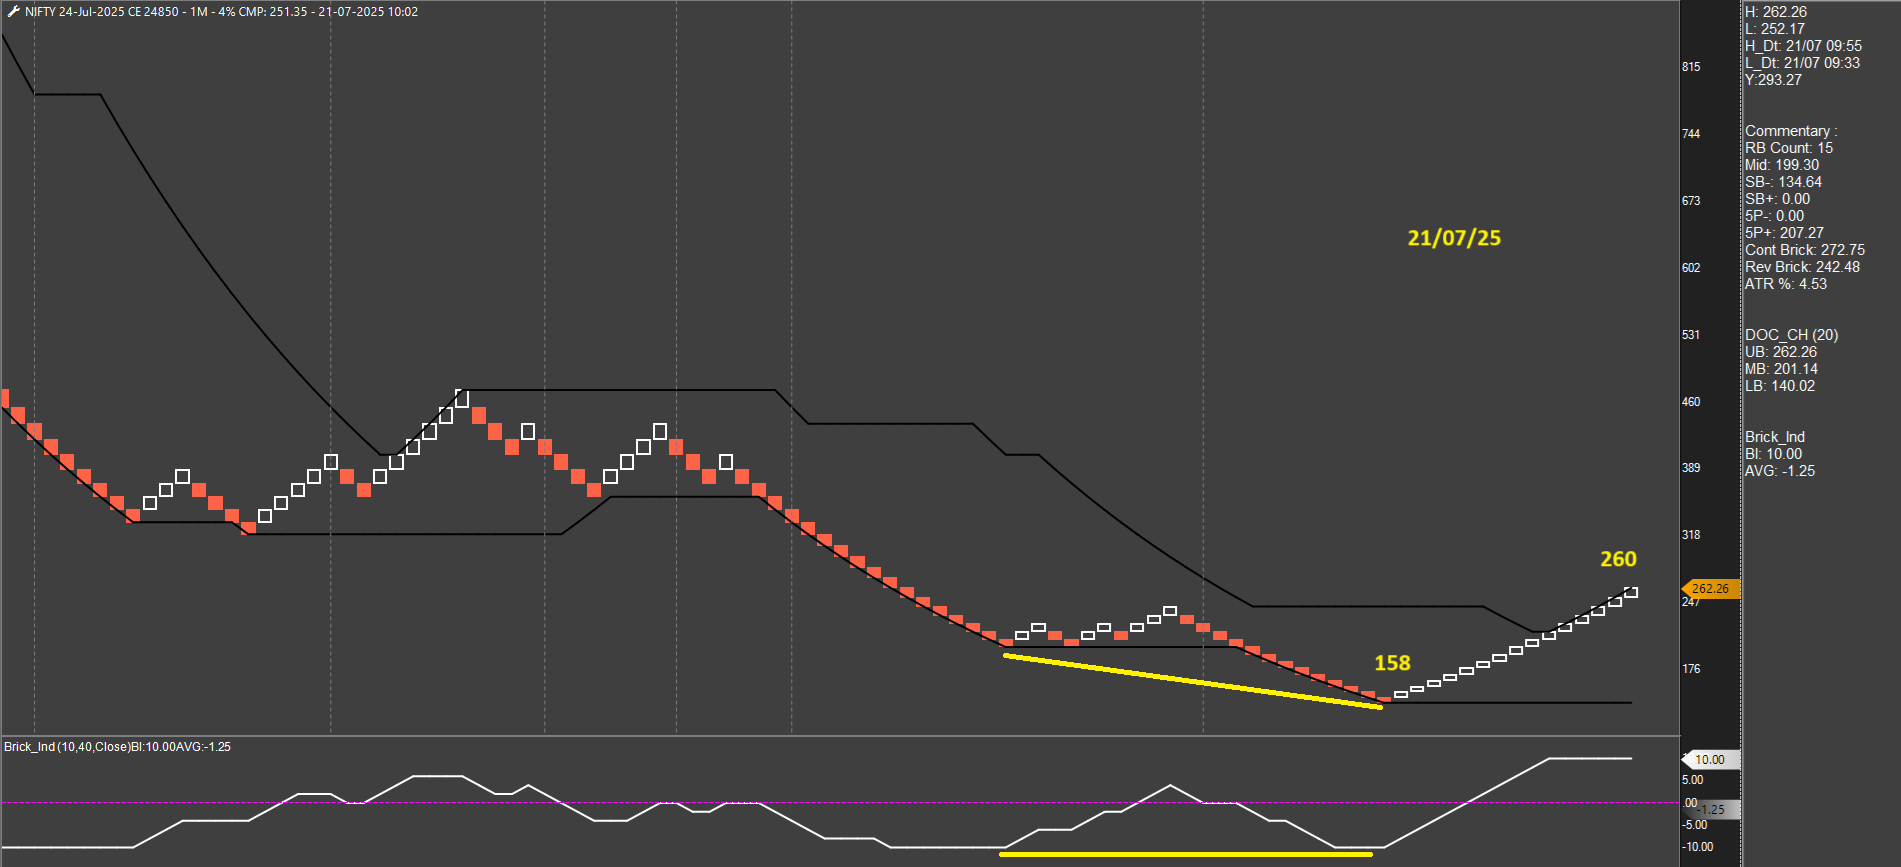
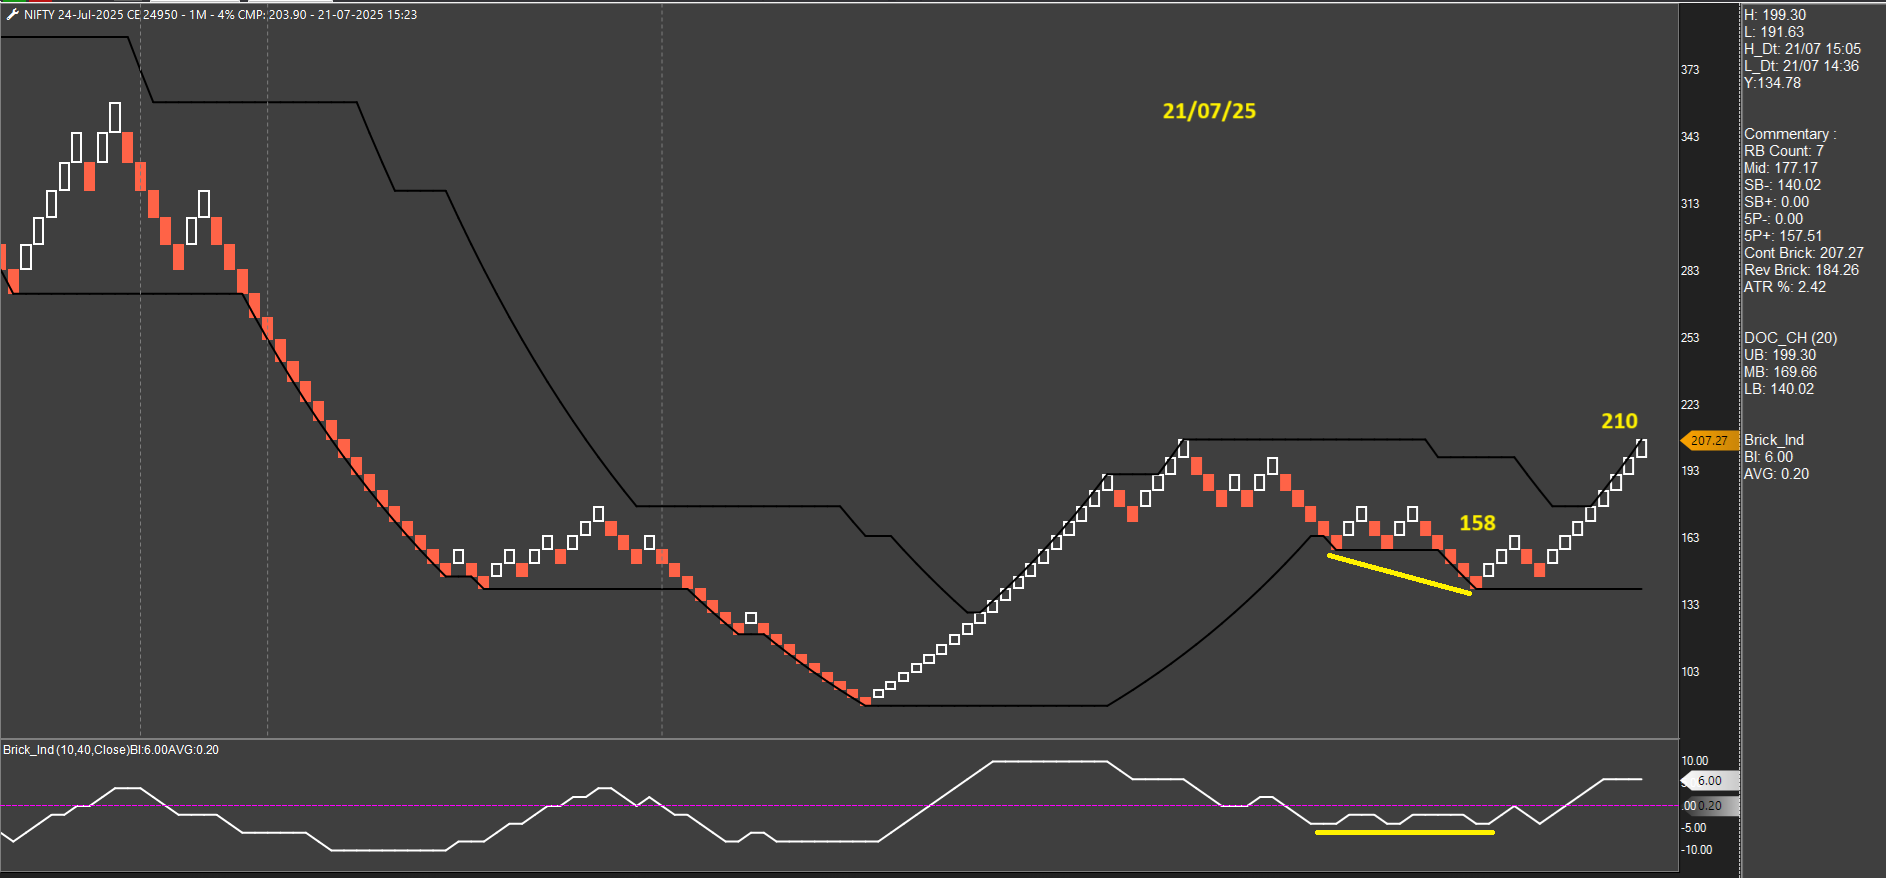
24950 CE. Excellent day.
-
-
Some observations after the suggestion received from @Ravi Shinde to follow the spot chart for divergences and taking trade on options.
-
At times, underlying generates a signal but no signal on options chart. In a way that saves from a probable false move but on the other hand creates psyche issues such as FOMO and disbelief in the system for those few minutes.
-
It happens that after a trade is initiated, underlying does not give an exit but options do. Especially, during low IV environments. Psyche issues again.
-
At times, reading divergence on the underlying becomes difficult/confusing. The small box size on the underlying creates a lot of troughs and peaks on the indicator and it keeps you guessing.
-
Overall, the level of difficulty increases when taking signal from one instrument and trading another. I find it much easier to look at one chart and take whatever signals it gives. Also easier to take care of any chinks in the armor during post-market analysis such as backtesting, exercises to improve R:R, evaluating patterns etc.
It was a good exercise. Thanks, Ravi.
-
-
The choppiest day for the system even though the underlying price action doesn't tell as much. 6 trades in total. Most of the time, both CE and PE trades were running together. Interestingly, only a small negative day. PEs took care of the CEs.
-
Learning of the week: In extreme low IV environments, switch to next week expiry as soon as you notice that you are getting battered by theta more than the price action. Saves a lot of pain.
-
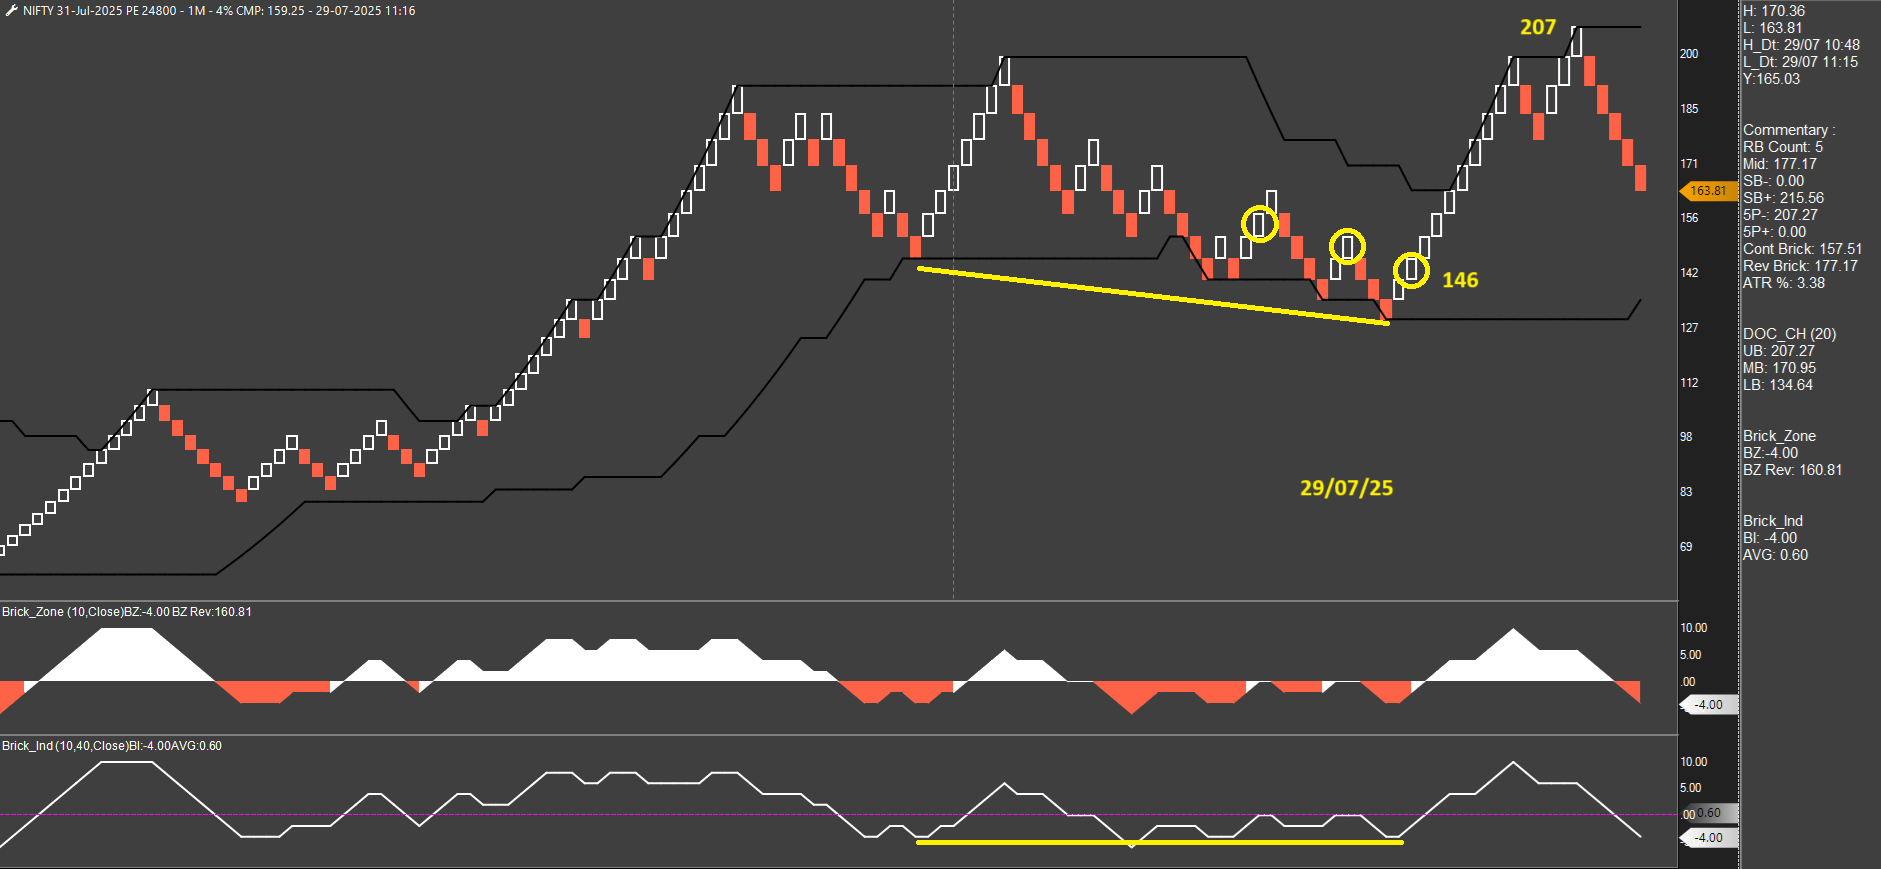
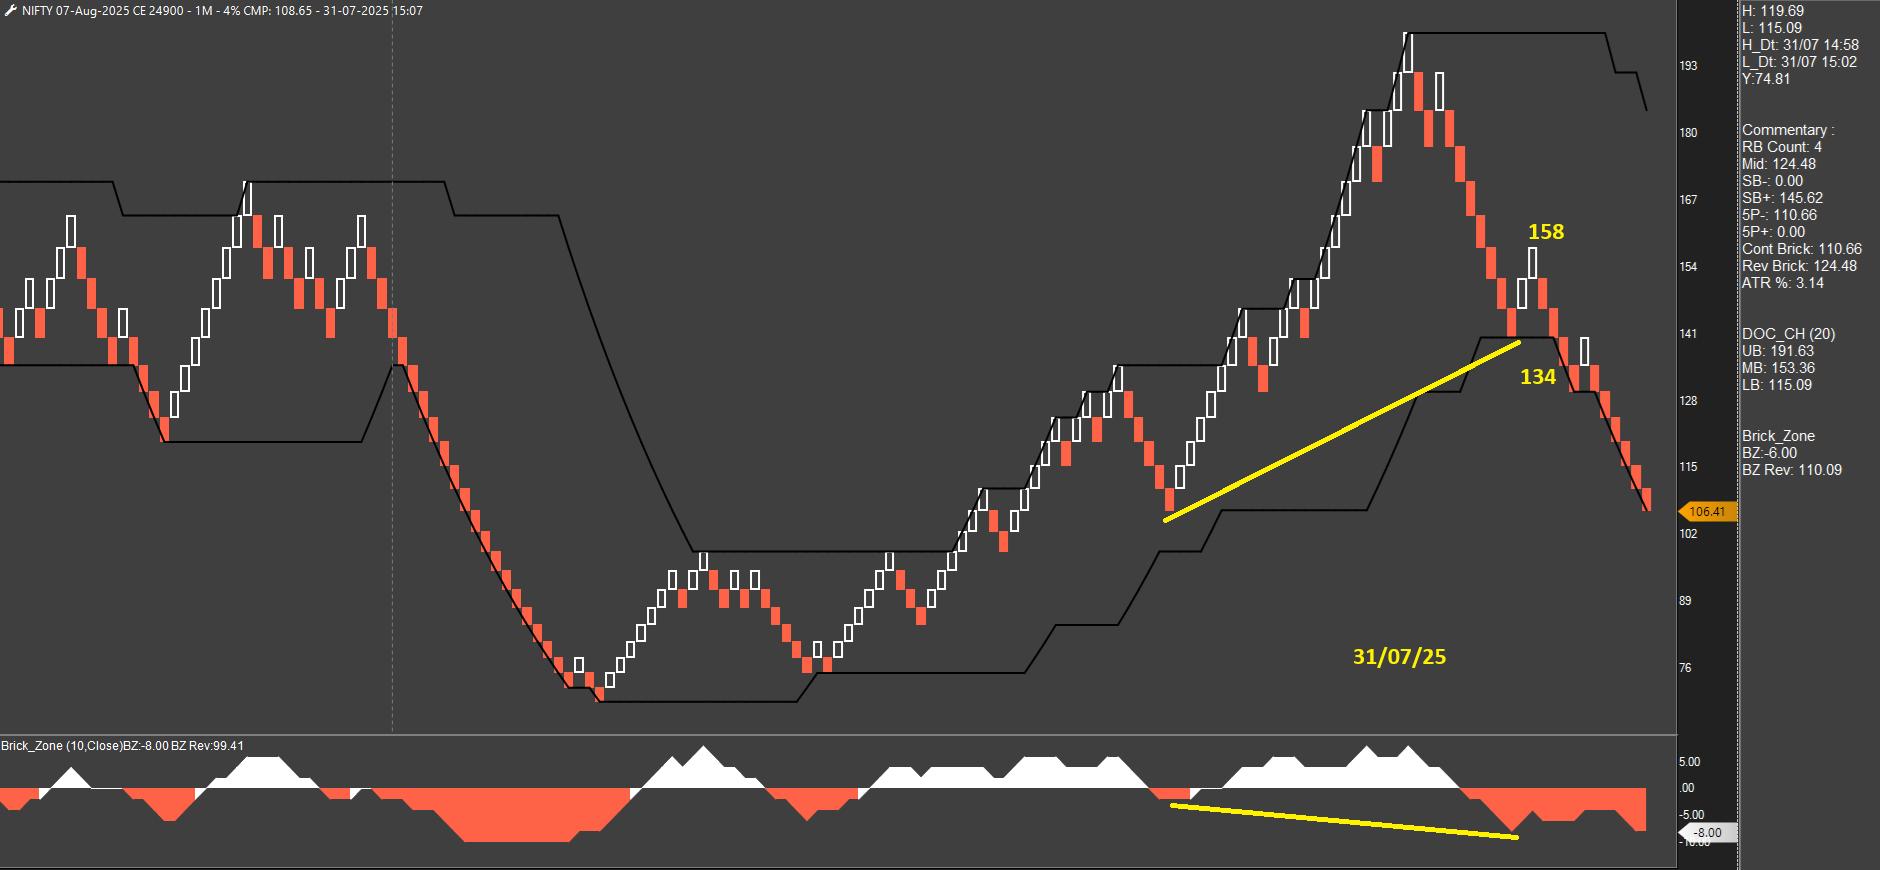
31-Jul expiry - 2 trades for the day
-
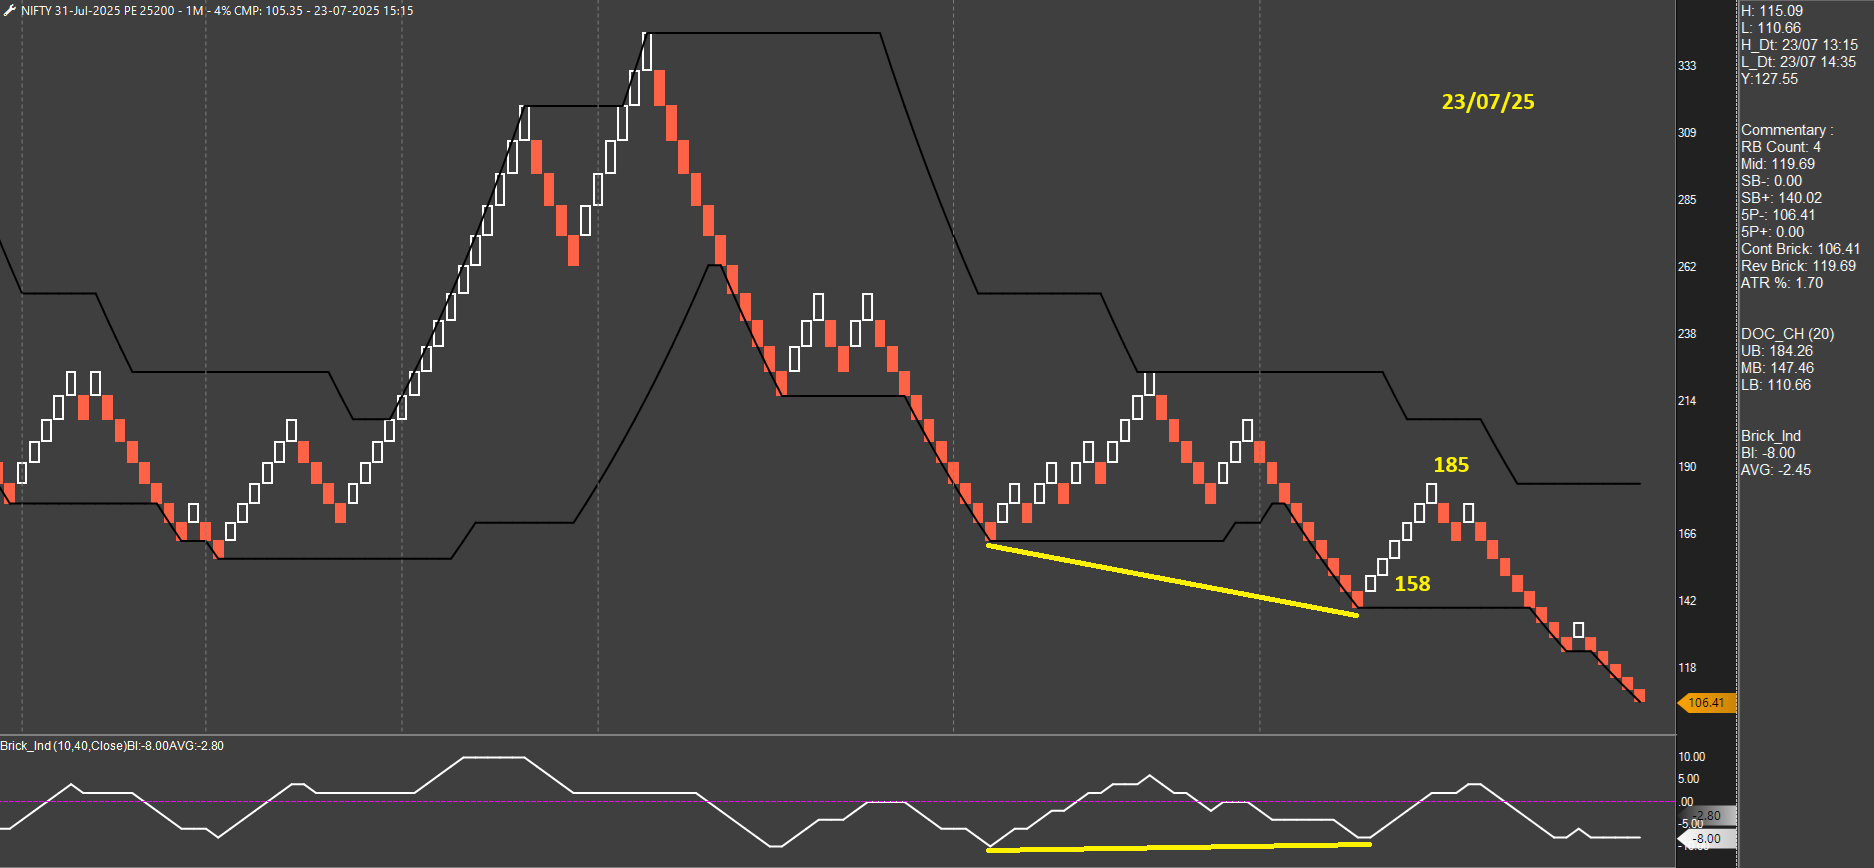
Blockbuster - 25300 PE

-
Sir loss or profit is secondary thing, your discipline to trade and post regular is commendable. Keep posting, such live trade example gives confidence and make easy to understand the concept.
-
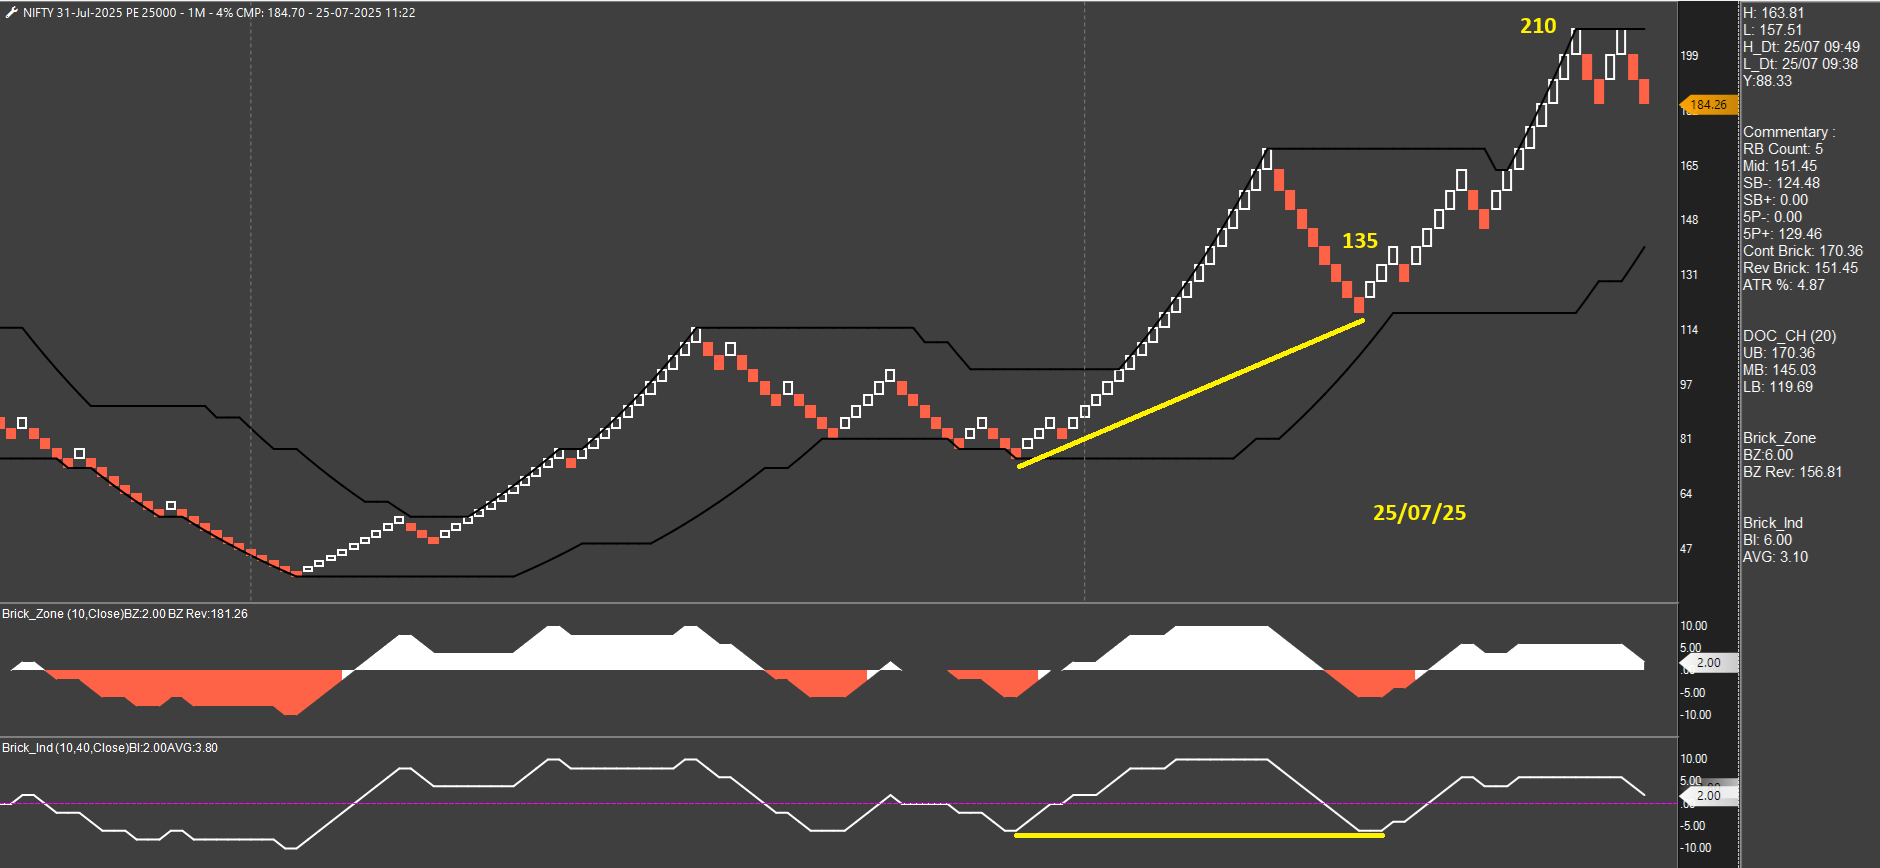
24900 CE - first attempt at reversal; exit with minor loss
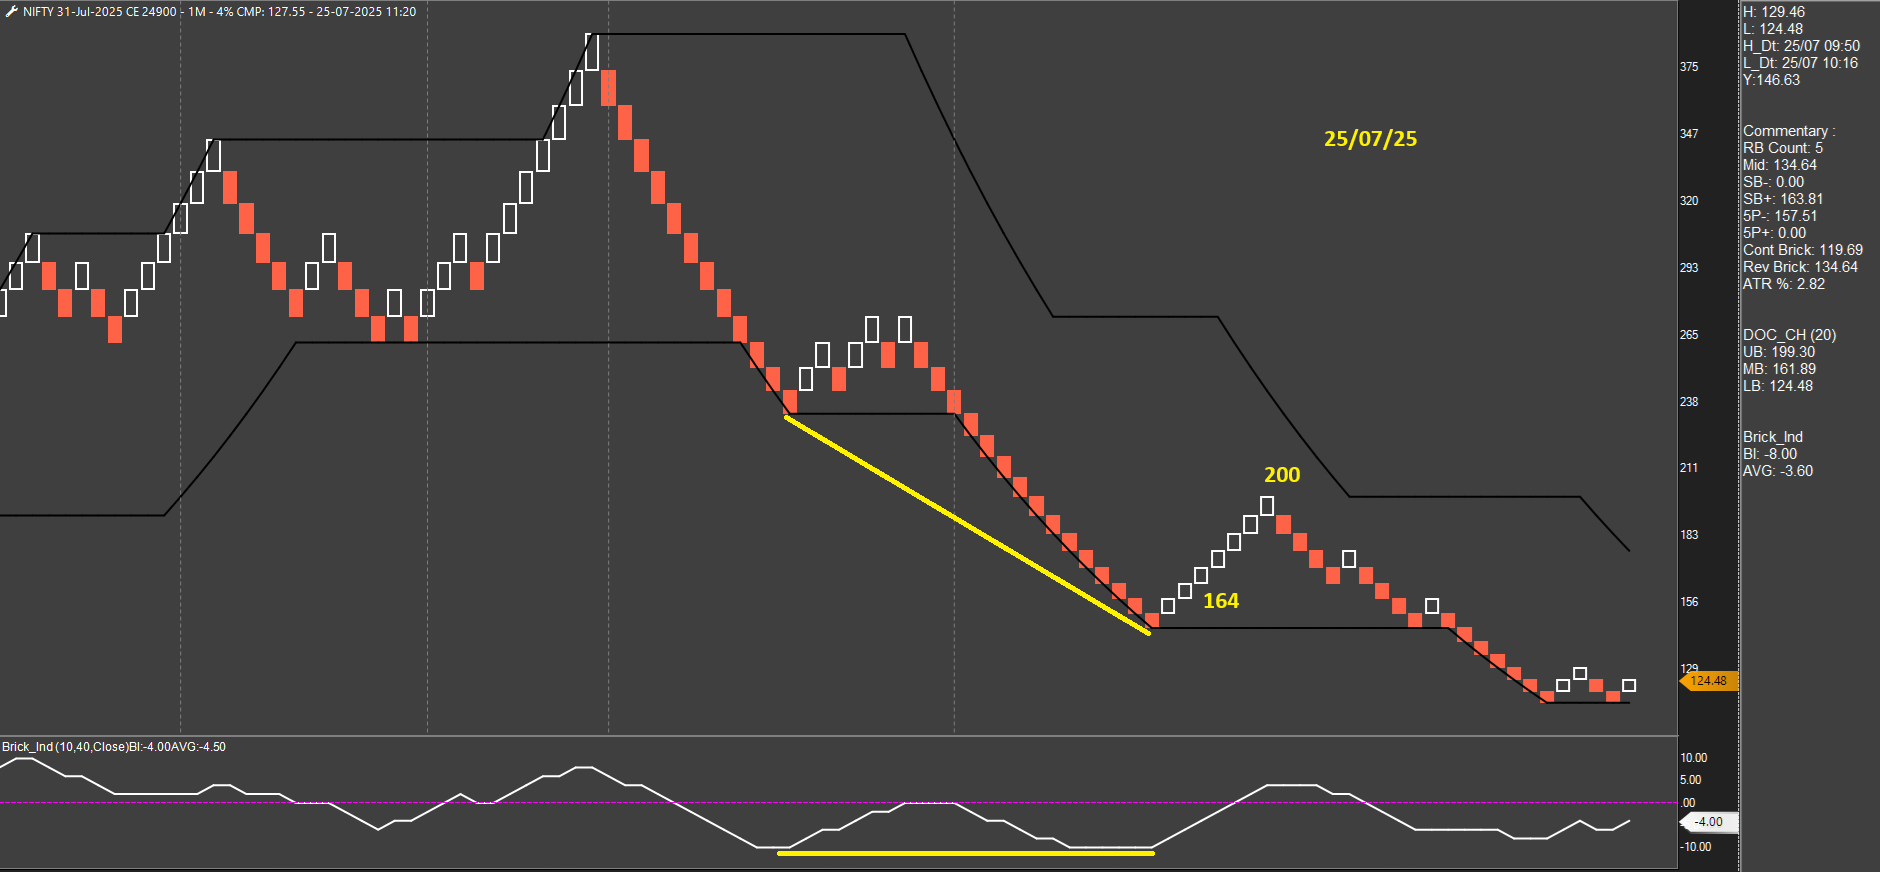
25000 PE - classic hidden divergence in the direction of the strong trend
-
24850 CE - another failed attempt at reversal
-
2 more hits on the CE. No rise in PEs so all credit to theta decay. Overall, another superb week. 3 more trading days to go for completing a full month of executing this system. Will post the full statistics on 30-Jul.
-
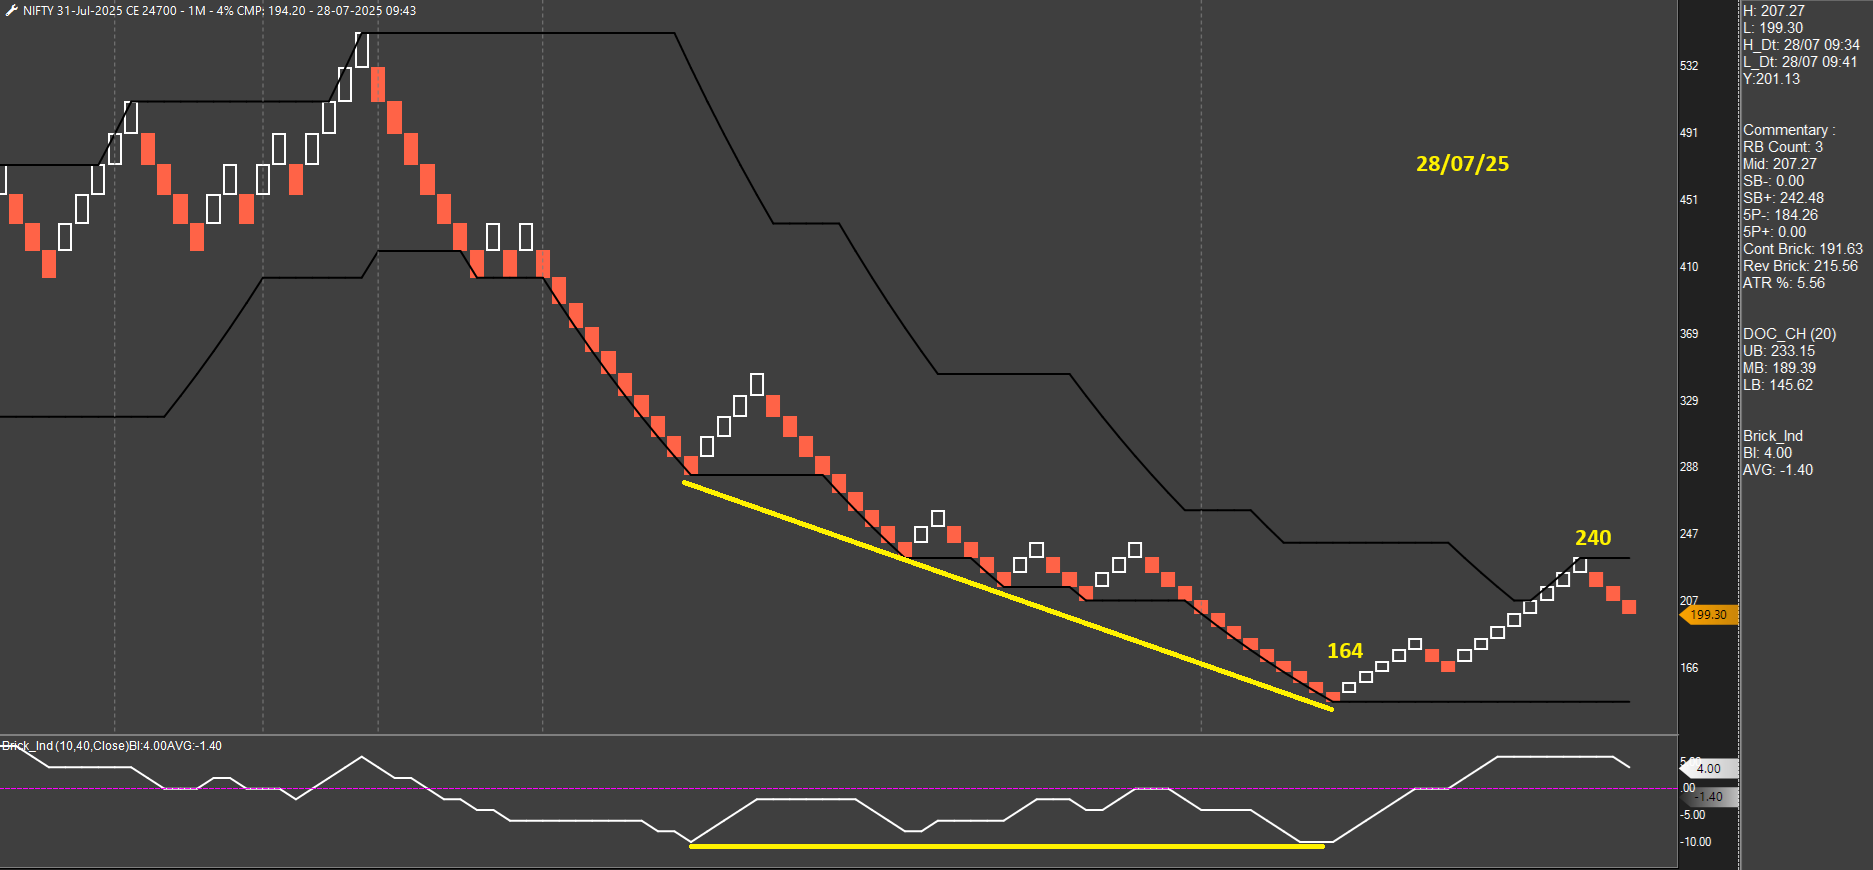
24700 CE
-
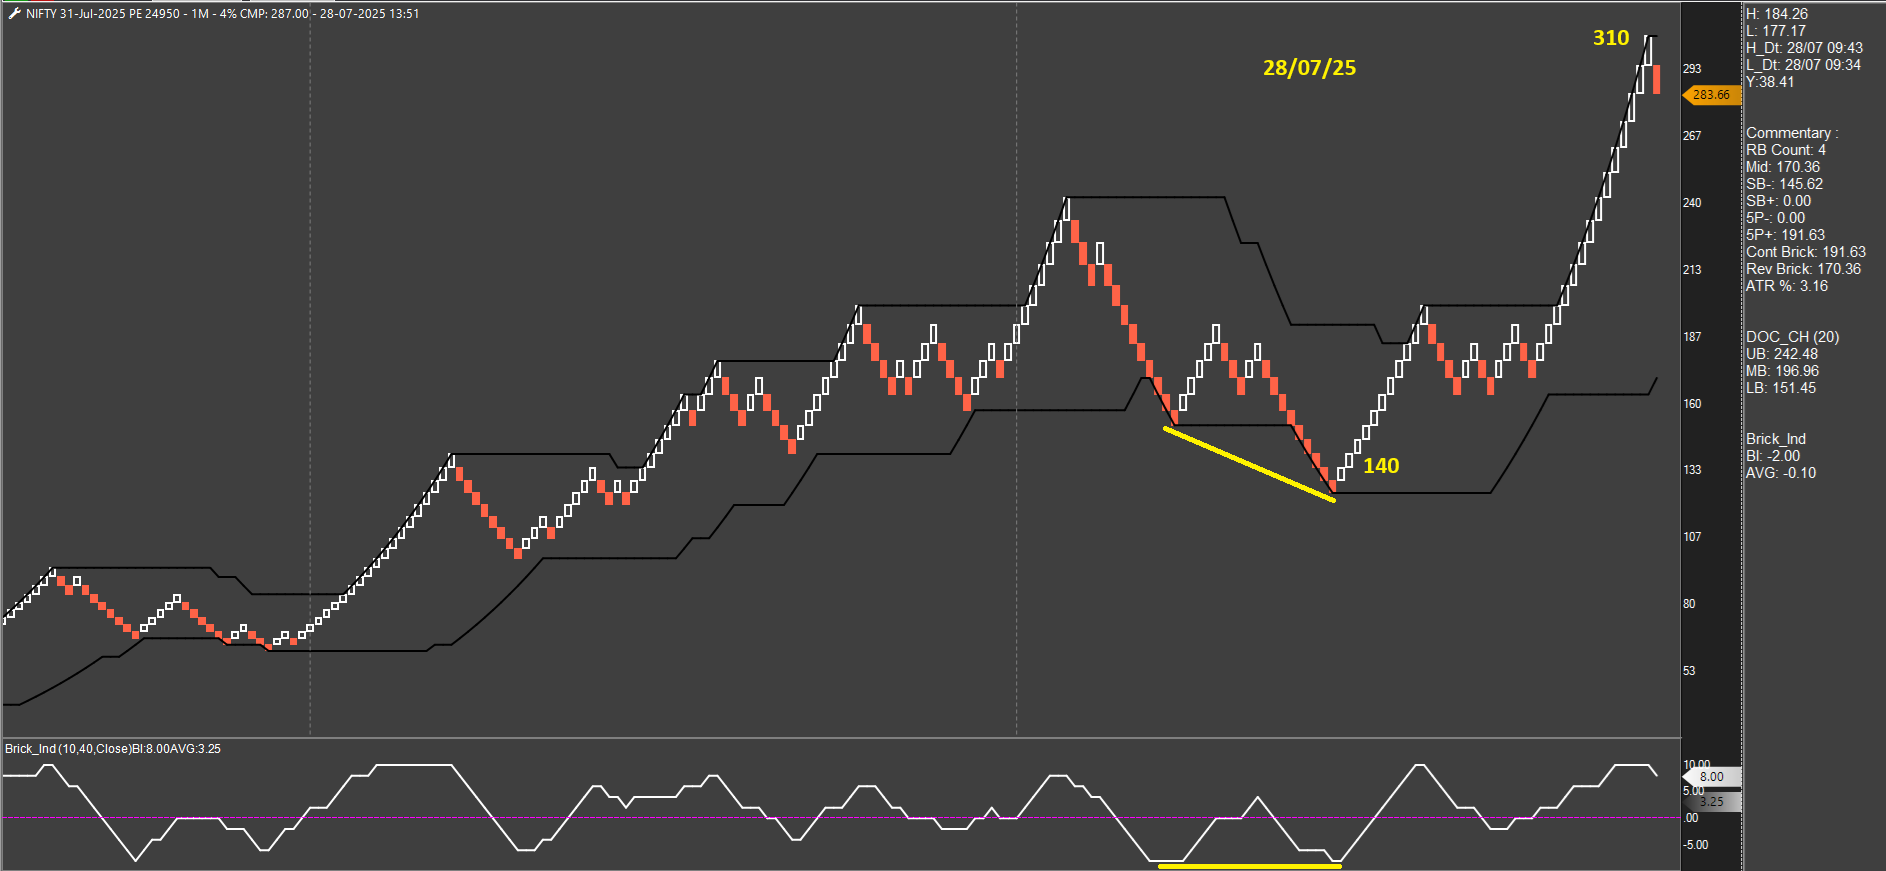
24950 PE - mammoth trade! IVs have risen.
-
2 more trades and that's it. Super day

-
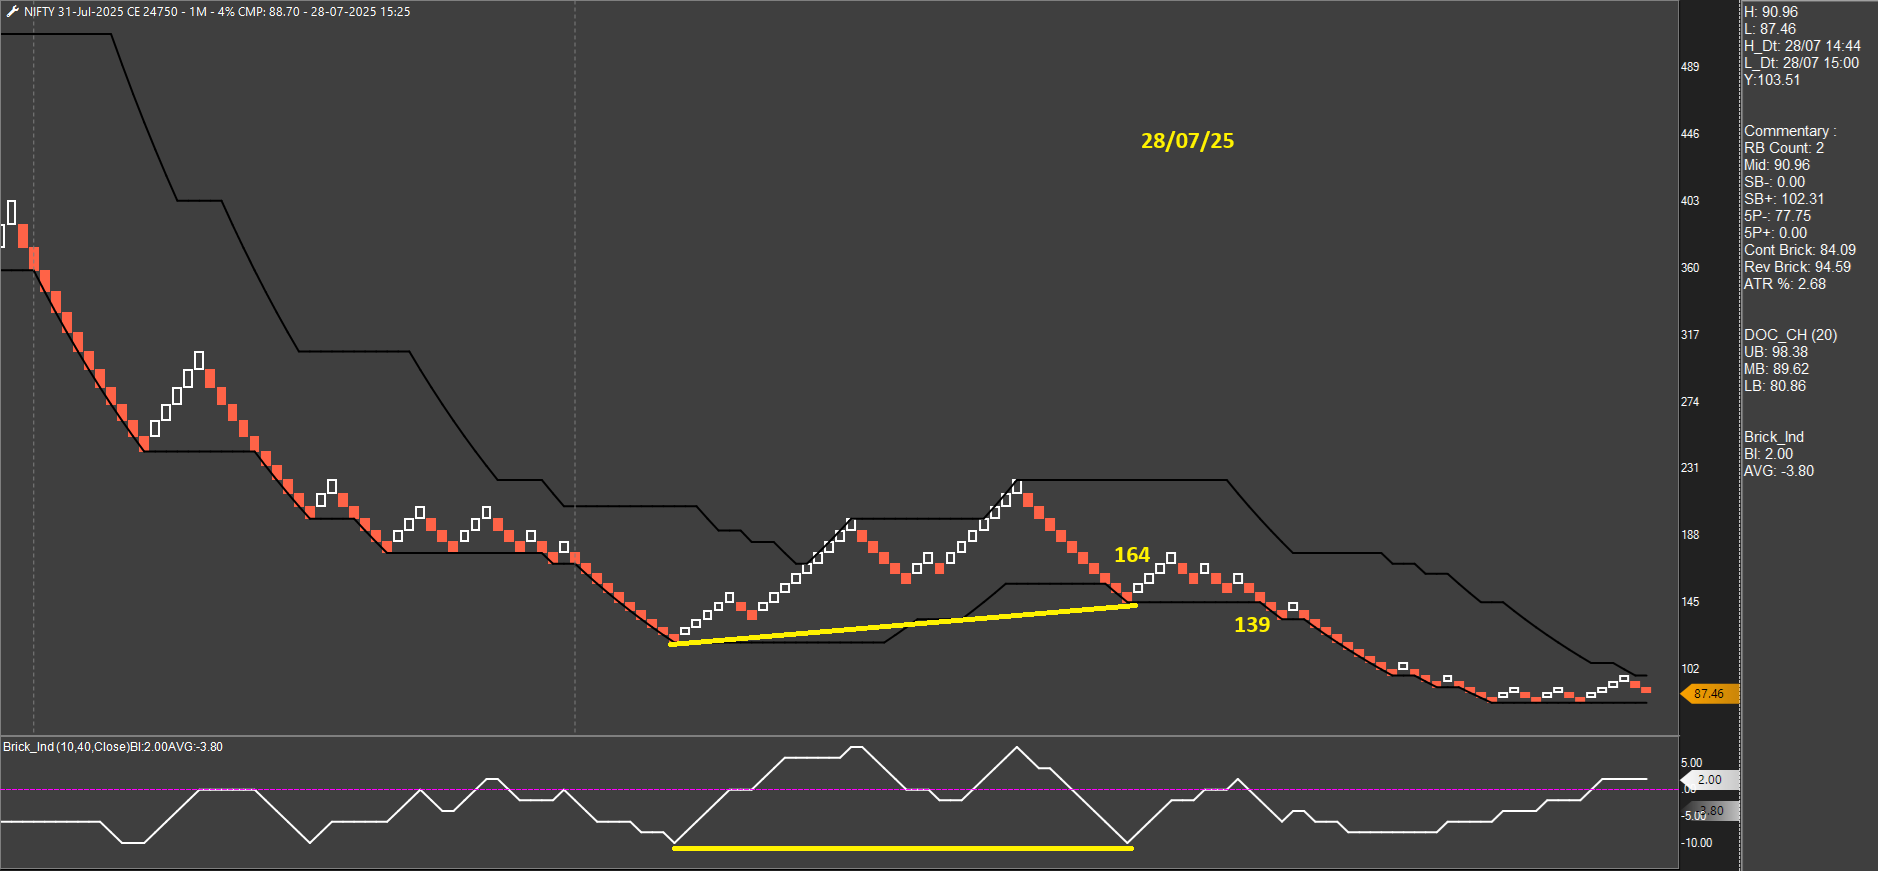
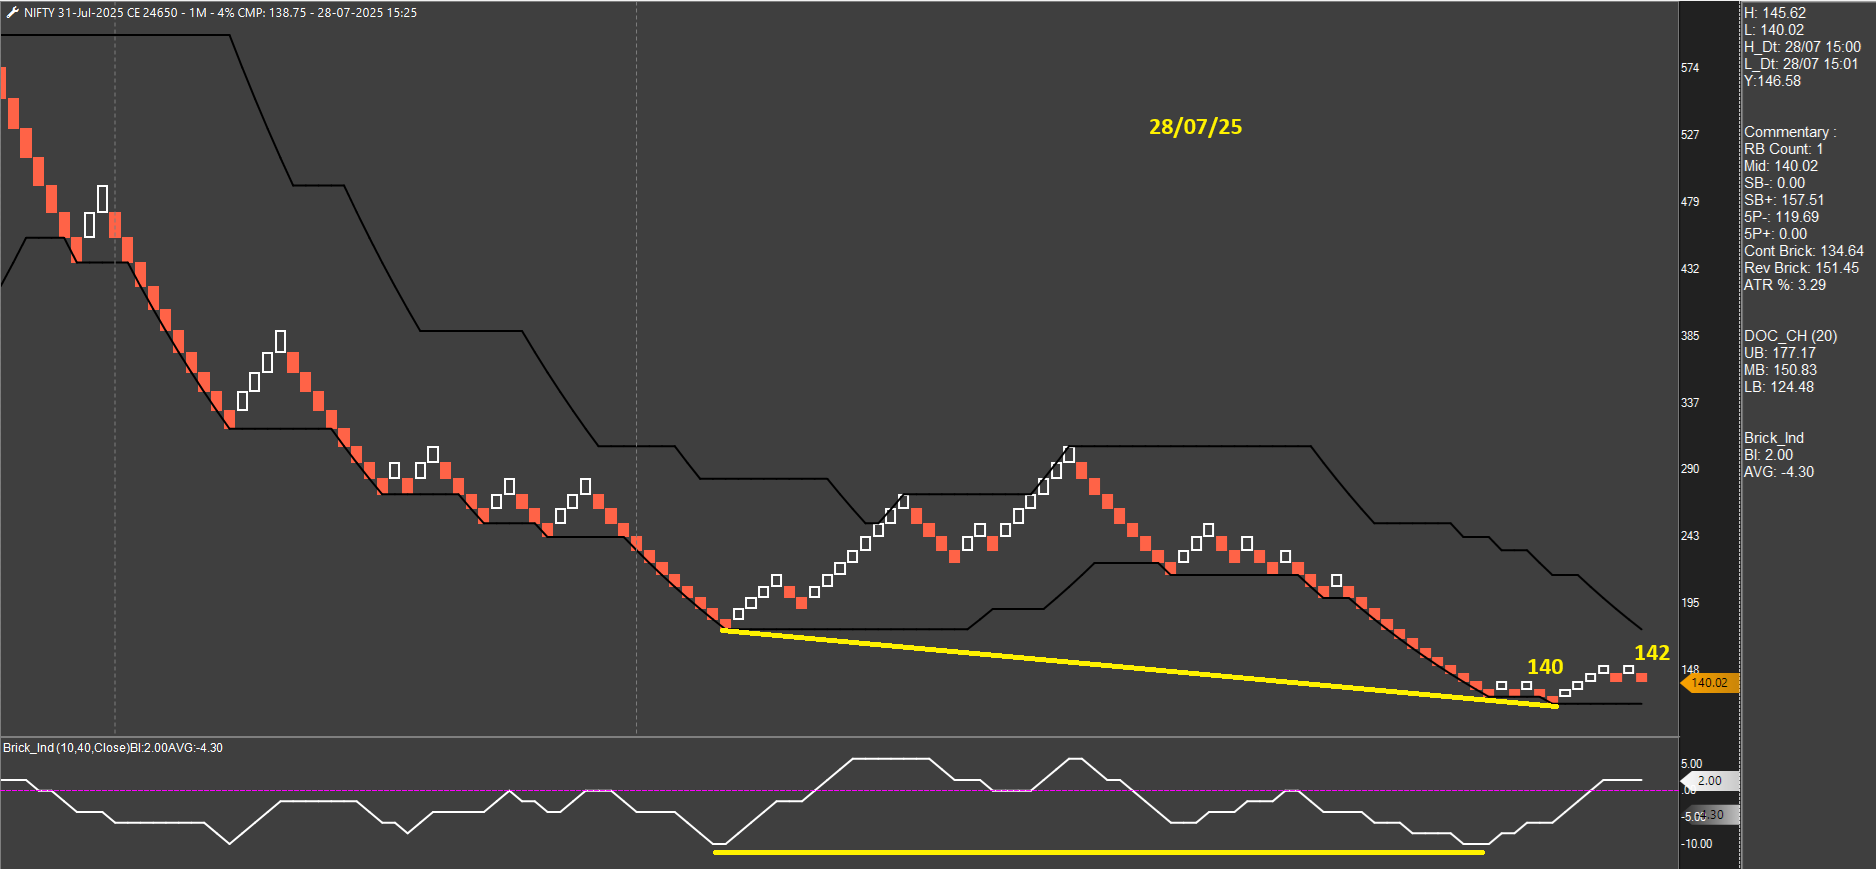
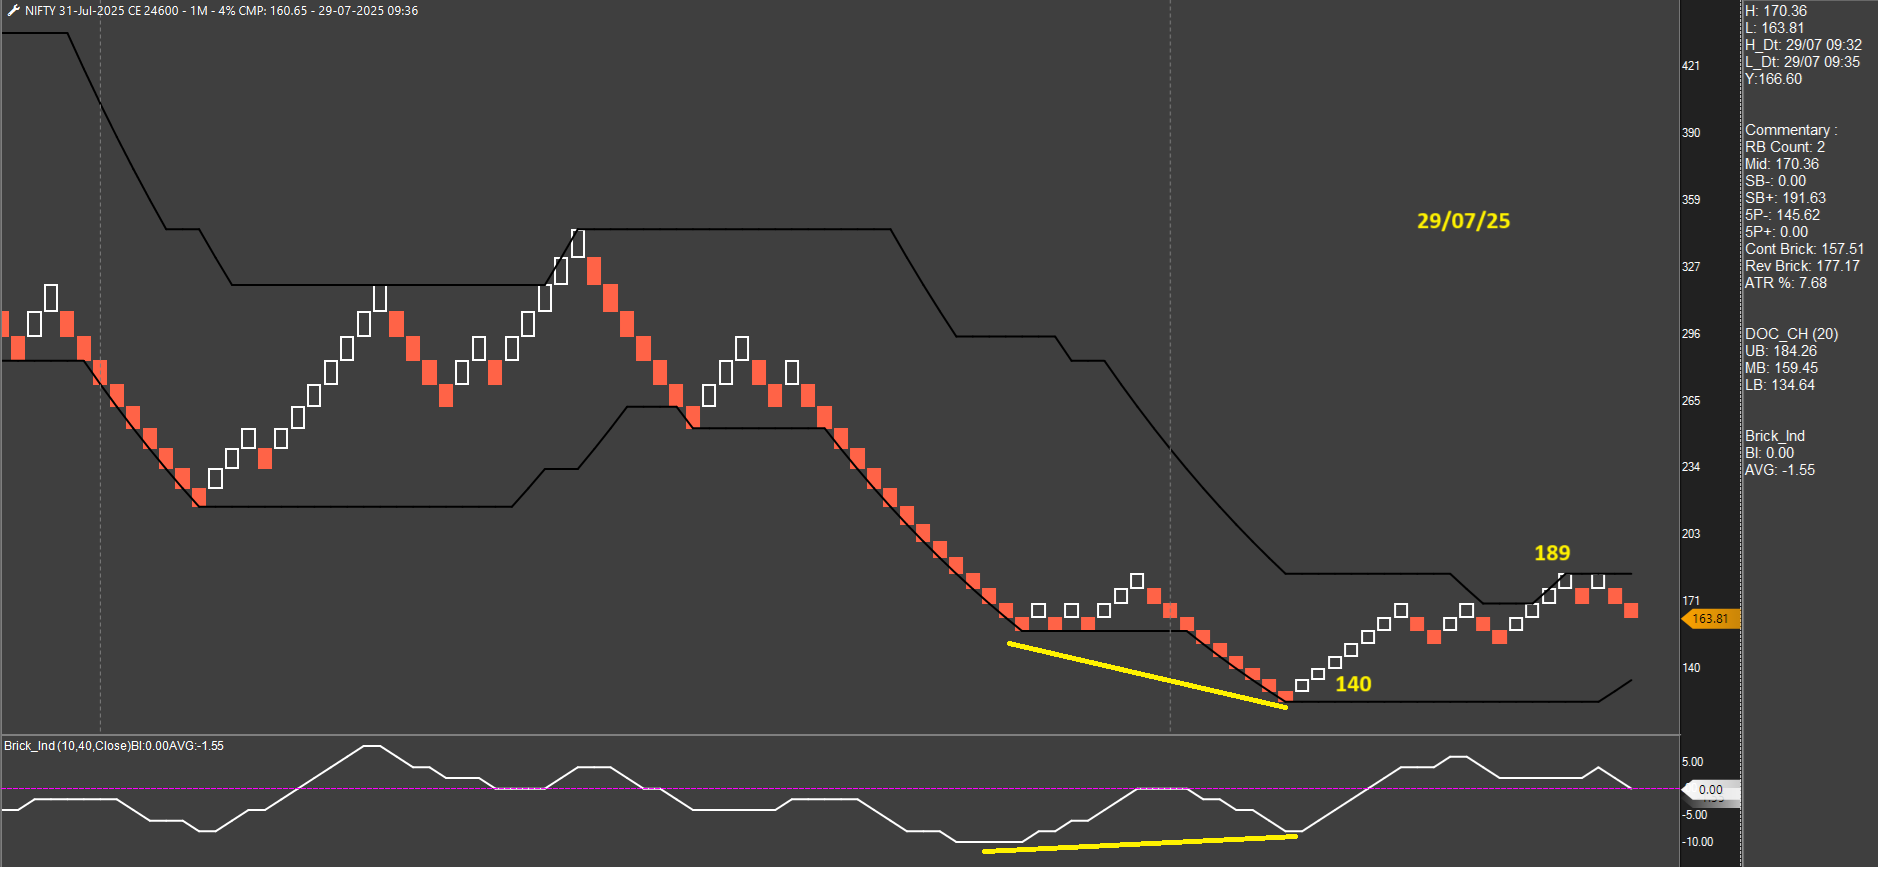
24600 CE
-
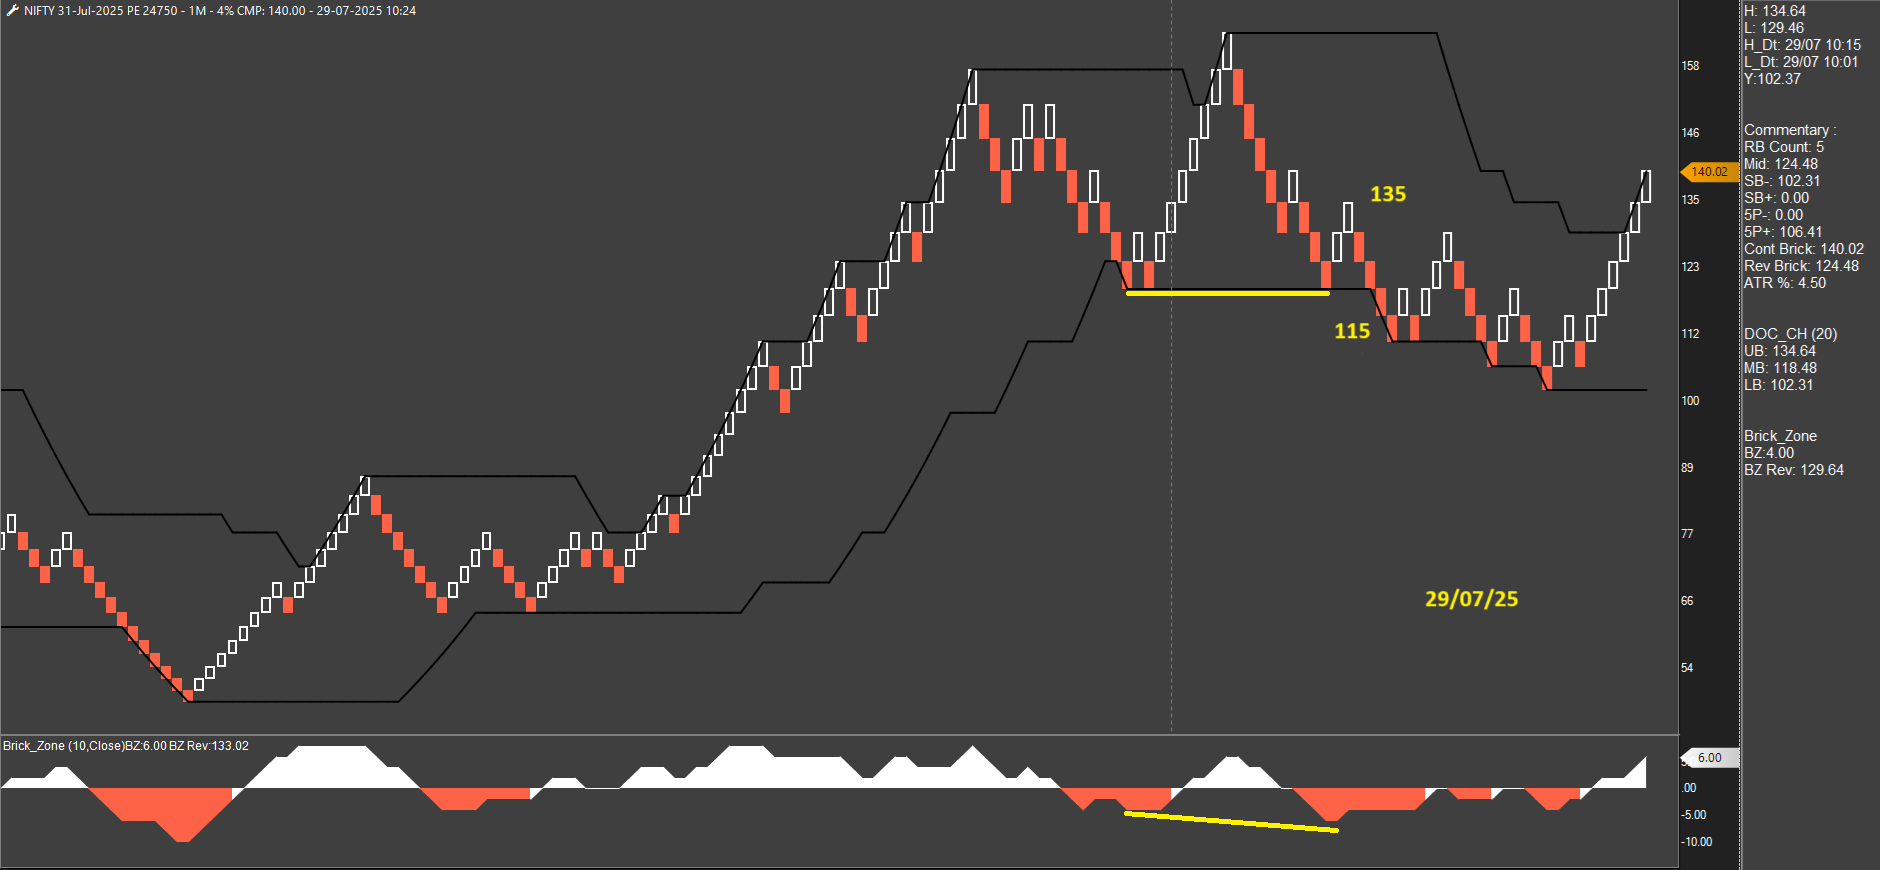
Bears trying to push further today but hard resistance from the bulls. 4 trades already for PE - 3 hits and 1 gain.
-
2 more trades and done for the day. Lot of trades today, but totally worth it.
-
Switched to next week (07-Aug) options after having a large no. of trades yesterday. Current week options are more volatile than expected. 2 losses today.
-
24750 CE

-
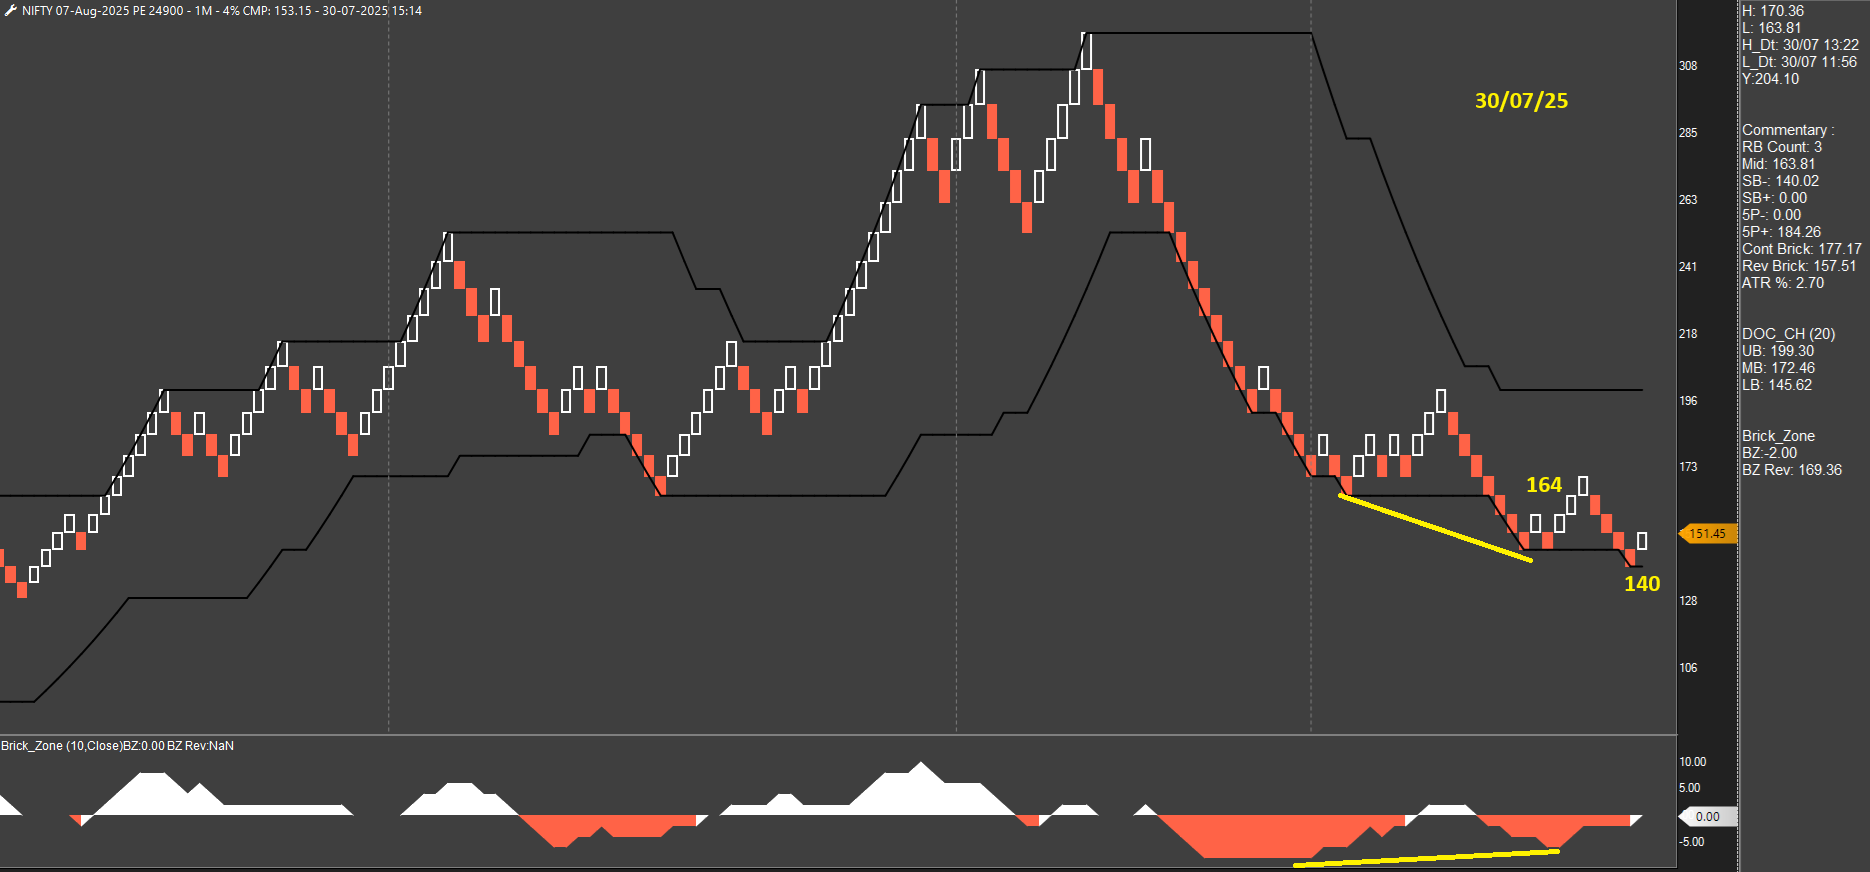
3 more trades and that's the end of the day, and the month.


-
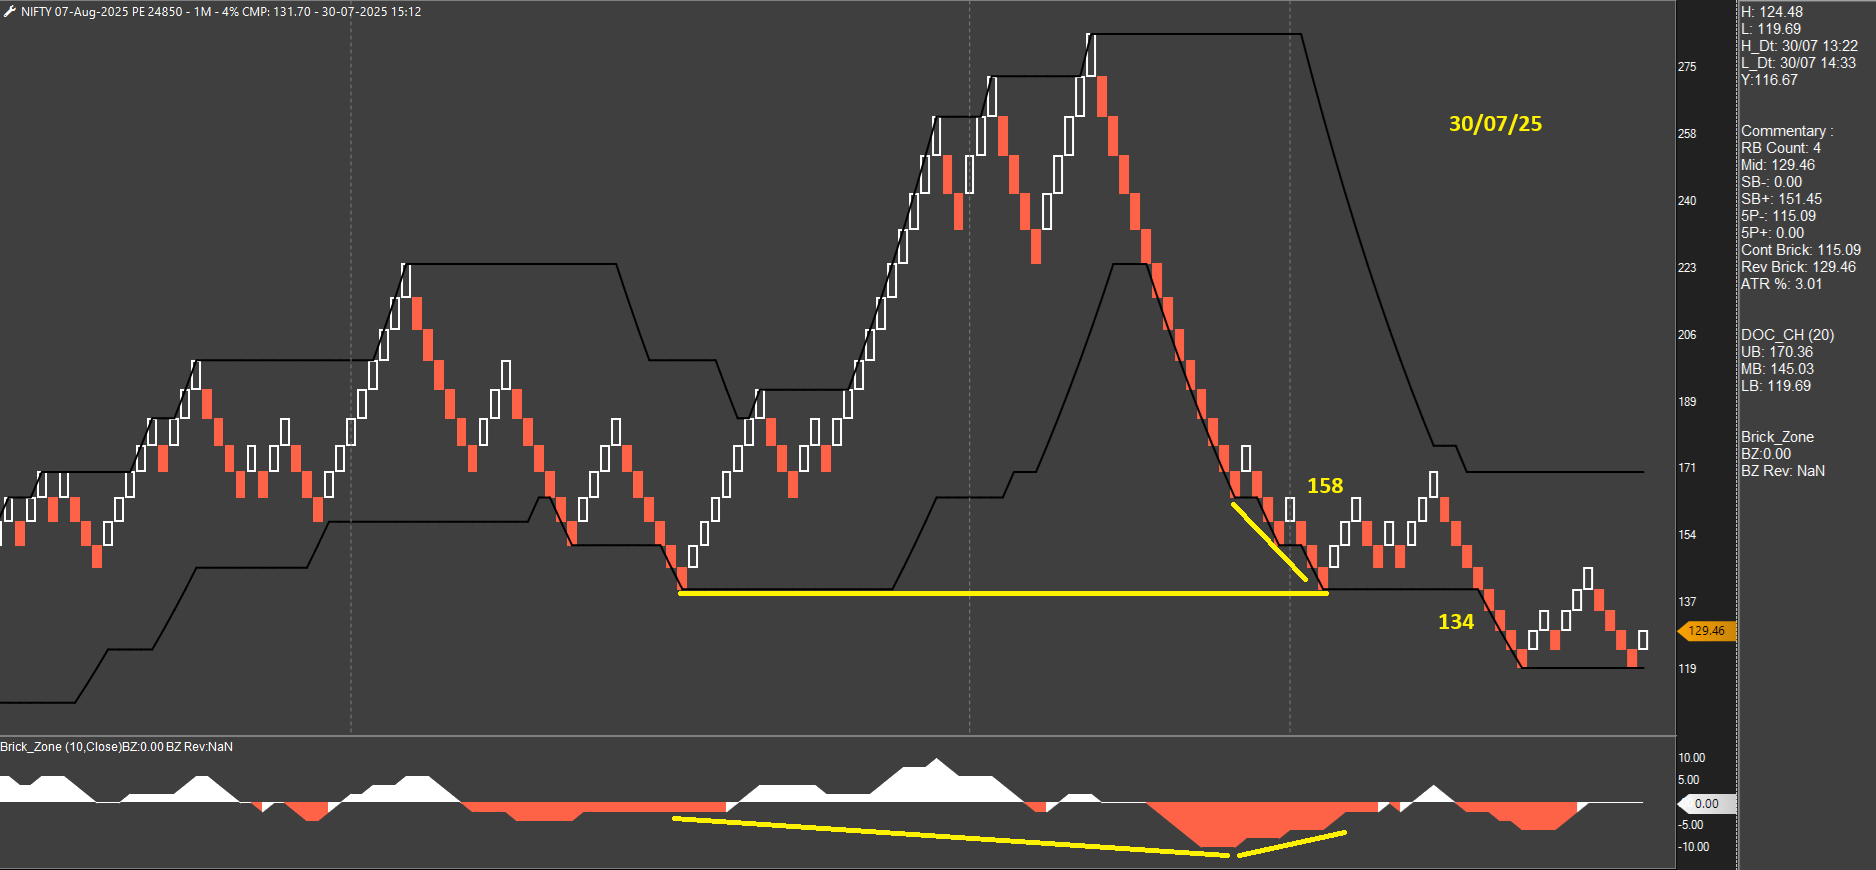
Sir one question, trade you shared today noon, 24750 call and brick zone both made low, so how is it divergence?
If you are considering low of 28 , then how many old days data we can use, as 28 low was broken very next day.
3rd question, brick zone can go maximum at 10 number so if new price low done and brick zone have not bcoZ of max 10 limit. Is it logical to call it divergence?
-
@Ajay Chaudhary, valid questions and glad someone is asking. I will answer all 3 Q together, as they are connected.
I will admit that spotting divergence in this system is not 100% objective. If you see my first post under this topic, I have mentioned under observations that it can be subjective at times but can be made easy with regular practice. Now, BI is an oscillator like RSI, MACD, Stoch etc. Oscillators are range-bound, and their value is calculated based on a ratio of gains to losses. BI cannot go beyond -10 as that's the limit we have set. When it is -10, it means price is strongly bearish and we make a presumption that the probability of a short-term pullback or reversal is high. This probability keeps increasing as BI keeps repeatedly going to -10 in an ongoing downtrend. You can call it mean reversion, sellers' exhaustion etc.
In my observation, any troughs made during previous 3-4 sessions can be good to use for marking divergence. In case of 24750 CE today, I agree that it wasn't textbook/objective divergence but more in line with the inherent concept of trend reversal and/or oversold conditions. Also, I quickly saw at market open that although Calls made a lower low compared to 29/07, Puts did not make a higher high. It supported the sellers' exhaustion theory. But all that is not part of the system's everyday decision-making process so let's keep that out of the discussion. I hope this makes sense. I have noted a number of observations about this system based on my experience trading it so far. Will post all of that shortly.
-
 Final update on this system - all rules, nuances, and my observations after trading for a month.
 Instrument and Charting Method: Nifty weekly options; Renko 4% High-Low, 1-min
Indicators: Brick Indicator (10) or Brick Zone (10), Donchian Channel (20)
Capital deployed: 2 lacs per lot Rules:
• Entry: Look for a positive divergence on the Brick Indicator when it goes to -4 or below. Enter on a bounce of 2 bricks from/near the DC LB.
• SL: 3 brick-back
• Trail/Exit: Two ways to handle this,- Book half at 1:1. For the rest, move SL to entry and trail until a negative divergence appears between price and Brick Indicator OR exit at 3:20 pm, if none of that happens.
- No partial booking. Exit fully once a negative divergence appears between price and Brick Indicator. If that doesn’t happen, exit at 3:20 pm.
Important notes on Trail/Exit:
- The first method is only a ‘feel good / play safe’ approach. The aim of this system is to follow the intraday trend. Exiting half when the trend has just started is not good for pure trend-following traders. Moreover, the second method generates much better returns with exactly the same amount of DD (based on results so far).
- The most important part of this system, as for any system, is the exit. I have been following the second method listed above. I will confess that it hasn’t been easy to execute it properly each and every time. There are times when I face difficulty in identifying negative divergence due to the highly dynamic nature of brick count formation. While the trade is on, one has to be alert about how the next brick (red/green) that will affect the brick count and it’s hard to be accurate all the time. Hence, I’m working to find a more objective/simpler method for exits.
Statistics: These stats are for 2 lots. Chart for each of the 62 trades is posted under this topic. I'm aware that the results are outrageous and should be treated very cautiously since it's only a month of data. I can assure that I have taken almost all the trades and will admit that my execution accuracy was quite poor in the beginning, probably 40-50%. It is still not great but has improved to around 75% after a month and should get better from hereon. Bringing more objectivity to rules will also help.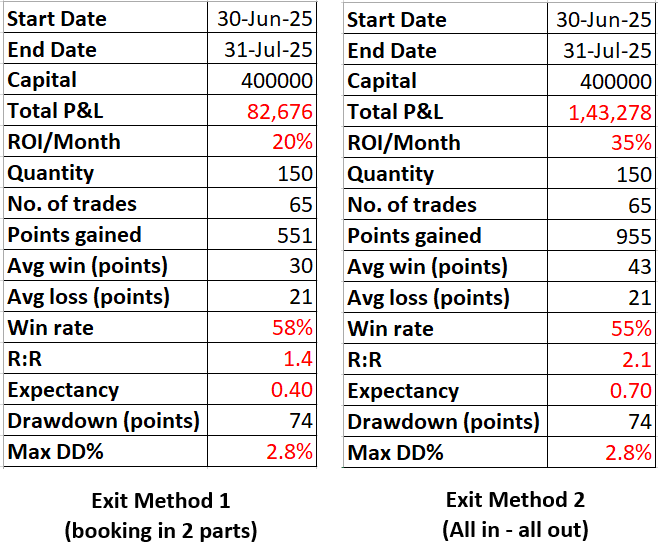 Observations:
- DC: The lower band’s main purpose is to highlight support. If the same level is found acting as support in any of the previous few sessions, even better; although not necessary.
- BI Values: A divergence happening when the Brick Indicator value is at least -4 or less (-6, -8, -10) is good. Any higher values (-2, 0 etc.) generally indicate lower probability of the price catching a trend. The logic is that BI value turning 0 from negative means price is close to equilibrium and an entry from here would have a less than desirable R:R.
- Types of Divergence: Regular and hidden. Regular divergence is where price has made a LL whereas BI has made a HL. These are common. Hidden divergence is where price has made a HL and BI has made a LL. These are fewer, and generally occur in the direction of the main trend. In such cases, price will not be always at/near DC LB; especially when the trend is strong. One has to be alert to pick these and take an entry.
- Scanning for Divergence: Scanning for divergence can appear subjective but regular practice makes it easier to identify. Two observations here:
Since BI value is set to 10, it won’t go beyond -10 on the scale. It will often happen that price will keep making a lower low and BI will keep going to -10 (can’t go any lower). Treat this as divergence. In other words, the probability of reversal keeps increasing every time BI goes to -10. Then, all one needs to do is look out for a 2-brick bounce from a support level/DC LB.
For regular divergence, troughs can be compared across 3-4 sessions (especially when BI has reached -10). However, for hidden divergence one should not look back more than 1 session for troughs. Reason being, most hidden divergences appear in strong trends which are short-lived from the intraday POV. - Chart Type: High-Low charts are recommended for Intraday as prices move fast and entry/SL orders can be entered accurately, in advance.
- Expiry Selection: Avoid trading current expiry on the expiry day as options become volatile and chances of hitting SL increases, especially when trading HL. Switch to next week expiry on the current expiry day.
- IV Regimes: In very low IV environments, switch to the next week expiry a day before the current expiry. Theta decay will affect the trades more during low IVs as volatility dies and market lacks strong trends. In such environments, number of trades as well as chances of hitting SLs increases. Switching to the next week expiry can help slightly due to lesser theta impact.
- Strike Selection: The soul of this system is divergence between BI and price. Each option strike has its own price action going on and divergence may not always appear on all strikes. Hence, keep charts of 3 strikes (ATM/ITM/OTM) open for CE and PE each and follow the entry signals. Strikes in the price range of 140 to 180 have worked well in July 2025 when the IVs have been one of the lowest. Need to observe the price range in higher IV environments.
- Multiple Entries: When the market is taking a breather, both CE and PE trades running in parallel is fairly common. In other words, a CE entry can trigger while the PE trade is on and vice versa. This simply signifies that the market is hinting at changing direction but is not fully ready yet. All trade signals should be taken.
 Final note: This system is very much work in progress and has a few subjective elements. My goal is to make it more and more objective while making improvements based on everyday observations. I won’t be posting any further under this topic unless there is any significant new development.
 -
Sir earlier you shared 28 DC, n now DC 20 so it's typo or it's 20 only, changed with this month experience
-
@Ajay Chaudhary, changed to 20 now. Since BI is tracking last 10 bricks, I found it good enough to track the lows of last 20 bricks from intraday POV.