• Recent
  • Categories
  • 0 Unread 0
  • Popular
  • Tags
  • More
    • Guidelines
    • Disclaimer
  • Users
Skins
  • Light
  • Default
  • Cerulean
  • Cosmo
  • Flatly
  • Journal
  • Litera
  • Lumen
  • Lux
  • Materia
  • Minty
  • Morph
  • Pulse
  • Quartz
  • Sandstone
  • Simplex
  • Sketchy
  • Spacelab
  • United
  • Yeti
  • Zephyr
  • Dark
  • Cyborg
  • Darkly
  • Slate
  • Solar
  • Superhero
  • Vapor
Collapse
Definedge Forum Logo

11/07/2025

Scheduled Pinned Locked Moved Knowledge Sharing
1 Posts 1 Posters 69 Views
    • Oldest to Newest
    • Newest to Oldest
    • Most Votes
Reply
  • Reply as topic
Log in to reply
This topic has been deleted. Only users with topic management privileges can see it.
  • T Offline
    T Offline
    Tushar T

    Pro User

    wrote on last edited by
    #1

    Screenshot 2025-07-12 102742.png

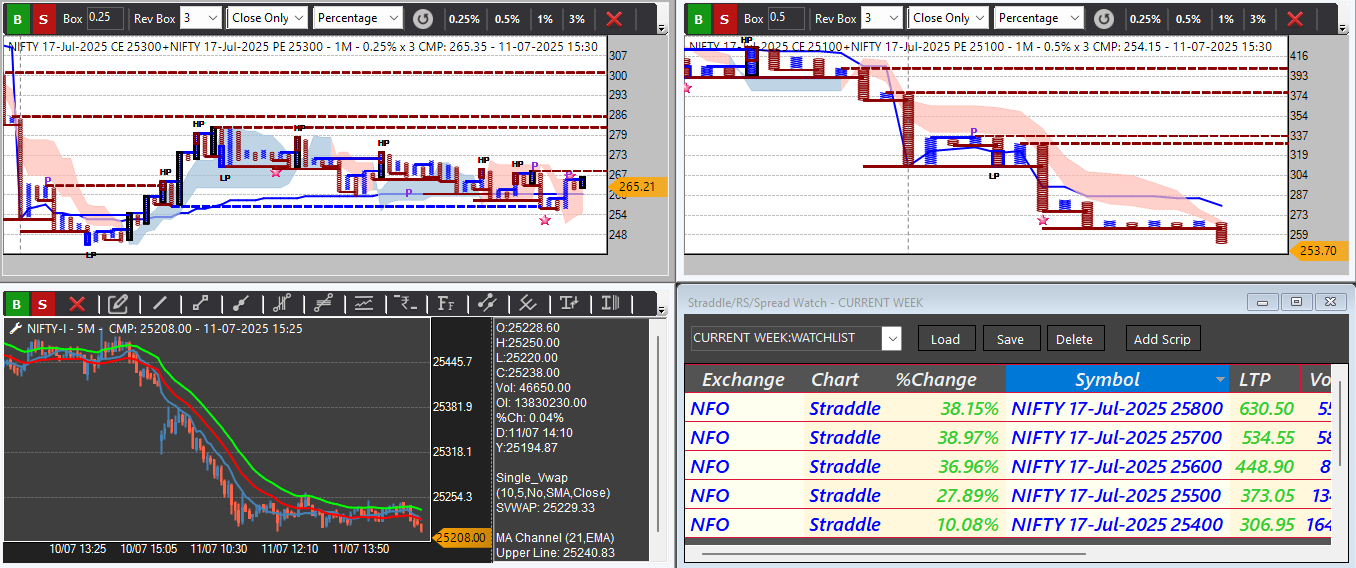
    The market opened with a gap down near the 25300 level. In the first 30 minutes, it attempted to move upside, taking support at the L4 level, but was unable to sustain the move. To gauge market direction, we plotted a straddle at 25500 and 25100. We observed that 25100 triggered a downside move, while 25500 triggered an upside move, indicating possible directional movement. Additionally, a turtle breakout occurred at 25100 near 308, presenting a potential entry opportunity. However, due to personal reasons, I was unable to take the entry

    1 Reply Last reply
    1


Recent Posts

  • P
    Discrepancies in Momentify Allocated amount, Balance and Current holding.
  • S
    Issue In P&F Charts
  • P
    help in create RS Scanner
  • R
    How can I draw trendline, horizental or vertical line on indicators
  • M
    Issue related on stock split or bonus
  • Login

  • Login or register to search.
  • Blog
  • Youtube Videos
  • Refresh
  • First post
    Last post
0
  • Recent
  • Categories
  • Unread 0
  • Popular
  • Tags
  • More
    • Guidelines
    • Disclaimer
  • Users
  • Login

  • Login or register to search.
  • Blog
  • Youtube Videos
  • Refresh