• Recent
  • Categories
  • 0 Unread 0
  • Popular
  • Tags
  • More
    • Guidelines
    • Disclaimer
  • Users
Skins
  • Light
  • Default
  • Cerulean
  • Cosmo
  • Flatly
  • Journal
  • Litera
  • Lumen
  • Lux
  • Materia
  • Minty
  • Morph
  • Pulse
  • Quartz
  • Sandstone
  • Simplex
  • Sketchy
  • Spacelab
  • United
  • Yeti
  • Zephyr
  • Dark
  • Cyborg
  • Darkly
  • Slate
  • Solar
  • Superhero
  • Vapor
Collapse
Definedge Forum Logo

Max Drawdown Calculation Discrepancy. + Please add CALMAR ratio

Scheduled Pinned Locked Moved Momentify
3 Posts 2 Posters 133 Views
    • Oldest to Newest
    • Newest to Oldest
    • Most Votes
Reply
  • Reply as topic
Log in to reply
This topic has been deleted. Only users with topic management privileges can see it.
  • P Offline
    P Offline
    Pranav Pareek
    wrote on last edited by
    #1

    Dear Team,

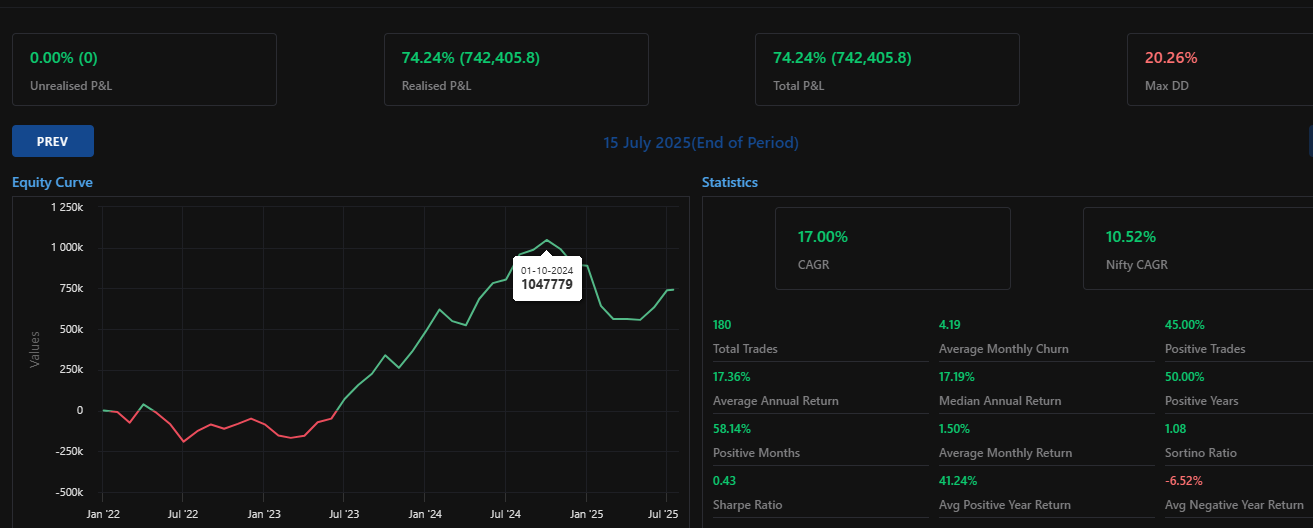
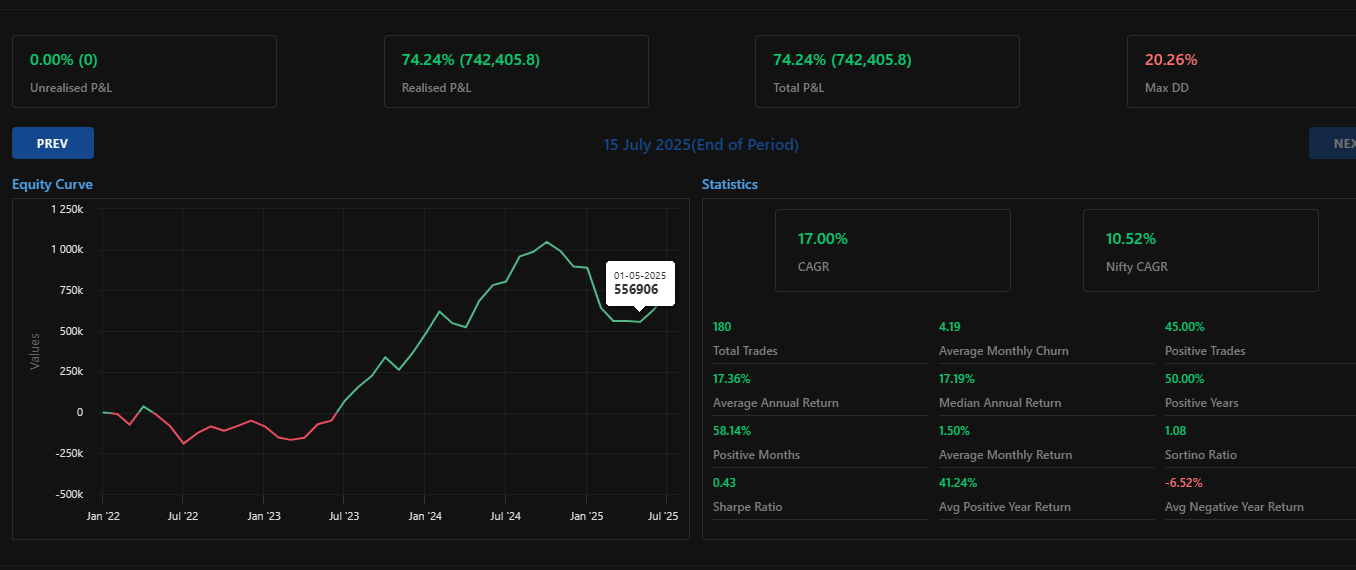
    I am an avid Momentify user. I have been testing my strategies on the platform and noted that there is probably some issue in calculation of Max Drawdown. Please refer the three screenshots below:

    As per the screenshots the max drawdown is 20.26%. This is on a capital of 10 lacs. However, if I calculate manually - the recent peak is 1047779 and recent trough is 556906 (as provided in screenshot). Since this is an equity curve for profits. I add up the same in initial portfolio value to arrive at peak portfolio value of 2047779 (1000000+1047779), and trough portfolio value of 1556906 (1000000 + 556906). So the drawdown would be 2047779 - 1556906 = 490873. This on a base of 2047779 is 24.0% vs the Max drawdown of 20.26%. Please correct me if I am wrong anywhere.

    Also, it would be beneficial to add CALMAR Ratio in testing our strategies.

    mm1.png

    mm2.png

    Many thanks for the valuable platform.

    Regards,
    Pranav

    1 Reply Last reply
    2
  • P Offline
    P Offline
    Pranav Pareek
    wrote on last edited by
    #2

    Requesting the team to look into this.

    1 Reply Last reply
    1
  • Prashant Shah Offline
    prashant.shah26@gmail.comP Offline
    Prashant Shah
    wrote on last edited by
    #3

    Equity curve is shown as per the total P&L (Realised plus unrealised).
    Drawdown is calculated only on realised P&L.

    1 Reply Last reply
    1


Recent Posts

  • R
    MIP-12-ETF Strategy
  • SANTANU BEZ-1707666167730S
    🧠 Two Souls of a Trader: How to Separate the Analyst from the Executor & Trade with Clarity Using Definedge’s Buzzer Ecosystem
  • SANTANU BEZ-1707666167730S
    πŸ“Š Mastering Nifty 50 Intraday Moves – A Weighted Approach to Reading Market Dynamics πŸ’Ή
  • S
    πŸššπŸ“ˆ NIFTY Transport & Logistic vs NIFTY 500 – RS Chart Signals Fresh Outperformance πŸš€
  • R
    Volume Profile
  • Login

  • Login or register to search.
  • Blog
  • Youtube Videos
  • Refresh
  • First post
    Last post
0
  • Recent
  • Categories
  • Unread 0
  • Popular
  • Tags
  • More
    • Guidelines
    • Disclaimer
  • Users
  • Login

  • Login or register to search.
  • Blog
  • Youtube Videos
  • Refresh