• Recent
  • Categories
  • 0 Unread 0
  • Popular
  • Tags
  • More
    • Guidelines
    • Disclaimer
  • Users
Skins
  • Light
  • Default
  • Cerulean
  • Cosmo
  • Flatly
  • Journal
  • Litera
  • Lumen
  • Lux
  • Materia
  • Minty
  • Morph
  • Pulse
  • Quartz
  • Sandstone
  • Simplex
  • Sketchy
  • Spacelab
  • United
  • Yeti
  • Zephyr
  • Dark
  • Cyborg
  • Darkly
  • Slate
  • Solar
  • Superhero
  • Vapor
Collapse
Definedge Forum Logo
B

B. Krishnakumar

Pro User

About
Topics
19
Replies
32
Groups
1
Followers
38
Following
0

All Replies

Recent Best Controversial

    KK's Corner: RS Patterns in Nifty 50 Stocks
  • B B. Krishnakumar

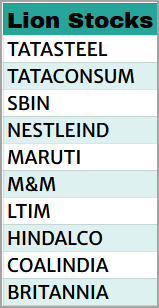
    Here is another interesting way to dice the data and identify stocks to focus on, especially for day traders. Here is the table capturing the stocks with Flying RS Pattern today and Lion pattern (another bullish pattern) that was recorded the previous day. Remember, Nifty closed in the red yesterday, but the Lion stocks closed in the green. Have a look at the table given below.

    09cf38f9-3c82-4e15-b88c-6ab1b061d880-image.png

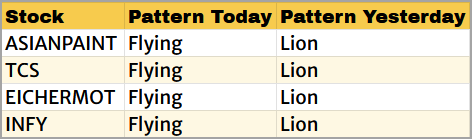
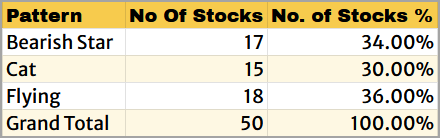
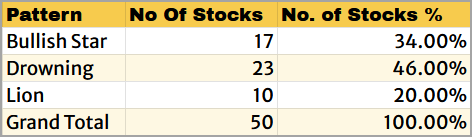
    You may recall that there were 18 stocks that qualified as Flying Pattern today. Out of this 18 stocks, four stocks listed above qualified as Lion pattern yesterday.

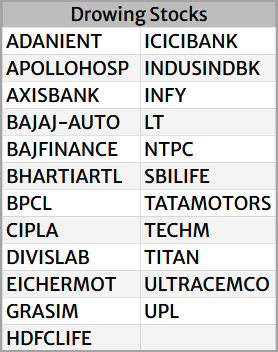
    There were 2 stocks (BPCL, Kotak Bank) that qualified as Flying pattern today and had a Bullish Star Pattern yesterday. The simple conclusion is that if you had focused on the stocks with bullish RS patterns formed yesterday, you could have probably zoned in on the potential trading candidates for today's trading.

    Hope this helps.


  • KK's Corner: Identifying Momentum Stocks
  • B B. Krishnakumar

    Here is a simple strategy to identify momentum stocks for trading. Run this scanner every weekend or may be once in a fortnight and look for entry using your favorite entry method in your favorite charting method in 0.25% or 1% box / brick size.

    Here is the simple approach:

    • Build a P&F scanner that will identify stocks which are above x% above the Super Trend in 3% box size. I look for candidates which are 6% above Super Trend in 3% box size. You may choose any other % level. The second condition in the scanner would be last column is a column of X. This is to ensure that we are outperforming in 3%.

    • Run the above scanner in P&F RS Scanner to identify a list of stocks that are strong outperformers. Save this list as a group.

    • Go to P&F RS Matrix and run the scanner using the group saved in the previous step. Sort the list in the descending order of total RS Ranking score. And pick the top 10 or 15 stocks from the list.

    • Save this top 10 or 15 stocks as a separate group. This is a list of stocks that are probably best among the best. Run your favorite entry scanner in this group either in 1-min time frame for intra-day to short-term swing trades or run the entry scanner in 0.5% or 1% P&F or Renko chart to identify entry.

    Again, this strategy would work well when the market is bullish and the Mid small cap indices are outperforming Nifty 50.

    Hope this helps


  • KK's Corner: Quick Note On Today's Rally - Oct. 5, 2023
  • B B. Krishnakumar

    After some bearishness recently, there was some respite to the selling today (October 5, 2023). I wanted to dive deep to figure out the strength and the quality of the rally. I looked at the Ratio Trend Matrix to study the relative performance of the Nifty 50 constituents. Here is the summary of patterns for today.

    67bea446-e684-47c6-a0d8-d00d05e37ab8-image.png

    Out of the 50 stocks, only 36% qualified for the Flying pattern. This means only 36% of the stocks outperformed Nifty 50 today which is not impressive. What is even more disturbing is that 30% of the stocks qualified as Cat pattern suggesting that they closed in the red even though Nifty 50 closed on a positive note.

    The remaining 34% stocks qualified as the Bearish Star pattern suggesting that though they closed on a positive note, their performance was inferior to the benchmark.

    If you look at the market breadth, it captures a similar picture. Though the Nifty 50 closed on a positive note today, the PF-X% breadth indicator closed lower today at 20%, compared to 22% yesterday.

    In essence, there is no reason to get carried away with today's rally. Watch for improvement in breadth for more clues.


  • KK's Corner: Zensar Technologies
  • B B. Krishnakumar

    In the latest Friday webinar, I shared my thought process behind my latest entry in Linde India. Just a few minutes ago, I bought Zensar Technologies where the set-up is no different from that of Linde. The chart below highlights a few factors that were crucial behind my entry in Zensar.

    e5d8b97b-400a-4279-b57f-820abae2ba06-image.png

    The occurrence of pocket pivot candles indicate buying interest. Pocket Pivot is a candle where the current up day’s volume must be larger than any of the down volume days in the prior 10 days. Here is the video on pocket pivots if you are interested. https://www.youtube.com/watch?v=NNcAG-PylxU

    I took the trade today when the Pocket Pivot confirmation occurred. My entry was at Rs.586. If you look at today's volume, it is higher than the volume of the down days recorded in the last 10-days. You can find similar pocket pivot characteristics in Linde India chart too.

    My stop loss is at Rs.543 which is couple of ticks below Friday's low. I will exit 1/3 rd of my position at 1:2 risk reward and trail the rest with D-SMART in 1% Renko in daily time frame.

    Hope this helps!


  • KK's Corner
  • B B. Krishnakumar

    Here is the chart of Dixon in 3% Renko & 1% Renko. This is a classic study on nesting of time-frames.

    caa5cc64-6f02-4614-8653-aeb765f7a7b6-image.png

    The three step sequence of trend reversal is highlighted in the above chart. This happens consistently in trend reversals and we have been discussing this for ages now in our webinars. When the price has pulled back to the MA in 3% and when the background is bullish (price above MAs & the MAs are positively aligned), let us switch to the lower time frame or 1% brick size to identify a low risk entry.

    eaf18194-ee43-4bae-a4a0-48d9b9ec35b3-image.png

    Notice how the price pulled back to the D-SMART line and offered a low risk entry with D-SMART as your stop loss.


  • KK's Corner
  • B B. Krishnakumar

    Birla Corporation

    The stock is setting up well. Have a look at the 3% and 1% Renko chart of this stock. It offers a low risk entry opportunity.Birlacorp1%.png Birlacorp3%.png

    If you are aggressive, then you can take the entry when the second green brick gets printed in 1% Renko chart. Can someone tell me what will be the logic for that entry?

    Others stocks in my watch (I may have holdings in these):

    1. Mindacorp
    2. Greenpanel
    3. Tatacomm
    4. Aplapollo
    5. KSB
    6. Triturbine
    7. Hudco

  • KK's Corner - Simple Santa Strategy - Revised
  • B B. Krishnakumar

    Here is a simple strategy to identify stocks that are relatively strong and worthy enough to look for an entry going forward. This strategy is suitable for someone who wishes to do very short-term swing trades with a holding period of few days to a couple of weeks or so.
    The first step is to identify candidates that have hit a 52-week high in ratio chart at any time x-days ago. The “X” here could be 10-days, 15-days, or 20-days look back. You can use the High-Low Retracement Scanner in RZone to shortlist stocks that have hit a 52-week high in the ratio chart at anytime x-days ago. For our example, I am looking for all candidates that hit 52-week high in ratio charts at any time 30-days ago.
    I filtered the stocks that hit 52-week high somewhere between the last 10-35 days. Again, feel free to experiment with different look back periods. There were 178 stocks that qualified from the Nifty 650 universe, and I imported this list into RZone.
    From this new group of 178-stocks, I am now looking for those where price has been consolidating / correcting in the last 10-days so that disparity index is not elevated. Basically, I am looking for candidates that are not too overbought in relation to their 10-day EMA & 20-day EMA. Remember, we are focusing on an ultra-short-term swing strategy here.
    I have created scanner called “10-20 EMA Dec.23” which is listed in public domain. Four stocks qualified in this scanner. The qualified stocks were Eclerx, Sequent, Ajanta Phama & Welent. You can choose to buy the stocks at current price provided the risk is affordable. Have a stop loss below the most recent low. Use the 10-EMA as your trailing stop loss going forward. Exit 1/3 rd quantity at 1:2 risk-reward and trail the rest using 10-day EMA as your trailing stop loss.
    Alternatively, you can run any of your favourite entry scanner in the universe of 171-stocks and look for entry opportunities. For instance, you can use the Momentum Entry New scanner in 0.5% Renko chart with the recent swing low being the initial stop loss. Switch to D-SMART in 0.5% once the D-SMART crosses your entry price.
    You can do this exercise over the weekend to generate list of stocks to focus for the upcoming week. Run the 10-20 EMA Dec.23 scanner after the market close every day to look for fresh entry candidates for the next day.
    I am just giving some broad ideas here. You can fine tune the parameters & entry conditions based on your preference. Hope this helps.
    PS: Another important concept that I missed out highlighting earlier is that this strategy is relevant only in a bullish market where the broader market is outperforming the Nifty 50 index. Do not try this out when Nifty 50 index is not in an uptrend.


  • KK's Corner
  • B B. Krishnakumar

    Here are a few of interesting candidates from the PSE/CPSE space. I am talking about NTPC, Powergrid & RITES. NTPC.png

    The pattern is interesting and the PSE/CPSE index is a relative outperformer Vs Nifty 50. Nice consolidation breakout too. I have positions in this one. Looking for entry in the other two.


  • KK's Corner
  • B B. Krishnakumar

    Here is another interesting chart set-up in Astral.
    Astral.png
    The Trend Score is healthy at 50% and there is a low risk entry opportunity. Aggressive entry would be on column reversal. Else, buy when DTB is triggered.


  • KK's Corner: Quick Note On Today's Rally - Oct. 5, 2023
  • B B. Krishnakumar

    Okay. Here is the update based on today's price action.

    image.png

    What happened today probably is the exact opposite of the rally that happened on Oct. 5. Today, there were only 23 stocks out of Nifty 50 index (46%) that were Drowning candidates, meaning their performance was worse than Nifty 50. The remaining 54% stocks were relative outperformers of which, 20% or 10 stocks qualified as Lion, suggesting that they closed in the green even though Nifty closed in the red. Looks like a handful of index heavyweigths along with few others pulled down the Nifty.

    Here is the list of drowning stocks

    image.png

    Here is the list of Lion stocks for the day.

    image.png


  • KK's Corner
  • B B. Krishnakumar

    Here is an interesting technique to project targets. Remember, the targets do not matter much if you have an established trend following approach. And targets may be hit or may not be. But in my experience, the technique showed here is very reliable. These targets do get achieved 'eventually". So I view them more as an opportunity to say "Maine Bola Tha" some time in the future. With that caveat here is the chart of Elecon Engineering in 1% box size.

    65bc86c8-4544-41d1-911c-21b06abbd599-image.png

    This concept is based on two principles.

    1. Breakout & retest. Notice the breakout above the middle line via a strong bullish anchor column. After the breakout, the price retraced to retest and sustain above the breakout line.
    2. 1:1 Channel projection

    Hope you find this interesting & informative. Again, let me reiterate, these are just possible targets with no guarantee of being achieved.


  • KK's Corner
  • B B. Krishnakumar

    Let us take a quick look at the Bank Nifty Index. The price has been consolidating in a range while Nifty 50 has made higher highs. There is clear underperformance of Bank Nifty and there is negative divergence in the ratio chart.
    Banknifty Ratio.png
    In the above chart, while the price has not broken the prior swing low, the Ratio chart has broken the corresponding swing low which is the negative divergence. You can notice a positive divergence during the market bottoming out phase in Feb-March 2023.

    Also take a look at the RS chart in P&F format posted below.
    Banknifty PF RS.png
    The RS chart is right at the 45-degree trendline drawn off the Feb. lows. It is important that this line is not breached. A break of this trendline could trigger banknifty led correction in Nifty.


  • KK's Corner
  • B B. Krishnakumar

    Interesting Sector rotation happening recently. Have a look at the Multiple Ratio Chart of various sectors featured below.
    Multiple ratio.png

    Notice how Auto has turned lower recently while IT index was recovering. Something interesting happened today. Erstwhile outperformers - Nifty Bank & Nifty Financial Services turned around today while the IT index and Metals took back seat.

    I get a feeling that the Nifty 50 index would continue its dream run, backed by banks & financial services.

    If you are itchy to take exposures in IT sector, then wait for a sustained improvement in the above line and let it cross the 100 mark. Also check the Nifty IT price chart for a confirmed breakout above recently trading range.


  • KK's Corner - Aptus
  • B B. Krishnakumar

    Here is another interesting chart which appears to be bottoming out and getting ready for a rally. The ticker symbol is APTUS. Do your due diligence and manage your risk. This is just a post to help you identify turn around candidates.

    ecfe095b-0a29-40b2-bc27-c62303579d36-image.png

    In the above chart, it is evident that the price has been in a range and trying to bottom out The upsloping trendlines are not breached by almost all down sloping ones are broken. We are on the verge of breaking out above the final pending down sloping line.

    Let us switch to the Renko chart for more details.

    17ffe8b4-dbb5-4d64-9d07-d56c0117319d-image.png

    The 1-2-3 sequence mentioned in CDSL yesterday is playing in 1% brick size in the above chart. Price has crossed the MAs & the MAs are also positively aligned. Hope this helps.


  • KK's Corner: Cochin Shipyard
  • B B. Krishnakumar

    Here is another classic example of Pocket Pivot & VooDoo (Volume Dry up) candidate. This stock was discussed in the Friday Webinar a couple of weeks ago. The stock in question is Cochin Shipyard.

    737cb509-c557-47ee-99c3-efc2ab3ceaba-image.png

    Notice the Pocket Pivot candle today which has resulted in a strong breakout. Combination of Pocket Pivot plus VooDoo can be handy in getting an early entry ahead of regular breakout opportunity.

    For those interested, take a look at Castrol, Hindustan Copper which are other interesting Pocket Pivot candidates.


  • KK's Corner
  • B B. Krishnakumar

    Another Interesting stock: Schaeffler India

    The charts are self explanatory. I identified this using Pattern counter Trend ratio scanner and took the entry earlier today.
    Schaf 3%.png Schaf 1%.png Schaf daily.png


  • KK's Corner
  • B B. Krishnakumar

    Latent View Analytics is setting up well. I had shared this candlestick chart in the telegram channel earlier.

    Latent Weekly.png

    Here is the Point & Figure Chart of the stock.

    Latent Plain PNF.png

    The major downsloping 45-Degree trendlines have been broken, suggesting strength. Notice the absence of double bottom sell signal since the rally began from Rs.321. This again is a bullish sign.
    Here is the P&F chart with a few horizontal & vertical counts.

    Latent count.png

    The immediate targets could be Rs.466-495 range. But I am long in the counter for targets in excess of fresh highs. Have an appropriate stop loss and trade wisely.


  • KK's Corner
  • B B. Krishnakumar

    Here is a chart of a recently listed stock with ticker symbol VPRPL. This is a 5-minute time frame chart with 0.1% box size & 3-box reversal.

    7e468dd3-b5f8-4813-9636-d57c8204a649-image.png

    Notice the strong rally and the consolidation thereafter. Price has crossed all down sloping 45-degree trendlines. Also, it has crossed quite a few bearish anchor columns, suggesting bullishness. I have bought this stock just now and looking to hold this for atleast a few months. I will exit below 162.

    Hope this helps.


  • KK's Corner - RS at 52-week High - Torrent Power & Jyothy Labs
  • B B. Krishnakumar

    I ran the scanner in RZone Web to identify stocks that are at 52-week high in the Relative Strength (RS) chart versus Nifty. Out of the list of stocks, I liked the chart pattern in Torrent Power & Jyothy Labs.
    Here is the daily chart of Jyothy Labs.

    b2857a65-48ef-4b36-abf1-60c09c7c6e81-image.png

    After a sharp rally, the price has consolidated in a tight range and the price n volume action is very interesting today. There is a similar pattern in Torrent Power too. I am long in both these stocks.


  • KK's Corner
  • B B. Krishnakumar

    @Rahulsinh G. Thakore

    Yes. You can use this to enter if you have missed out. But again, i prefer to take the pull back entry only when the trend is nascent.


  • KK's Corner
  • B B. Krishnakumar

    Here is the chart of Nifty 50 Spot in 5-min time frame, using 10-point absolute box size.

    4accad5d-9296-4ff5-bb71-dce31703ff85-image.png

    The conservative horizontal count has been achieved. The aggressive horizontal as per Wyckoff theory works out to 20,400. I would expect Nifty to reach this target as long as the price holds above the recent swing low of 19,200.

    Hope you found the previous post on Bank Nifty informative. The fall in Nifty was spearheaded by the weakness in Bank Nifty.


  • KK's Corner: Quick Note On Today's Rally - Oct. 5, 2023
  • B B. Krishnakumar

    Hi Pankil. When to enter is different concept. That depends on the rules you have created. I personally would wait for Nifty 50 price trend to turn bullish and then look for stocks to buy. I do not take short trades in stocks. What we are discussing here are ways to dice the market data to decipher the underlying strength / weakness. These are clues that will helps us be better prepared. But price action will be supreme.


  • KK's Corner - RS at 52-week High - Torrent Power & Jyothy Labs
  • B B. Krishnakumar

    NH also has a similar set-up. Check Market-Kya-lagta Hai video update by Raju Ranjan that was uploaded yesterday in YouTube. He talks about this sector


  • KK's Corner: RS Patterns in Nifty 50 Stocks
  • B B. Krishnakumar

    Another update, but with NSE Sectors this time. Here is the Ratio Trend Matrix grouping of the 23-sectors.

    image.png

    Out of the 23-sectors, it is disappointing to note that only 10 sectors or 43.48% of the sectors qualified as Flying pattern, meaning they managed to outperform Nifty 50.

    There were 7-sectors qualifying as Bearish Star pattern suggesting that they closed in the green but still underperformed the Nifty 50 index.

    And, there were 6-sectors that qualified as Cat pattern, suggesting that they closed in the red even though the Nifty 50 index closed in the green.

    Now, contrast this to the pattern distribution on Friday when Nifty staged a handsome recovery. Here is the pattern distribution for Friday.

    image.png

    We had a much bullish distribution on Friday where 16 out of 23-sectors or close to 70% sectors qualified as Flying pattern, suggesting outperformance. Nice to note that we did not have a Cat pattern on Friday. There were Bearish Star ones but this means these sectors too closed in the green, but underperformed Nifty.

    Basically, the data from Friday and today does not evoke confidence about the sustenance of the rally. This could still be a pull back in a downtrend. If you notice the PF-X% breadth, it has not improved a whole lot today. Contrast this to the price & breadth movement at the March 2023 lows.

    image.png

    Hope you get the message. Things can still improve going forward and we may end up hitting new highs. But based on the data till date, such a possibility is not something that appears highly probable.


  • KK's Corner - RS at 52-week High - Torrent Power & Jyothy Labs
  • B B. Krishnakumar

    @Shashank Jain

    Go to High-Low Retracement Scanner in the Smart Scanners menu in RZone.
    7d723157-a35a-459d-9f7b-8172610b1062-image.png

    In that menu, check the Denominator box to ensure that the scanner tracks Ratio chart details as well. In the no. of bars, use 252. You should get the desired result.

  • 1 / 1
  • Login

  • Login or register to search.
  • Blog
  • Youtube Videos
  • Refresh
  • First post
    Last post
0
  • Recent
  • Categories
  • Unread 0
  • Popular
  • Tags
  • More
    • Guidelines
    • Disclaimer
  • Users
  • Login

  • Login or register to search.
  • Blog
  • Youtube Videos
  • Refresh