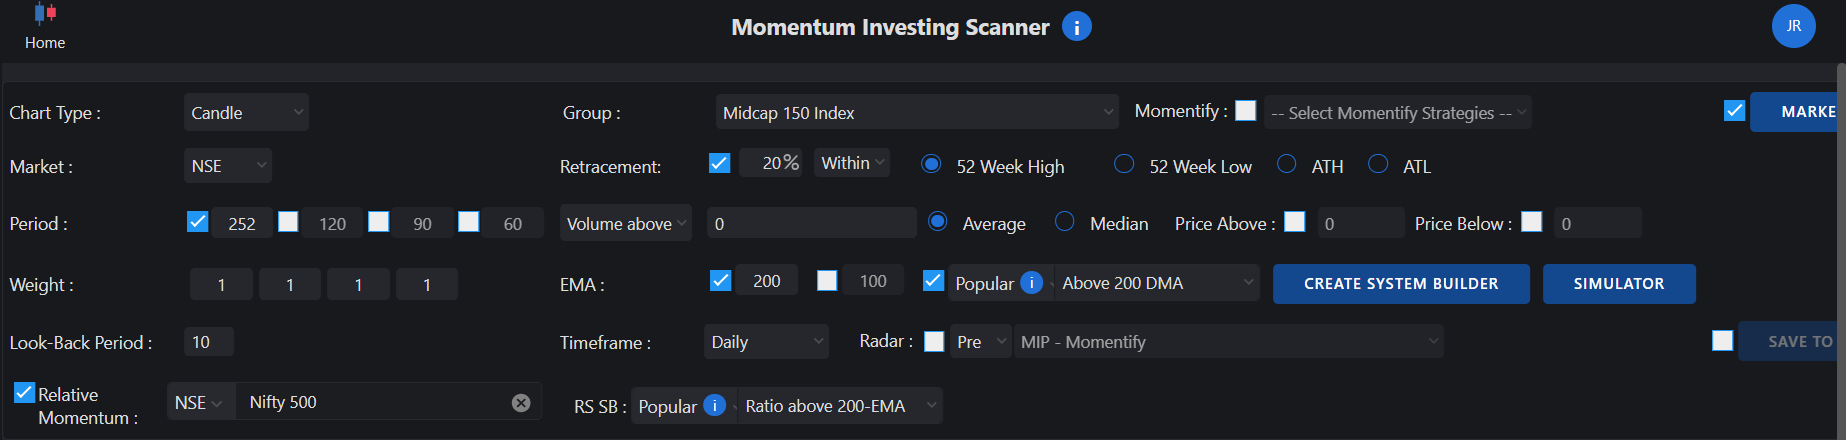
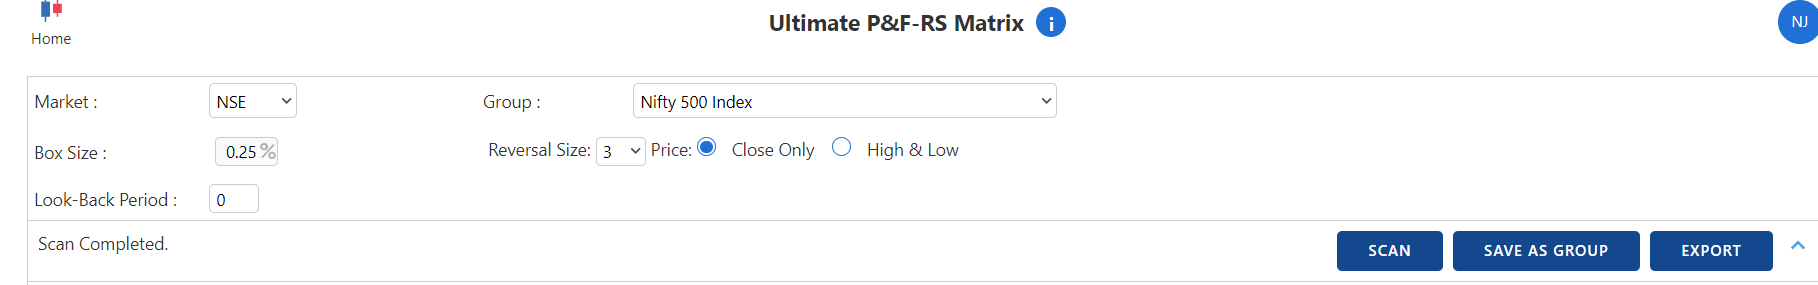
that will be easy to select otherwise need to calculate the trading days were chance of miss calculations
Pro User
that will be easy to select otherwise need to calculate the trading days were chance of miss calculations
Index Rebalancing Update: Why I’m Focusing on ETFs in This Phase
Since the end of February, markets have been in a correction–rally–consolidation mode. In phases like this, instead of taking direct stock exposure, I prefer staying positioned through ETFs until my “Horny Bull Market Setup” triggers for fresh stock entries.
An important update for ETF investors:
 NSE has announced major index rebalancing:
ALPHA 50 Index: 30% stocks replaced
MOMENTUM 50 Index: 48% stocks replaced
MIDSMALL Index: 68% stocks replaced
This is a powerful reminder that indices consistently remove underperformers and add outperformers.
If you are a technical trader or investor, ask yourself:
 Are you rebalancing your portfolio with the same discipline?
Are you systematically exiting laggards and rotating into strength—just like the indices do?
In uncertain phases, ETFs provide efficient, rules-based exposure, allowing us to stay aligned with leadership without manually tracking every stock.
Stay systematic. Stay aligned with strength.
Nishesh Jani,CFTe
#SmartInvesting #IndexRebalancing #ETFStrategy #MomentumInvesting #TechnicalTrader #WealthWithDiscipline #nisheshjani #AhmedabadNest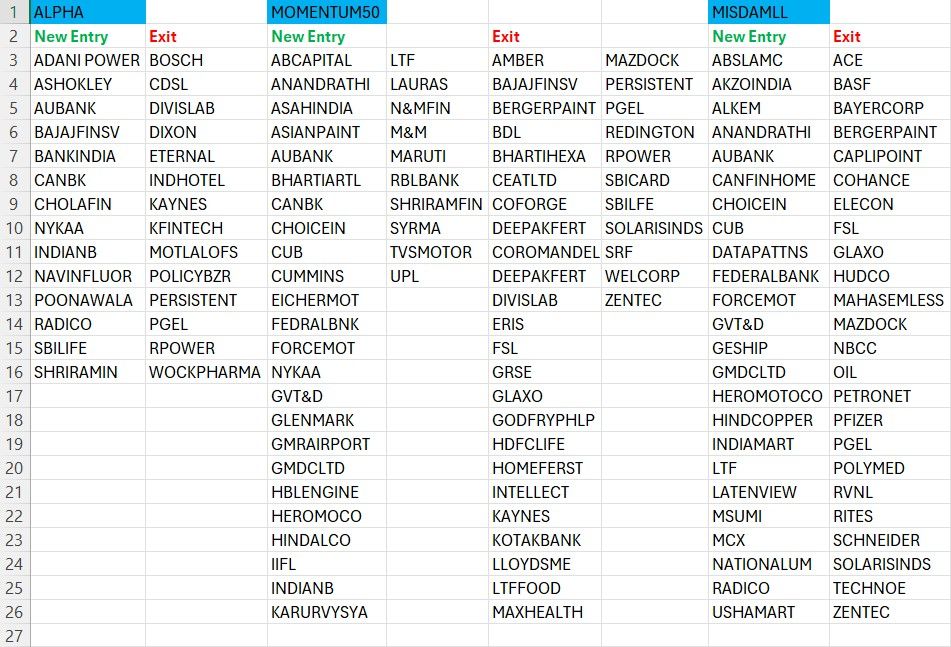
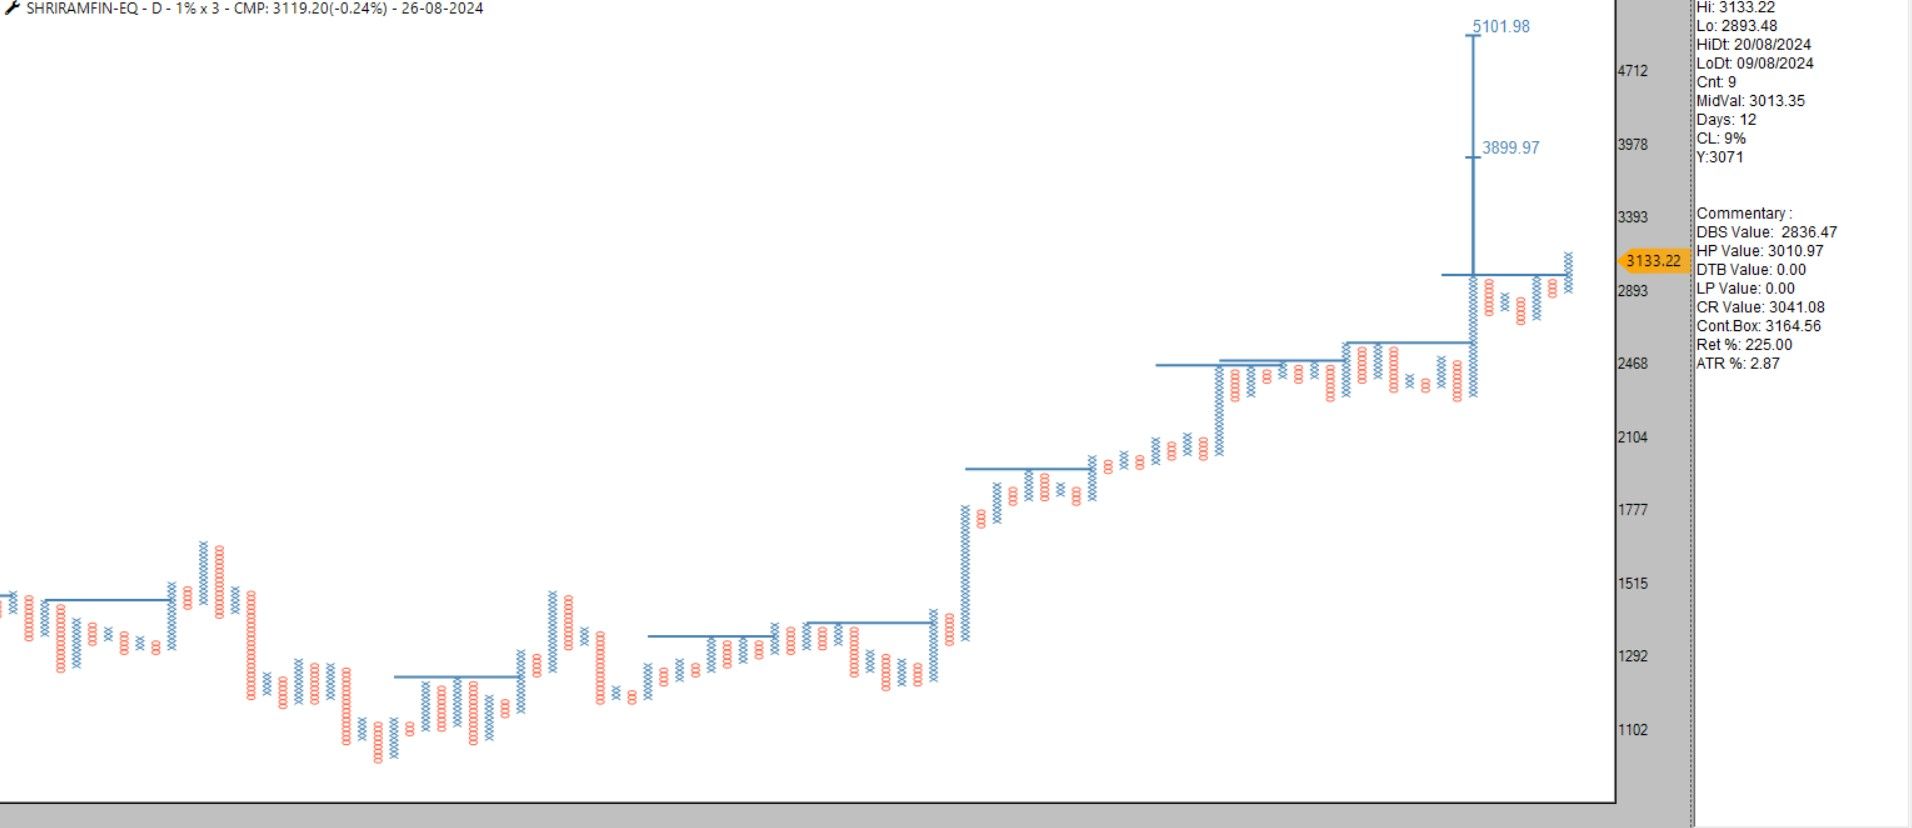
Turtle Bullish Breakout
SL 2836 on closing basis for 3900
Markets rarely announce opportunity loudly.
They begin with quiet strength, often overlooked.
By the time the trend becomes obvious, participation turns aggressive.
That’s when discipline matters more than emotion.
True signals don’t wait for comfort—they demand clarity and conviction.
We continue to systematically accumulate our preferred ETFs —
ALPHA • MOMENTUM50 • MIDSMALL • MID150BEES — staying aligned with strength, structure, and relative performance.
This is not about chasing moves,
it’s about positioning early and riding quality momentum with discipline.
Process > Prediction | Discipline > Emotion
Nishesh Jani,CFTe
#MomentumInvesting #ETFStrategy #SmartBeta #StockMarketIndia #WealthCreation #SystematicInvesting #nisheshjani #AhmedabadNest
candle chart ATR scanner then as per your choice trade in p&f -candle whatever the system you like
#Nifty #bullish or #bearish ?
Two pattern at same time
Bullish-close above 19600 will have ascending triangle breakout can lead to 20300 with sl 19300
Bearish-close below 19300 will activate Head & Shoulder pattern can lead towards 18600 sl 19500
Hope both #Bulls & #Bears camp happy now
without beaing biased to view play with levels
#AhmedabadNest #Nifty #analysis #technical #StockMarket #India #pattern

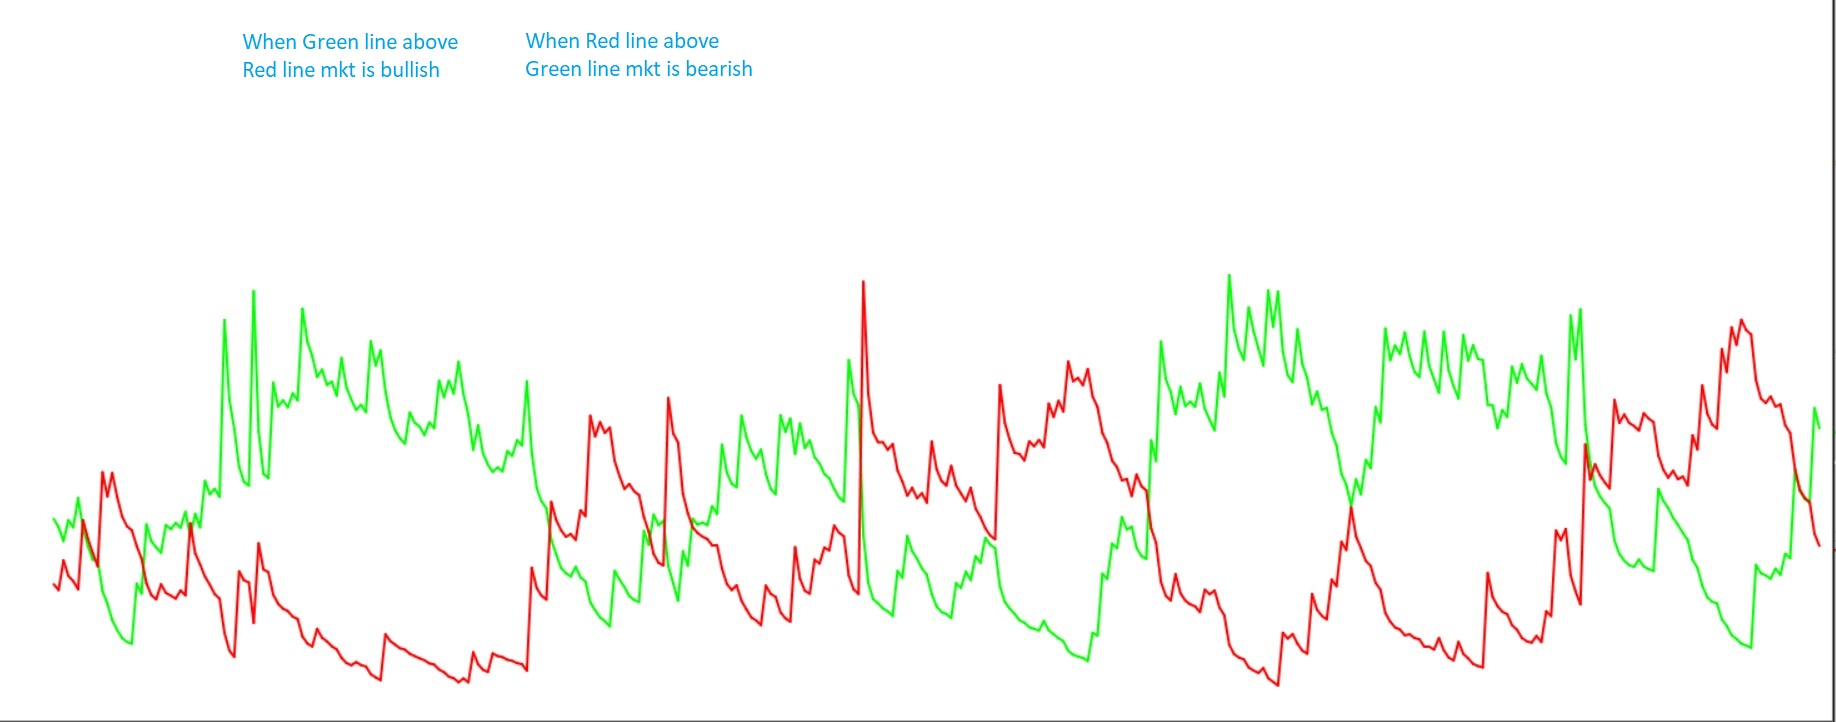
New Indicator
#Bull or #Bear
confuse over market phase ?
weather bullish or bearish ?
wants to ride the bullish momentum ?
simply my indicator will guide you
when Green line above Red line=>Bullish
When Red line above Green line=>Bearish
This is indicator where we relay on crossovers so it will have leg while generating signal but it will give good participation in market
query/question mail me on [email protected]
#AhmedabadNest #nseindia #analysis #StockMarketindia
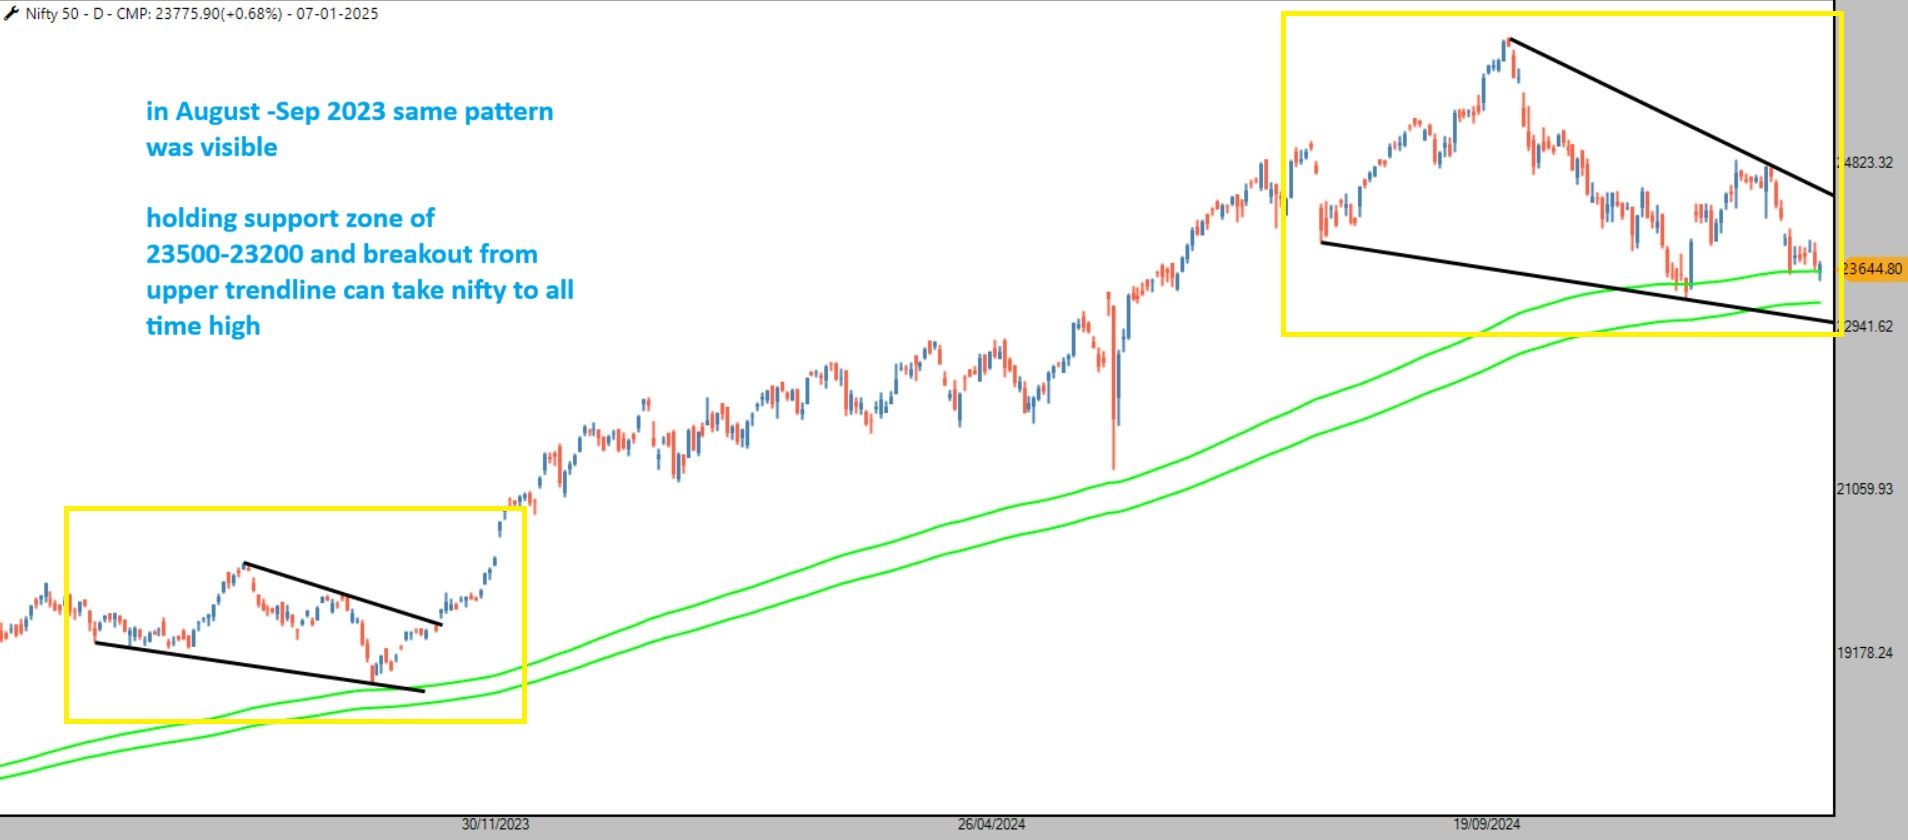
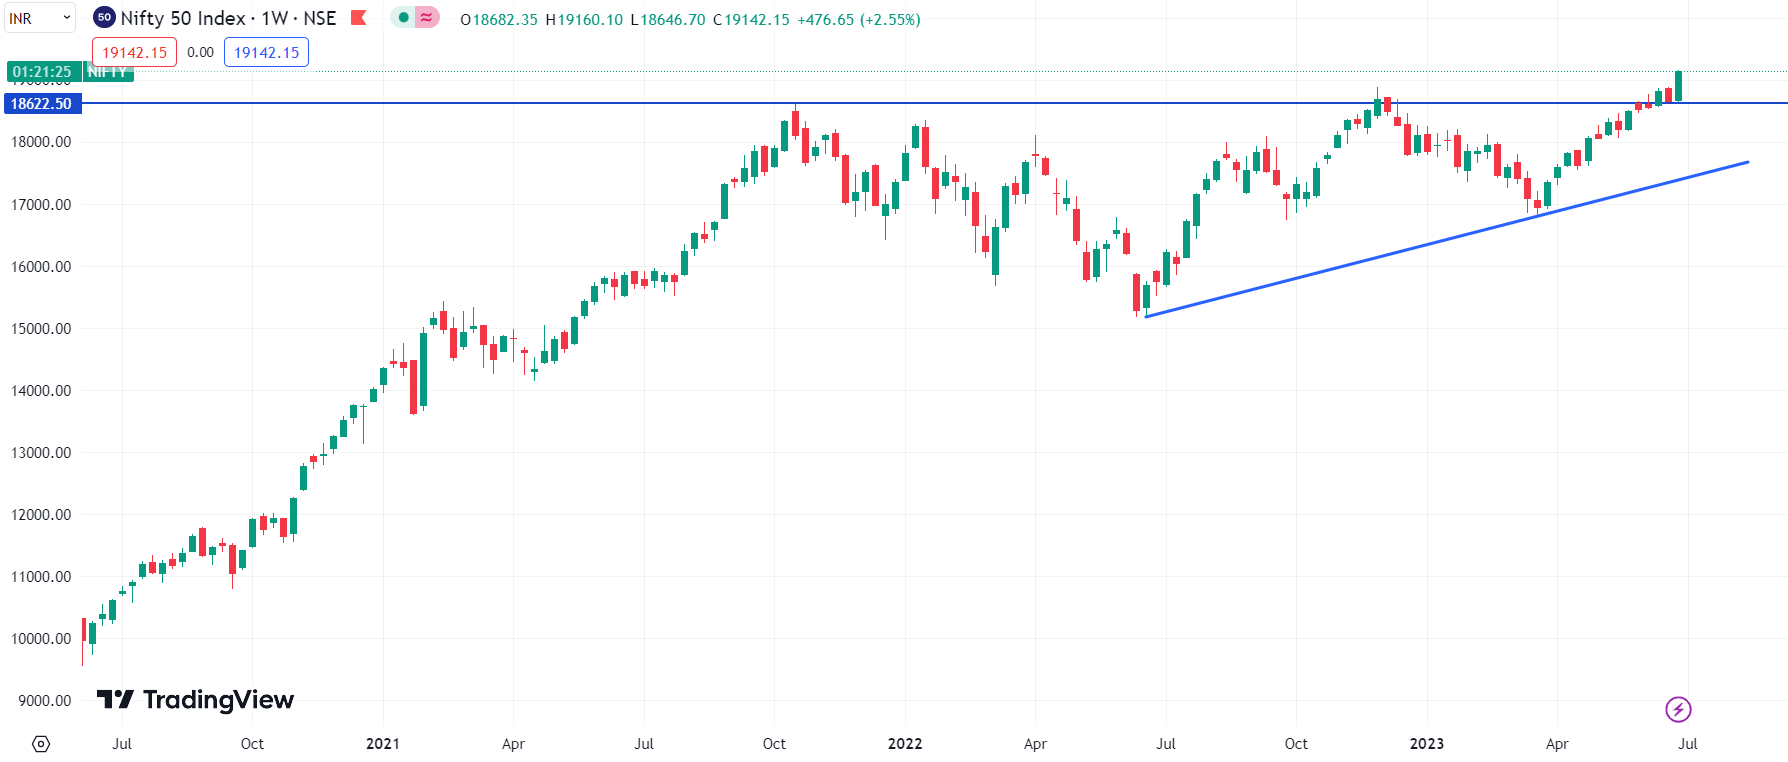
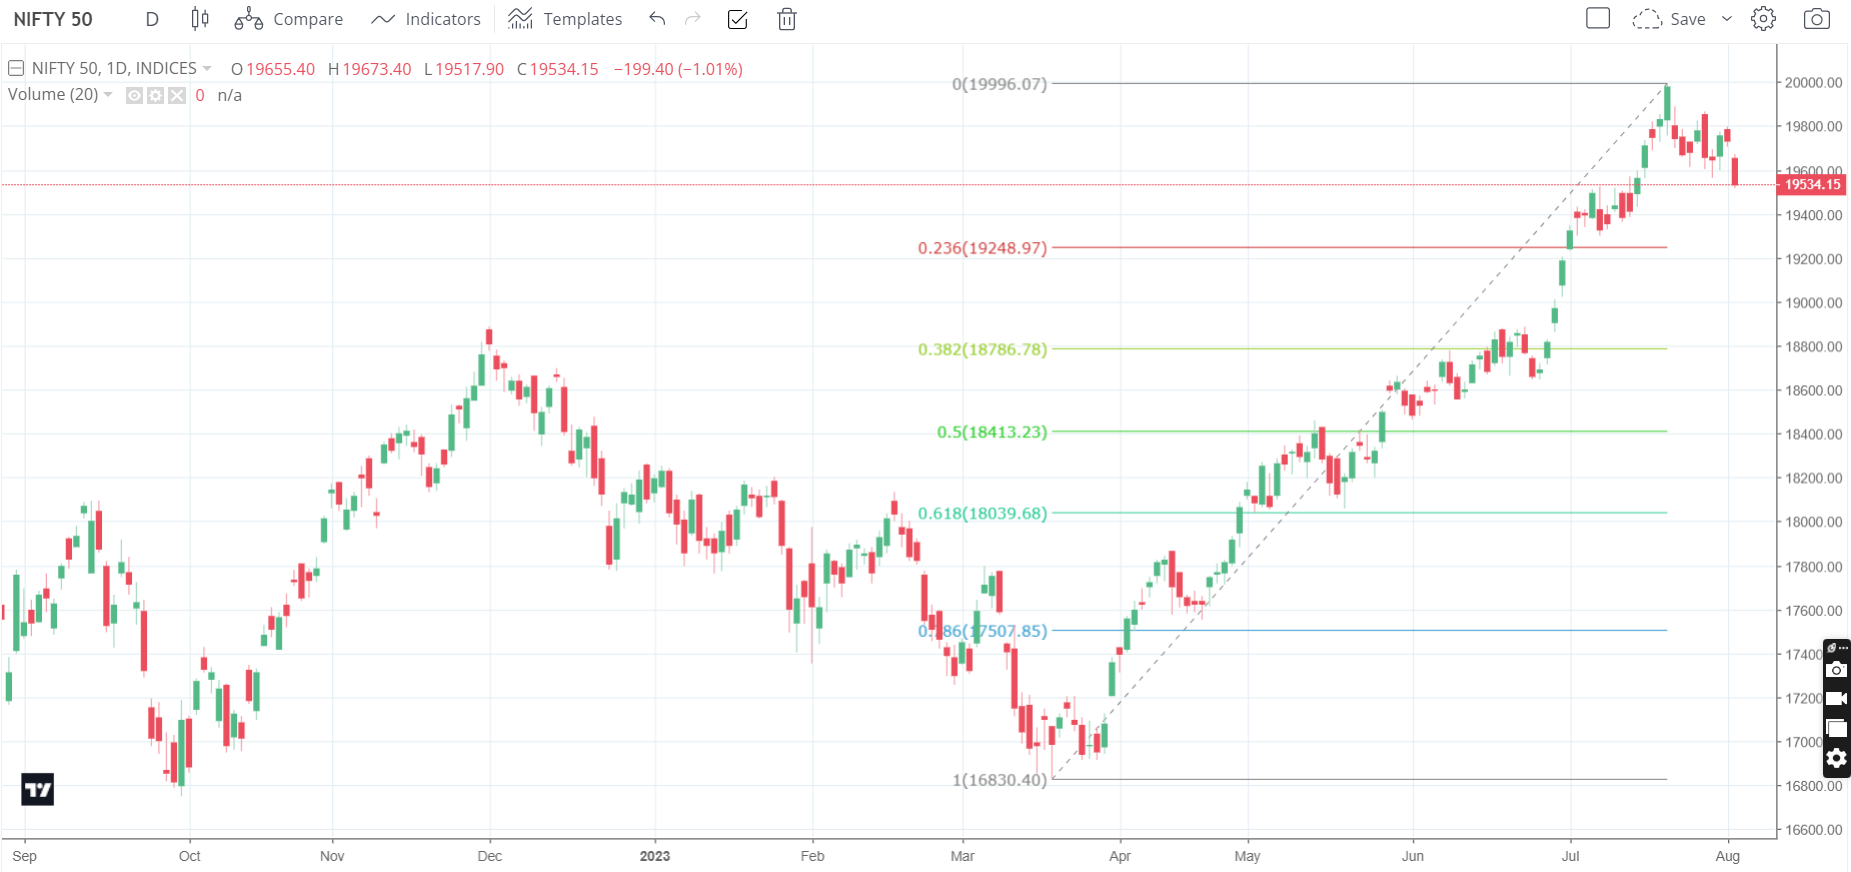
NIFTY 50 Fractle to lead all time high ?
Marked trendline with yellow box if hold 23500-23200 support zone and breakout from upper trendline will repeat fractle and possible to new all time high
#Nifty50 #analysis #StockMarketIndia #candlestic #charts #nse
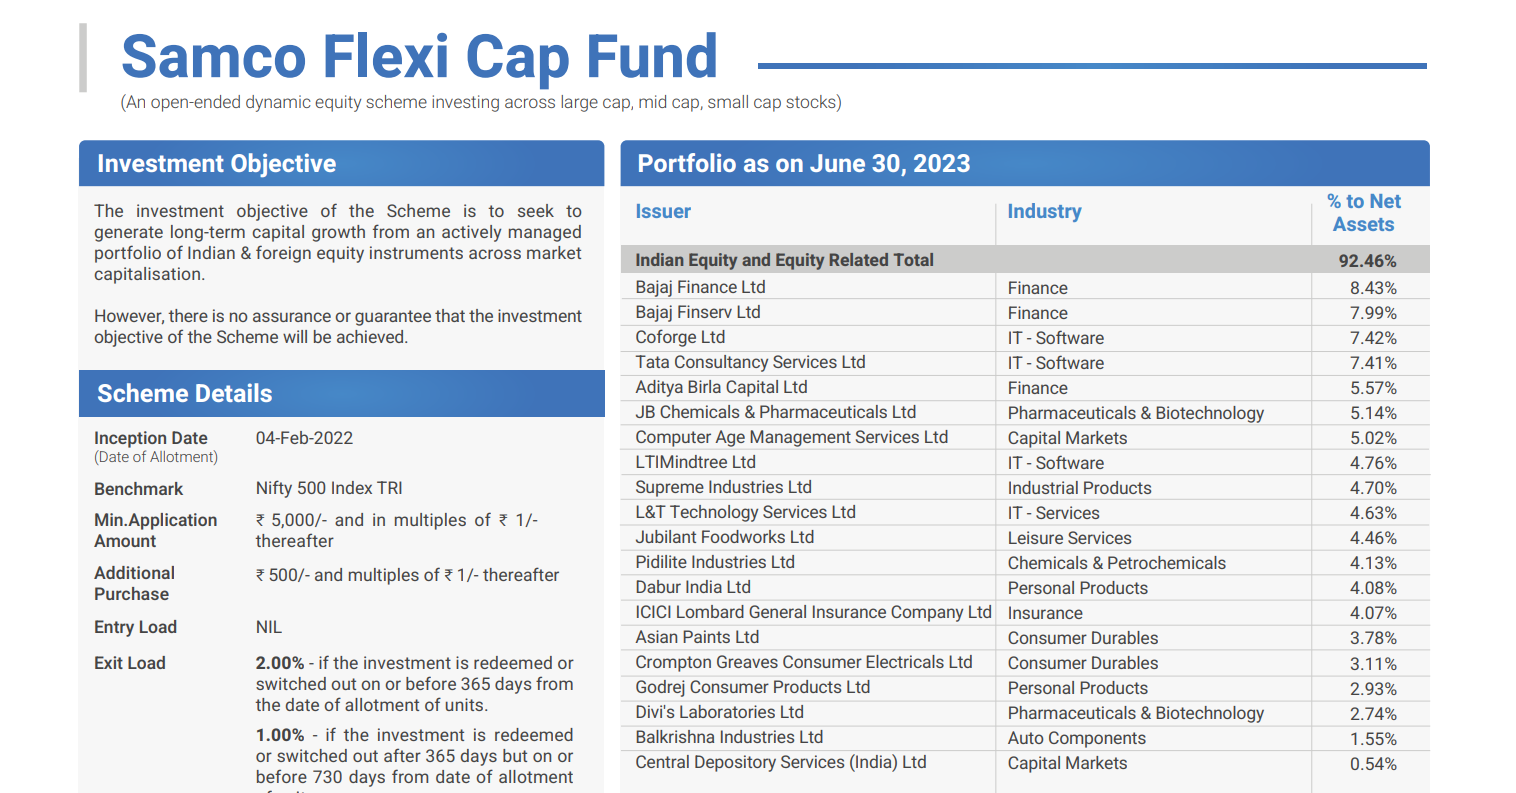
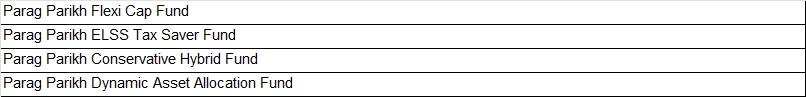
As you know i have made presentation on #VGM Concept which is to Ride momentum on Value Stock -Warren Buffett style -Parag Parikh Mutual Funds
Growth Stock-Peter lynch style-Motilal oswal Funds
now i like Hexashiled Frame work of stock selection so one can look to samco mutual funds Samco Flexicap fund
currently adding screenshot of stock one can look their factsheet everymonth after 10th to keep updating the list
read more about that concept at https://www.samcomf.com/hexaShield-tested-investments
Liknk of #VGM Prsentation https://www.youtube.com/watch?v=yUEdH9dlSHg&t=1838s
calculate the portfolio correction and all index correction after this post and re read the post is the written things happening or not
No strong positive momentum
Momentum Strategy will not work easily
Buy & Hold will not work
Easy system will not generate returns
Leverage/MTF will not have Favourable Time
High P/E & High leverage stock will be punished
Fundamentally strong/sustainable stock will show positive momentum
traders and investors lower down your expectations
Rate of Change-Speed of momentum will be slowdown
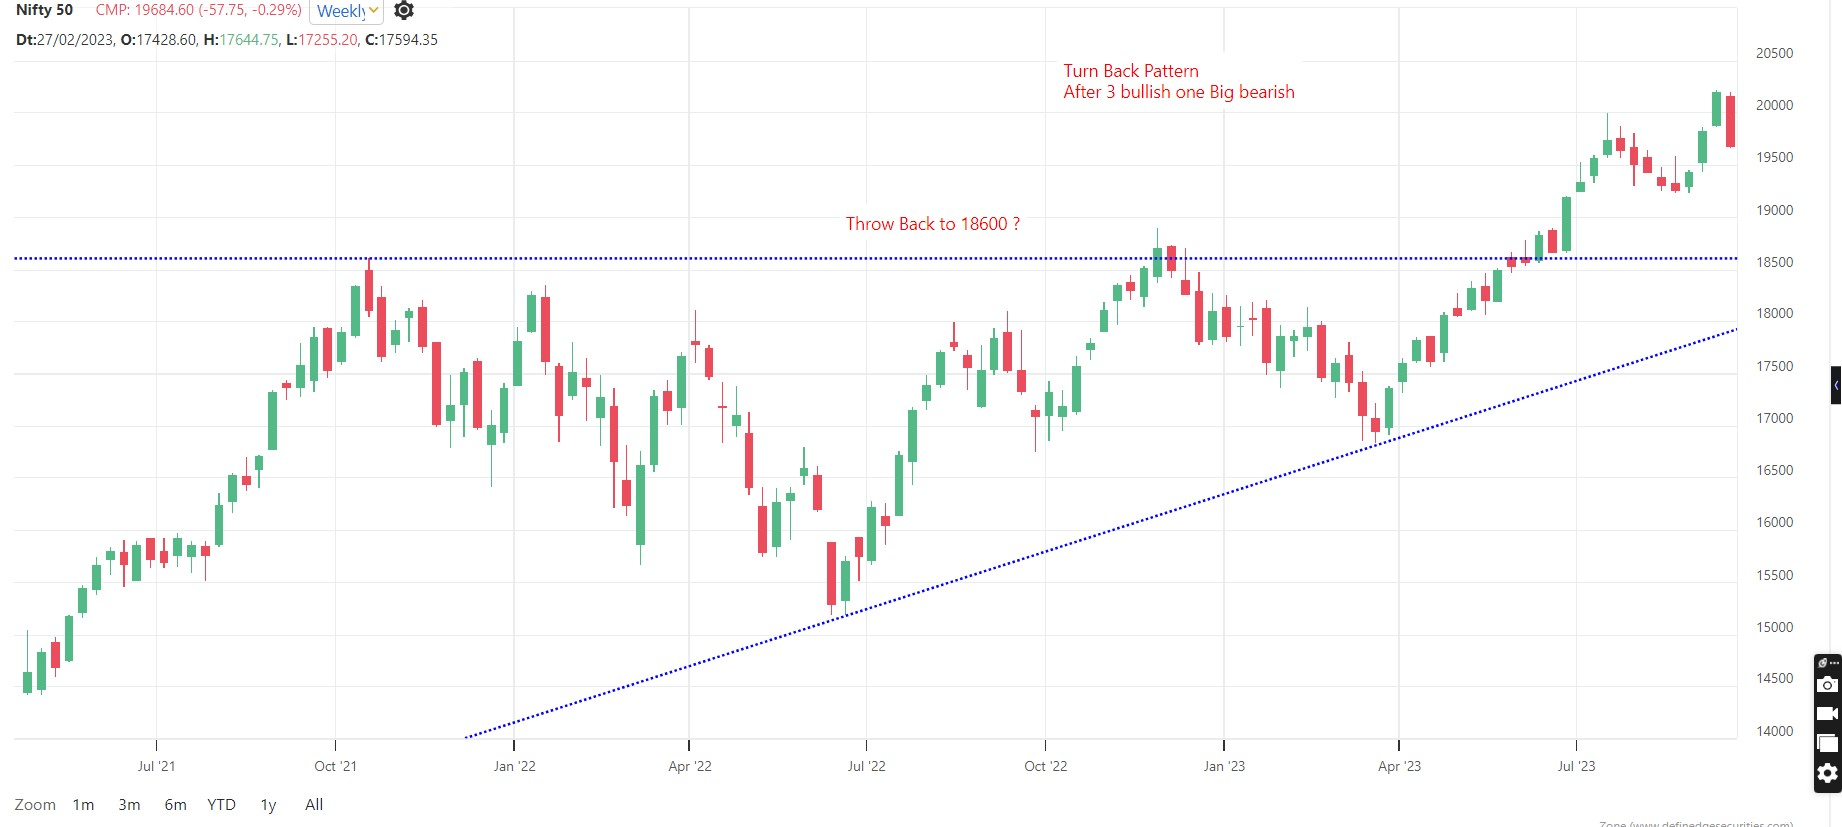
#Nifty 5% Correction ?
Turn Back Pattern on weekly chart
After 3 Green candle now complete strong bearish candle
looks Throw Back towards 18600 another 5 % Correction !
#AhmedabadNest #nseindia #StockMarket #india #analysis #candlestic
NIFTY-Two Reversal pattern with one RARE pattern
1->Probable Cup and Handle pattern breakout above 22720 will confirm the pattern can rally to 23300-23500
2->ISLAND reversal -There is gap down open un filled gap between 22720-22668 if mkt open above both gap and remain unfilled then island reversal and this pattern has high accuracy of forming top and bottom because this is rare reversal pattern
looking at three thing mkt is ready for forming bottom and reversal
Breadth wise at covid levels
Indicator wise near covid levels
Valuation wise near covid levels
Tarrif news is now old that will be sector specific event -if something new panic situation along with weak quarterly results then mkt will further go down
inflation wise only concern is from the deperciation for USDINR that impact on imported food items
my view point for bullishness and mkt bottoming out is 75 % and 25 % for further weakness
accumalting ALPHA & MOMENTUM50 ETF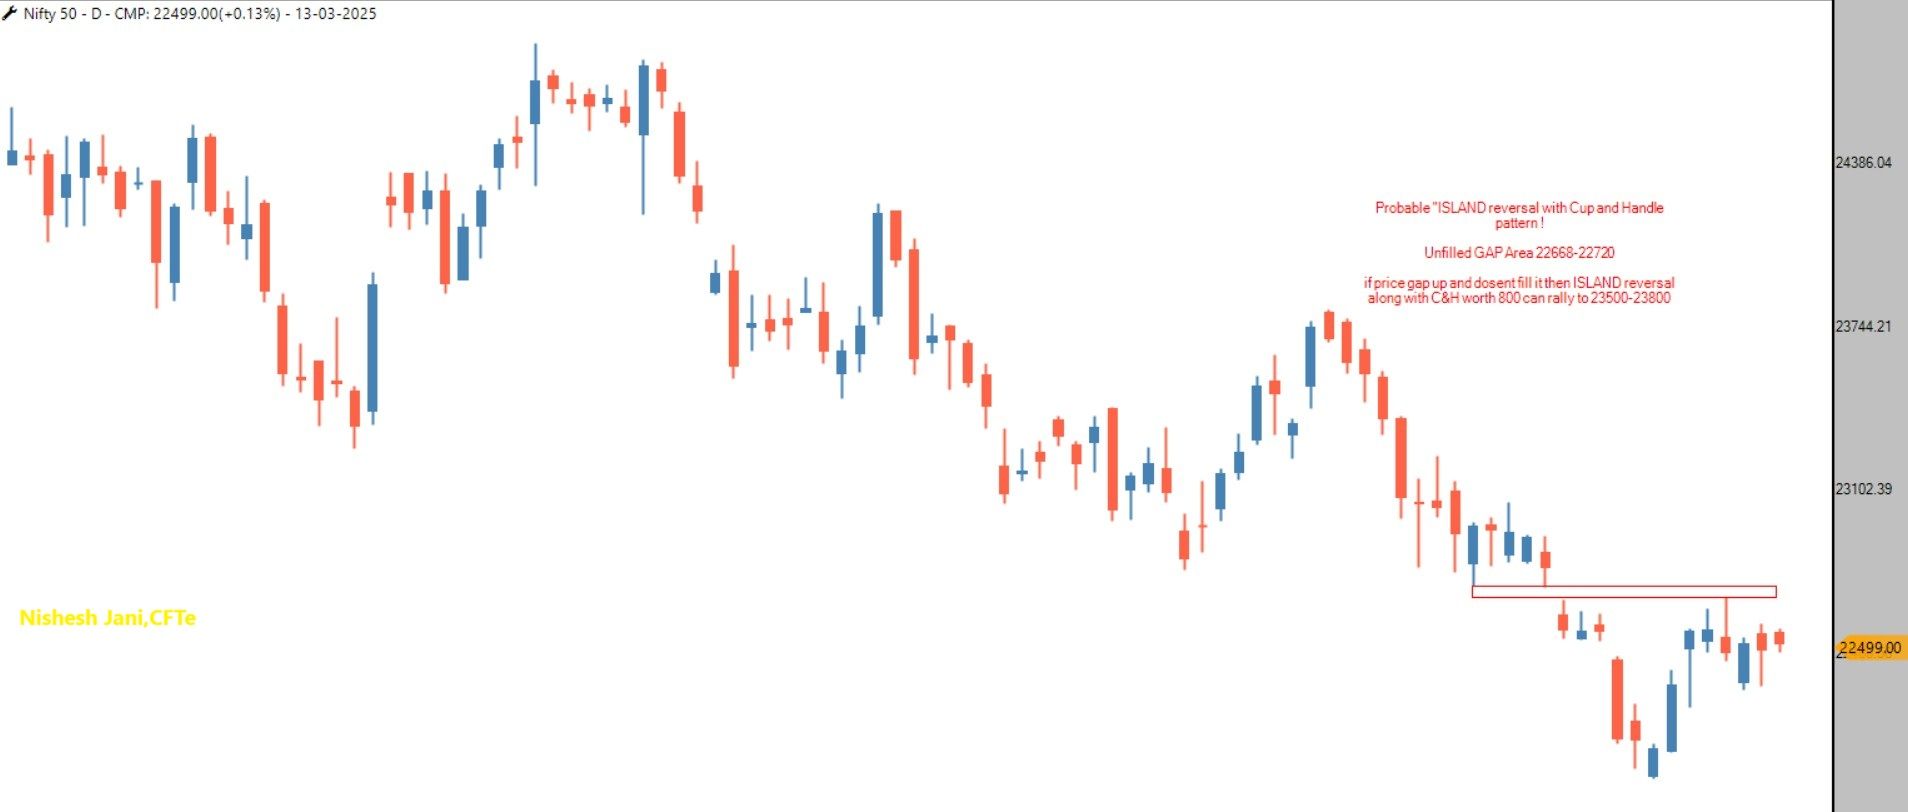
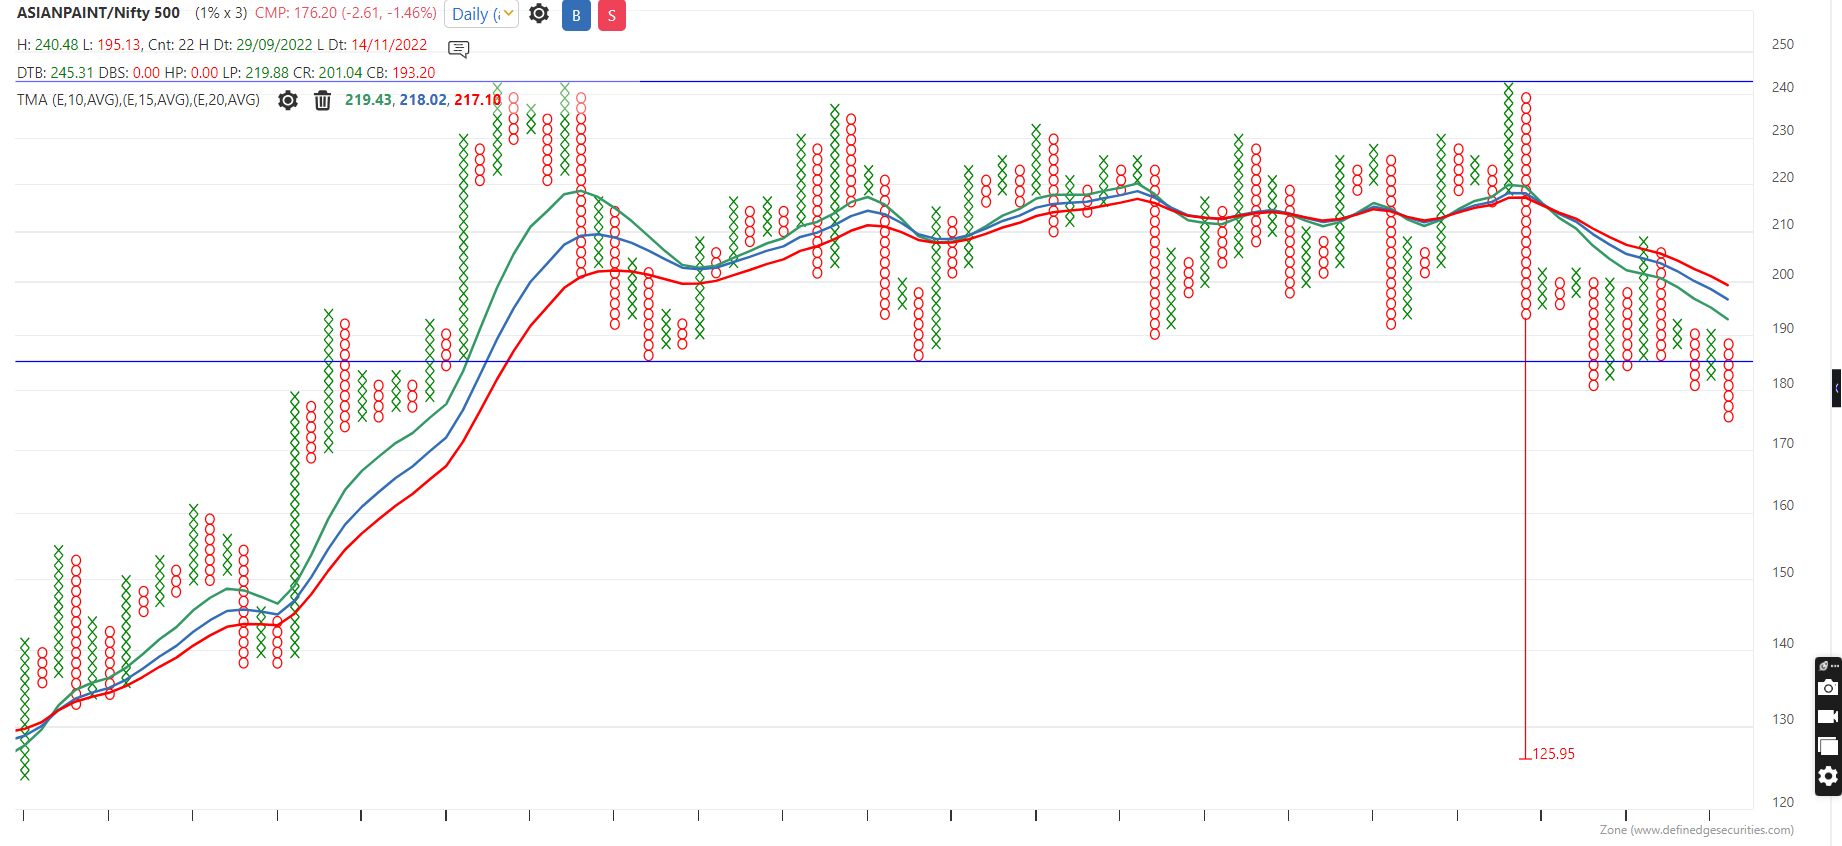
Asian Paints -Ratio chart analysis
Plotted against Nifty 500 with Triple Moving average
Broken below large box
Bearish Anchor Follow thru
TMA negatively allinged
so all in all it looks stock will underperform the market
same thing has happen in reliance between 2008-2016 where it massively underperform the market
if i have only two choice between Asian paints and Nifty 500 i will choose to invest my money in nifty 500 BEES or That index fund till ratio chart dosent turn in favour of asian paints so my pain area reduce and if mkt rise i earn returns
#AhmedabadNest #stockmarkets #AsianPaints #analysis #ratiocharts
Ready for 20 % Rally ?
Look at the attached chart of #Nifty #banknifty
many open verticle counts of Point & Figure charting method -> suggesting another 20 % ++ Rally
in months to come expect nifty 29000-31000 and bank nifty 66000-68000
Negation levels For nifty 23000 and Bank nifty 50000 close below it Bears will control the market.
This could be Starting / base formation phase of my favourite "HORNEY BULL MARKET "
Find new leaders-> we have accumalted ALPHA & MOMENTUM50 ETF/BeeS
NISHESH JANI,CFTe
#AhmedabadNest #Nifty #banknifty #stockmarketsindia #analysis #opportunity #trading #investing #process #approach #nisheshjani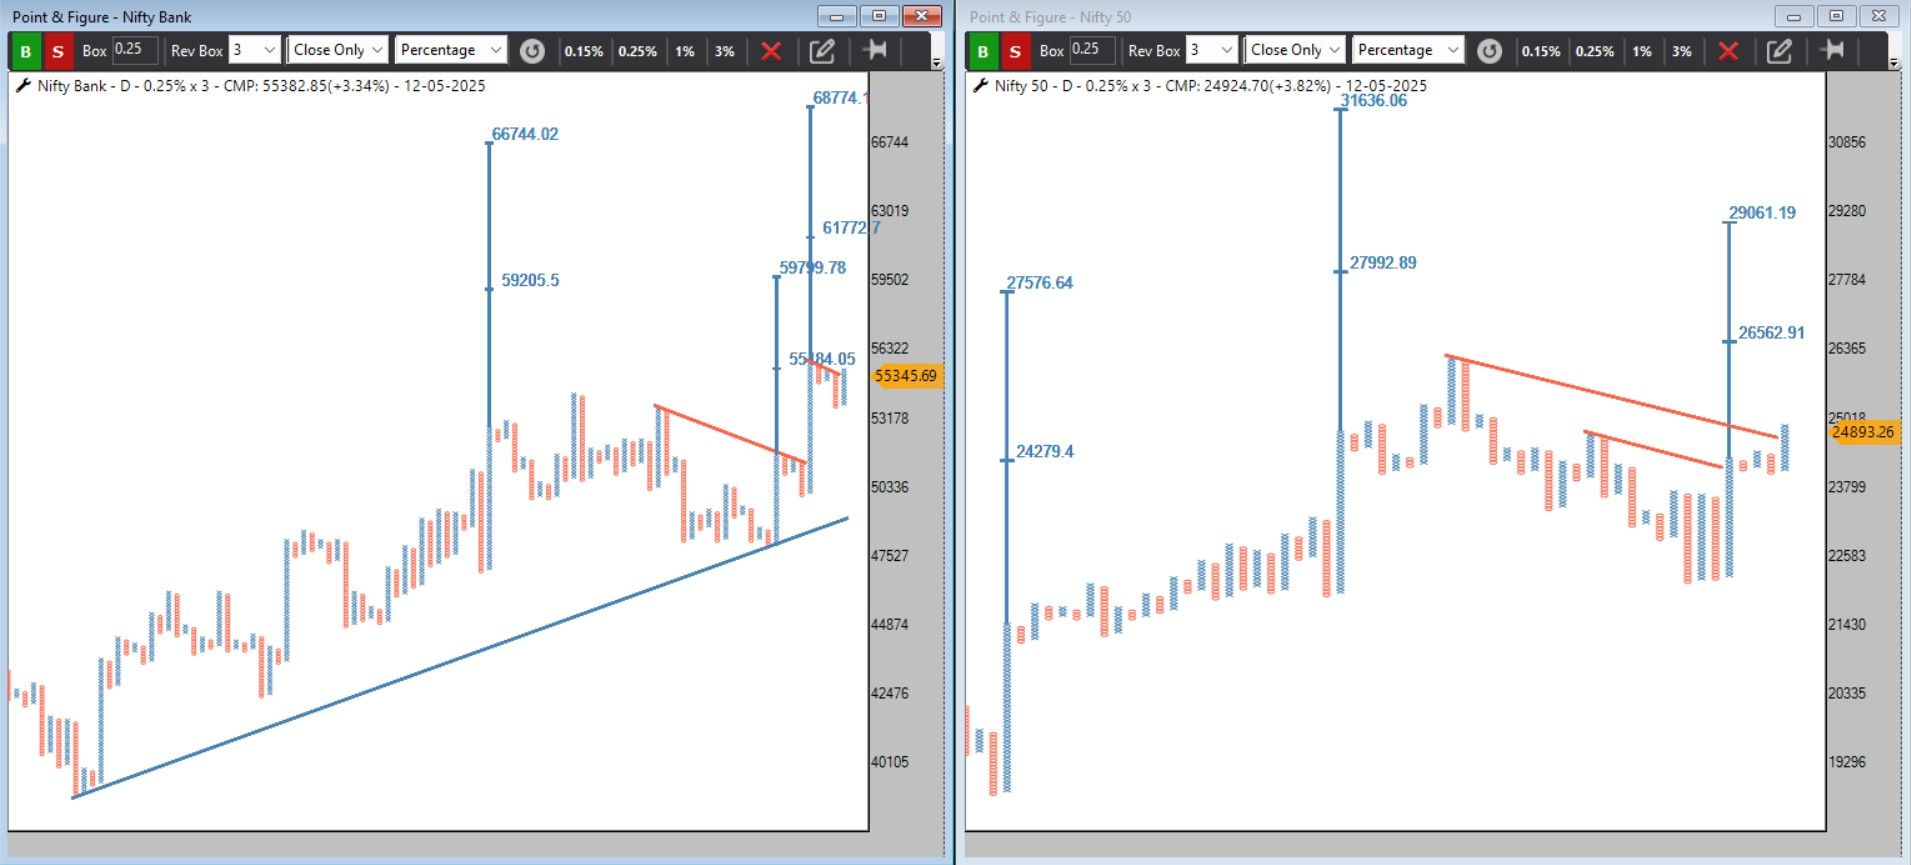
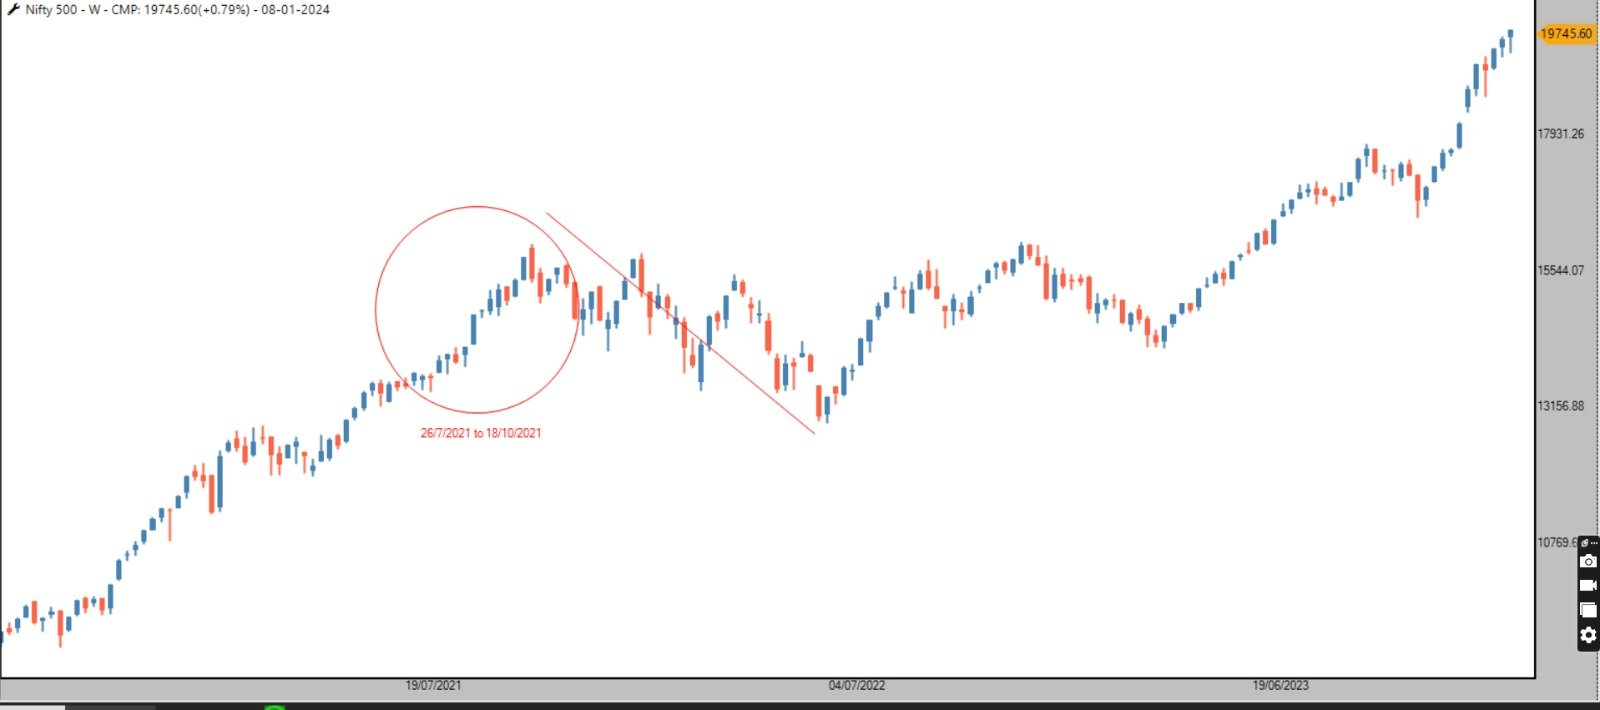
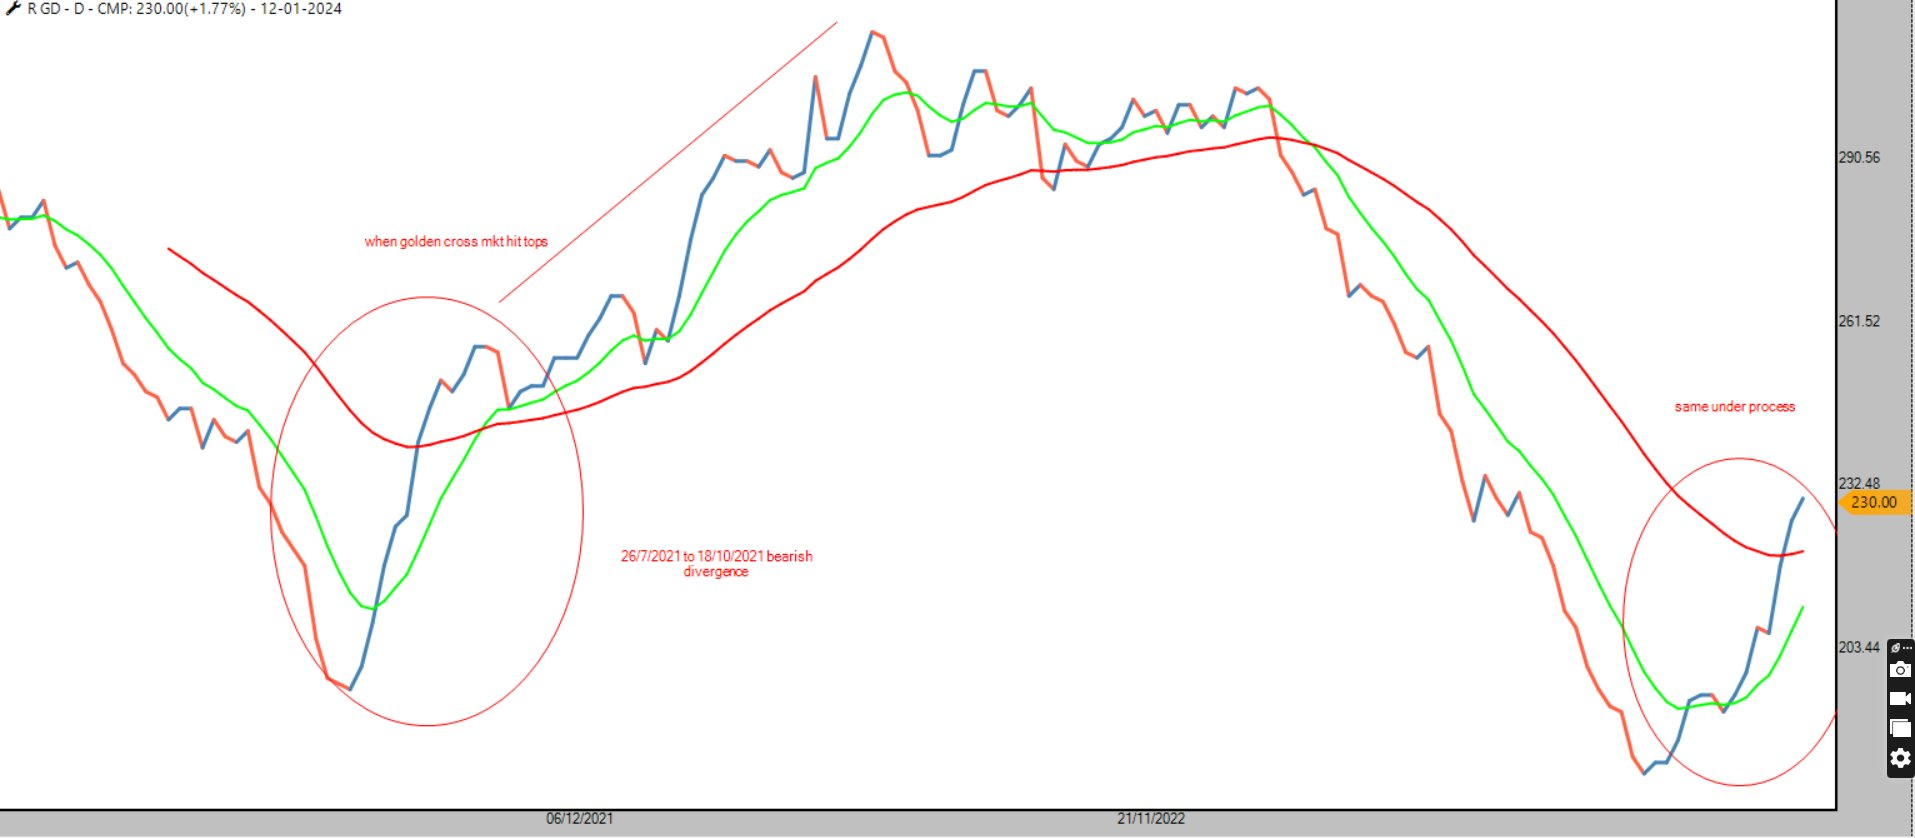
Distribution activity !
look at Nifty 500 price chart and my R GD Breadth chart
same structure happening like 2021 top
when mkt rising in one way this indicator has given golden cross in november 2021 and mkt suddenly made top -currently very close to give golden cross over
#AhmedabadNest #breadth #divergence #analysis #StockMarketindia
 #VGM Stock Pick – BDL
#VGM Stock Pick – BDL
 Corrected from 2100 → 1400, now showing Relative & Absolute Strength with a strong comeback!
 Column Reversal Entry triggered today with Double Top continuation above MAST indicator.
 ️ High pole on long-term chart = gradual recovery expected as trapped traders unwind.
 ️ Risk Management: DBS = Exit Point
 Allocation Strategy → 50% on CR & 50% on DTB
What’s your view – Will BDL march back to new highs? Drop your thoughts below 
Nishesh Jani,CFTe
#StockMarket #BDL #VGMSetup #TechnicalAnalysis #Investing #TradingStrategy #MarketOutlook #StocksToWatch #MomentumInvesting #nisheshjani #AhmedabadNest 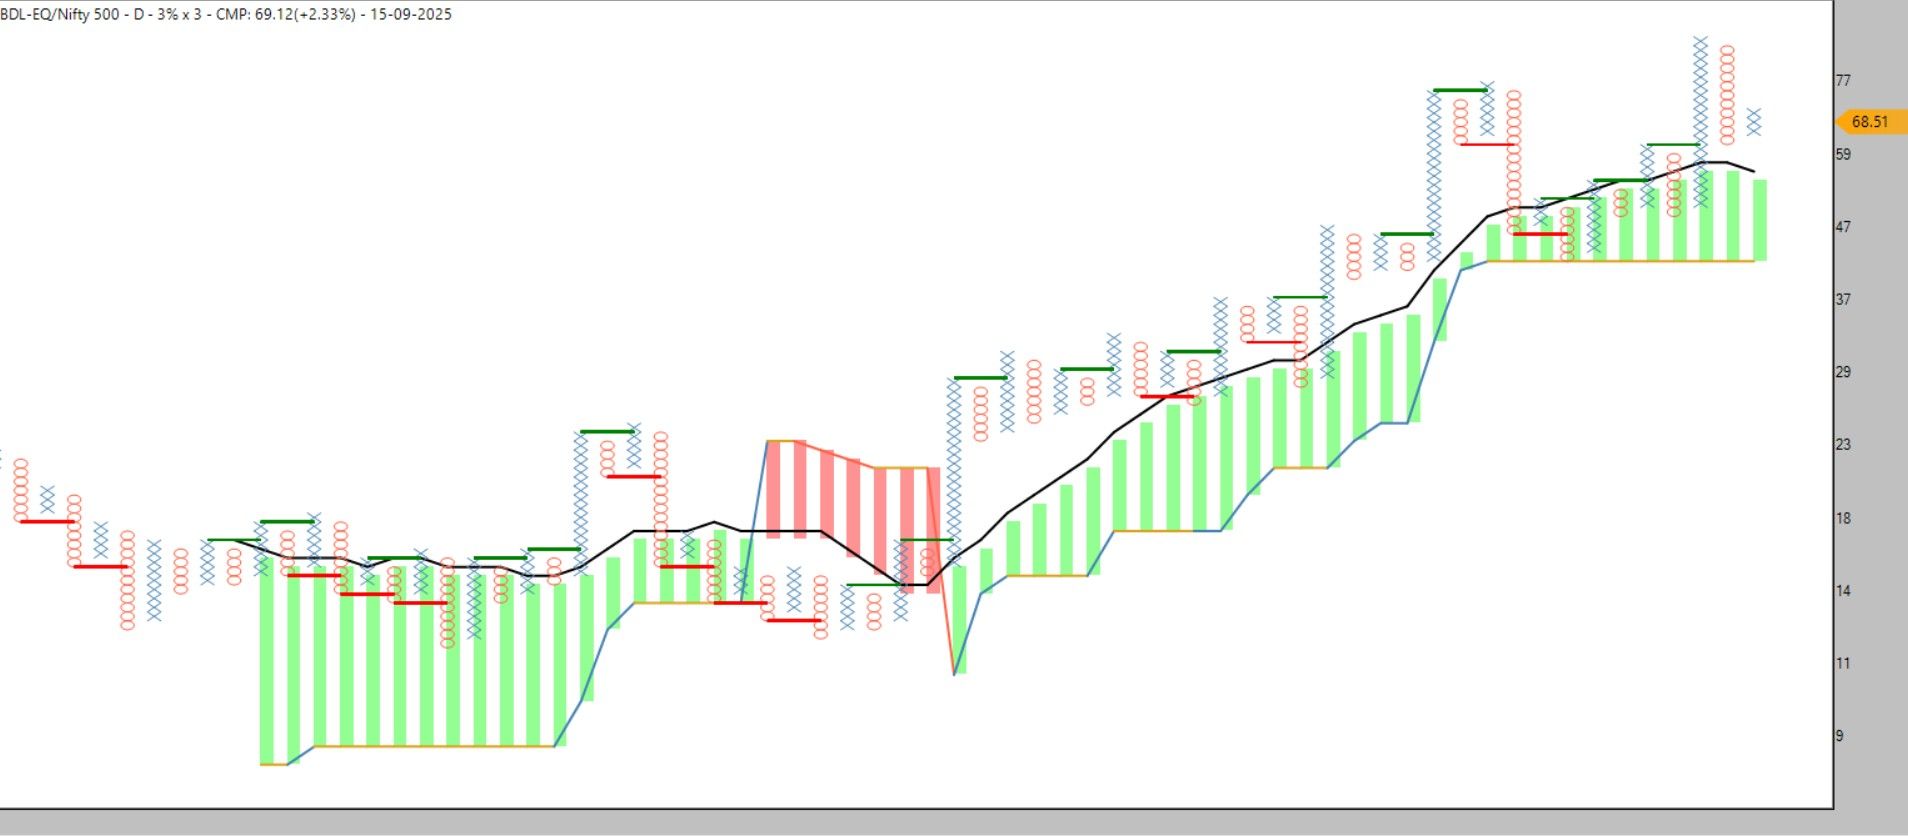
#VGM-Trading & Investing | #EDECNOCH2021
Universe of stock Ready to upload in Desktop & Web version link of Presentation
Ride the out performer and make your team strong Stay ahead with my VGM Setup
https://www.youtube.com/watch?v=yUEdH9dlSHg&t=18s
Those who need can mail me on [email protected]
#AhmedabadNest #system #trading #investing #nseindia #RS #relativestrength #StockMarketindia
@Definedge
Gold vs Equity — The Signal Has Turned!
Gold vs Equity — The Signal Has Turned!
History has a way of repeating itself.
Every time our Smooth RSI indicator on the NIFTY500 vs GoldBees ratio fell below 30 — in 2009, 2011, 2013, 2020, and now in 2025 — it marked a major shift in favor of Equity over Gold.
Each of those moments turned out to be the best time to move from Gold to Equity — and history seems to be whispering the same message again.
When data, trend & time align — it’s not just a signal, it’s an opportunity.
This is the time to increase allocation to Equity and participate in the next growth cycle.
 Let your money work where momentum is shifting — towards Indian Equities.
Homework for you -> On Gold Bees monthly chart add 14 Period ROC % , Spped of Price strength is even the highest of 2008 sub prime crisis and 2020 COVID
Smooth RSI approaching 100
what could be my strategy if i hold GOLD & SILVER Bees?
everyday sell 1% Bees and allocate in my favourite
ALPHA-MOMENTUM50 -MIDSMALL ETF/Bees
Nishesh Jani,CFTe
#EquityOpportunity #GoldVsEquity #InvestmentInsights #Nifty500 #WealthCreation #MarketCycle #SmartInvesting #DataDrivenDecisions #RenkoAnalysis #InvestWithConfidence #nsiheshjani #AhmedabadNest 
Important question for Every trader-> Initial capital Requirment
Gone through many books / videos / course / connected traders and investors who presents excellent strategies but one important aspect about initial capital is not much talked about
Veteran trader and author Ashwani Gujaral sir in his book says you can not control the price movement but you can always control the volume you trade,most traders go bust because of volume ,not price !
For me I have identified few rules which might help you
naked Fu or Hedged Fu keep 3 times margin what the exchange ask For 1 lot
For spread in nifty keep 3 times of margin required by exchange For 1 lot
For naked long options keep 1 lot of margin equvivant to what the margin required to short that option for 1 lot
You can do anti martingale process where you reduce position sizing during drawdown and rising position sizing during favorable period
After seeing this much of margin requirment you will say return will decrease yes it affect but you can use extra margin in other investment like equity portfolio or Instrument like Gold silver ETF if price is favorable and raise Return on investments
Hope you like my words your suggestion / feedback kindly mail me [email protected]
#AhmedabadNest
#nseindia #stockmarkets #position #sizing
️
NIFTY IT – Structural Breakdown on Renko ️
Nifty IT has triggered a clear Head & Shoulder breakdown on the Renko chart around 31,000.
Downside Levels to Watch:
• 27,000 – First major corrective zone
• 24,600 – Extended support if momentum accelerates
 Broader Technical Picture:
Majority IT stocks trading below 200 EMA
Monthly DMI in bearish trend mode
Monthly RSI below 50 → Indicates structural weakness
This suggests the correction could be deeper and time-wise extended, not a one-way fall.
Expect intermittent pullbacks toward resistance, but probability favors lower lows unless structure reclaims strength.
 Strategy Focus:
Trade with trend. Avoid aggressive bottom fishing until reversal signals emerge.
Nishesh Jani,CFTe
#NiftyIT #StockMarketIndia #TechnicalAnalysis #Renko #SectorRotation #MarketOutlook 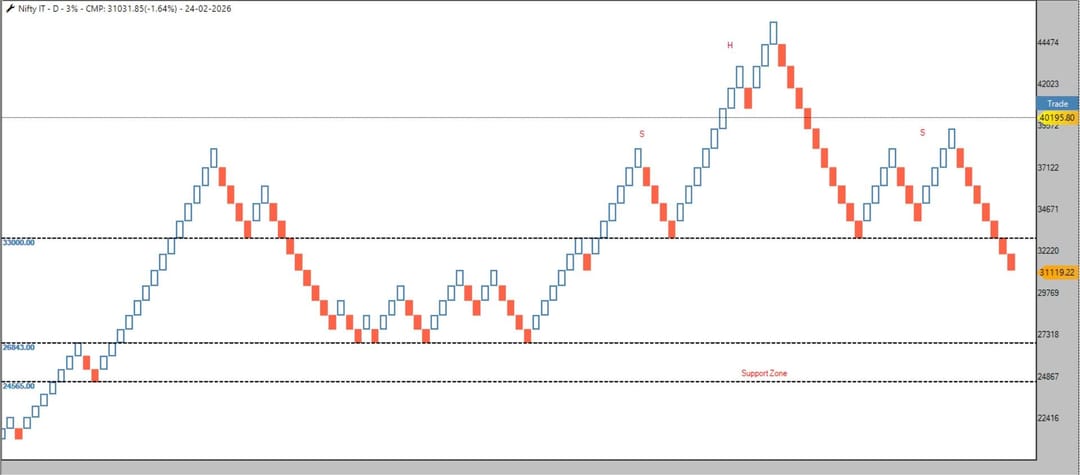
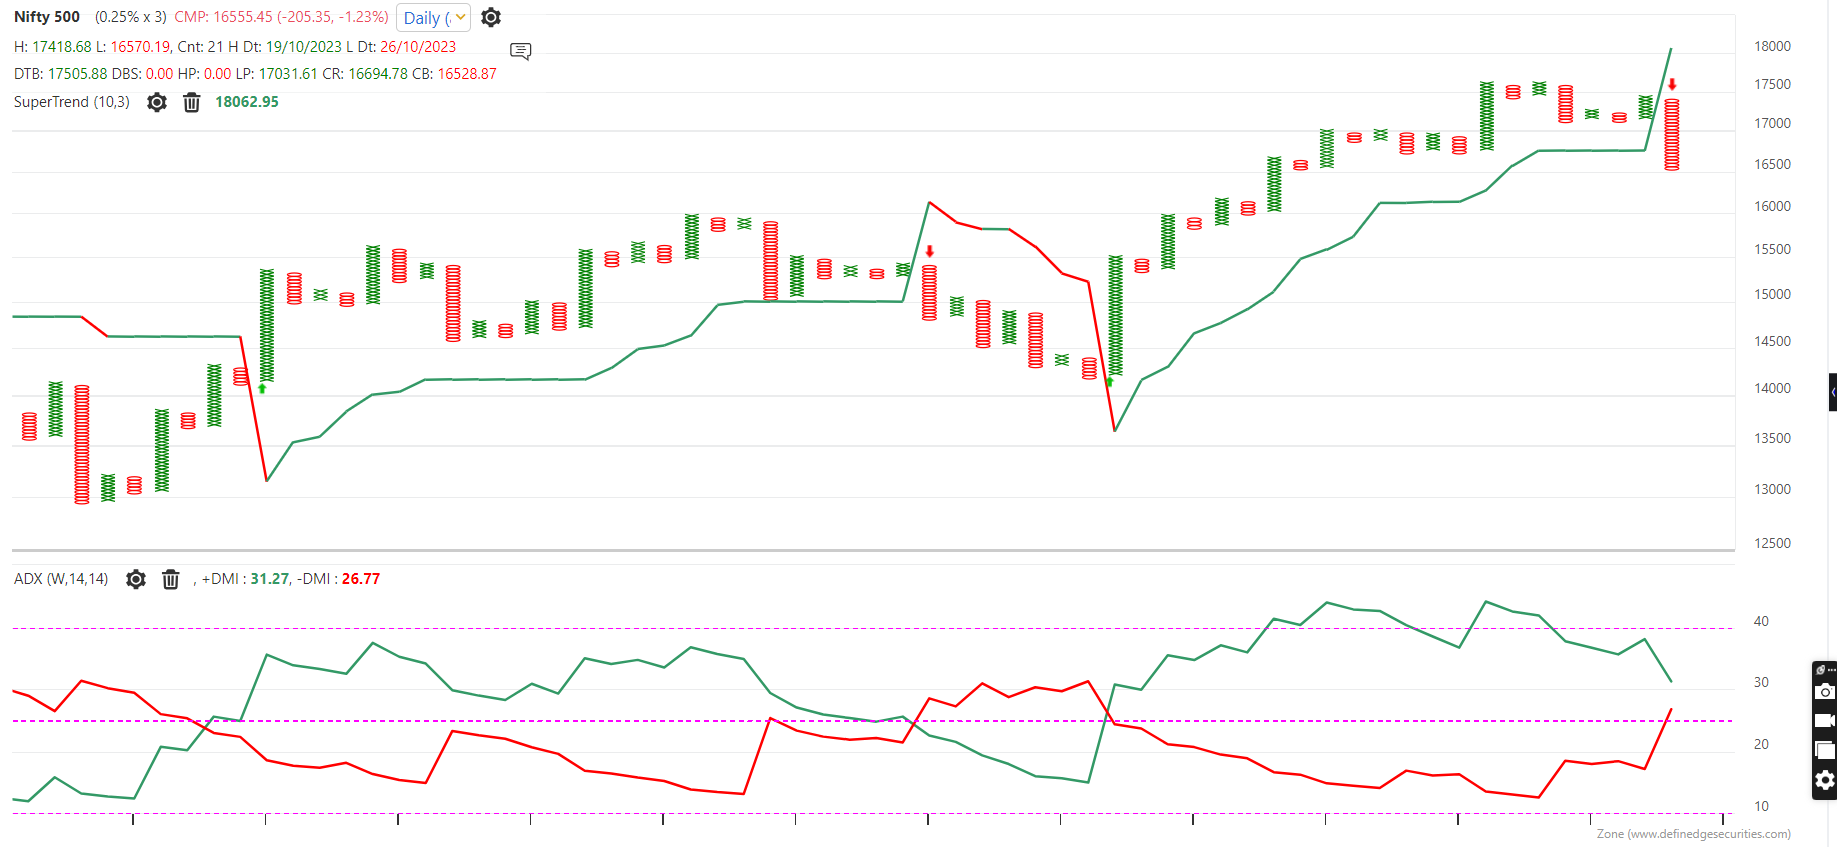
R GD-> Market timing Model
Updated chart -> Generate exit signal on 23/02/2024 now continue in exit mode
this suggest overall weak market structure
Avoid leverage/Margin Funnding
Tight Trailing stop losses
Avoid buy on dips look for Gold/Silver as earlier indicated for breakout and entry into this asset class
#AhmedaadNest #breadth #DataAnalytics #stockmarkets #India #analysis
Since mid of 2020 i am using the Definedge Desk Top & Zone when i joined AhmedabadNest ,last year when Launched Securities at the event of Ahmedabad slowly i shift to Definedge Securities for my Trading -specially Nifty Spread under the guidance of @AP sir
now Definedge has come with exiting Independence Day Offer with much cheaper price for DMAT account holder & the amount paid for software will be adjusted againt the brokerage which is win win for users like me -so i just renewed the Securities DeskTop & RZONE for one year
i again thank you @Prashant-Shah sir @Definedge Team for creating such good software /Study at much affordable Price
Thanks and Regards
NishshKumar Jaani
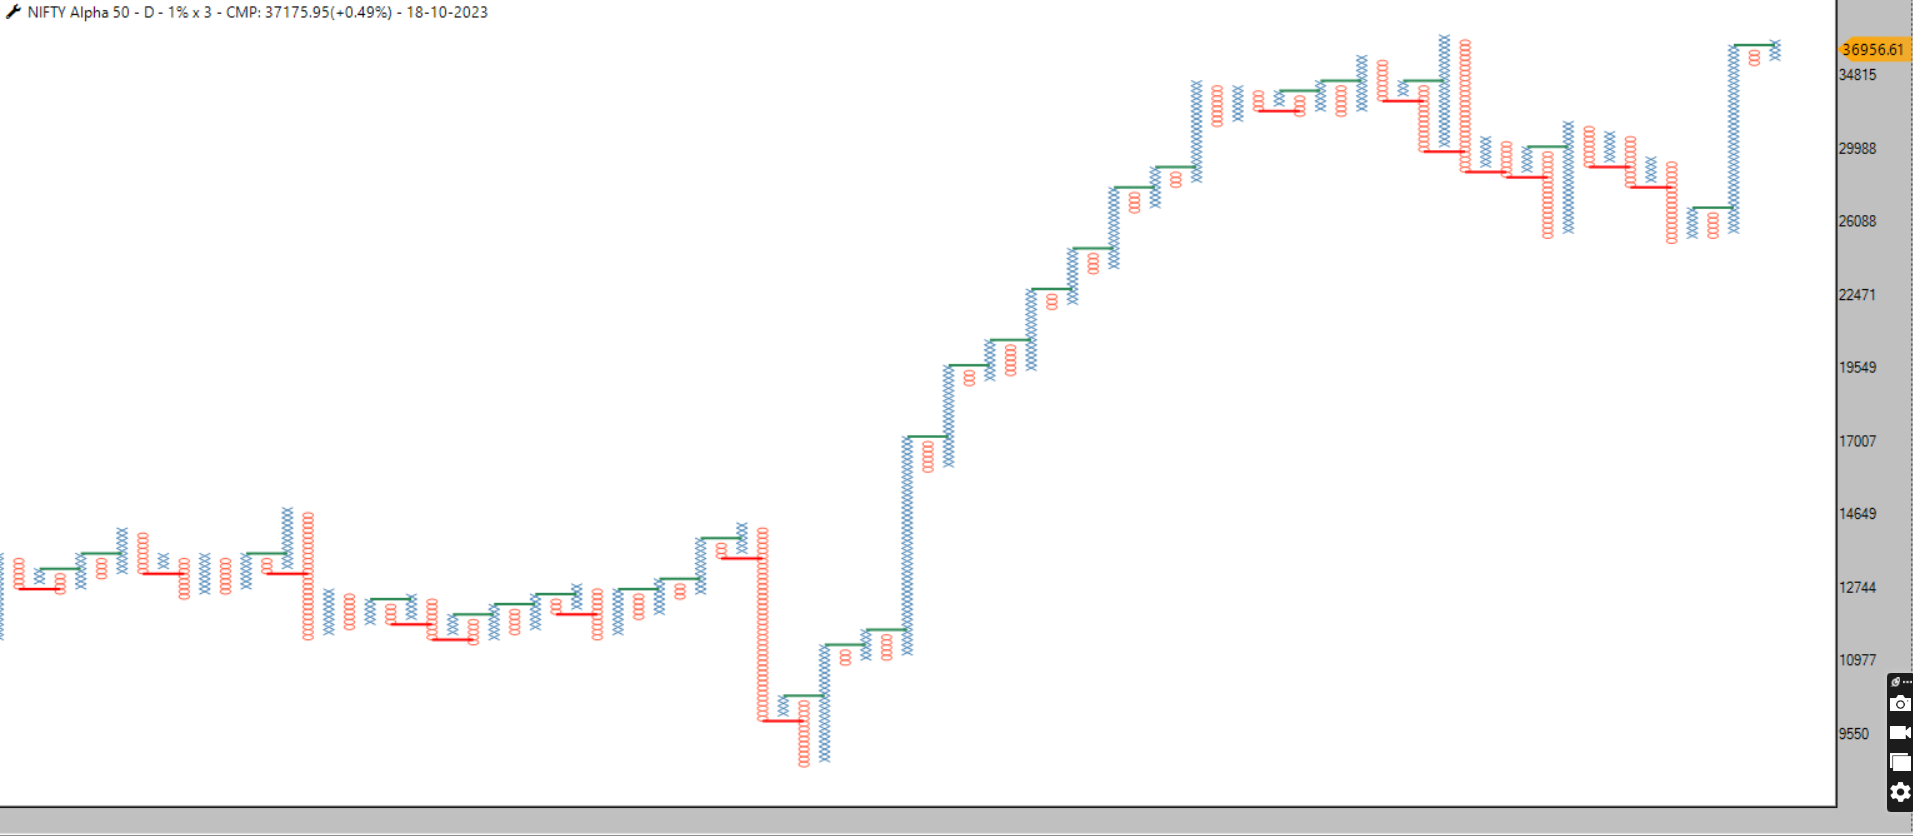
NSE Index Rebalance Update – Alpha 50
NSE has announced the latest rebalance for the Alpha 50 Index / Alpha ETF, where ~24% of the portfolio is being reshuffled.
This means:
Underperforming stocks are being removed
New high-potential, outperforming stocks are being added
What does this mean for investors?
Index rebalancing is not just a routine activity—it’s a structured process to maintain momentum and quality in the portfolio.
Systematic Profit Rotation: Capital shifts from laggards to leaders
Momentum Capture: Fresh entries typically reflect improving relative strength
Disciplined Investing: No emotional bias—pure data-driven replacement
Key Insight
Alpha-based indices are designed to stay aligned with performance leadership, not just market size.
This is exactly why such indices tend to outperform traditional benchmarks over time—they continuously evolve.
Investor Takeaway
Rebalancing = Opportunity Reset
New entrants = Stocks to track for momentum setups
Removed stocks = Signals of weakening trend
Stay aligned with strength, not attachment.
Nishesh Jani,CFTe
#NSE #IndexRebalance #Alpha50 #SmartBeta #MomentumInvesting #ETFIndia #StockMarketIndia #WealthCreation #nisheshjani #AhmedabadNest 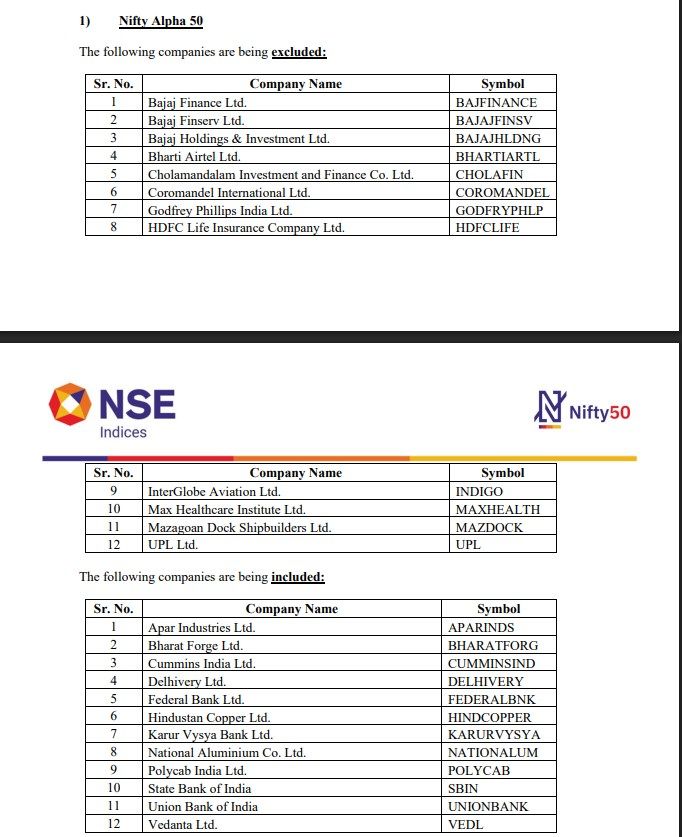
Team @Definedge kindly add facility to plot exat Horizontal levels by writing like trading view give option to both desktop and web version
 Flash Update – Market Alert
Flash Update – Market Alert
99.99% probability: Horny Bull Market – Stage 1 is getting confirmed 

Early signals of accumulation are visible across indices — this is where smart money quietly builds positions before momentum becomes obvious.
Strategy:
Stay invested, start accumulating leaders, and be prepared for the next leg of expansion.
“Stage 1 is silent… Stage 2 is explosive.”
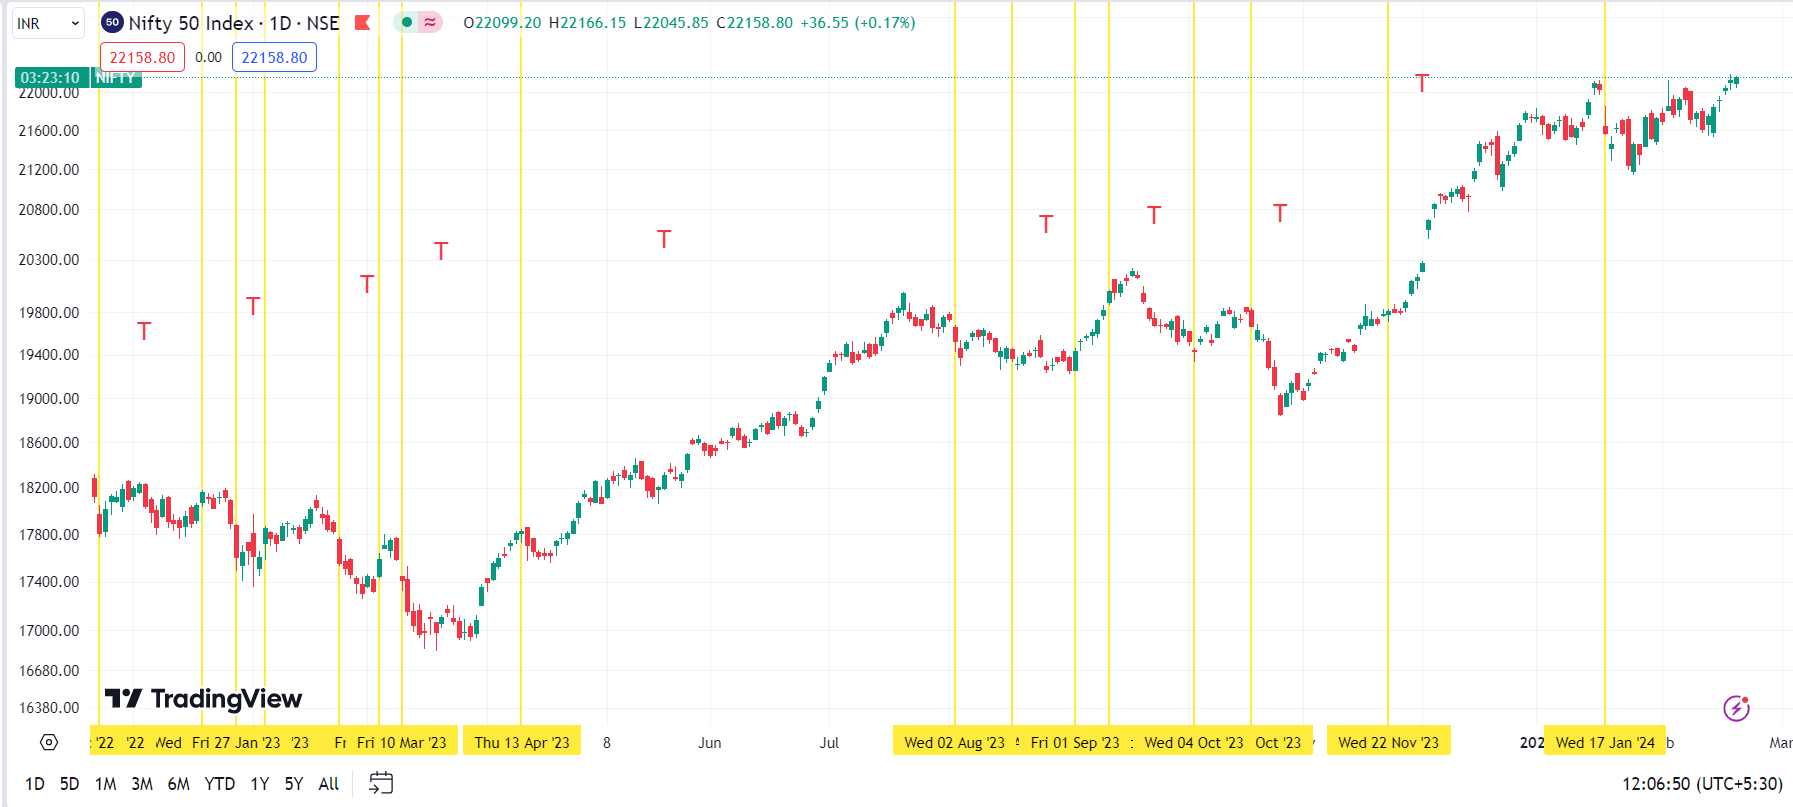
Are you a trend follower ? if yes then this post is for you
as a trend follower traders buy and sell & trade every movements of index or stock particular to get maximum benefit of the every twist and turns of that particular security.
like me you may have also face situation where trend following has extremely favourable time and extremely whipsaw phase
in times of whipsaw phas trade loose two important thing
A-> Capital
B-> Mental fitness
and due to both trader stop following strategy and step into finding another holy grail strategy and keep doing it
The real problem is not in the strategy it has the characteristics of generating super return and whipsaw phase the real problem is to find out the most beneficial period where the strategy has high chance of generating return
A->Fast
B->Easy
C-Consistance
No security has constant trending move ever so as a trend follower one need to findout the
TRENDING Moves where fast-easy-consitance move comes
see attcahed image where i have marked T which is the phase where security has TRENDING move at that time run trendfollwing strategy to get benefit and where there no T this is the phase where stop taking trades
Hope you love reading the article
Thanks and Regards
Nishshkumar Jaani
 ️
️
Gold vs Equity Rotation – A Timely Signal ️
During Diwali, I shared an observation on Nifty 500 vs Gold Relative Strength:
Whenever Smoothed RS dips below 30 →
It has historically been the best zone to rotate from Gold to Equity
Global uncertainty & war-led panic recently gave that exact opportunity — equities were available at favorable levels while fear was high.
Fresh Observation:
Now adding another powerful layer:
 ️ When Smoothed RSI < 30
️ AND it gives a crossover above its EMA
 ️ This confirms momentum shift towards Equity
 Message for Gold Investors:
“Waqt rehte sambhal jao… warna waqt samjha dega.”
This is not about abandoning Gold —
This is about recognizing cycles & reallocating smartly.
 Mentorship Insight:
Markets don’t reward comfort.
They reward timely rotation + conviction backed by data.
Right now, Risk-Reward is tilting towards Equity.
Nishesh Jani,CFTe
#AssetAllocation #RelativeStrength #EquityVsGold #MarketCycles #SmartMoneyMoves #Nifty500 #InvestingWisdom #goldbees 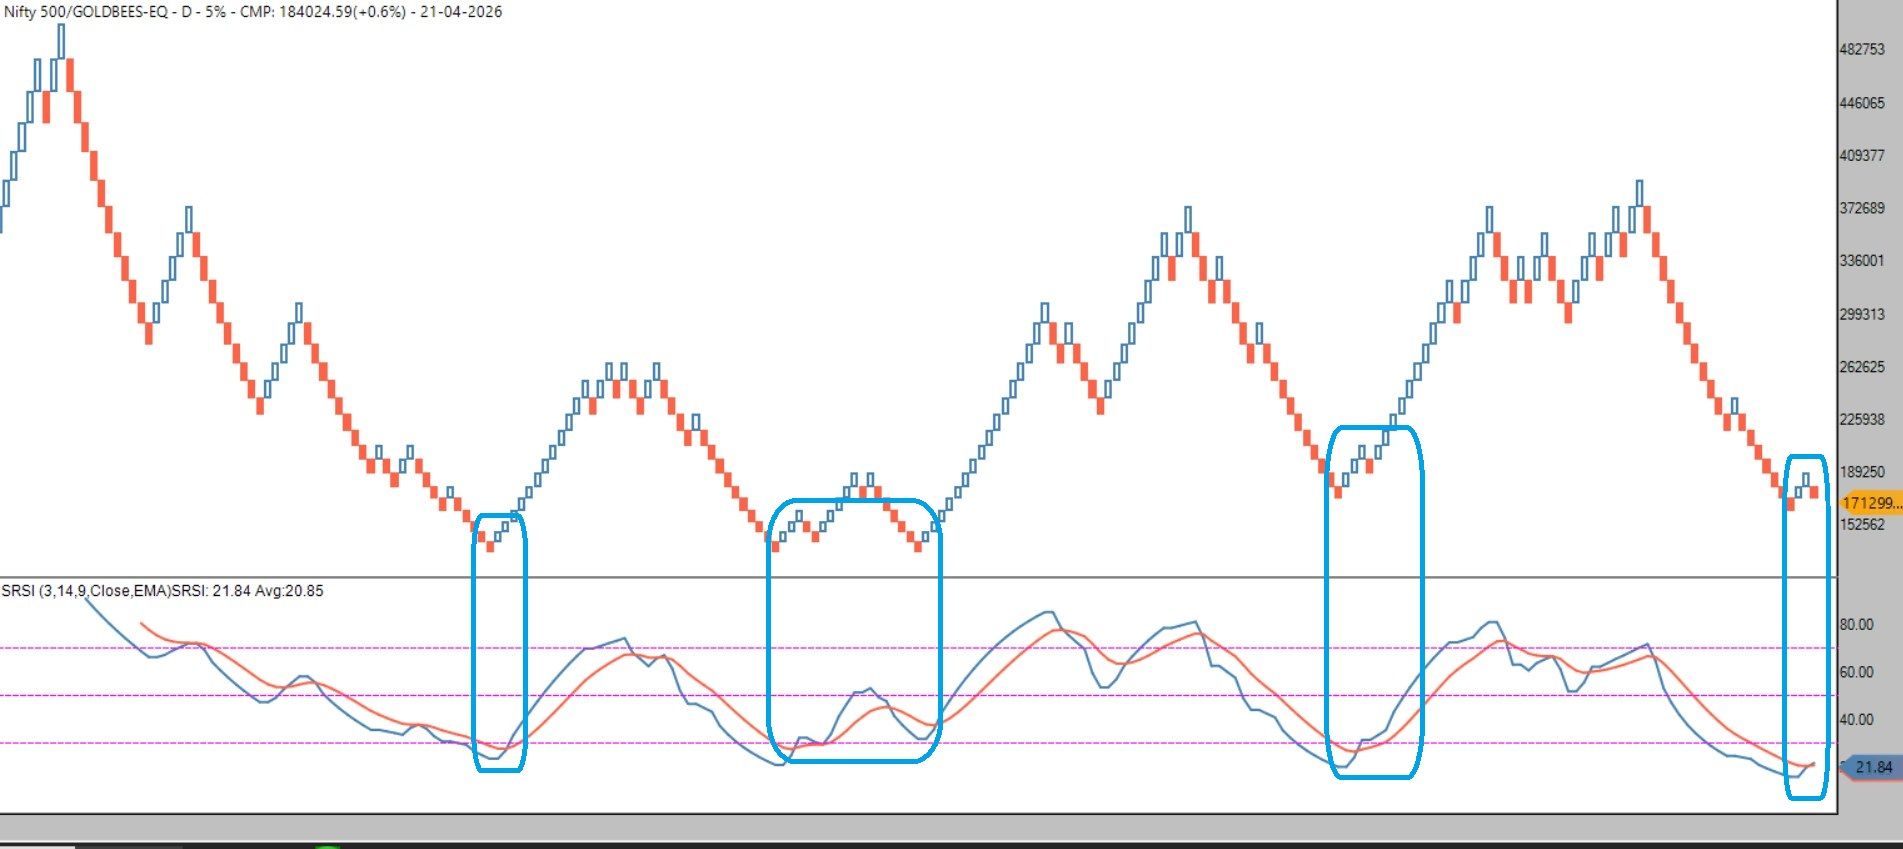
add each strategy in sample and on click button to start back testing by just simply changing the universe
along with portfolio return calculation add Benchmark index return along with virtual and actual strategy on momentify platform
hello @Definedge @@Definedge-Experts
kindly add sum chart in P&F FUSION MATRIX SCANNER
Thanks and Regards
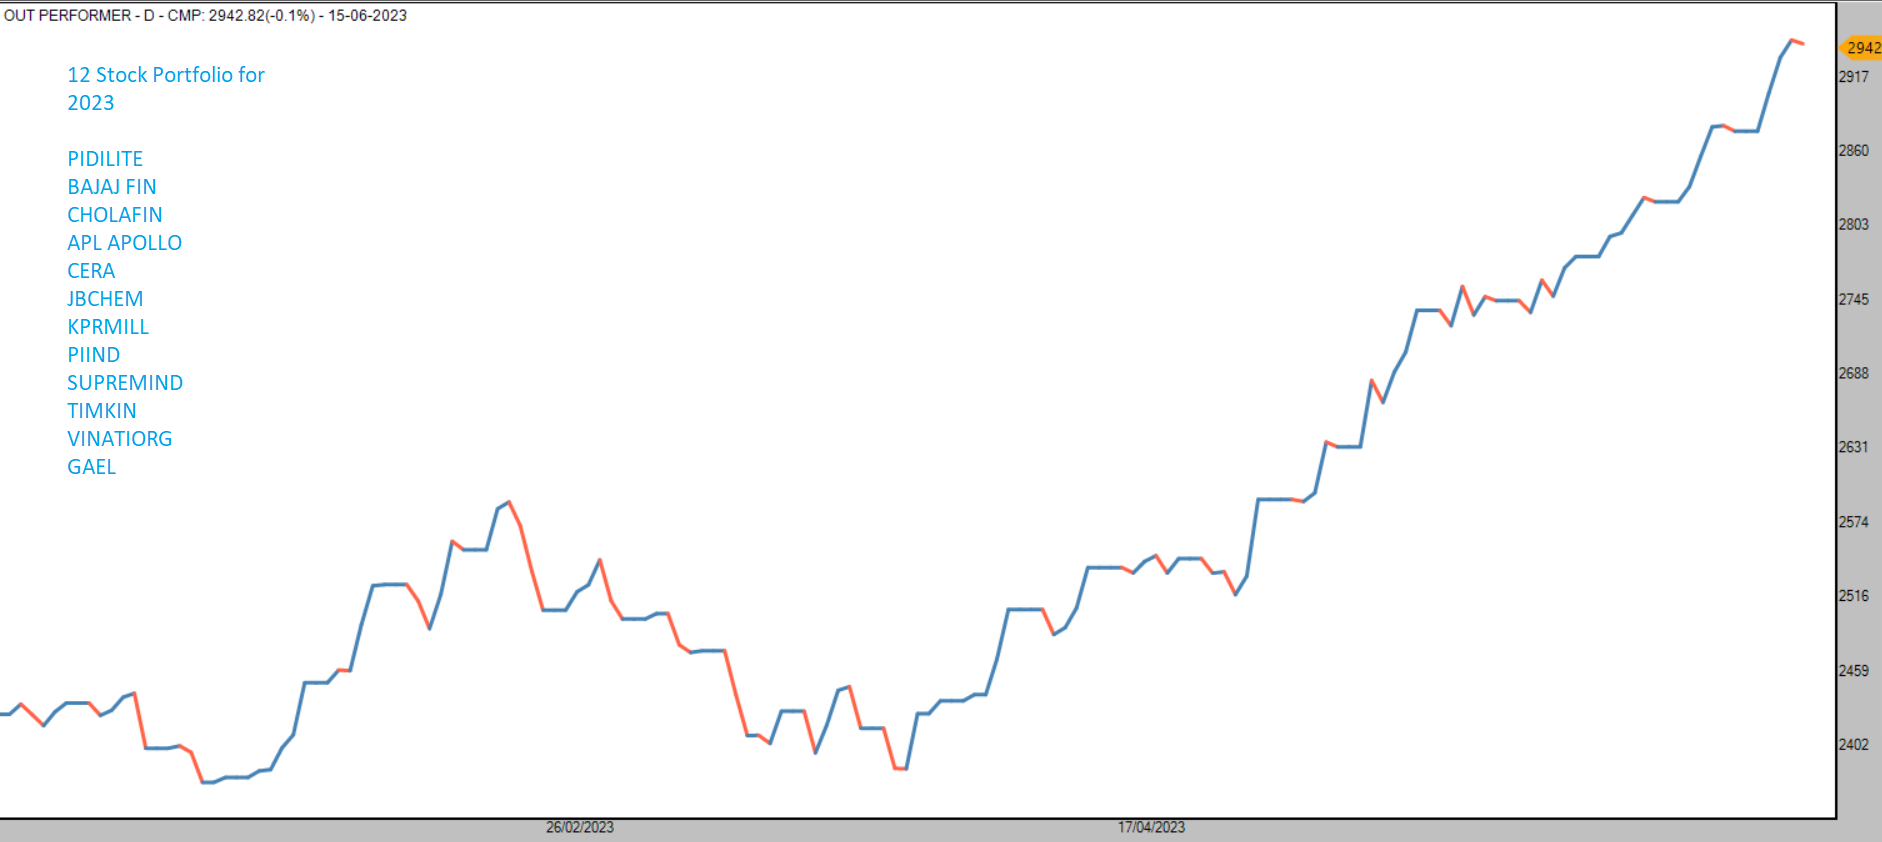
12 Stock equal weighted portfolio for 2023
Idea is create equal weighted portfolio in software use your favourite pattern to trade the entire portfolio
#AhmedabadNest
Currently allinged to bearish
underlying index on 89 EMA High-low Channel which can act as Support /Reversal zone
do light quantity
created strategy on quarterly re balance - i saved but it is showing re balance on august actual should be in july-if i add 78 daya from tomorrow it will re balance in august while as per quarterly basis it should do in july
Mkt has enterd into overbought /Euphoric Zone
last time seen between 14/8/2020 to 26/11/2021 in this time nifty 500 Gain 59 %
Average Return was 4.21 % Per Month
Idea is to do momentum trading with Stop Loss & Risk Management
kindly given open to chnage the stock universe at leat at the time of re balance data that will be good if i am scanning on my own stocks based on some criteria or tracking MF/PMS portfolio which chnages it stock list
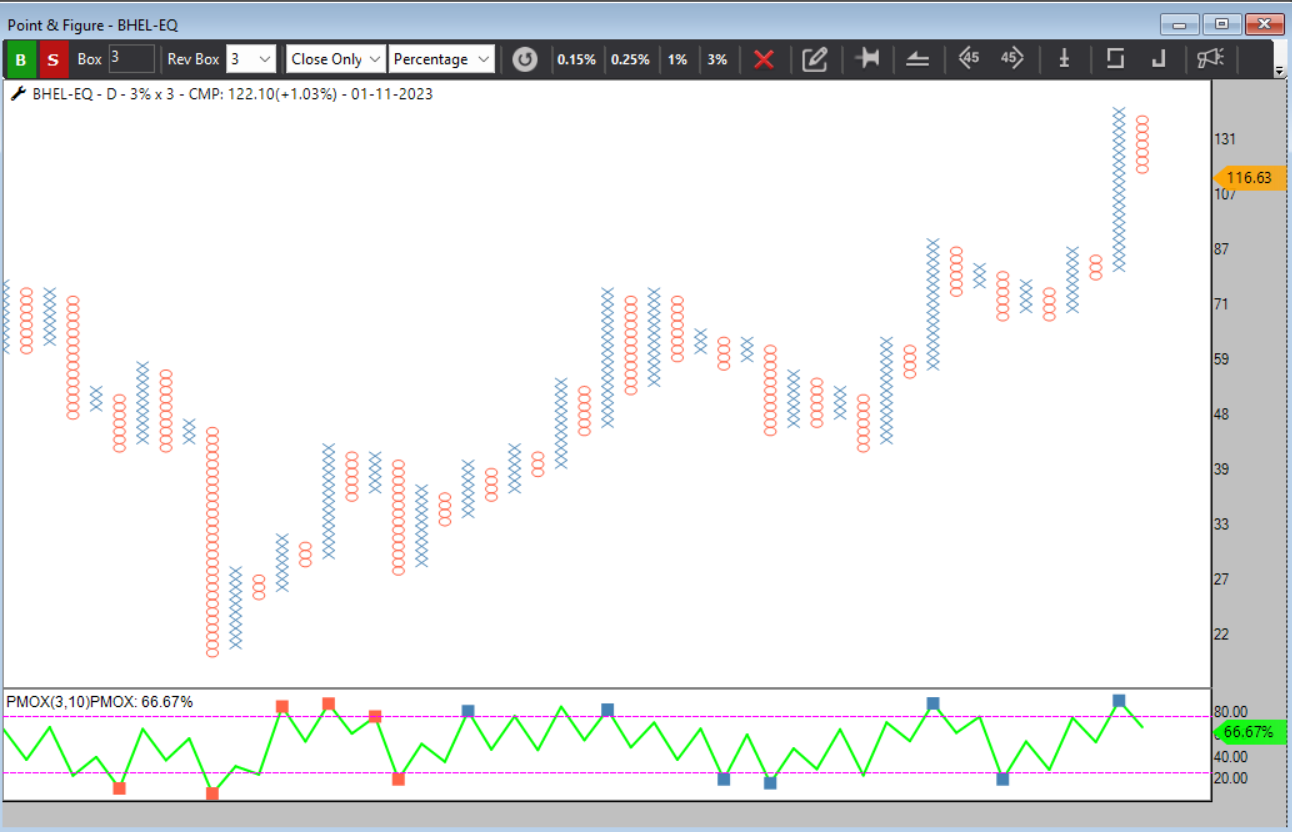
Today shown Raju sir video on PMOX very good analysis
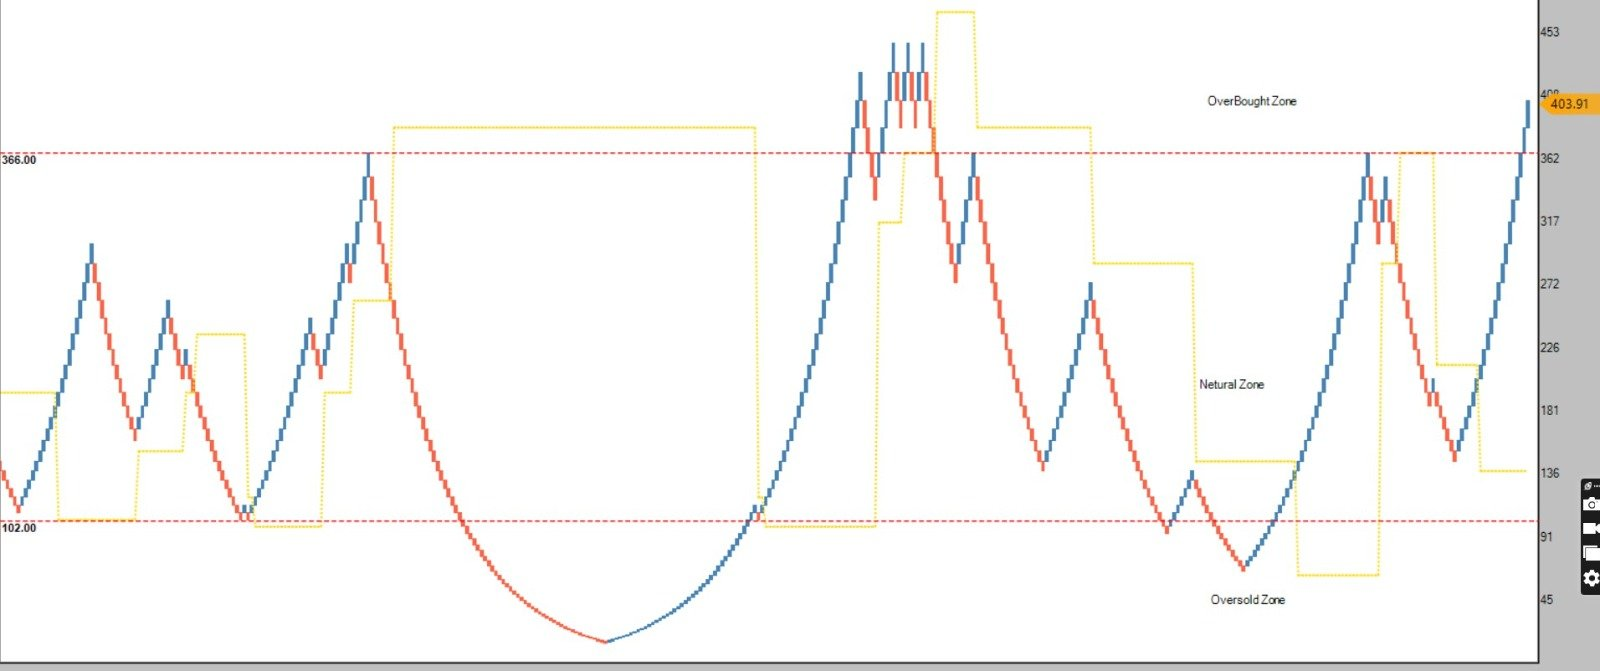
Stock Gives Bullish Momentum & oversold in bullish momentum AND Bearish momentum & over bought in bearish momentum
after that it goes into NETURAL zone between (75 to 25 )
when i scan it will show me oversold-over bought & bearish bullish momentum but after that PMOX indicator will fall into netural zone now in that condition i have to manually go and check weather stock is in netural zone after bullish & bearish momentum that will be time consuming
so my suggestion is that when PMOX is in netural zone put lable that this netural zone is followed by Bullish or bearish momentum so i can plan my entry
see chart of BHEL currently in netural zone but that is after Bullish momentum that i have to check charts by charts
@Prashant-Shah @@Definedge-Experts
to get this euphoric move need green line above red line -once that happen will update
 add
add
In Ultimate Matrix of P&F -Renko for look back period give date selection tab so one do not need to calculate how many days he needs to go back he just can select this dates like i run of may be thursday so i have to calculate past days from current and with this i need to remember the trading holidays also otherwise result will be wrong so give direct date
plus rise the look back period from 100 as we are having the data with us ,if not possible on web version give in Desktop
@Prashant-Shah @Definedge @@Definedge-Experts
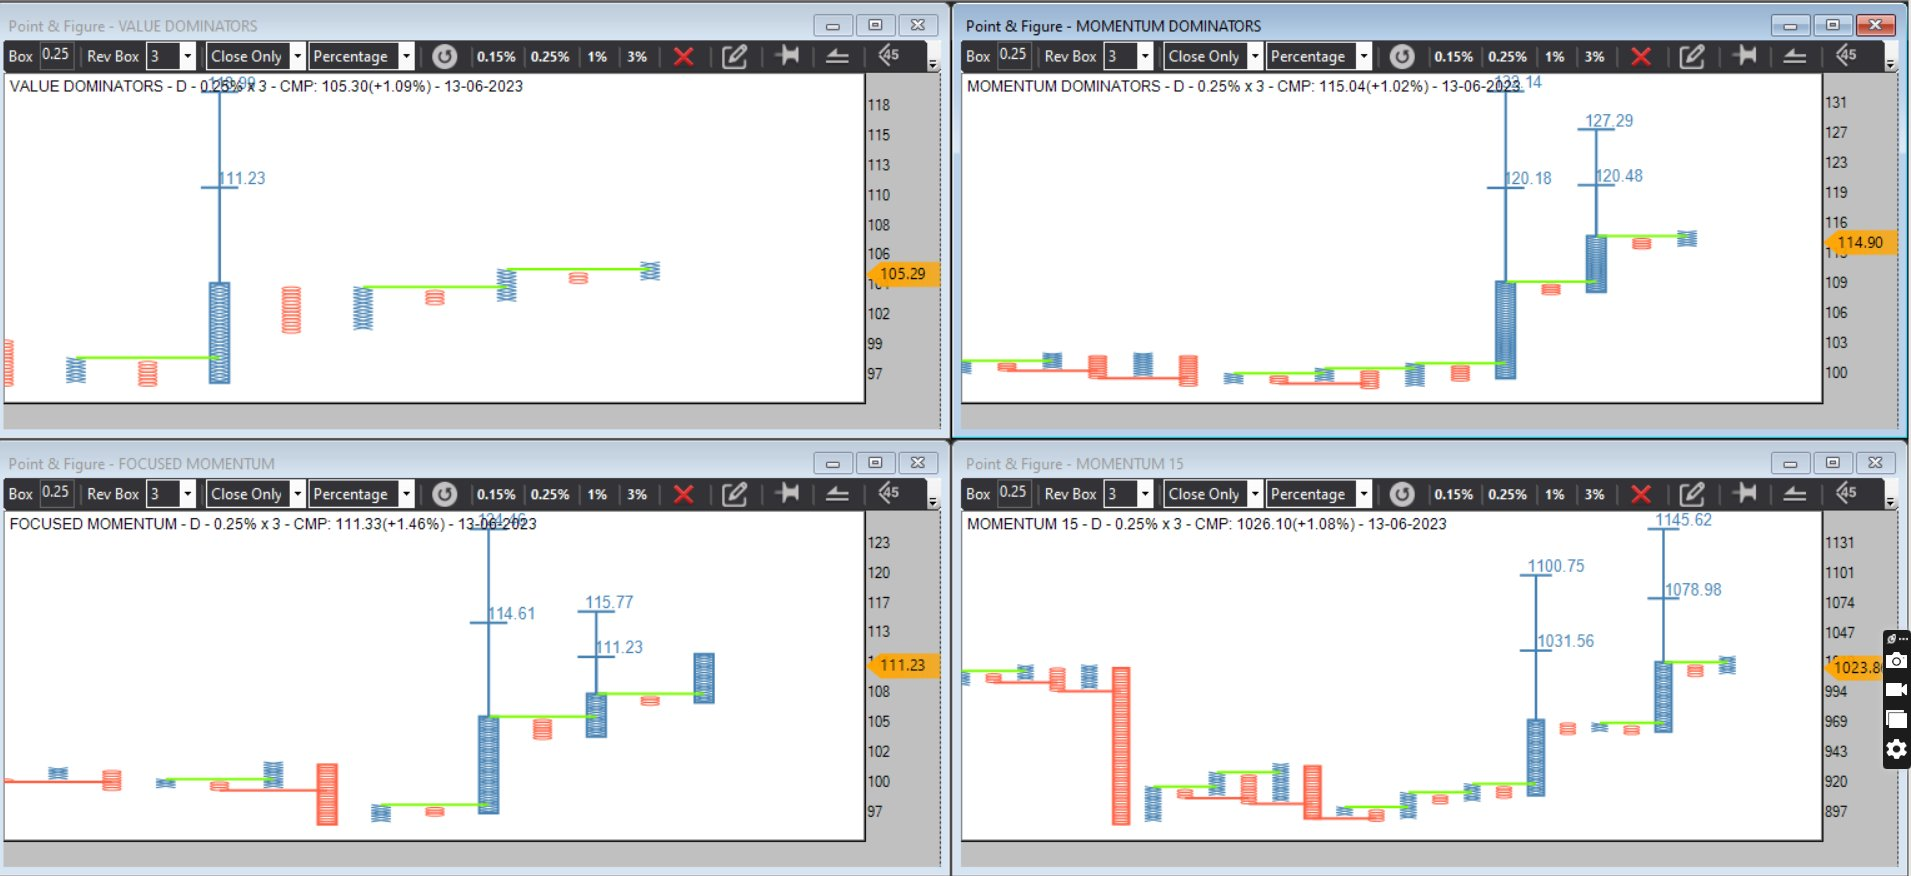
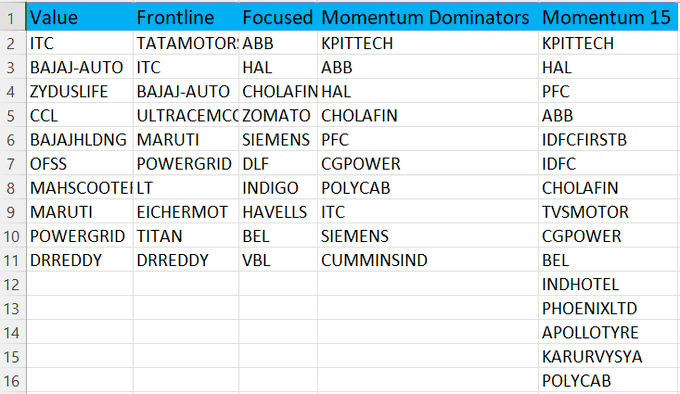
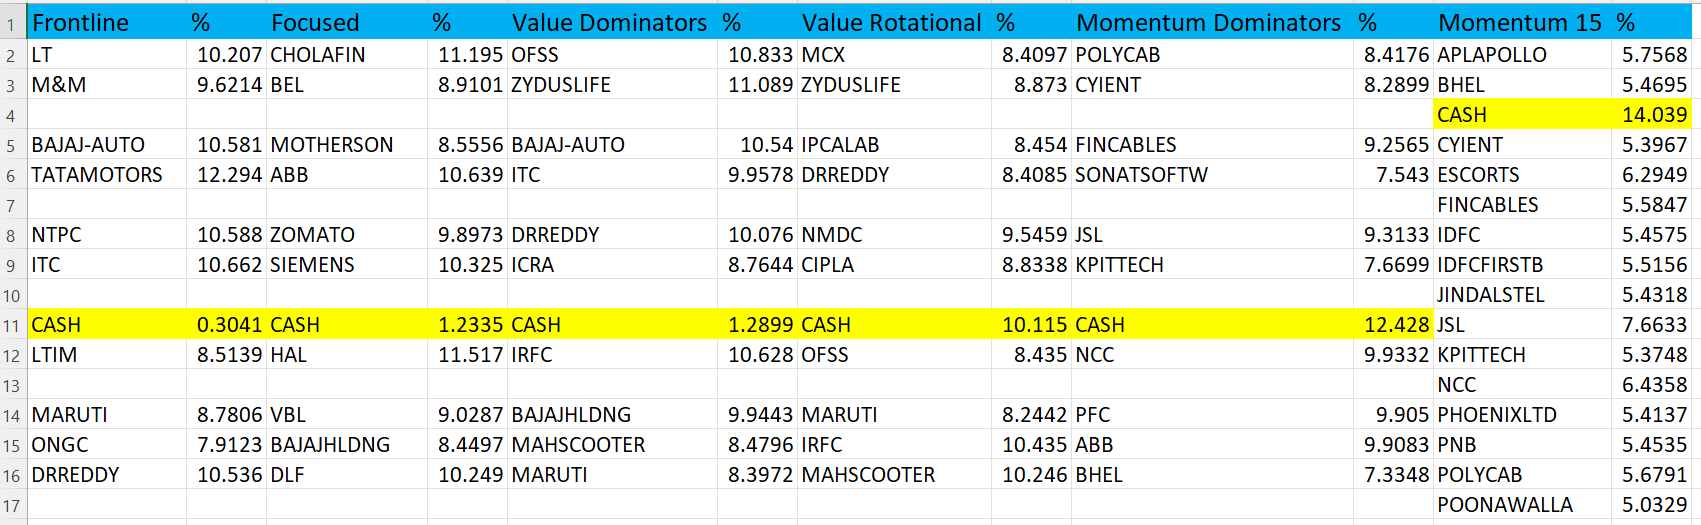
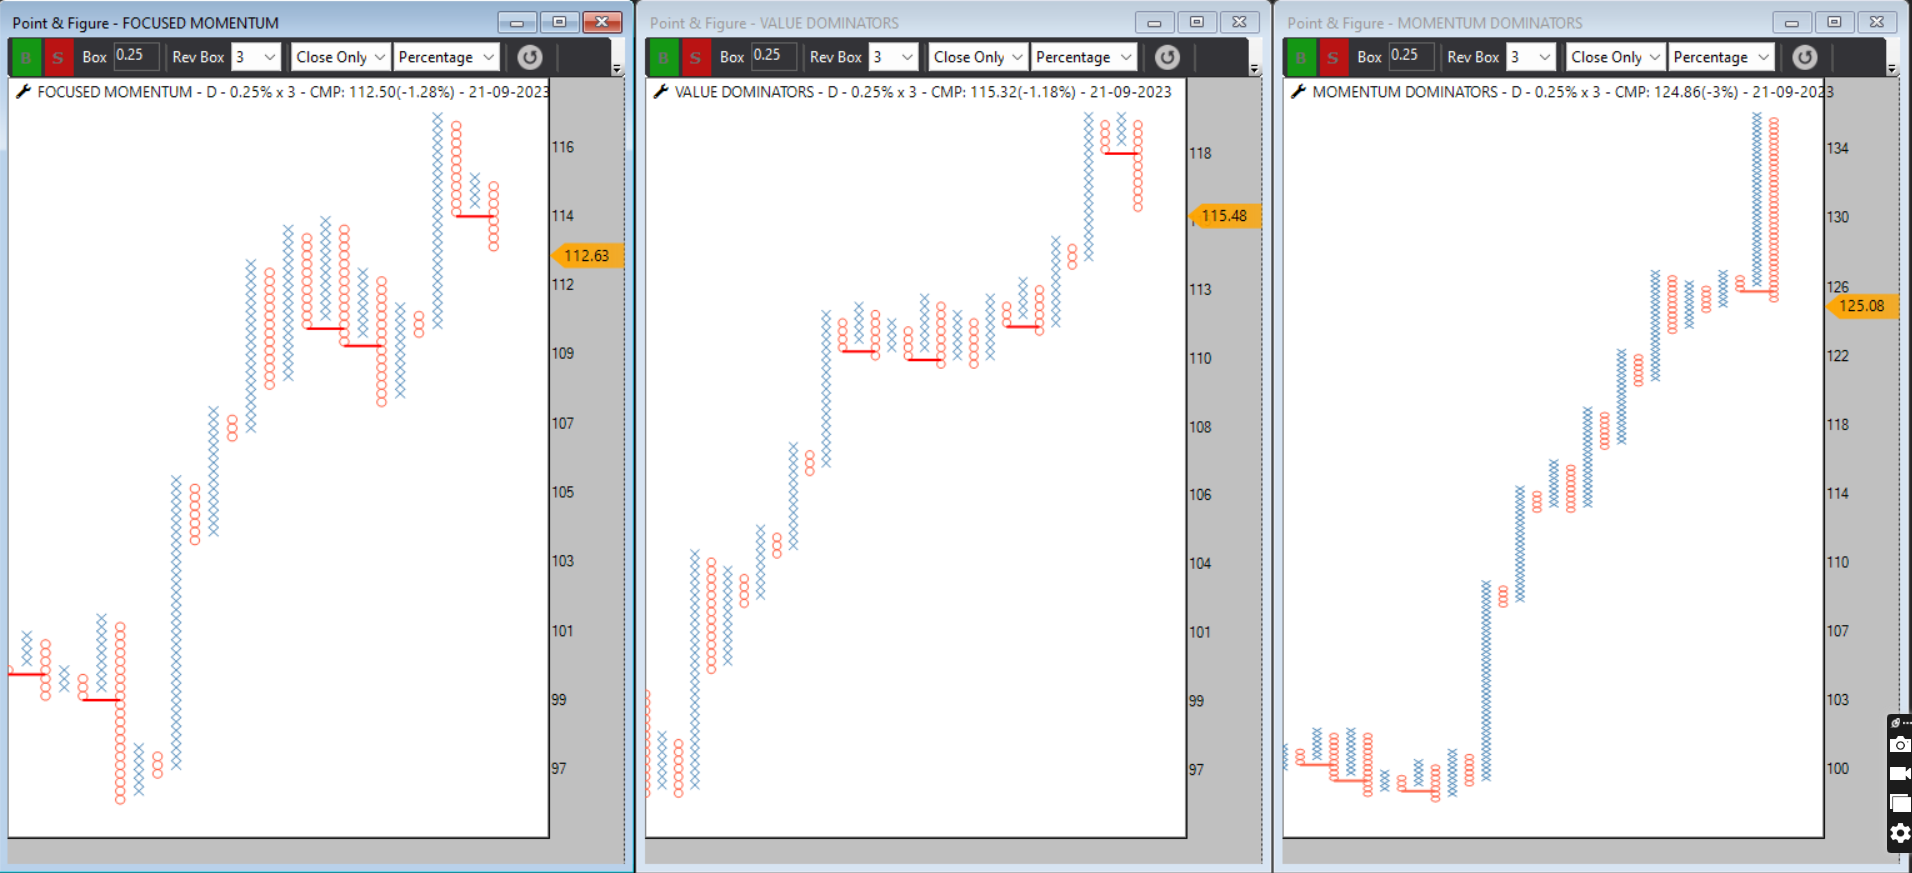
Weekly Re balance Update for 26/06/2023
Frontline Dominators
Exit -Maruti-Bpcl
add-LT-NTPC
Focused Dominators
Exit-VBL-HAVELLS-GODRJECP
add-Indigo-icicipruli-bajaj holdings
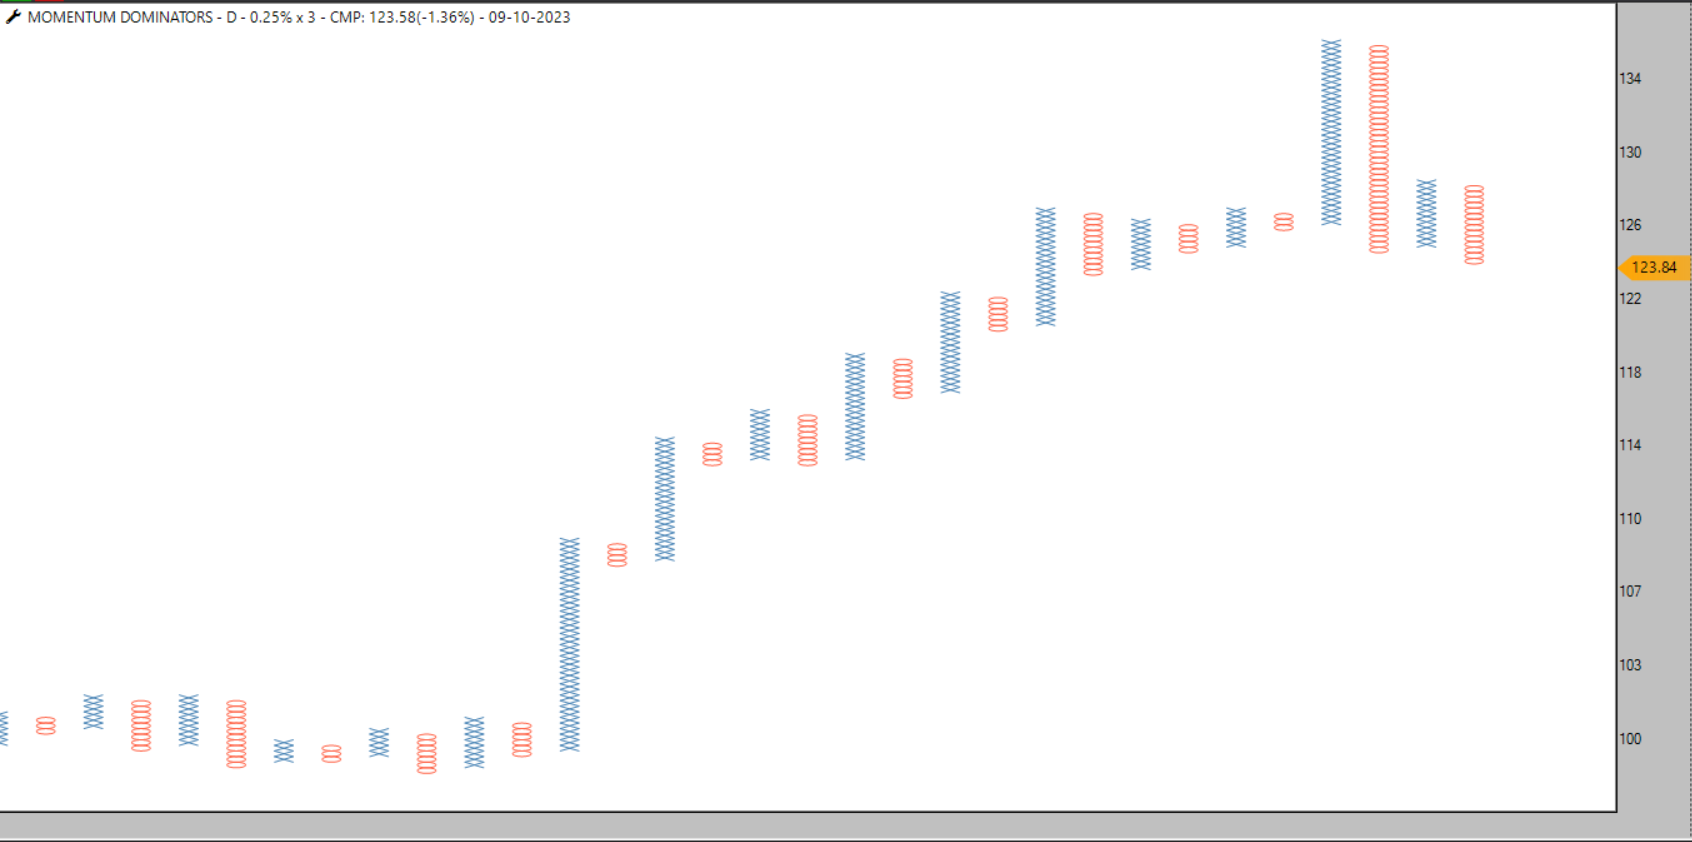
Momentum Dominators
Exit-IDFCFIRSTB
add -Cummins
Value Dominators
Exit-Maruti
Add-Balkrishnaind
Momentum 15
Exit-IIFL-Indhotel
Add-Tiindia-M&MFIN
In case you missed full list of stock attached file
incase in query/question mail me [email protected]
Current Full list Updated
Equity Curve Trading
Edge is the key
#AhmedabadNest #momentum #portfolios #trading #BREAKOUTSTOCKS #quant #DataAnalytics #nseindia #StockMarketindia

Team definedge
suggestion for backtesting related
we scan many strategy on many universe on many different periods to see the results,the problem we face is to save and write all conditioon and everything in xl sheet and save in different folders so my suggestion is to have either
when download the backtested report add all momentum engine selection-conditions so every time we dont need to write them in xl sheet
or
give an option to save every backtested results with all the conditions we have used so any time we can refer
one incidence i would like to share that i have back tested one strategy with very good results but i forget to downmload and notw down the conditions and till date i am not able to find it out so in above case if we can save everything online or download all backtest + condition used will be easy for future reference
Thanks
in back testing give export option so one can sort best stock based on many factors like
Total minimum trades,ave return,success ratio,expetancy and make list to mimum
@Prashant-Shah @Definedge @@Definedge-Experts
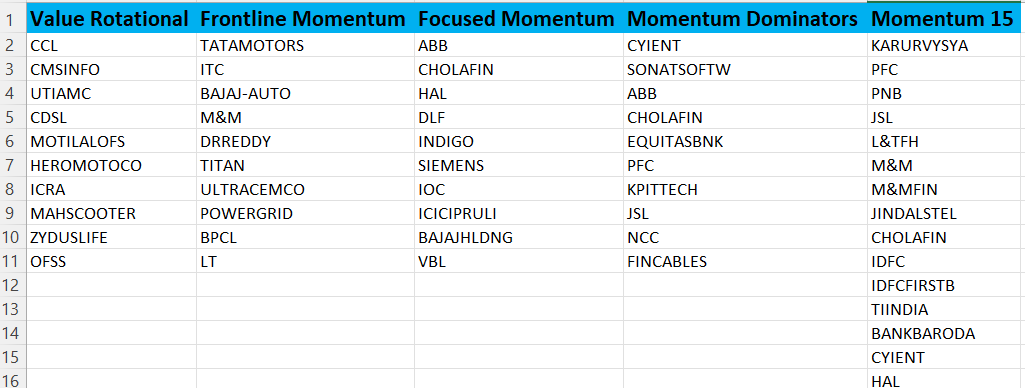
Weekly Re balance & PerformanceUpdate For 03/07/2023
Nifty 500 Up by 2.61 % in last week
Frontline Momentum + 2.75 %
Exit-Apollo Hospitals/NTPC
Add-Maruti/M&M
Focused Momentum +3.54%
Exit-BajajHoldings
Add-GodrejCP
Momentum Dominators +4.16%
Exit-Cgpower/ITC/Cummins/PolyCab
Add-Cyient/SonataSoftware/Fincables/EquitasBank
Value Dominators +2%
Exit-BalkrishnaInd
Add-CMSINFO
Value Rotational +2.69%
Exit-MCX/ITC/HeroMoto
Add-Zyduslife/UTI AMC/CDSL
Momentum 15 +3.44%
Exit-BEL/IDFC/ApolloTyre/TVS Motor/Phoenix
Add-AB Cap/Cyient/Cummins/JSL/Zyduslife
In case you missed full list of stock attached file
incase in query/question mail me [email protected]
Current Full list Updated
Equity Curve Trading
Edge is the key
#AhmedabadNest #momentum #portfolios #trading #BREAKOUTSTOCKS #quant #DataAnalytics #nseindia #StockMarketindia

Horney Bull Market – Weekly Portfolio Update
Horney Bull Market – Weekly Portfolio Update
Rebalancing Action Taken:
 Exit: AUBANK, INDIANBANK
Entry: CUMMINSIND, HINDALCO
Updated 5-Stock Portfolio (This Week):
BSE
CUMMINSIND
LTF
ABCAPITAL
HINDALCO
What to Do?
This list can be used as your weekly trading universe to apply any of your systems — momentum, breakout, positional, or intraday.
️ Remember:
Discipline > Prediction
Process > Emotion
 Next Rebalance: 27/04/2026
Stay aligned with strength. Stay with structure.
Markets reward those who follow a system consistently.
Nishesh Jani,CFTe
#StockMarketIndia #MomentumTrading #SwingTrading #PortfolioUpdate #MarketStrategy #TechnicalAnalysis #TraderMindset #WealthCreation
Give date selection tab also along with period that will help

congrats from #AhmedabadNest
Hello Team @Definedge @@Definedge-Experts @Prashant-Shah sir
Thank you for giving 1 year intra day data -> my suggestion is to create intraday data only portal where few years of data is available -> make it extra paid like Trading view-> as back testing on 1 year and taking trades is not viable where one wants to put serious amount of time & money -> we need larger data which has seen up-down-consolidation trend of various index and stock and across various events like geopolitical as well as local events like election-> so one can have in smaple and out of sample data analysis and know the exat results of the strategy that how it has performed across various market cycle
Hopeing your favourable Response
Thanks and Regards
Nishshkumar Jaani
Momentum 15
Momentum Dominators
Focused momentum
Value Dominators
all are at fresh breakout so revise counts and revise stop loss
all are weekly re balanced
for referance again name given
#AhmedabadNest #momentum #portfolios #trading #BREAKOUTSTOCKS #quant #DataAnalytics #nseindia #StockMarketindia
Importance of Market Timing
Taken KOTAKALPHA at 26.15 on 25/04/2023 as on today it is 30.80= 17.78 % Return
in same duraion Nifty 500 deliver 10.88 %
from 1st jan to Till date Nifty 500 deliver 7.28 %
so in both case market timing model has helped to generate Alpha Return in very short duration
now need follow thru above 45 degree bearish trendline to take this index to all time high
stay tune for more updates if any query/question mail me on [email protected]
#AhmedabadNest #nseindia #StockMarketindia #TradingSignals #analysis

Hello @Prashant-Shah sir Team @Definedge @@Definedge-Experts
very good tool P&L Insight
my suggestion is to make segment wise seperate p&l insight that will show true picture of that particular segment efficiency of that trader & investor
Thanks and Regards
#nifty
weekly chart observation
at new 52 week high -trying to breakout from large consolidation
RSI-Range shift above 60
MACD-Bullish crossovers
overall structure looks bullish after long consolidation post covid rally
mkt preparing for another round of strong bullish trend
yes ofcourse breadth goes to overbought -becomes normal -leadership changes
pullback -Retracements are good to project upside and trail stop loss
focus on the setup-Risk management-Follow the process
#AhmedabadNest #nseindia #stockmarkets #analysis #BULLISH

Weekly Rebalance & Performance Update for 10/07/2023
Nifty 500 + 0.82 %
Value Rotational + 2.31%
Exit Axis Bank & Bajaj-Auto
Add HeroMoto & ICRA
Value Dominators + 1.74%
No Entry & Exit stock Remains same
Frontline Momentum +2.23%
Exit Maruti
Add BPCL
Focused Momentum -0.21%
Exit Zomato/BEL/Godrejcp
Add-IOC-BajajHolding/VBL
Momentum Dominators +0.38%
Exit-HAL & LTFH
Add-JSL &NCC
Momentum 15 +0.82%
Exit -AplApollo/ABCap/Cummins/Zyduslife/ABB
Add-PNB/M&M/Jindalsteel/IDFC/Bankbaroda
in case you missed full list of stock attached file
incase in query/question mail me [email protected]
Equity Curve Trading Edge is the key
#AhmedabadNest #momentum #portfolios #trading #BREAKOUTSTOCKS #quant #DataAnalytics #nseindia #StockMarketindia
yes much needed even we need to add trendline also
#Nifty 50
Ascending Triangle
Pattern has target of 22000 valid till lower blue trendline holds
yes market will have overbought zone on indicators and breadth & disparity on moving average that will give retracements that is common so there will be no one way rally towards target zone
#AhmedabadNest #NSE #analysis #StockMarketindia #breakout
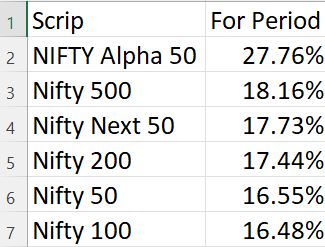
on twitter & definedge noiseless telegram i ahve updated on 24/3/2023 that mkt is going to hit bottom and it did
see various diversifed index generated return from 16.48 % to 27.76 %
one can participate market via ETFs & divicerified mutual funds
choice is your edge is the key
#AhmedabadNest #quant #DataAnalytics #NSE #StockMarketindia
yes need much larger look back period and date specification
#PowerPortfolio #Breakout
Anchor Follow Thru above Moving Average
Breakout From Bearish 45 Degree Trendline=Bullish
From current levels Double Bottom Sell is 3.5 % away while First count target is 12 % away
#AhmedabadNest #nseindia #StockMarketindia #trading

i understand your concern but i cant disclose the full details currently but yes time to time i will update so members can be on alert what i can say is that this is based on fundamental factors in case query/question mail me [email protected]
when we scan ultimate matrix with look back period kindly add that date also that will help in future when we are saving the data
#Momentum 15 #portfolio
Fresh Multi column Bullish Breakout
As long as it holds DBS as sl portfolio is bullish
Weekly Re balanced on Rotational Momentum Logic again sharing the portfolio stock list
Equity Curve Edge is the key
#AhmedabadNest #nseindia #StockMarketindia #trading #investing
PNB PFC JSL JINDALSTEL L&TFH M&M UNIONBANK IDFC NCC IDFCFIRSTB INDIANB HAL EQUITASBNK TIINDIA BHEL
#Nifty
weekly charts with some channels
#AhmedabadNest #analysis #technical
Hello team kindly add pattern finder in RS charts across all charting methods,people like me who has presented #VGM on EDECNOCH 2021 and many follower will find the active pattern easily along with Price that will help a lot
Thanks
#nifty50
sharp correction below 19300 towards 18800-18700
choice is yours give it H&S / Rounding Top Pattern
why anticipating this move ? as my market timing model is in overbought zone and need some cool off
This correction will not affect larger structure infact this is just Thrawback to the breakout point which
in longer structure i am not in Bears camp
#AhmedabadNest #nseindia #pattern #analysis #StockMarketindia

#Nifty
my market timing model is in overbought zone expecting correction towards 19200-18800 that will help to cool of the model and will give another opportunity to participate in next big rally
#AhmedabadNest #nseindia #StockMarket #India #analysis #correction #retracement
kindly att fresh condition in scaning of pattern finder
even internation GOLD is breakout after 12 years
all my momentum back portfolio are in buy mode
Below is the list of stocks with their current weight for referance purpose
Re balancing activity at every 15 days -next re balance on 15/09/2023
Equity curve Trading Edge is the key
#AhmedabadNest #nseindia #StockMarket #analysis
please add user defined days/week/months like 252/days 52 week etc so every week can scan and find our critera defined stock list
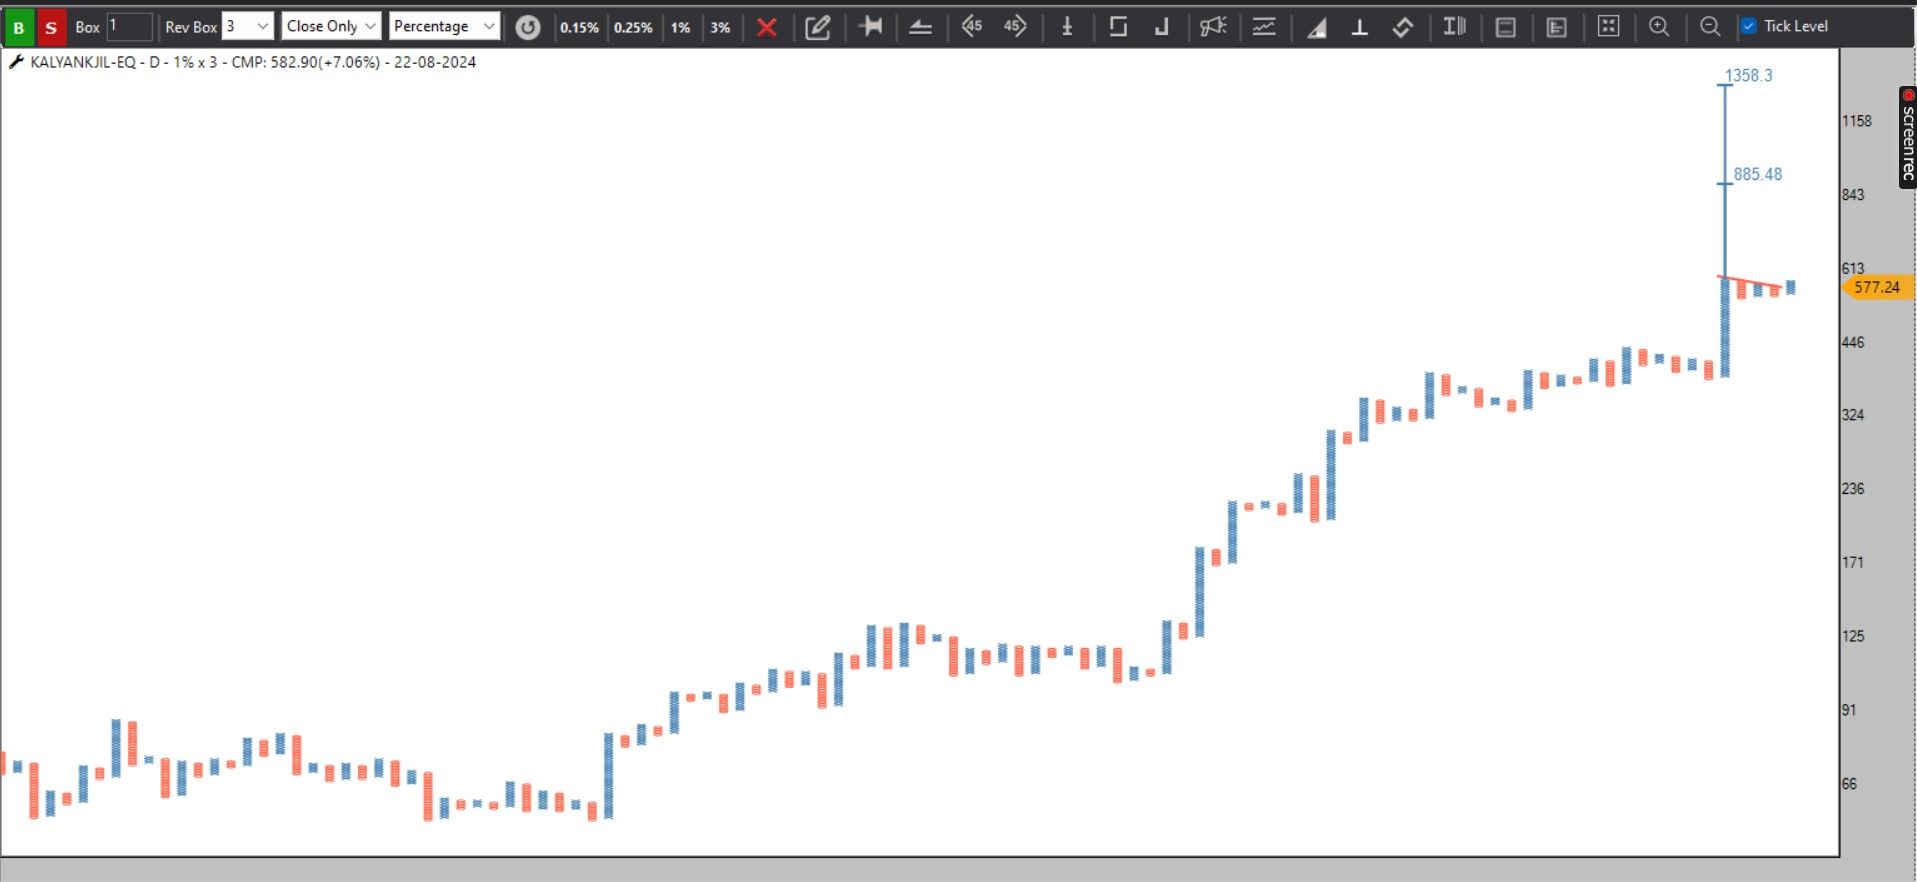
Close above 588 will trigger Bullish ABC can move to 885 with stop loss of 538 on closing basis
look for Ratio trend matrix
please add all index visual D Score setup like nifty bank nifty
Bearish view
resistance 4000 lower levels 3200
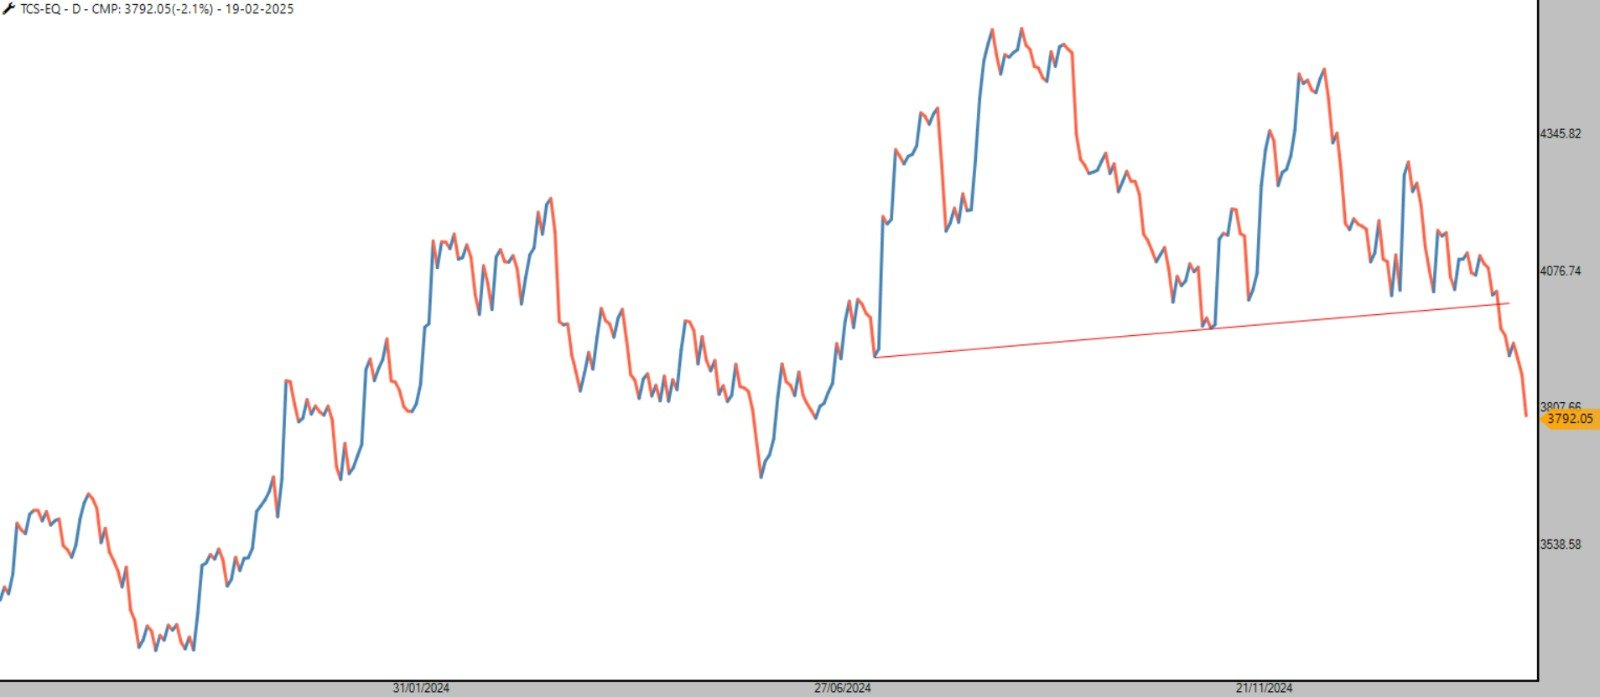
#tcs #pattern #breakout #analysis #stockmarketsindia #itindex #bearish
82 Days Time Cycle for Nifty 50
Nifty has wonderful ups & down based on 82 days fixed time interval
As J M Hurts principal of Variation -> Financial market dosent repeat exat cycle ,it has its own variation
so i have put 21 days EMA to follow bullish & bearish cycle
If bullish period & Price Below 21 EMA then ignore bullish phase
If bearish period & Price Above 21 EMA then ignore bearish phase
Currently in bullish cycle which is going to mature around 16th november 2023 as long as holds 21 EMA i am bullish
#AhmedabadNest #Cycle #analysis #StockMarket #NSE
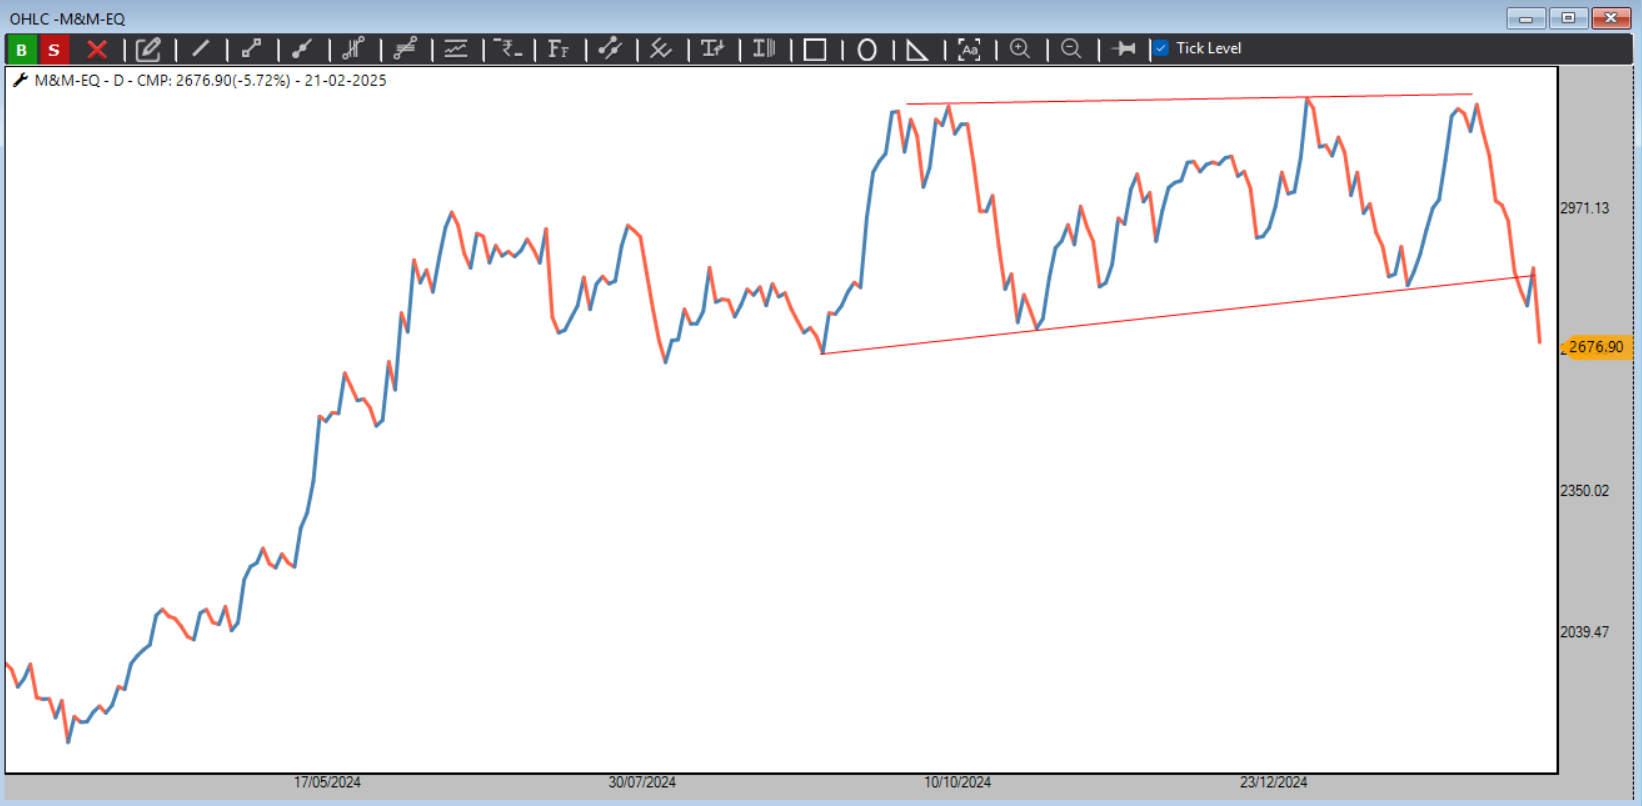
M&M -Box breakdown !
look at 6 month of consolidation getting breakdown possible to test 2200 !
if you are momentum follower focuse on exiting stocks which are loosing strength and focuse on getting stong positive momentum
#mnm #analysis #stockmarketscrash #India #pattern #NSE
3 Dominators Portfolio given Exit Signal
Focused Momentum
Value Dominators
Momentum Dominators -100 % Bearish Pole & Double Bottom sell
when momentum dominators gives such signal in backtesting we have observed fast correction in market so be careful in longs now as momentum has loose its charm so dont focus on breakouts chances are high that it fails now
in week end will study my market timing model if given sell signal from highly overbought zone will allocate equity to Gold
Equity Curve Trading Edge is the key
#AhmedabadNest #dominators #Portfolio #nse #StockMarket #india #analysis
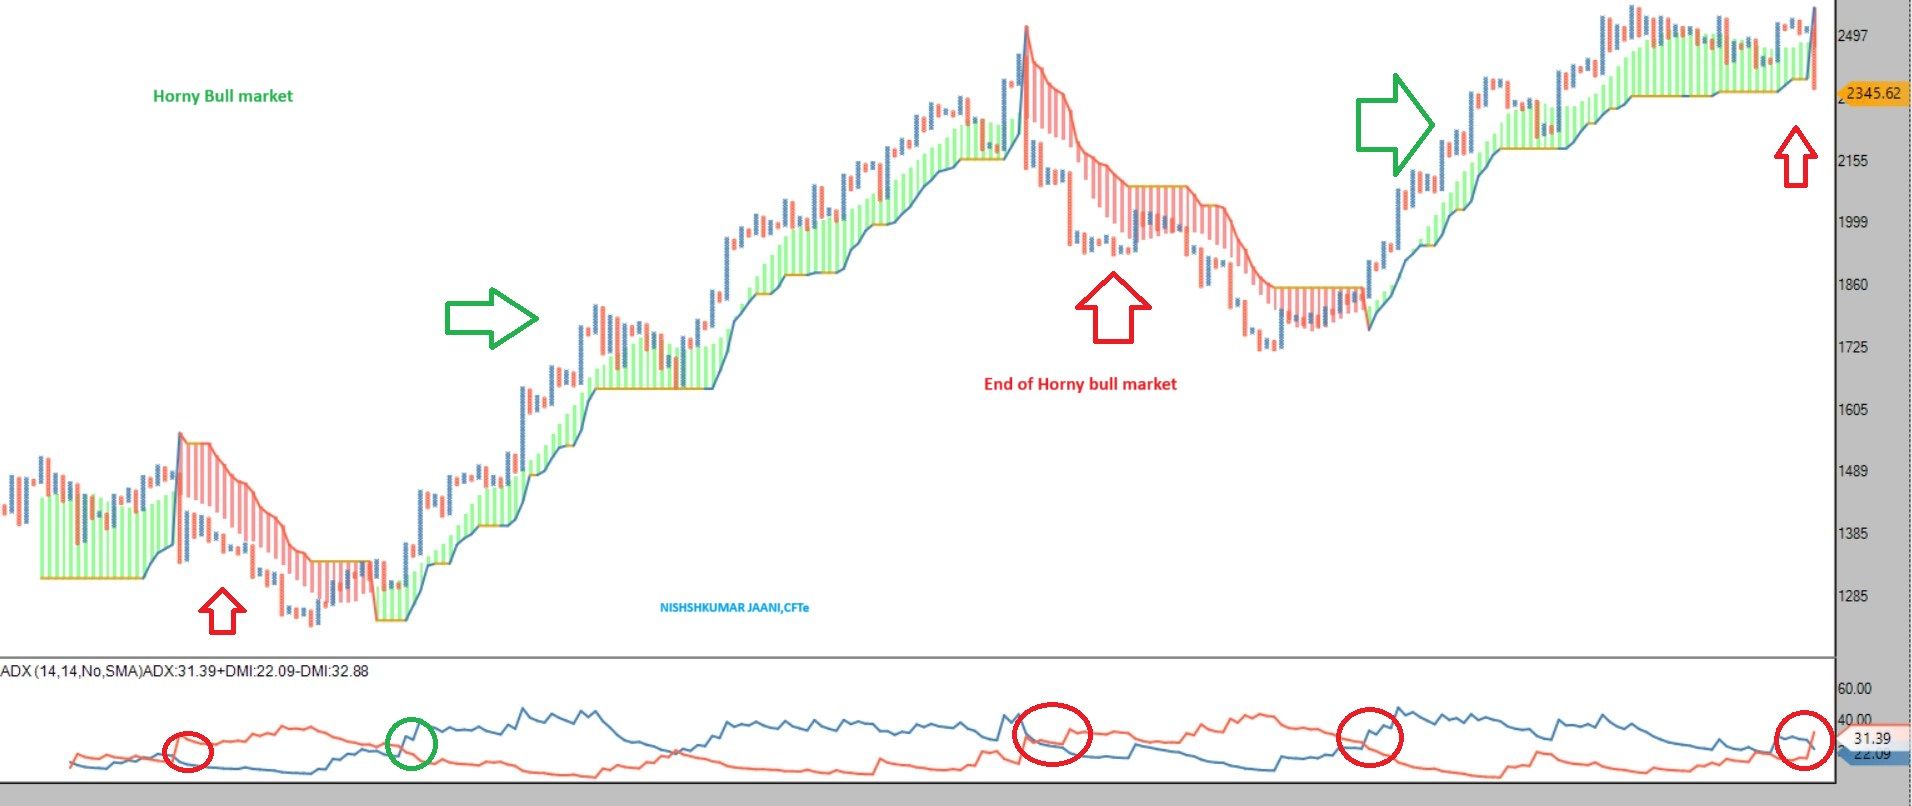
End of Horny bull market ?
look at the chart setup DMI turned bearish and chart below MAST indicator
whenever this happen you will see
No strong positive momentum
Momentum Strategy will not work easily
Buy & Hold will not work
Easy system will not generate returns
Leverage/MTF will not have Favourable Time
High P/E & High leverage stock will be punished
Fundamentally strong/sustainable stock will show positive momentum
traders and investors lower down your expectations
Rate of Change-Speed of momentum will be slowdown
This phase is nothing new which has seen earlier this shall pass and new leaaders will emerge
at some point of time market will find buying intrest from value investors that will halt the fall -look for next strong sector-stocks- Find your setup-Follow charts-Have Proper Risk management & Position Sizing
#Nifty
cluster of support
Trendline + 50 EMA
If both dosent respect then correction towards 100 & 150 EMA (19200-18900)
My market timing model is 94 %
#AhmedabadNest #nseindia #StockMarket #india #analysis
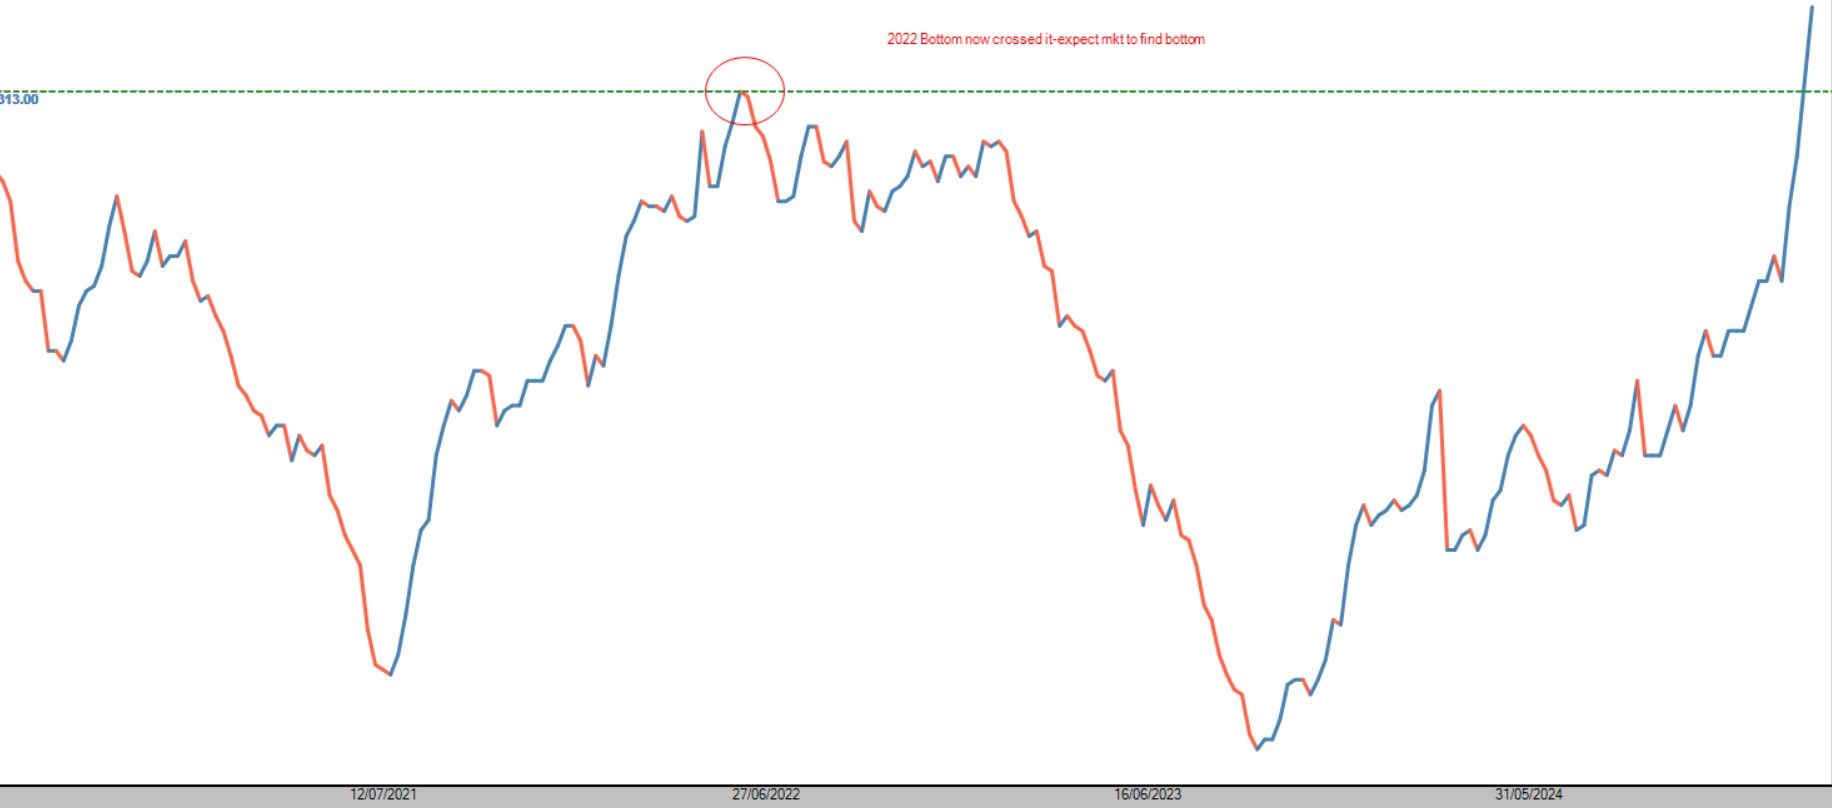
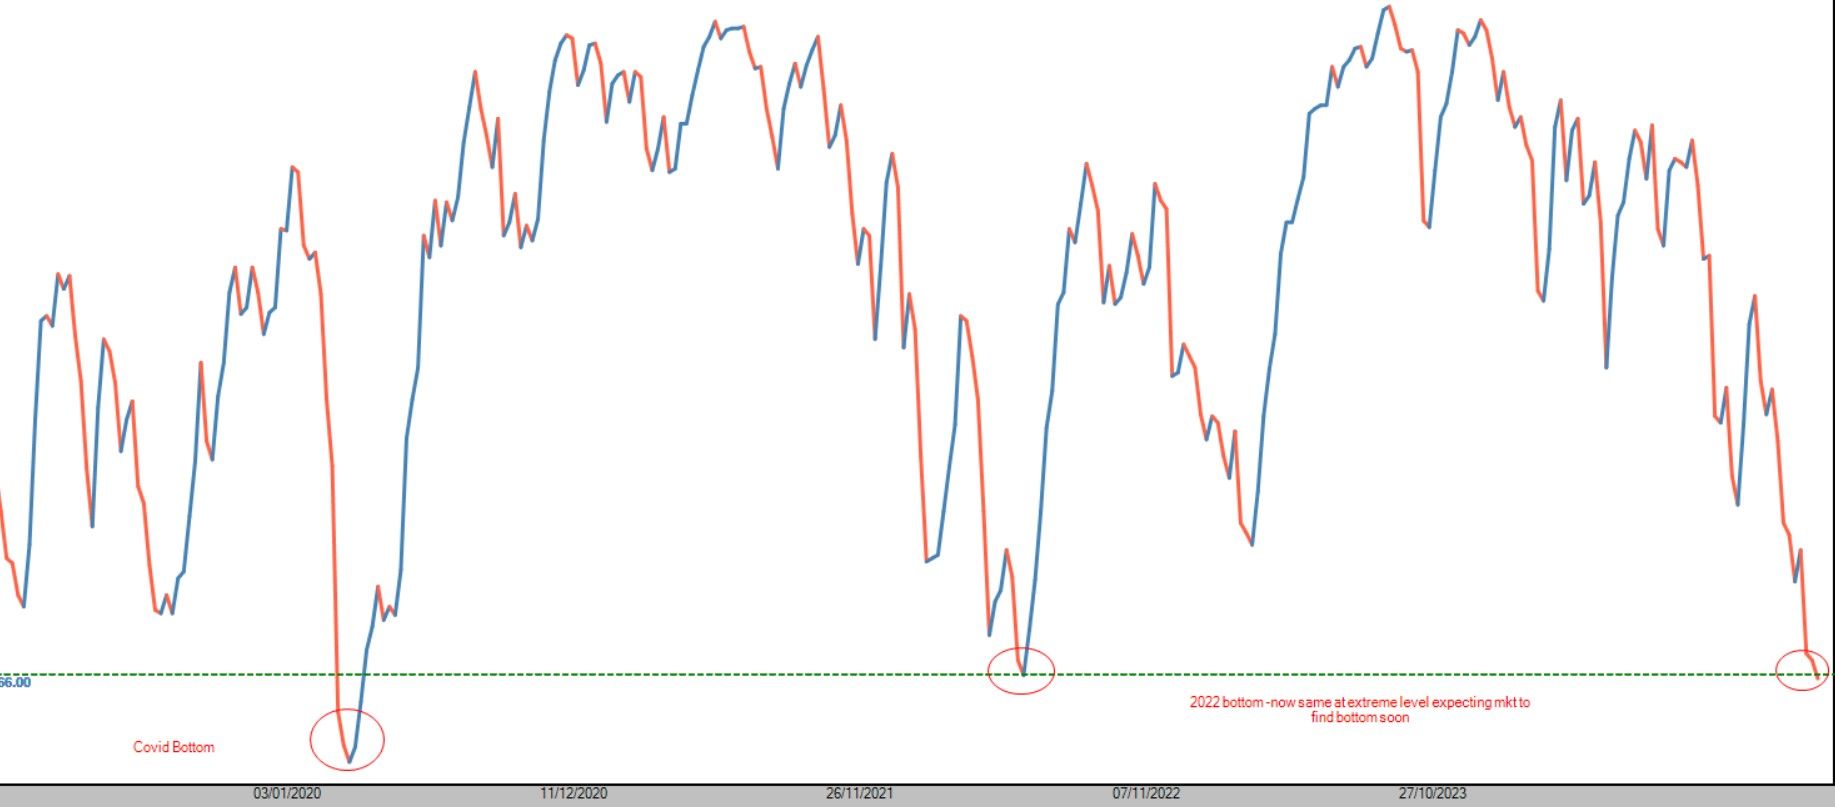
Mkt at near bottom !
look at the two conterian signal chart
first chart when cross 300 mkt finds bottom
Second chart when it falls below 70 mkt find bottom
Covid and 2022 both time when this signals reached it has reversed
Bottoms are more orderly than tops
indicator & breadth wise mkt is oversold and tend to find bottoms and valuations are relatively cheaper and this is the reasons why i recommand to accumlate two ETF
ALPHA
MOMENTUM50
when mkt is in down trend i avoid picking stock let mkt to find proper bottom and bullish structure and then find leaders
#nseindia #NSE #stockmarketcrash #stockmarketsindia #breadth #oversold #sentiments #passimistic
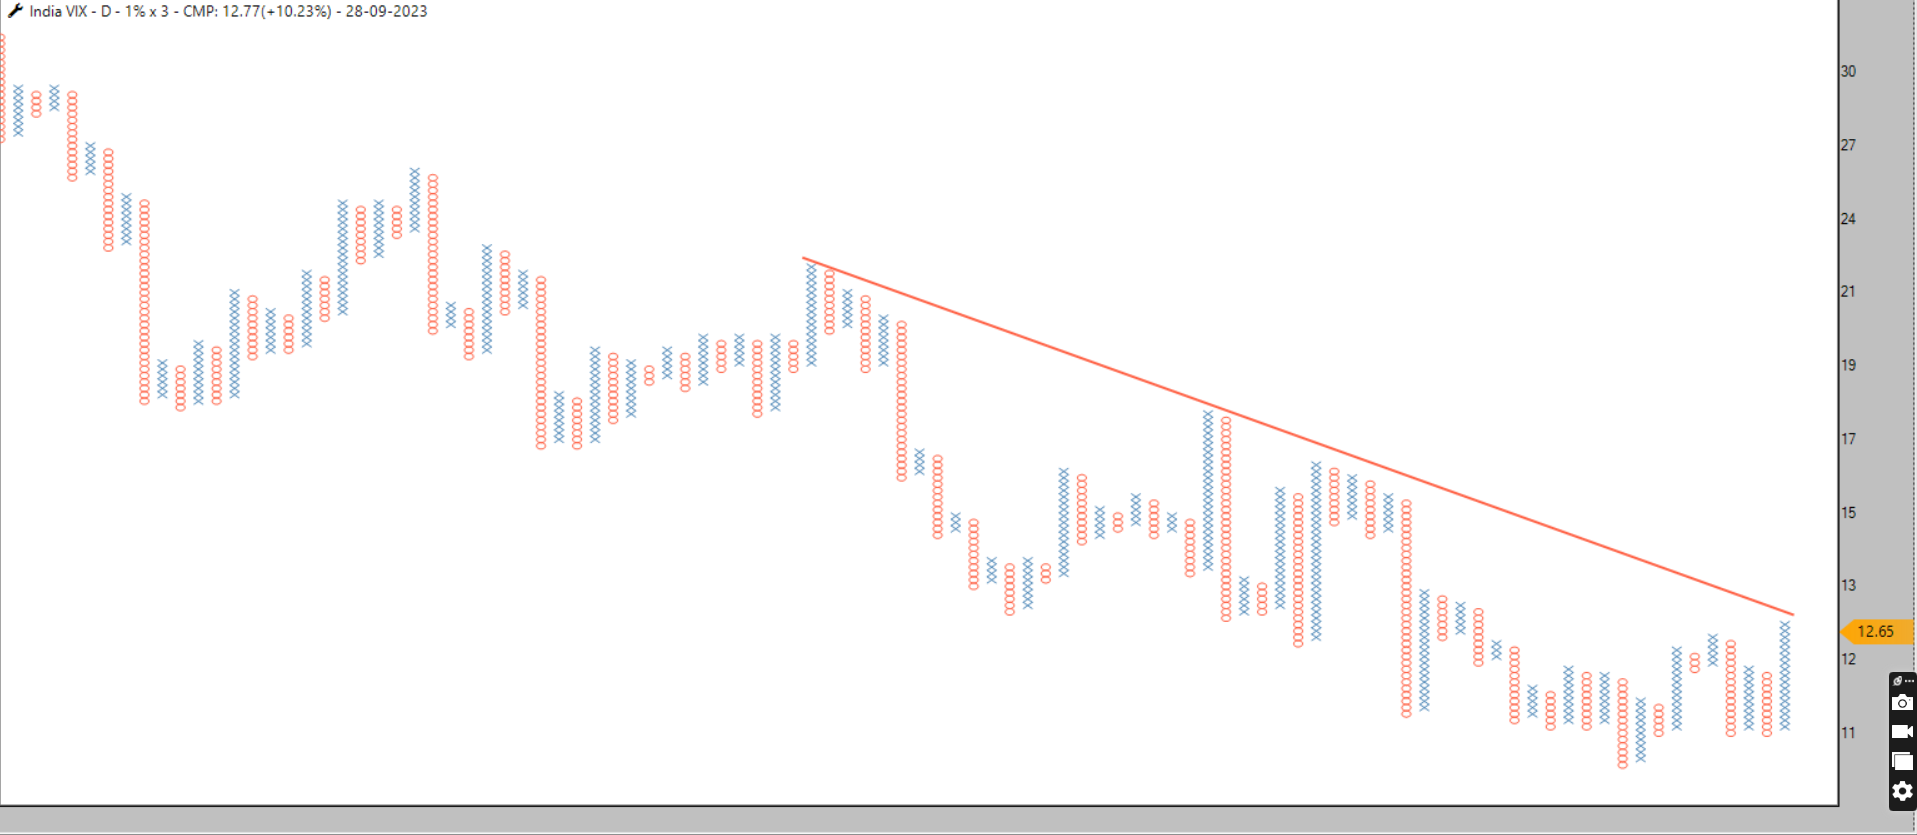
#INDIA #VIX
at important levels of 45 degree trendline -if sustain above trendline be ready to quick correction in #Nifty
#AhmedabadNest #NSE #StockMarket #india #analysis
#Bhartiartl
in structural long term up trend->Breakout from consolidation
Trail SL 1812 on closing basis for target 2619
Entry ->1% EOD Bullish Column Reversal
Stop loss-> DBS
will continue to trail the stop loss as and when required
Nishesh Jani,CFTe
#AhmedabadNest #longterm #Breakout #pattern #NSE #StockMarketIndia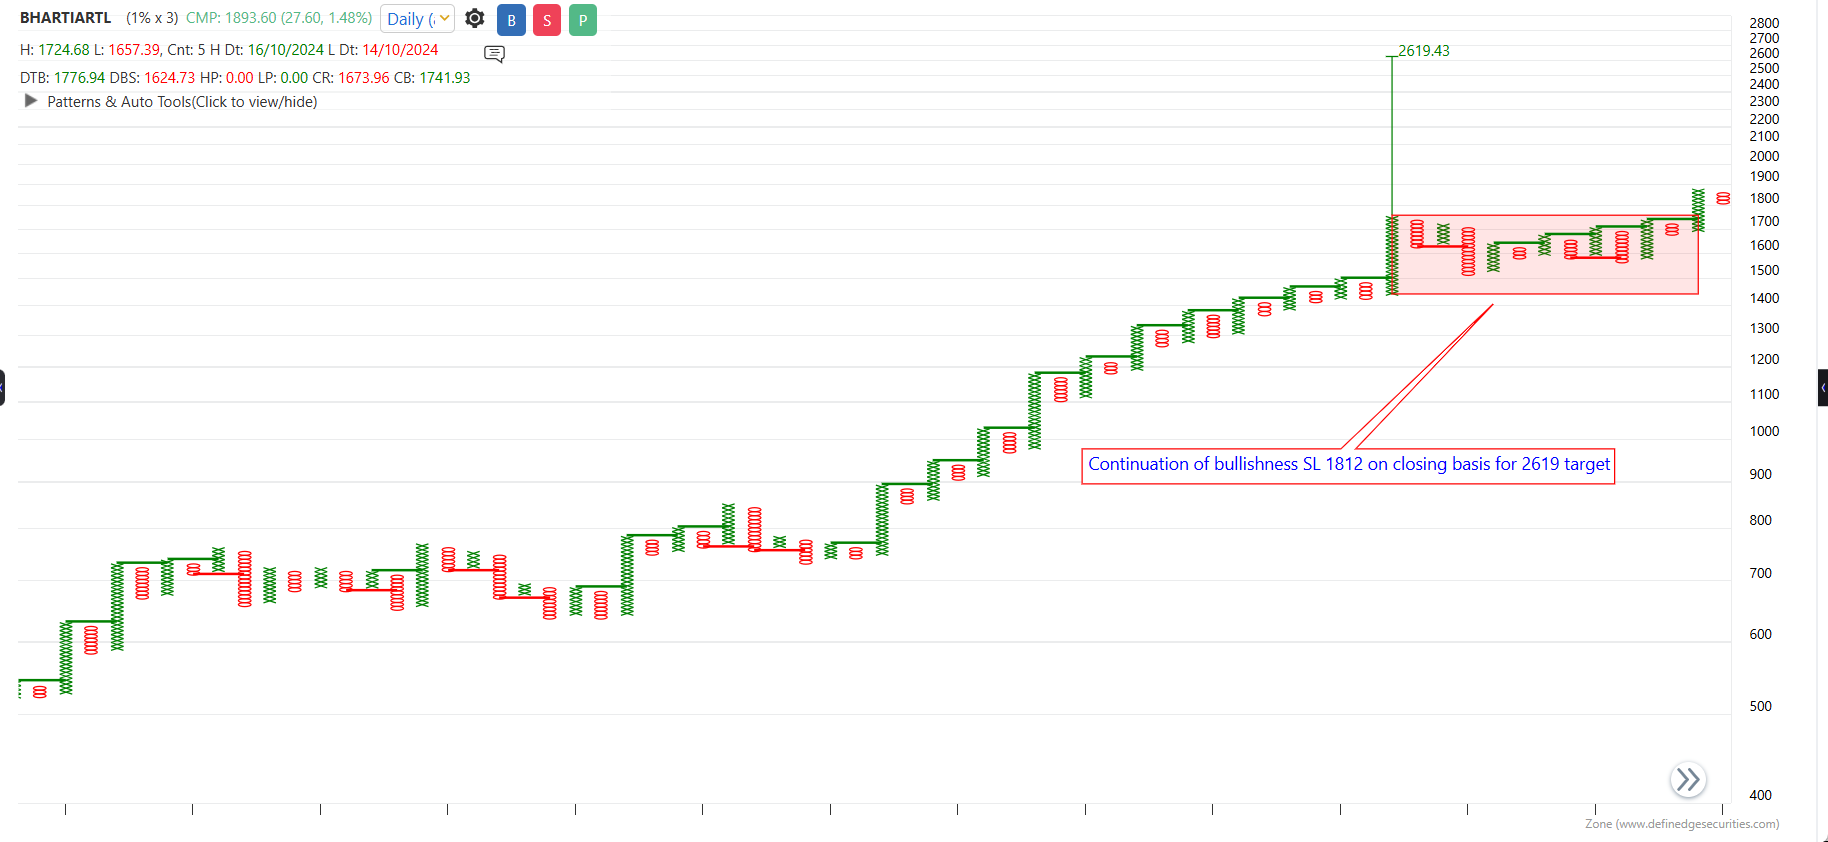
Momentum Dominator Portfolio
Bearish Anchor Follow thru suggest soft landing for bears going ahead
along with this still my market timing model is highly overbought above 90% which suggest cool off required in market
Equity Curve Trading
Edge is the key
#AhmedabadNest #momentum #dominators #Portfolio #pattern #analysis
SPX -US index Ready to fly high to ATH !
i am anticipating Bullish Inverse Head and shoulder pattern
Good support is 5500 expecting 6800-7000 that translet into 17 to 20 percent upside from current levels
once breakout that will help world indicies to their upward levels
Nishesh Jani,CFTe
#AhmedabadNest #SPX #usa #StockMarket #GlobalMarkets #analysis #nisheshjani
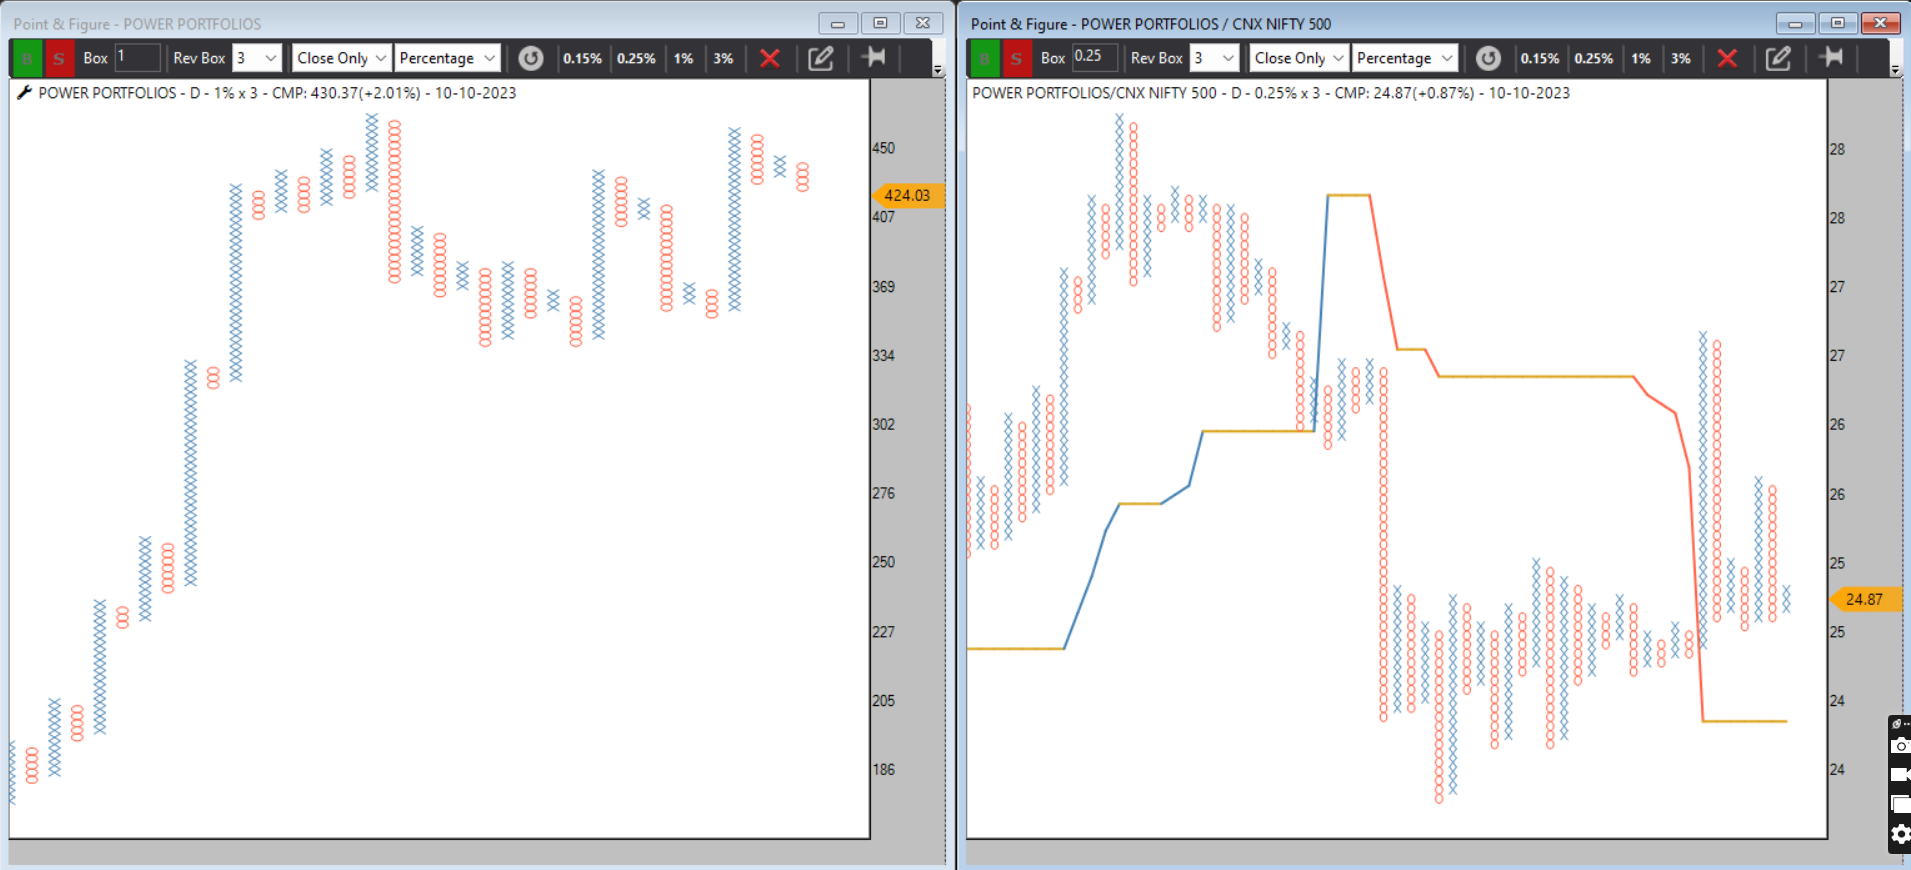
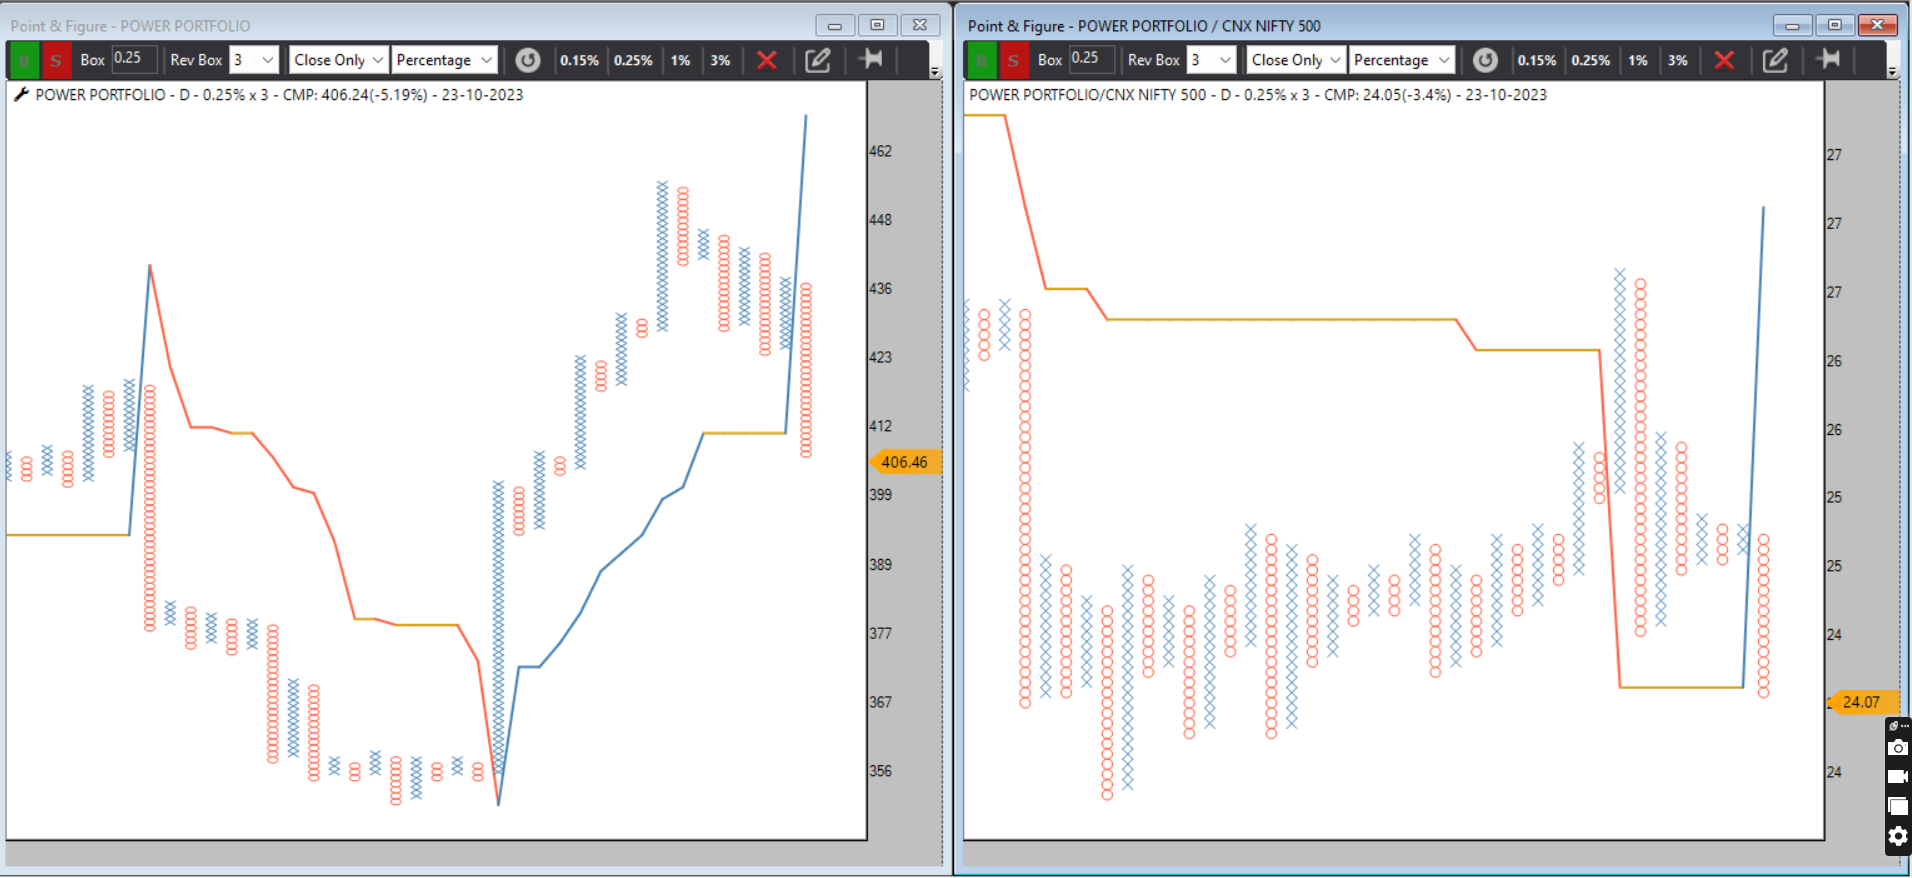
Power Portfolio RS & Price Analysis
Left side chart is of Price chart which is in Double Bottom sell after anchor column so probably forming bullish ABC
Right side chart is Relative Strength chart against Nifty 500 which is above super trend means its relatively strong
as long as price chart dosent give buy signal no commitment into the market
Equity curve Trading
Edge is the key
#AhmedabadNest #power #portfolio #stockmarkets #nseindia #analysis
Is the Nifty Midcap 150 Index Gearing Up for a 10-15% Rally?
Above Super Trend – Clear bullish signal
Broken All Bearish 45° Trendlines – Structural breakout confirmed
Vertical Price Counts Active – Momentum building for a potential 10-15% upside
 Caution Zone: A close below Super Trend could reverse the bullish tone.
 Keep your eyes on midcaps – The breakout is real, and the next move could be big.
Nishesh Jani,CFTe
#MidcapMomentum #NiftyMidcap150 #TechnicalBreakout #StockMarketIndia #BullishTrends #ChartTalk #SmartMoneyMoves #PriceAction #BreakoutAlert #AhmedabadNest #nisheshjani 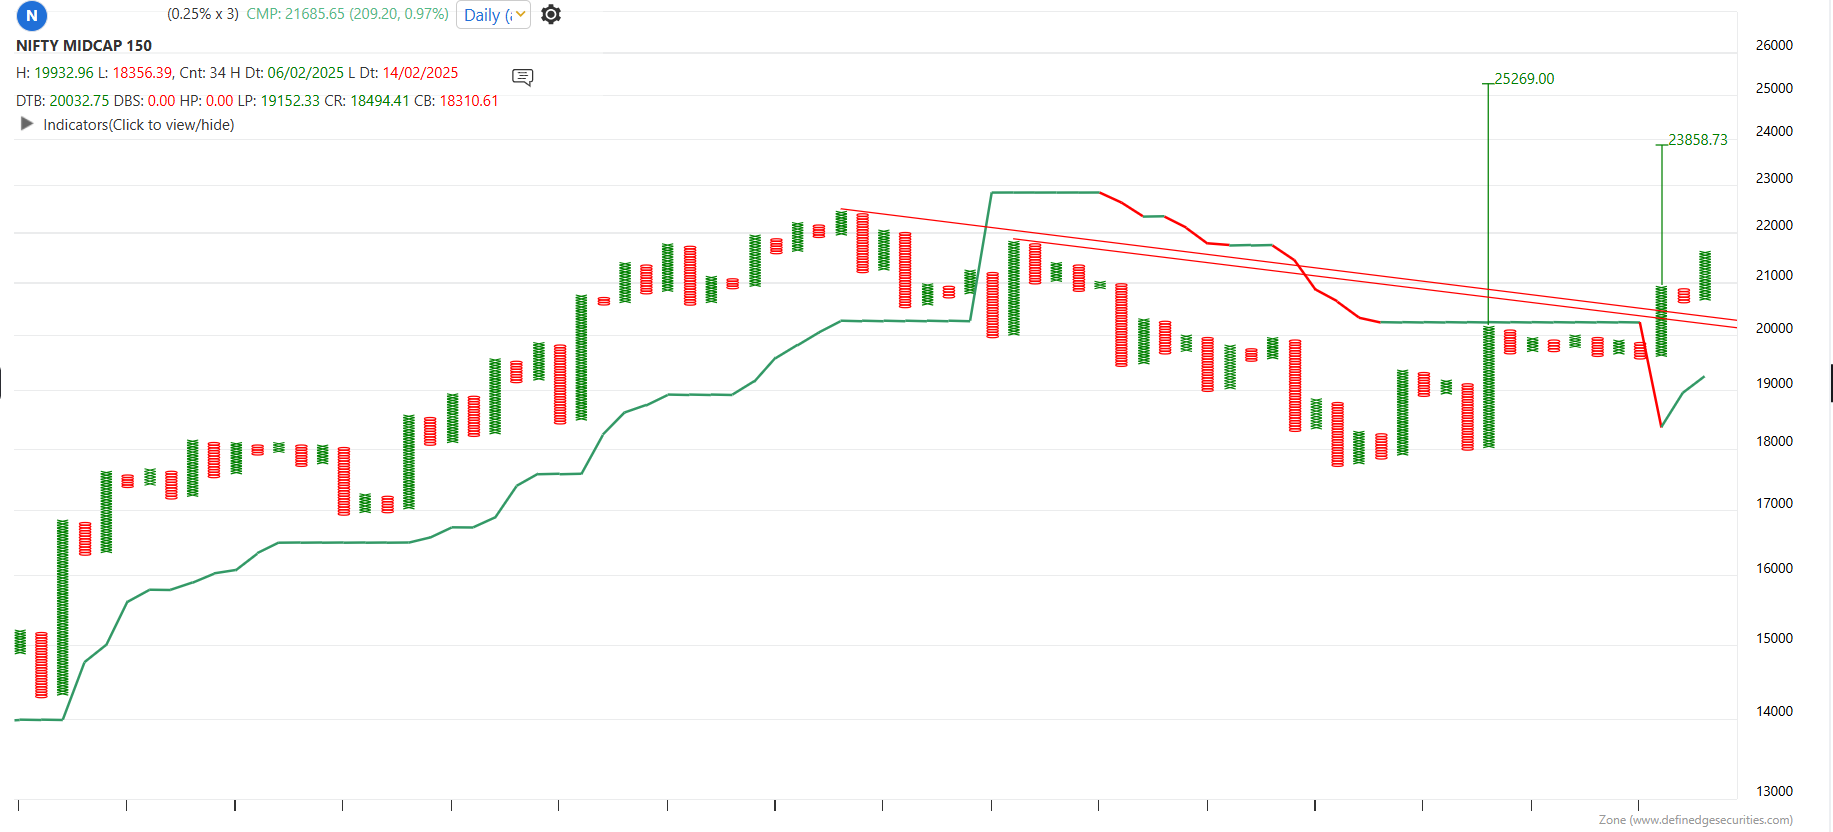
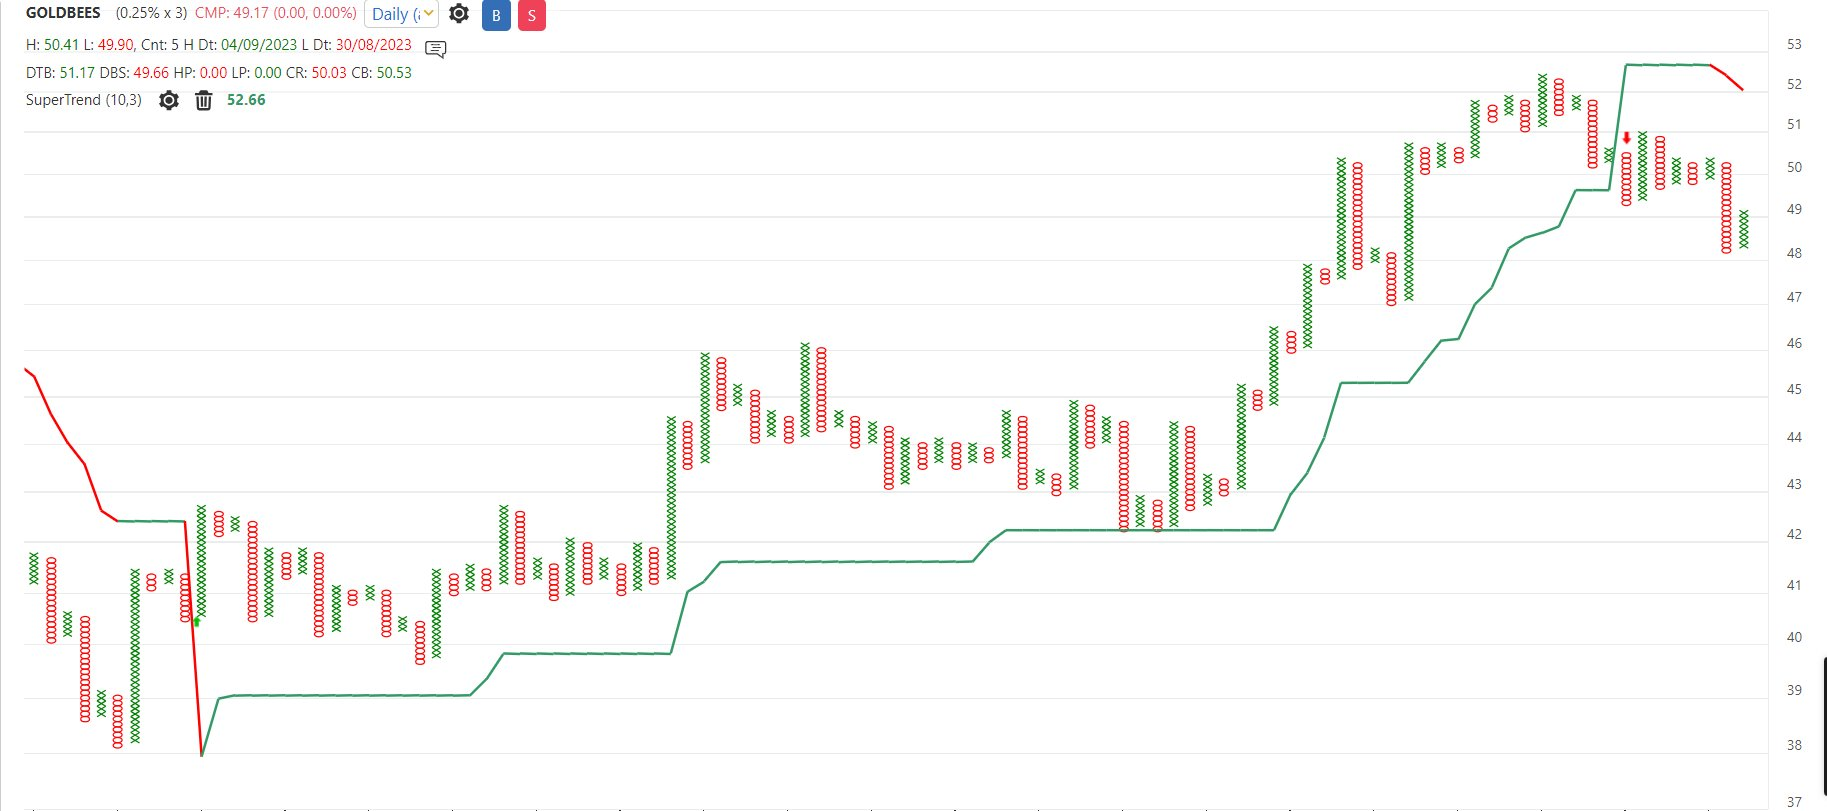
#GOLDBEES
Currently my Power Portfolio is in Double Bottom sell so i have another option to park my money in GoldBees
which is currently below super trend so have to park money in LiquidBees
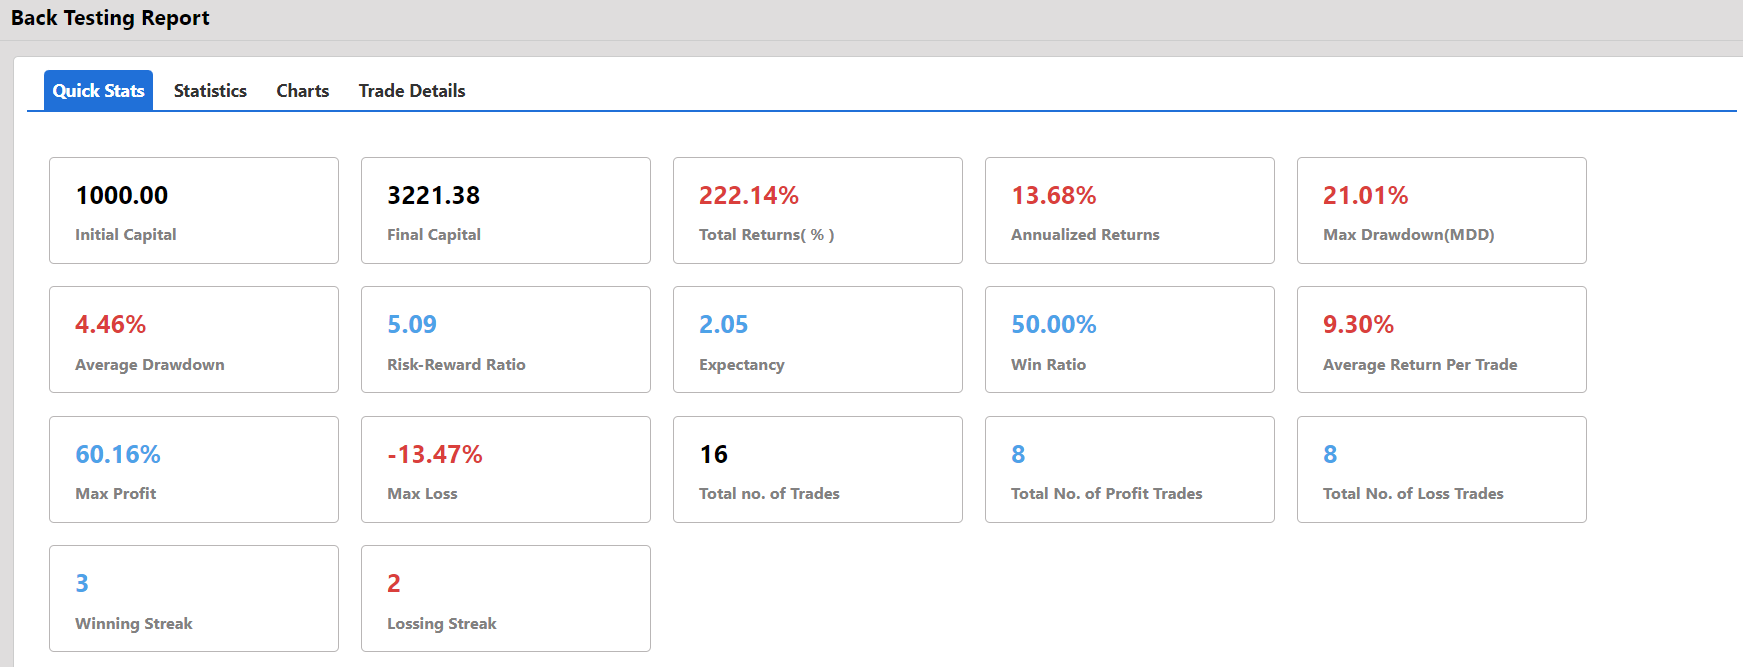
attaching BackTesting Data & GoldBees chart for referance
#AhmedabadNest #goldbees #gold #analysis #DataAnalytics #backtesting
Nifty IT Sector – Caught Between Breakout & Breakdown? 

Nifty IT Sector – Caught Between Breakout & Breakdown?
The index has bounced strongly from oversold zones, negating the bearish anchor column and triggering a bullish ABC pattern – targets stretch to 52000, as long as 35000 holds.
But don’t ignore the shadow forming – a potential Head & Shoulder Top which activates only below 32000. ️
🧠 Two Critical Insights:
IT often underperforms when Banking/Finance is strong – watch sector rotation closely.
 Weakening DXY could impact export-heavy IT companies despite the bullish chart.
 Large-cap or mid-cap IT? Stock-specific trends will lead – manage risk, follow the chart, ignore the noise.
As of now – Bias stays Bullish above 35000!
Break below 32000, That’s when we talk about major top-out formations. 🧩
Nishesh Jani, CFTe
#AhmedabadNest #NisheshJani #NiftyIT #TechStocks #SectorAnalysis #BullOrTrap #TradingPsychology #ChartPattern #ITSector #RiskManagement #MarketInsights #HeadAndShoulder #DollarIndex #StockMarketIndia 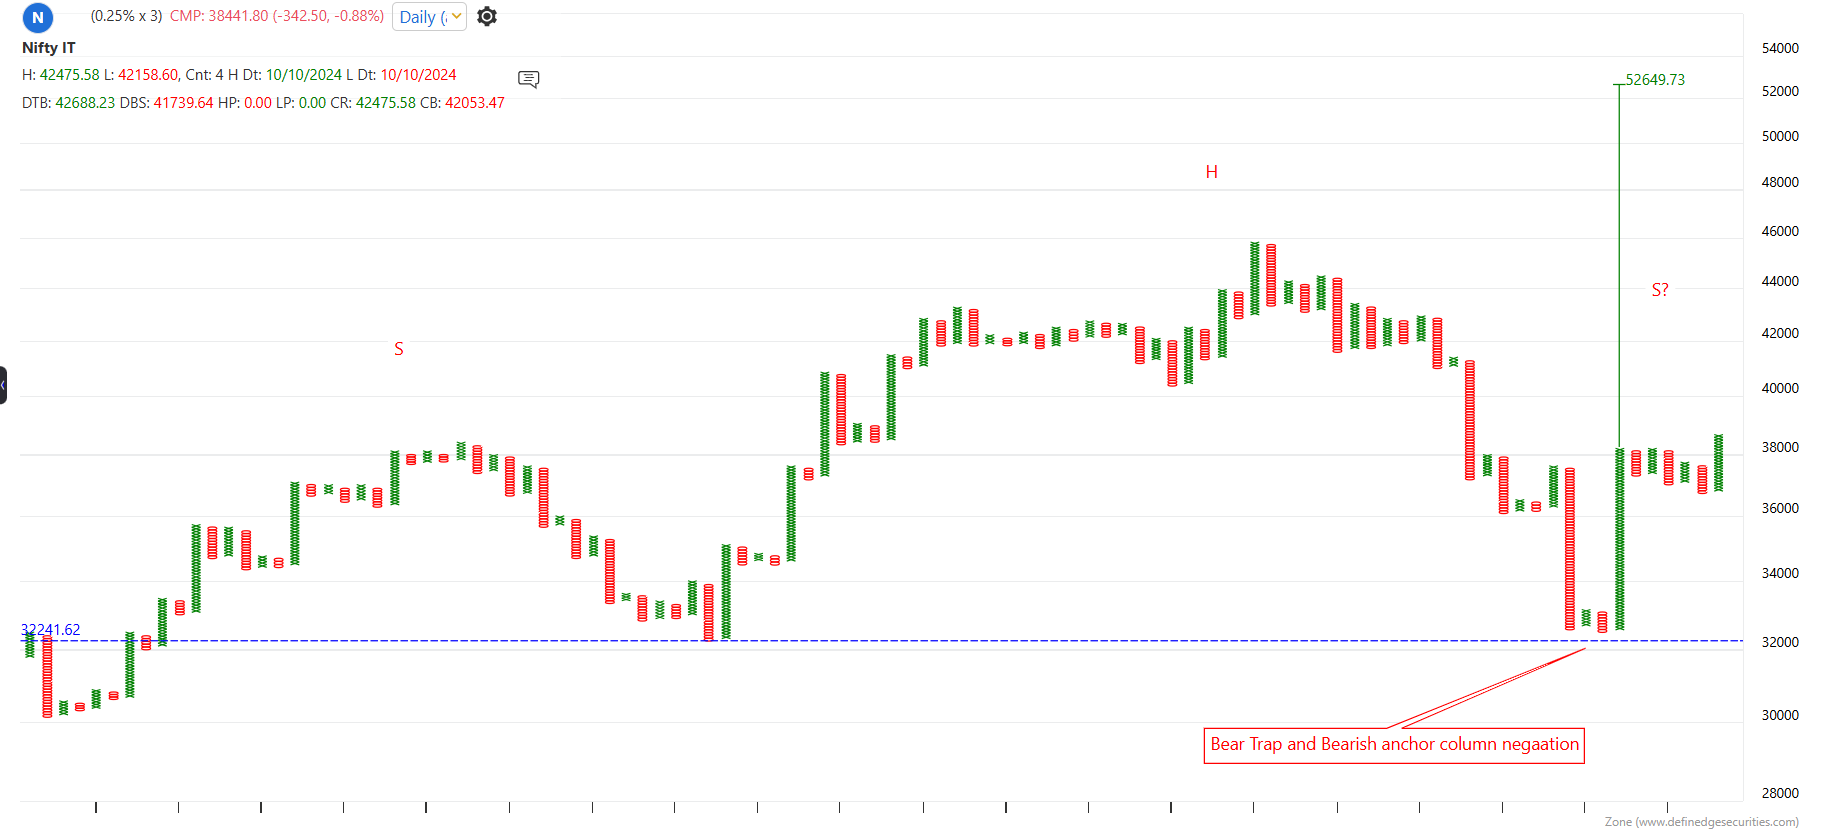
Nifty Alpha 50-Bull trap or Euphoric move ?
Double Top buy active with T-20 pattern
Two probability either bull trap or Euphoric move
why Bull trap-> Breadth is in over bought zone
Why euphoric move-> In strong market breadth can remain overheated longer then one can expect
#AhmedabadNest #Nifty #analysis #StockMarket #india #momentum
24400-24100-23800 watchout these levels for turnaround
Nifty-bear attack ?
Nifty not able to cross the gap down gap
ADX falling has taken whipsaws in trend following system
if ADX cross both DMI then bears ko control karna muskil hoga
#AhmedabadNest #analysis #StockMarket #india #nseindia
#NAZARA has no direct exposure to real money gaming.
#VGM setup stays bullish above MAST
Fresh opportunity on Positive Column Reversal + Double Top Buy
Trading above the longest bearish 45° trendline – momentum intact.
Nishesh Jani,CFTe
#StockMarket #NazaraTech #VGMMethod #TradingSetup #ChartAnalysis #BullishSetup #TechnicalAnalysis #nisheshjani #AhmedabadNest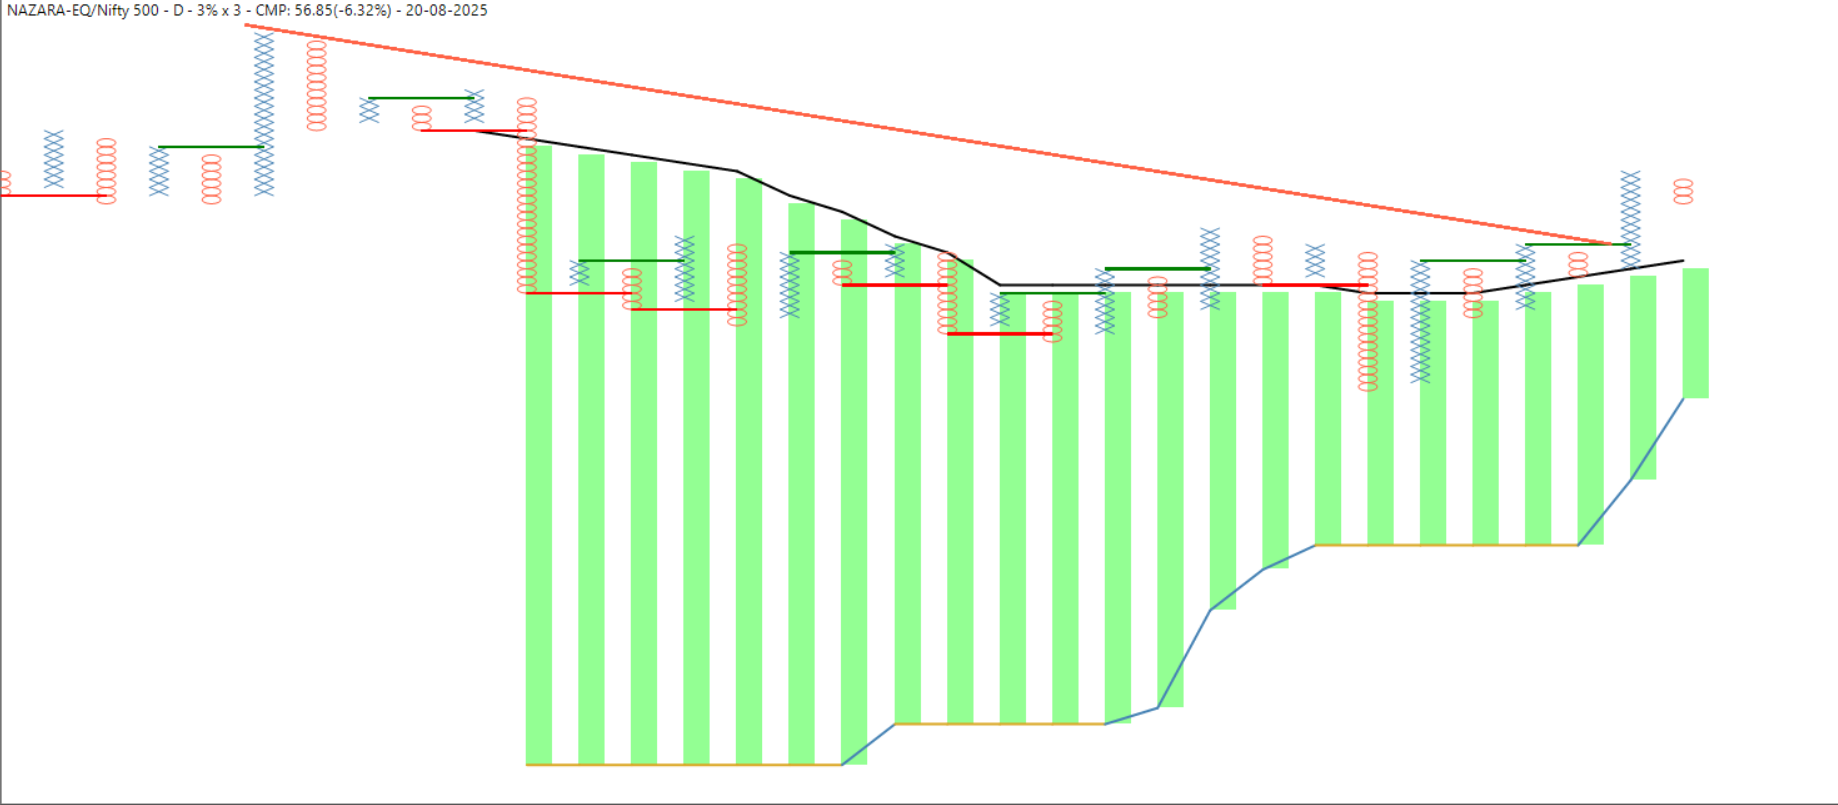
#PowerPortfolio
Price and Ratio wise below Super Trend means no scope for Equity for me.
if you remeber i was updating my market timing model reading was above 90% in fcat reached 94 % at its peak and this is highly overbought zone
Always do check the Health of market along with price action
50% work is done if you can save drawdown in correction
Equity Curve Trading
Edge is the key
#AhmedabadNest #nseindia #StockMarket #india #analysis
#Nifty Outlook Update
#Nifty Outlook Update
Currently, #Nifty is trading above the 200 EMA – long-term structure remains bullish.
Two probable scenarios on charts:
1️⃣ Head & Shoulders Top
Support zone: 24300–23900 (gap area)
Breakdown below 23900 → 23300 levels possible
Aggressive traders can look for weakness below 24300
2️⃣ Triangle Formation
Breakout above falling trendline gets confirmed and above 25200
Target: 26500+ / New ATH
Stay alert around 24300 & 25200 for next big move!
Nishesh Jani,CFTe
#StockMarket #Trading #TechnicalAnalysis #NSE #MarketsToday #PriceAction #Nifty50 #nisheshjani #AhmedabadNest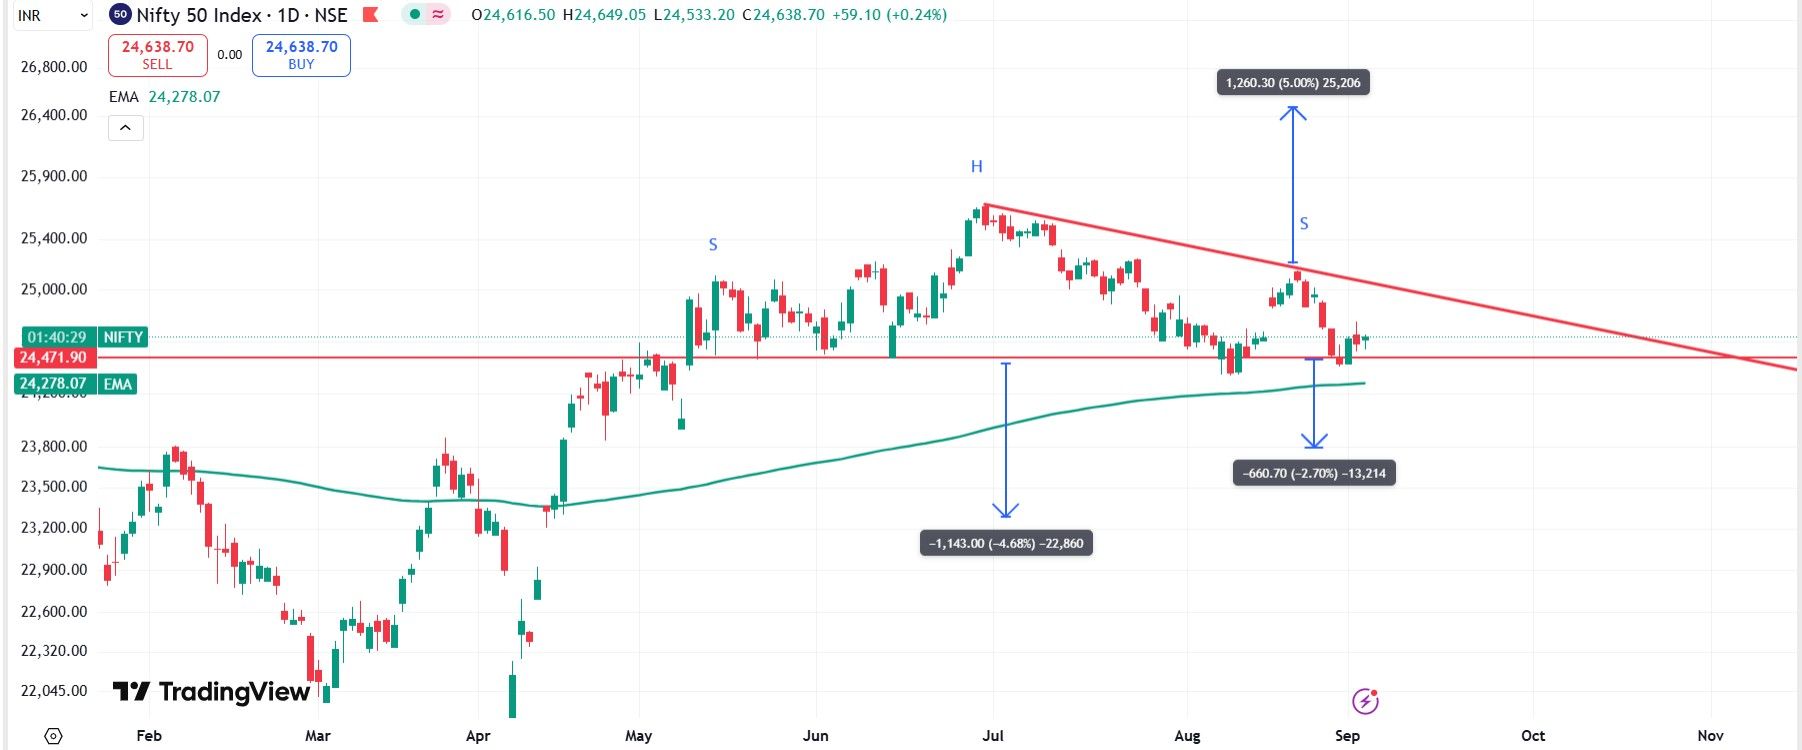
Those who are holding stocks equivivalant to future lot size can do covered call strategy in Asian paints
“Is Bajaj Finance Entering a New 2011–2020 Style Rally?”
Bajaj Finance is showing signs of completing retracements above the MAST indicator with PCR confirmation on the #VGM setup.
After nearly 5 years of a relative flat period, the stock looks ready to take off again—similar to the 2011–2020 high-fly phase.
Price-based established counts project targets of 1070 and 1316, well above the CMP of 968.
 Strategy: Deploy 50% on CR and 50% on DTB, with DBS as SL for risk management.
Business Insight: Bajaj Finance continues to strengthen its dominance in consumer and SME lending, while scaling up its digital ecosystem through the Bajaj Finserv app. With diversification across personal loans, EMI financing, and co-branded credit cards, the company is well-positioned to benefit from India’s expanding credit cycle and rising consumption demand.
Nishesh Jani,CFTe
#BajajFinance #TechnicalAnalysis #VGMSetup #WealthCreation #IndianMarkets #MomentumInvesting #LongTermGrowth #CreditBoom #Financials #StockMarketIndia #nisheshjani #AhmedabadNest 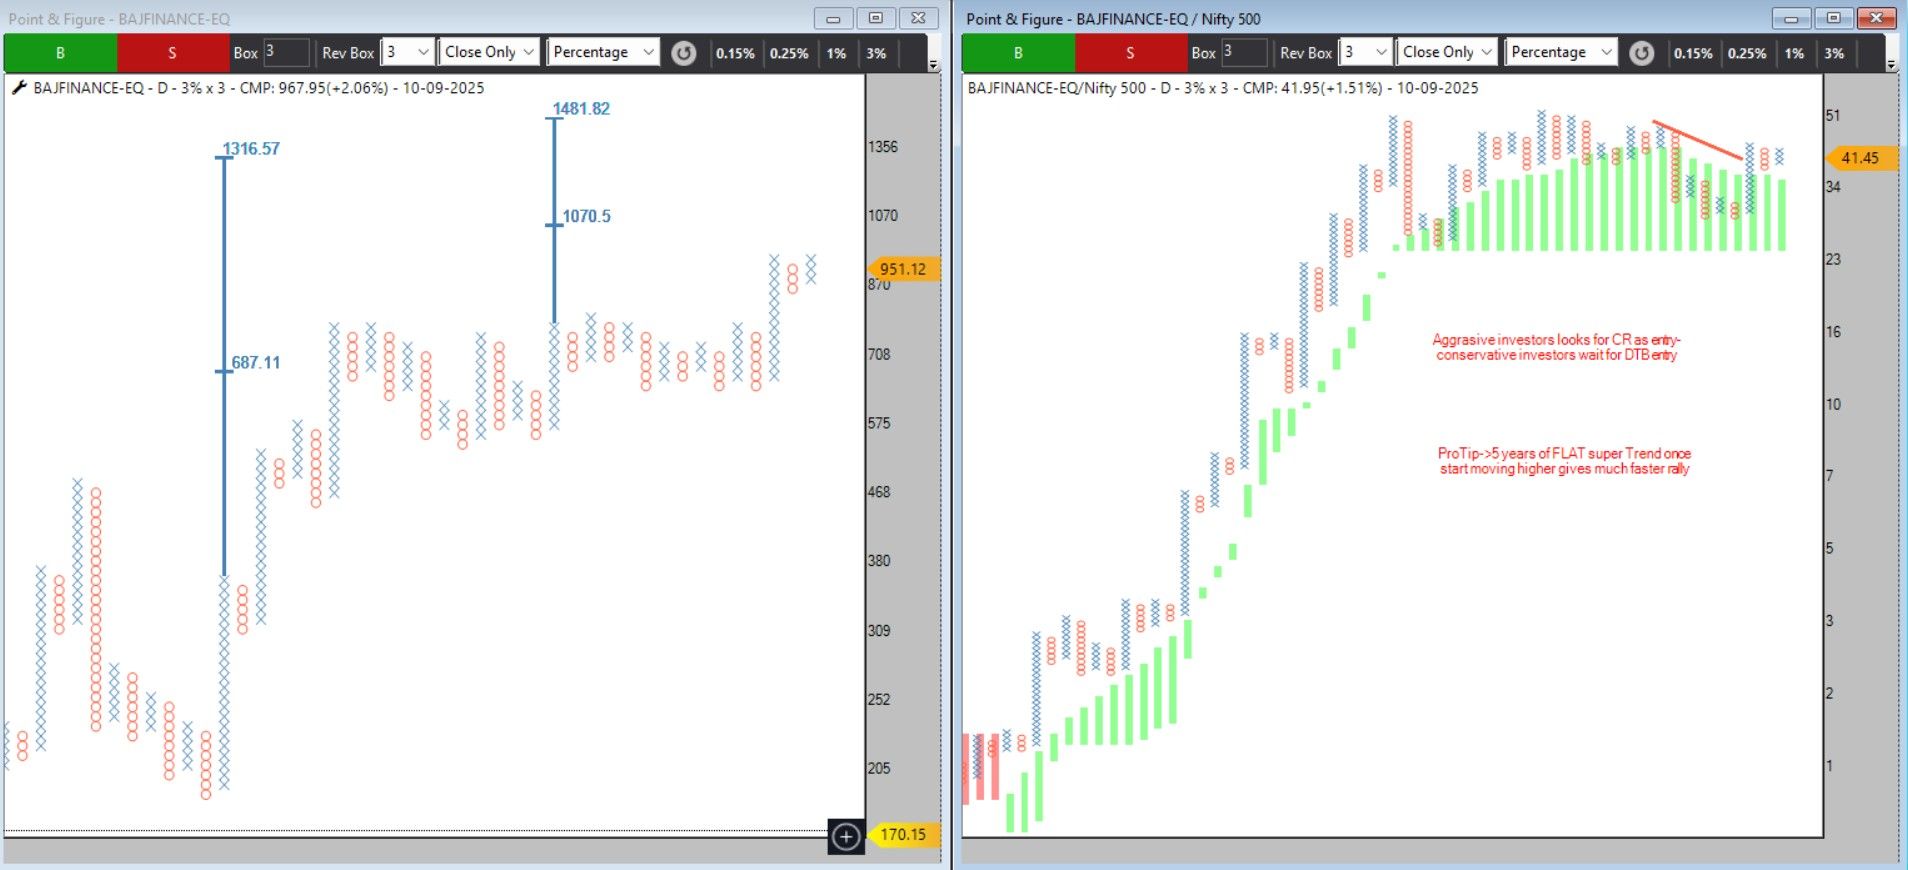
Nifty 500
Break below Super Trend indicator =>Bearish
ADX works very good for buy sell,now near to give sell signal if that happen then expect further downside move
for me as a momentum trader no scope for equity
#AhmedabadNest #nseindia #stockmarkets #analysis
 #VGM Pick – Karur Vysya Bank
#VGM Pick – Karur Vysya Bank
RS chart shows PCR above MAST with a running DTB bullish structure.
Risk Management: Trail positions with DBS as Stop Loss.
Price Action: A close above 231 will unlock multiple vertical counts projecting towards 318 and 455.
Allocation Strategy: Deploy 50% now and the remaining 50% on DTB confirmation.
A structured approach combining RS strength, pattern validation, and disciplined allocation helps balance risk & reward effectively.
Nishesh Jani,CFTe
#VGM #KarurVysyaBank #StockMarket #InvestmentStrategy #TechnicalAnalysis #SmartInvesting #RSChart #DTB #PCR #WealthCreation #nisheshjani #AhmedabadNest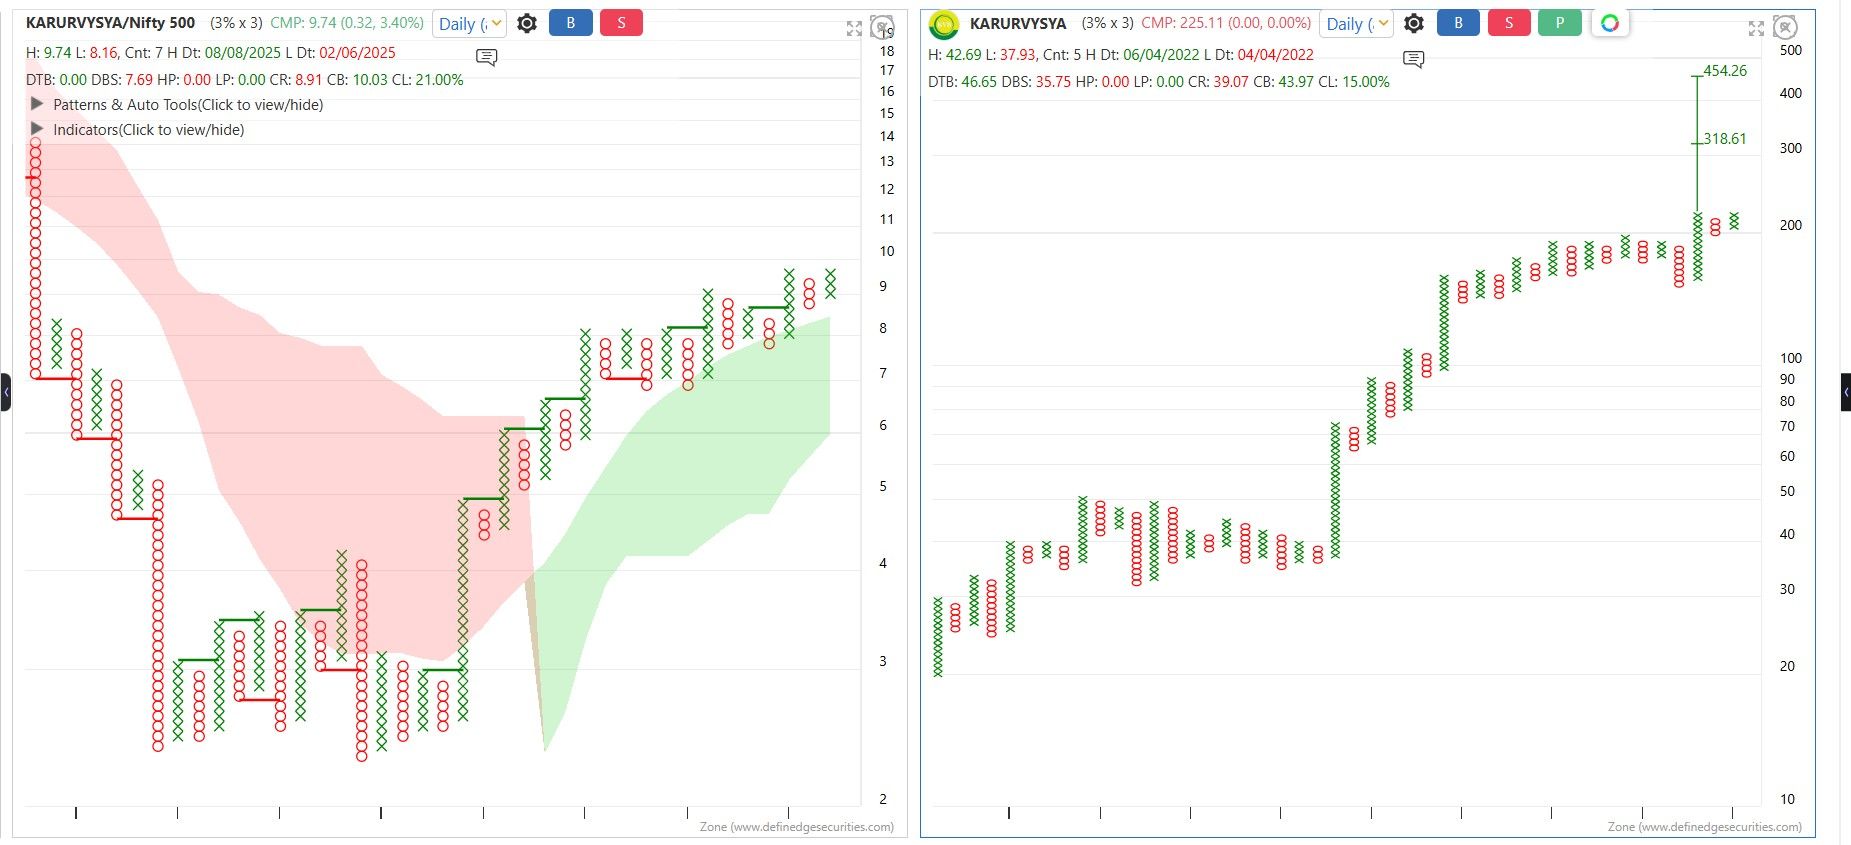
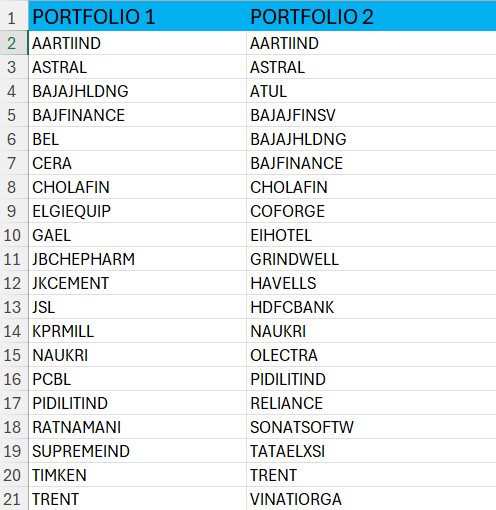
Portfolio for 2024
20 stock equal weightage 2 model portfolios
No re balance required -will remove if significant event like merger or serious corporate governance issue happen
#AhmedabadNest #2024 #yearly #portfolio #StockMarketindia #nseindia #Quant #DataScience #DataAnalytics
VGM Pick – JM Financial
VGM Pick – JM Financial
Technical Snapshot
RS Chart: PCR above MAST with running DTB (bullish strength).
Price Action: Stock has broken out above a 9-year consolidation period.
Pattern: Active Super Pattern with price counts projecting 259 and 400+ levels.
Strategy
Allocate 50% on PCR confirmation.
Allocate 50% on DTB breakout.
Use trailing DBS as a strict risk management tool.
This structured allocation ensures participation while keeping risk under control.
Nishesh Jani.CFTe
#VGM #StockMarket #TechnicalAnalysis #JMFinancial #BreakoutStocks #SmartInvesting #RiskManagement #ConsolidationBreakout #BullishSetup #nisheshjani #AhmedabadNest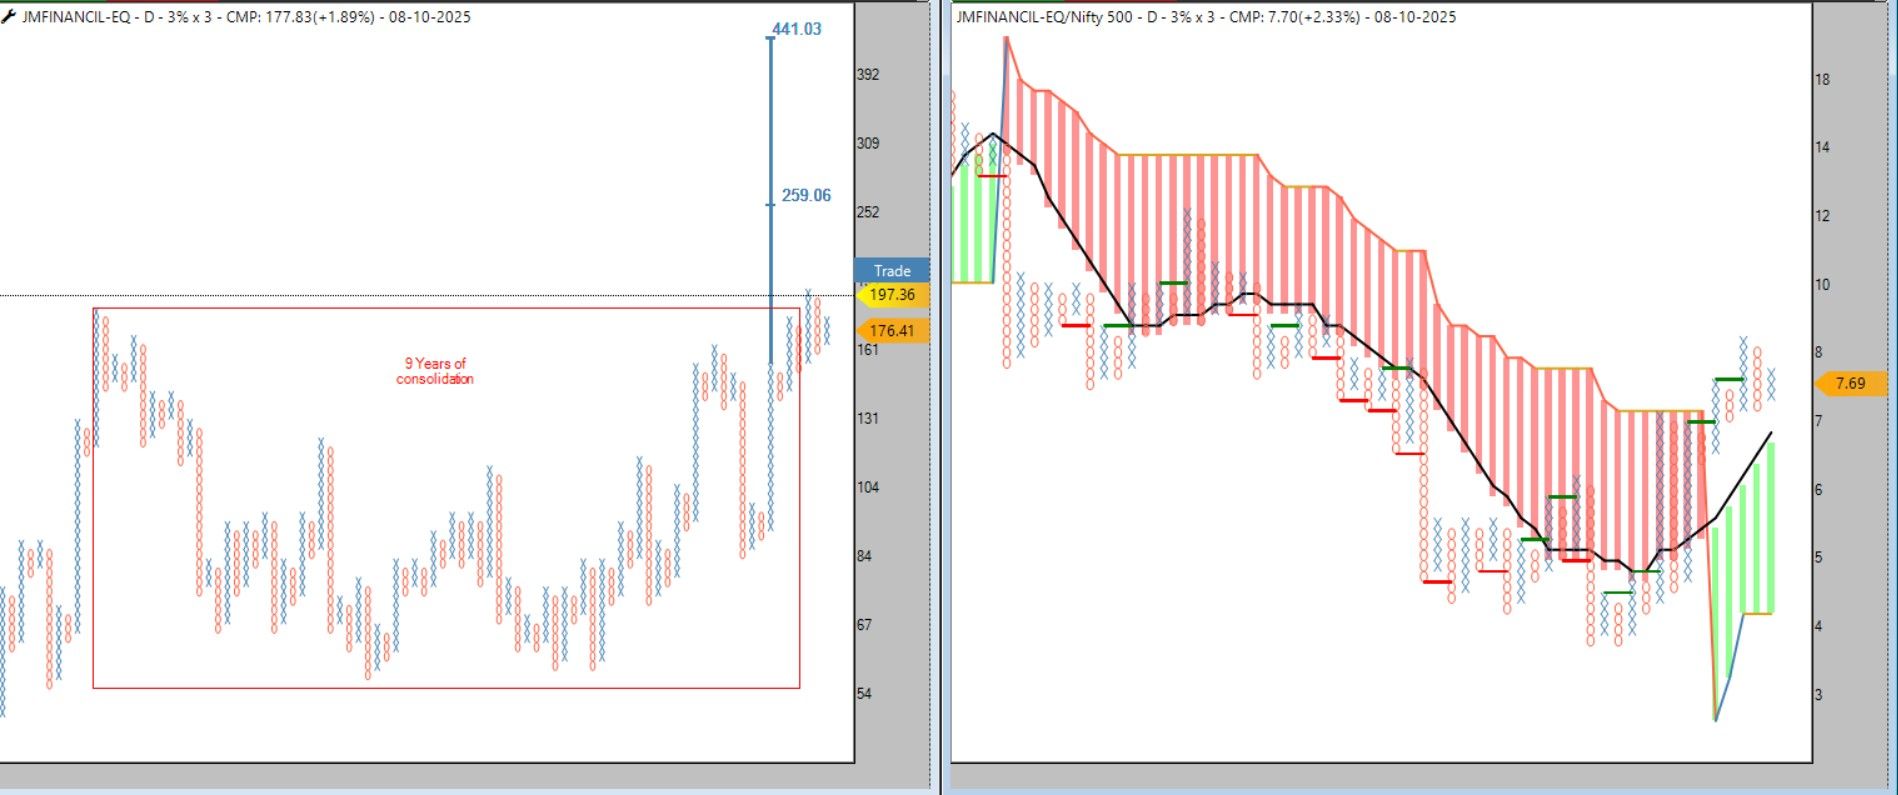
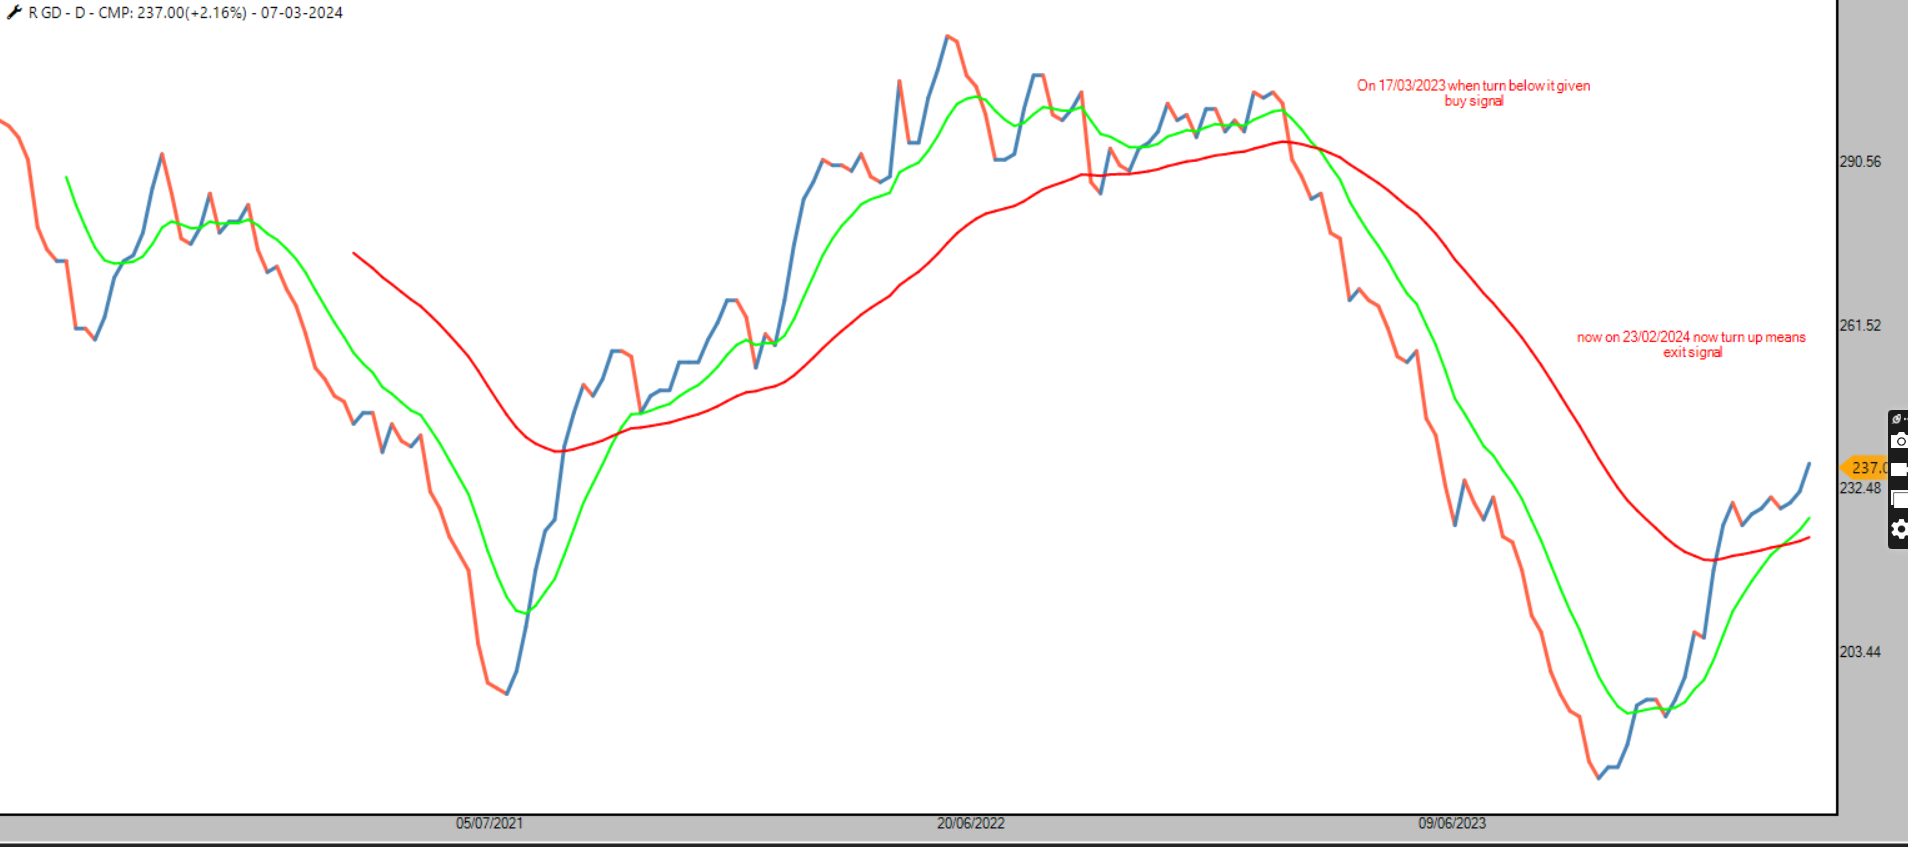
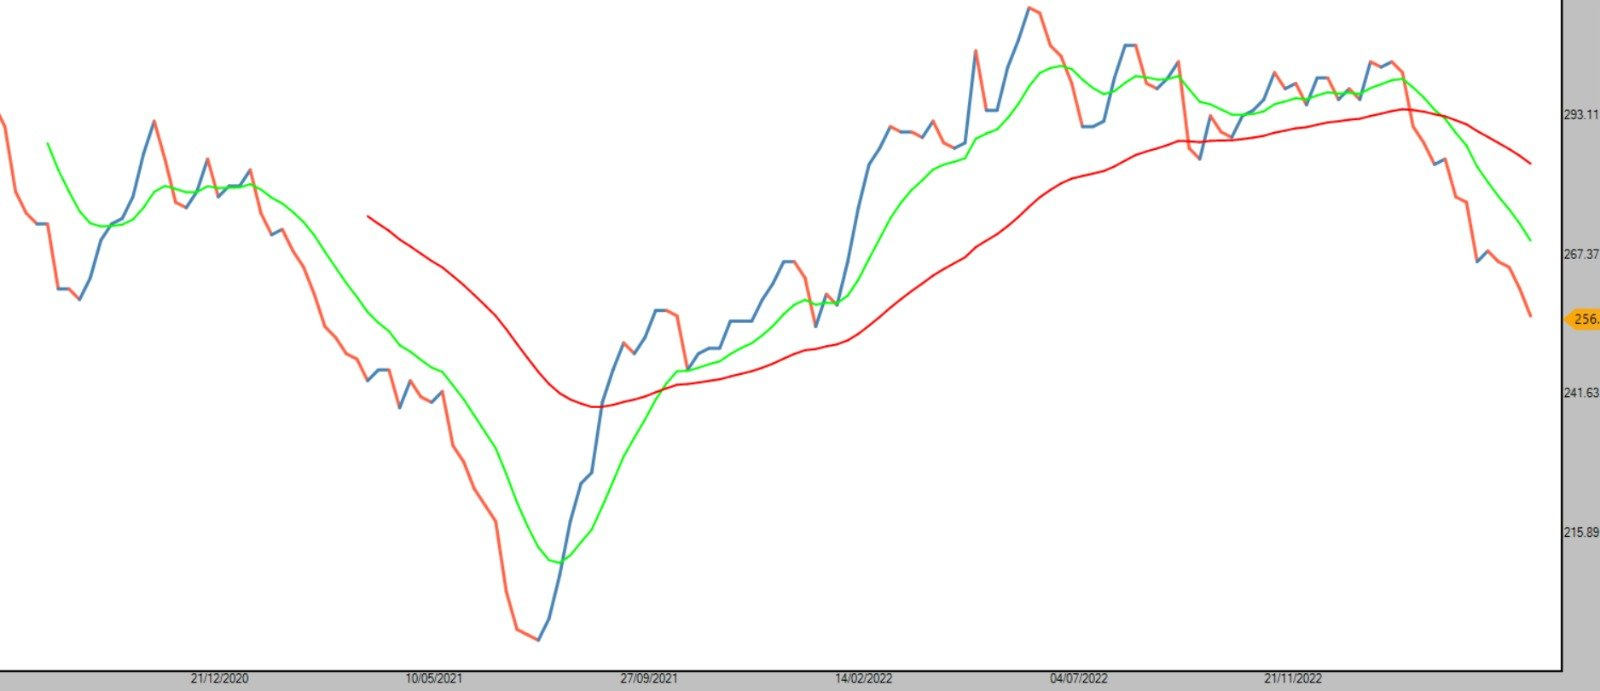
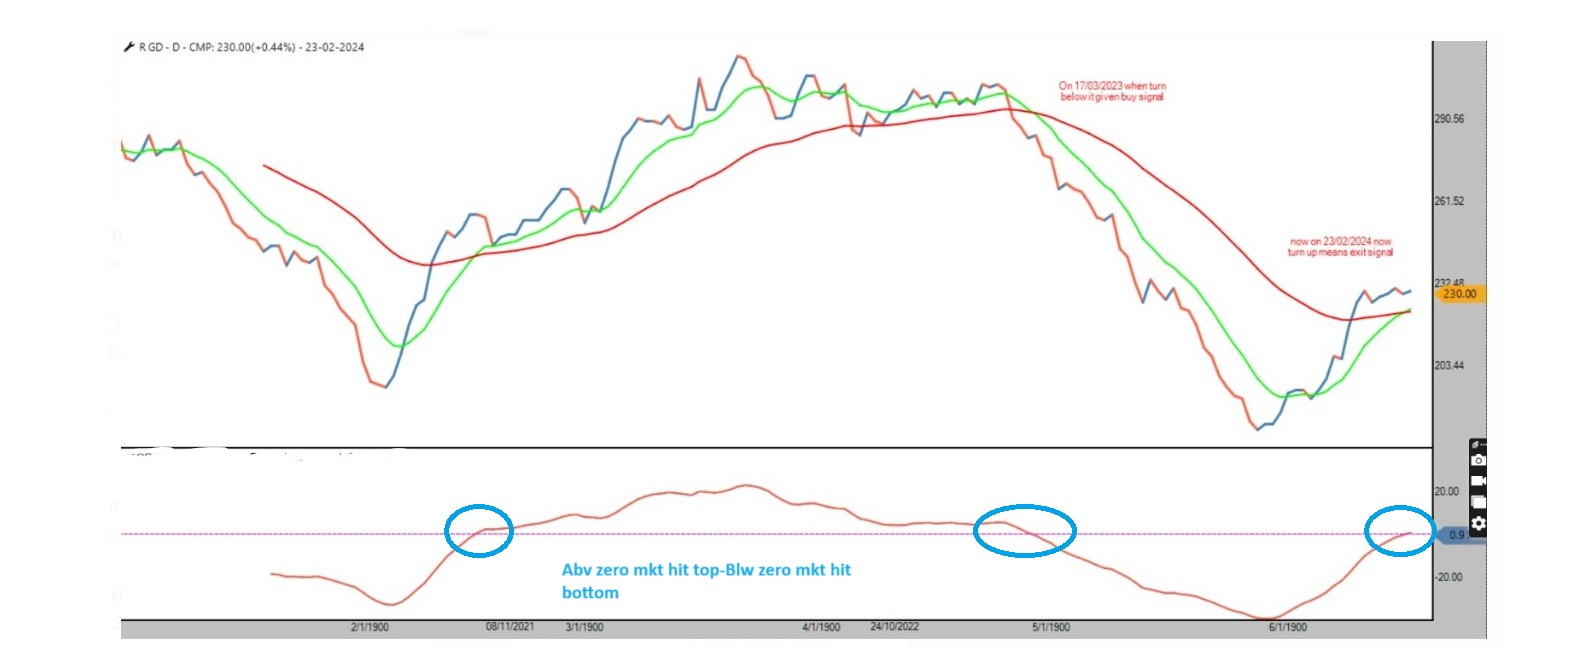
Conterian Indicator R GD flashed Exit Mode
Last time on 17/3/2023- This indicator flashed Entry Mode (check tweet )
When ever Indicator in Death cross and Below Zero-Entry Point into market
When ever Indicator in Golden cross and above Zero-Exit point from market
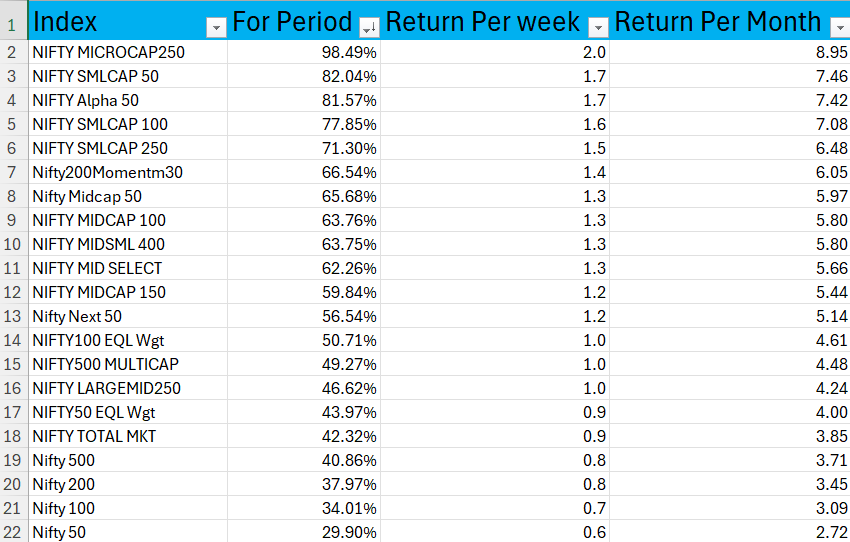
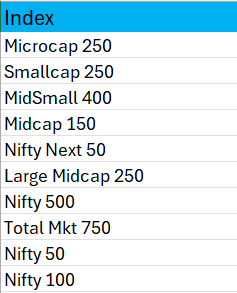
See how various Index has delivered Return weekly and monthly basis and net basis
Now based on my experience Few point to kept in mind
1-Long only apparoch will have little difficult time
2-Stop leverage Trading
3-Stop Marging Funding
4-High P/E stock will have more correction
5-Valuation will back to mean
"Will Feel it was market that it wants to give you Returns "
Also find image in which index i see more correction
attached image-R GD/ Return of various index/List of index where i see more correction
#AhmedabadNest #conterian #nseindia #StockMarketindia #Indicator #analysis #index
Thanks and Regards
Nishshkumar Jaani
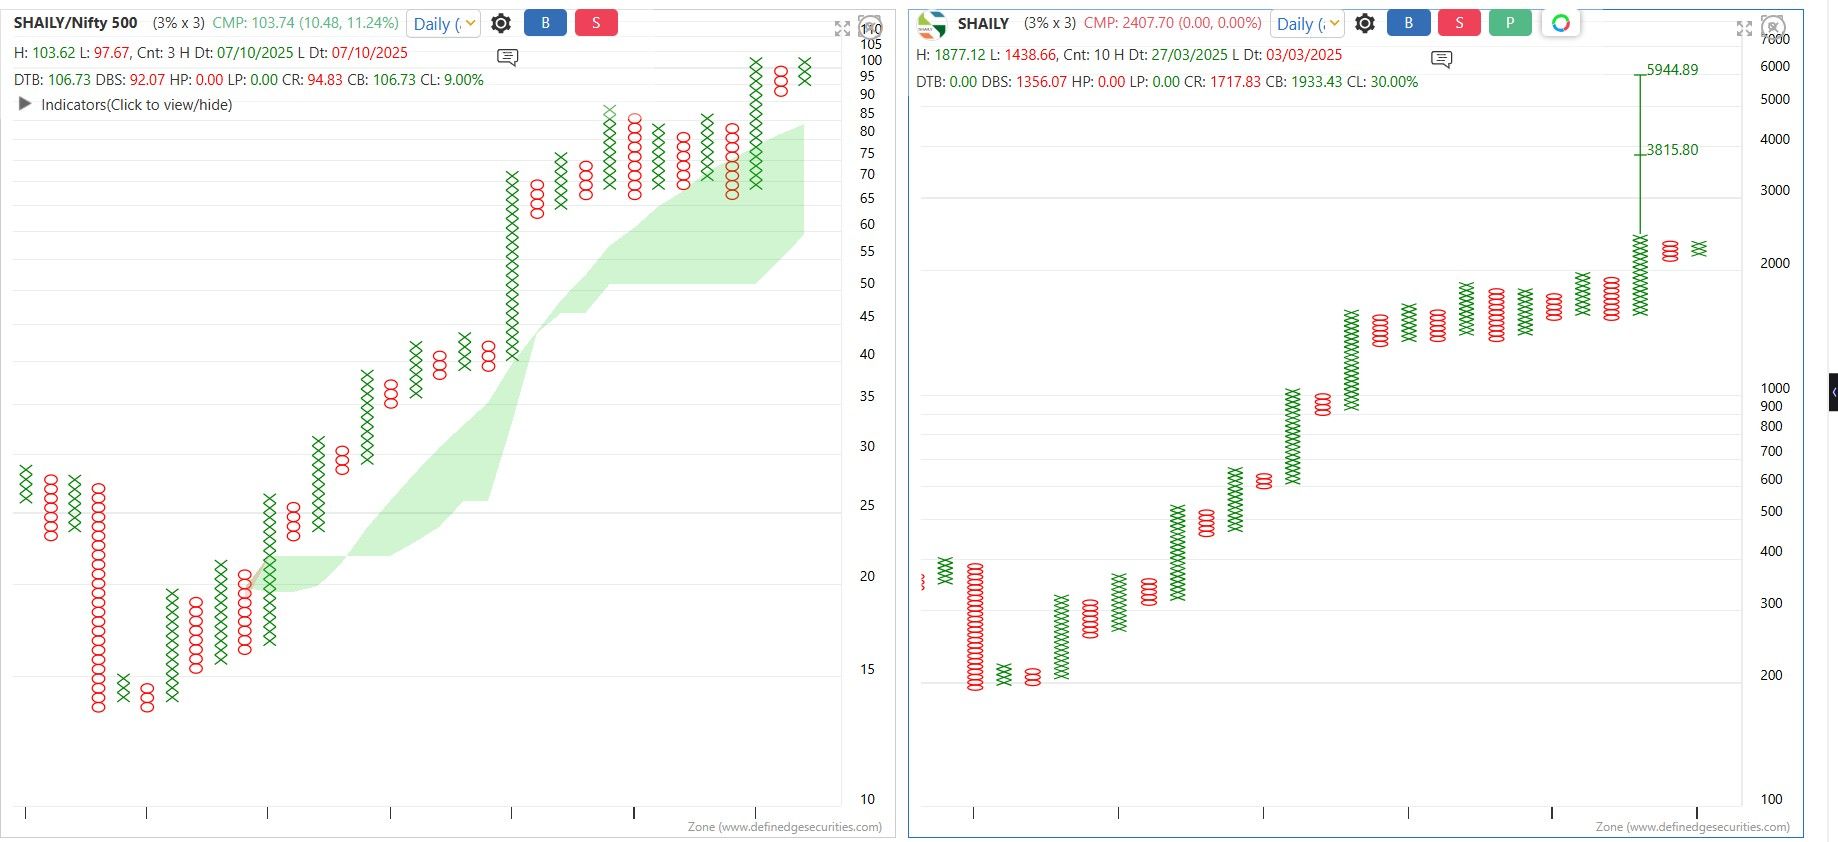
#VGM Pick – Shaily Engineering
#VGM Pick – Shaily Engineering
Shaily Engineering has triggered a Positive Column Reversal with bullish confirmations
RS Chart: Above MAST, last two column lows above MA
No immediate Double Bottom Sell → Continuation of DTB (bullish structure)
Price-wise Setup: Probable T-20 pattern with an active mini bottom
Vertical Counts: Target at 3815 (≈58% higher than current price of 2411)
Strategy :
Deploy 50% allocation now
Deploy remaining 50% on DTB confirmation with RS breakout (DBS as SL)
A structured, risk-managed way to participate in a promising bullish setup.
Nishesh Jani,CFTe
#VGM #StockMarket #ShailyEngineering #BullishBreakout #SmartInvesting #TechnicalAnalysis #PortfolioStrategy #nisheshjani #AhmedabadNest
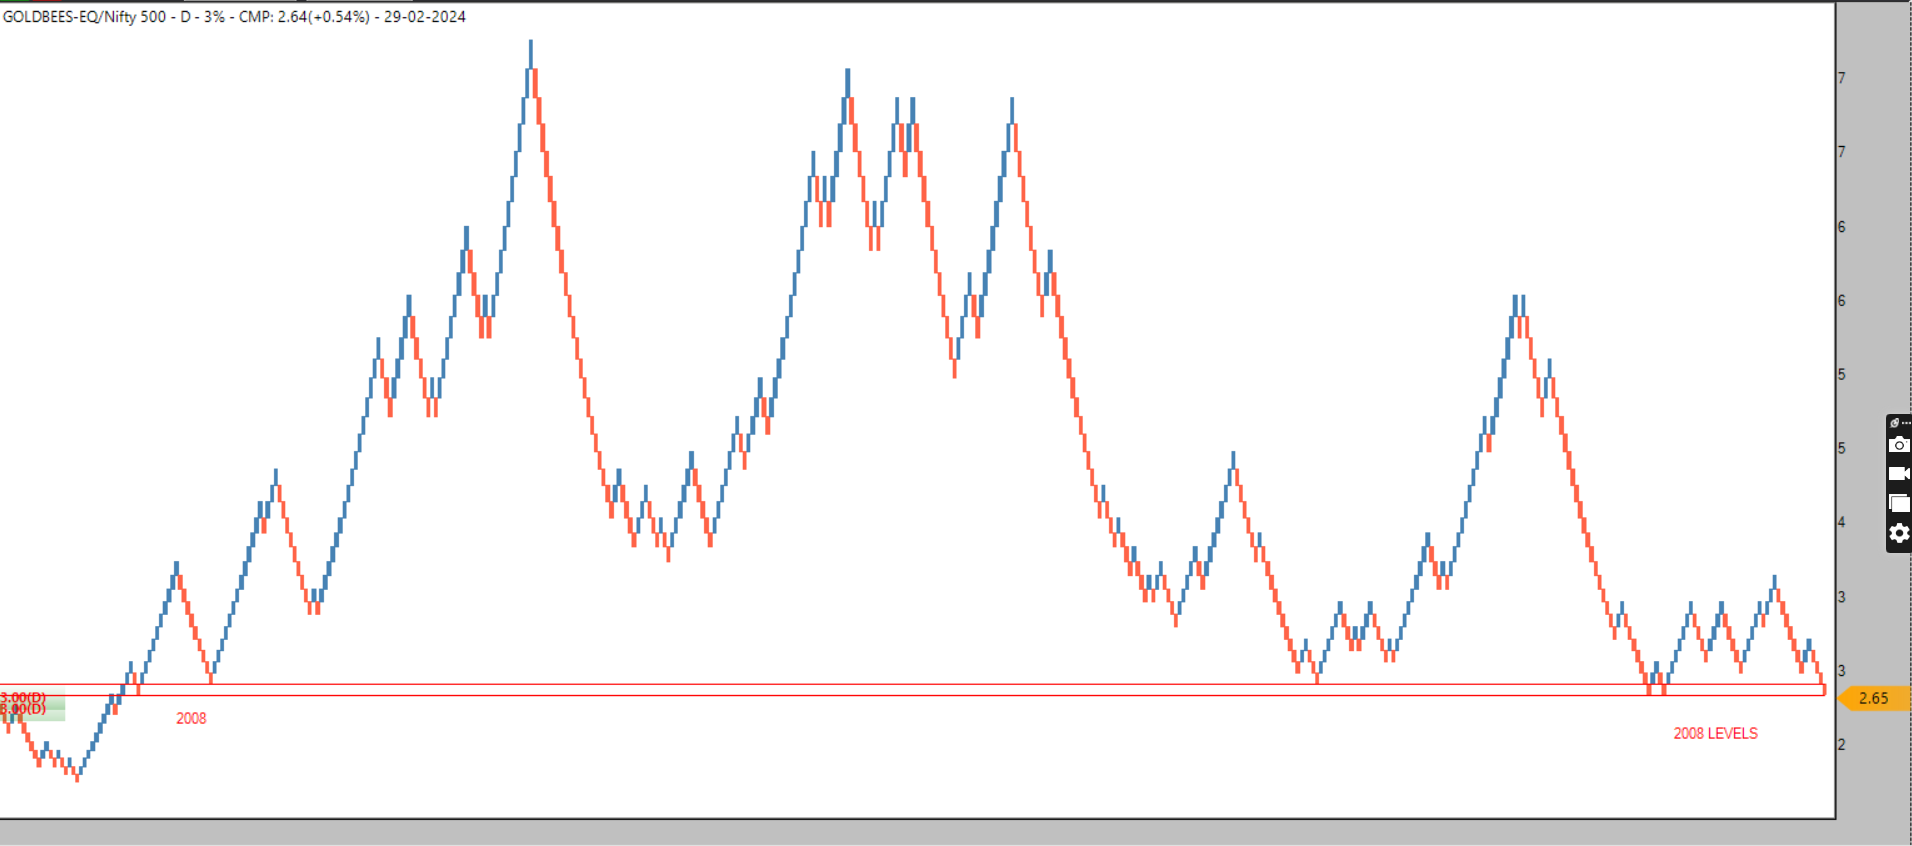
Ratio chart of GOLDBEES/NIFTY 500
Now trading at 2008 levels
Look for Bullish Setup to enter into Goldbees
Look For bearish Setup to Exit from market
#AhmedabadNest #nseindia #StockMarketindia #nifty #gold #rotation #assetclass
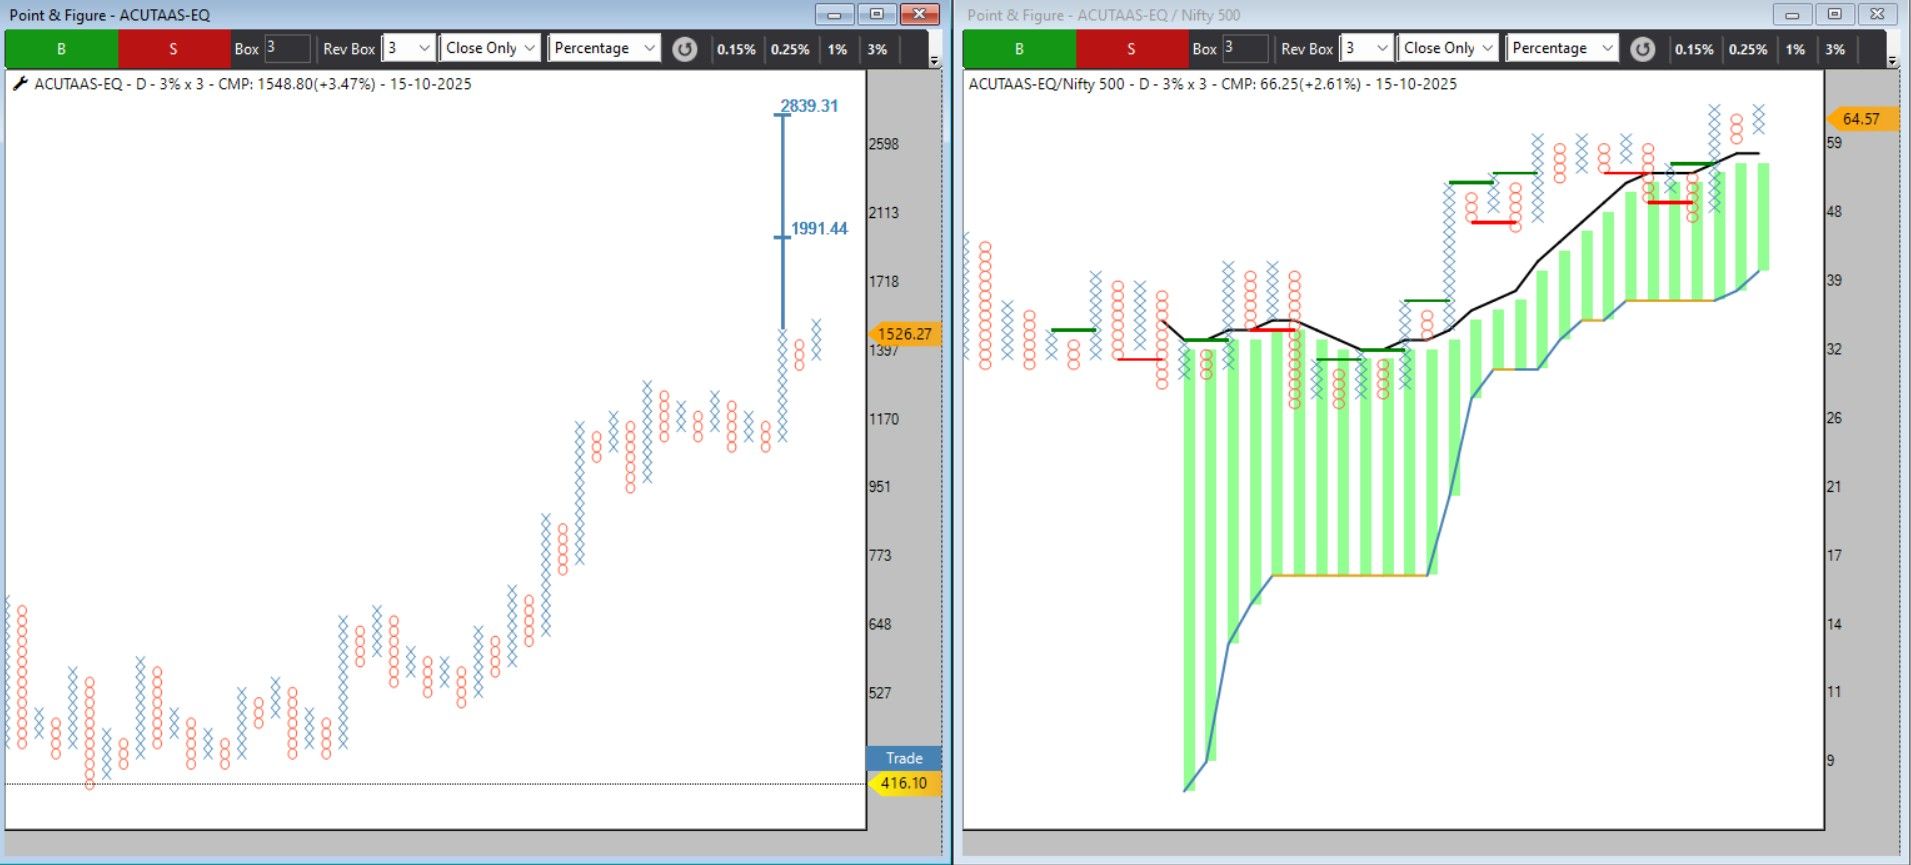
#VGM Pick – ACUTAAS
#VGM Pick – ACUTAAS
ACUTAAS has turned technically strong on both RS and Price Charts
RS Chart View:
PCR Reversal confirms renewed relative strength.
Last two column lows are holding above the Moving Average, indicating strong momentum.
Bullish MAST Indicator adds further confirmation of trend continuation.
Price Chart View:
DTB Signal Triggered with open vertical counts pointing towards ₹1,991 and ₹2,839,
i.e., +28% and +83% potential from CMP ₹1,548.
Strategy:
50% entry on PCR confirmation.
50% entry on DTB breakout in RS chart.
DBS as Stop Loss for RS-based traders.
Price-based traders can follow Price chart setup.
Momentum + Structure + Confirmation = High Conviction Setup
Nishesh Jani,CFTe
#VGM #ACUTAAS #MomentumStocks #TechnicalAnalysis #RSChart #BreakoutStocks #WealthWithDiscipline #TradingStrategy #MarketLeadership #ProfitWithConfidence #nisheshjani #AhmedabadNest
It is the first Liquid ETF in India that provides convenience of Growth NAV (Net Asset Value), thus making it easier to track and maintain by eliminating dividend tracking. Additionally, the returns are taxed only when the ETF is sold, unlike other ETFs that pay dividends and are taxed continuously.
So no problem of fraction Units and its calculation
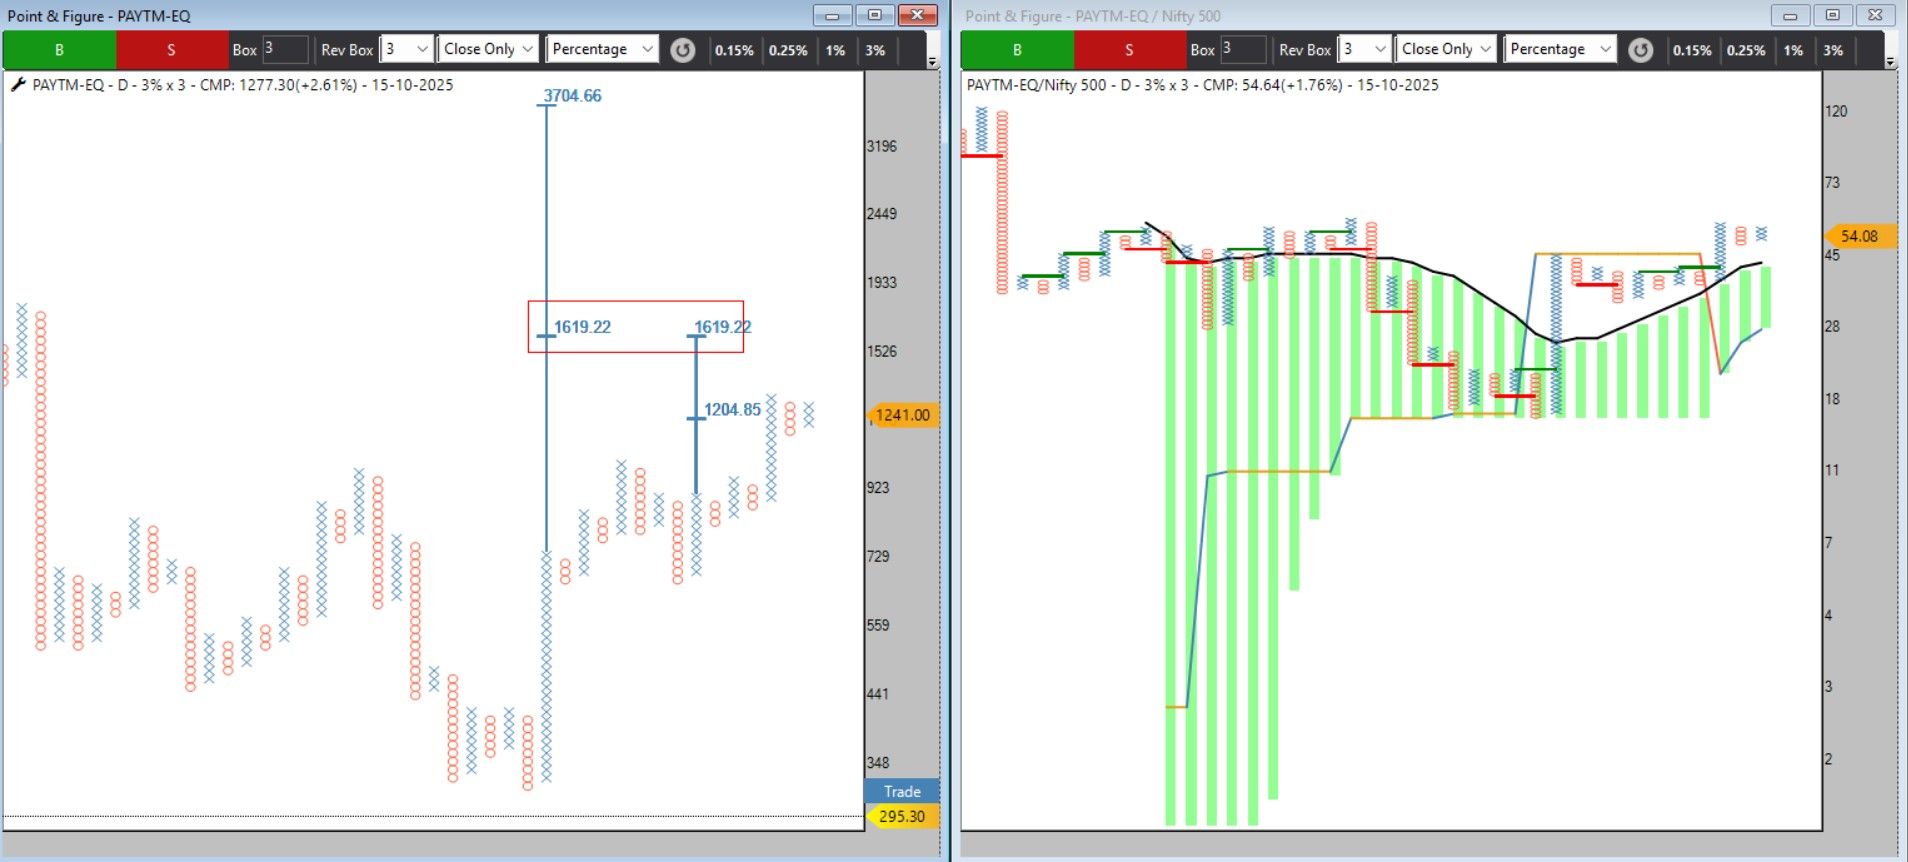
#VGM Pick – PAYTM
#VGM Pick – PAYTM
PAYTM has once again shown strength on both Relative Strength (RS) and Price Charts!
RS chart has given a PCR reversal with a Bullish MAST setup, and the last two column lows are holding above the moving average, confirming underlying strength.
 Price-wise:
Bullish open vertical counts are visible.
Short-term cluster count: 1619
Long-term projection: 3704
This setup aligns perfectly with our #VGM concept (Value • Growth • Momentum) — blending strength, structure, and sustainability.
Strategy:
50% entry on PCR signal
50% entry on DTB confirmation
Use DBS as a trailing stop-loss or follow a price-based approach for dynamic risk management whatever suits you.
Nishesh jani,CFTe
#VGM #PAYTM #MomentumInvesting #TechnicalAnalysis #RSAnalysis #PriceAction #StockMarketIndia #InvestSmart #WealthCreation #TradingSetup #DefinedEdge #BullishMomentum #TrendFollowing #nsiheshjani #AhmedabadNest
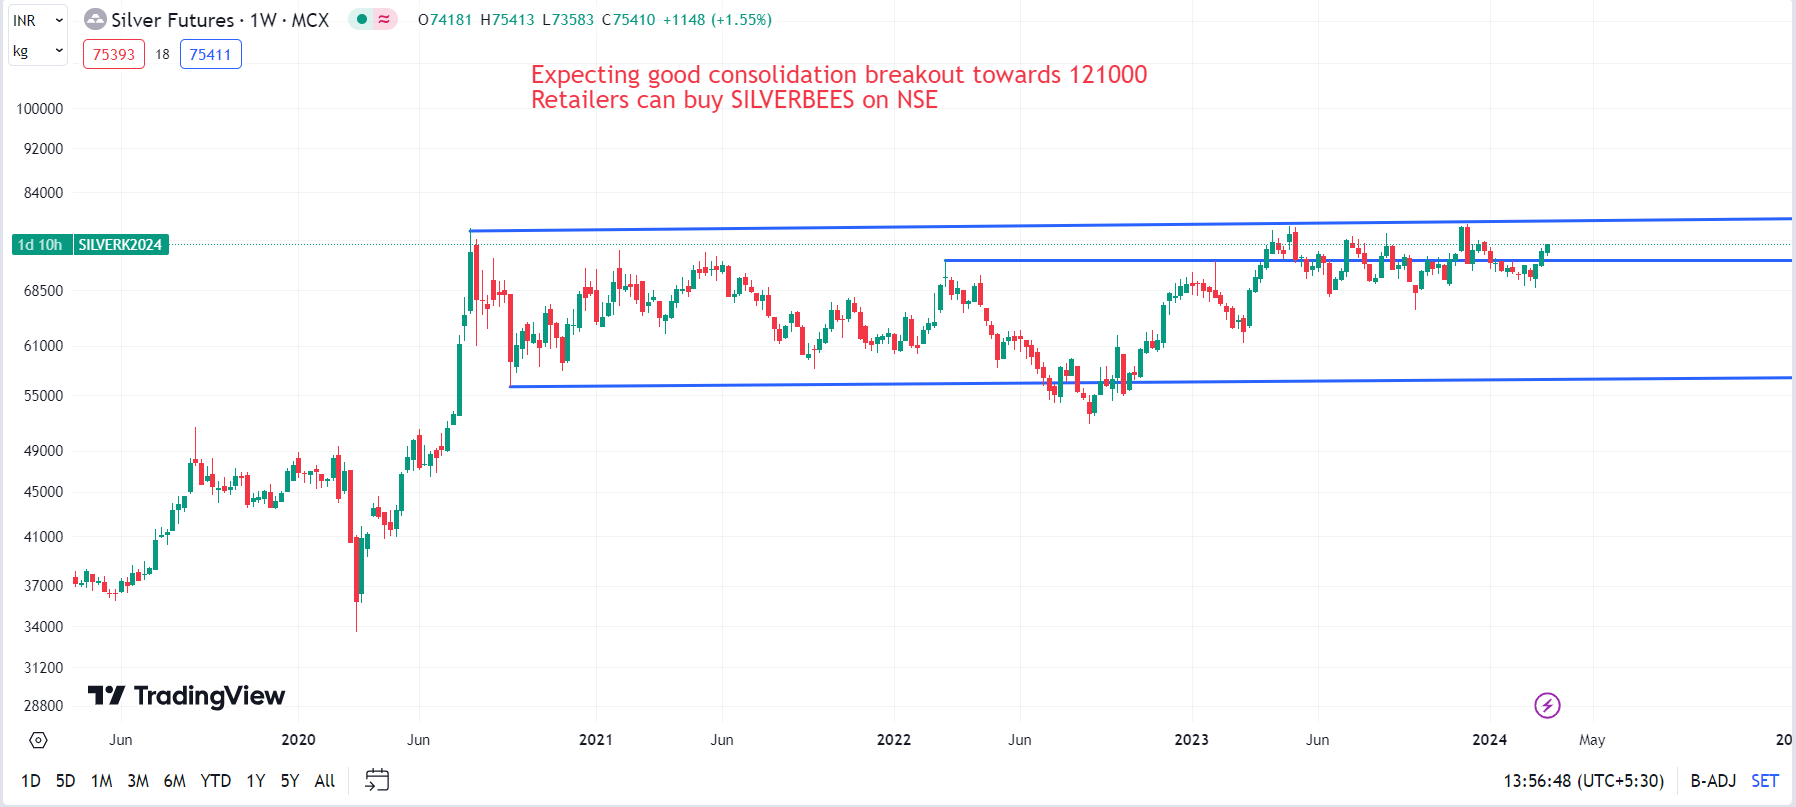
Silver
Mcx silver is trying to breakout after long consolidation
expecting 121000
Retailers can have an option on NSE-SILVERBEES
#AhmedabadNest #silversqueeze #analysis #India #mcx #nseindia #bees #ETFs
Midcaps Ready for Their Next Big Move
Midcaps Ready for Their Next Big Move
The Nifty Midcap 150 Index has recently broken out from two major consolidation-cum-resistance formations — Turtle Pattern & Bearish Multiple OPPs.
This comes after a strong Anchor Column, indicating a powerful structural shift in momentum.
Key Level to Watch:
20500 closing level is crucial support.
As long as the index holds above this, the upside remains open.
Potential Upside Targets (Vertical Counts):
26350 → around +17% potential
29400 → around +33% potential
This phase is often where strong quality midcap companies start leading and compounding portfolios.
To participate in this trend in a simple, diversified & cost-efficient manner, investors may consider:
Nippon India ETF Nifty Midcap 150 NSE Symbol: MID150BEES
we are accumalting now
Our View:
This is a high-probability structural opportunity, not just a short-term move.
Nishesh Jani,CFTe
#MidcapMomentum #WealthWithDiscipline #MID150BEES #NipponIndiaETF #MomentumInvesting #SmartInvesting #EquityWealth #MarketInsights #PortfolioGrowth #StayInvested #nisheshjani #AhmedabadNest 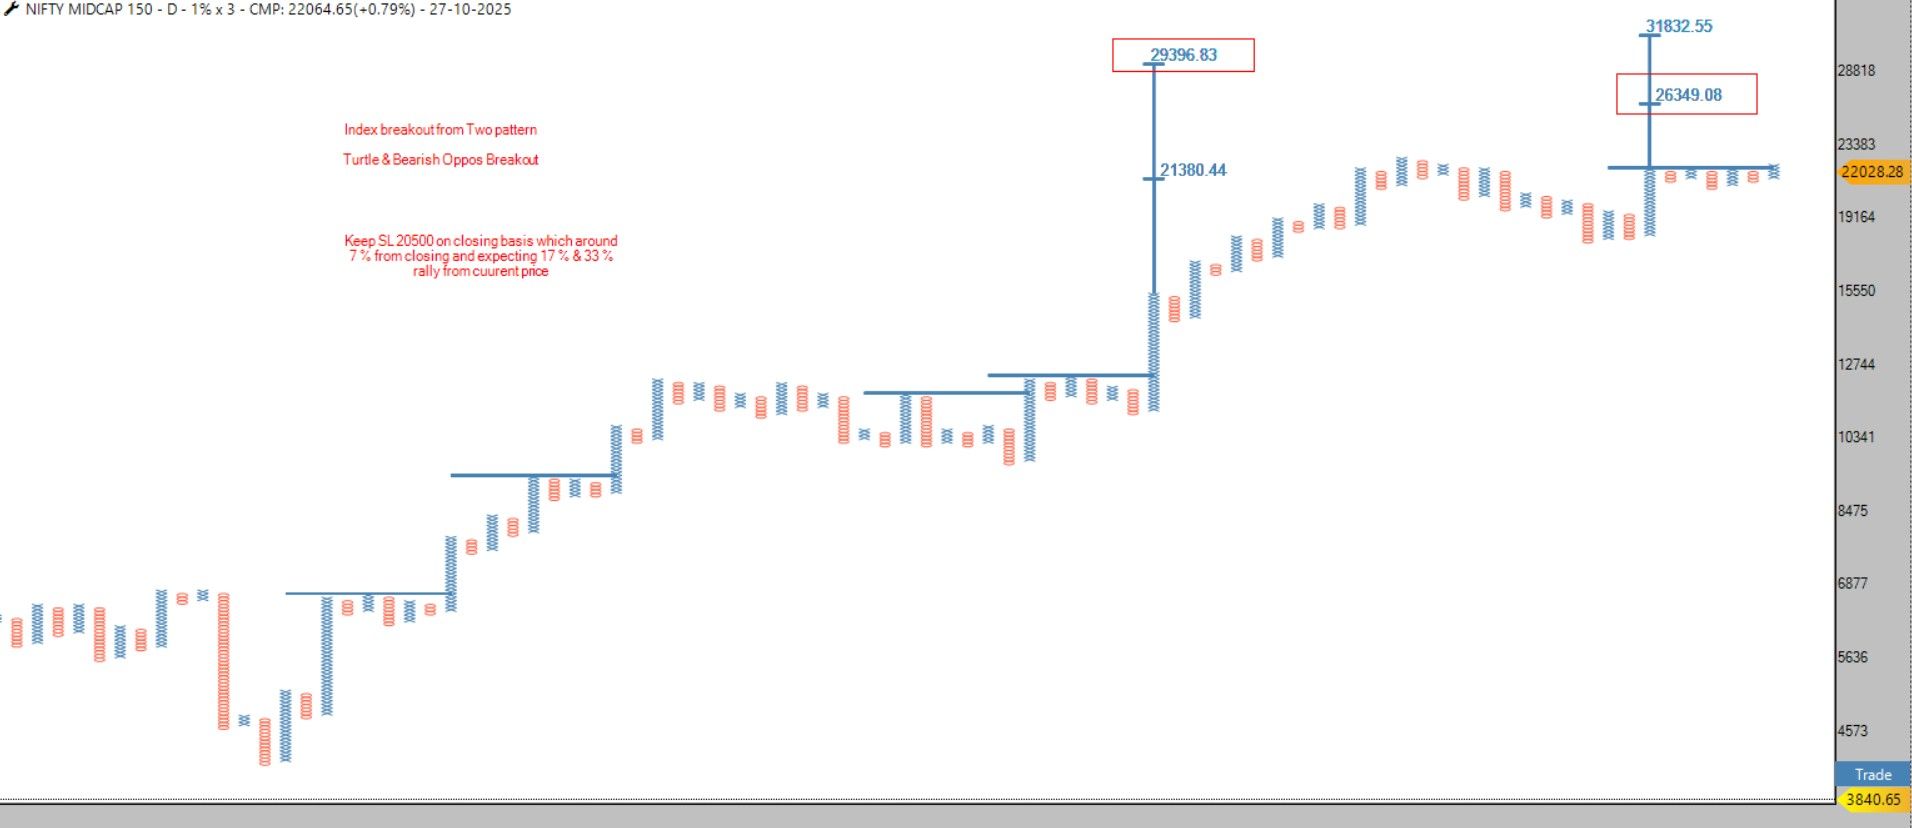
Time-Based Corrections: The Invisible Test of Patience
Markets don't always correct with sharp falls.
Sometimes, they move sideways, digesting gains with time instead of price.
These phases are mentally tougher than steep declines — because they test your patience, conviction, and discipline.
How smart investors deal with time corrections:
1️⃣ Detach from Noise
Avoid overanalyzing daily moves. Long consolidations often lead to strong breakouts — if your thesis is intact, stay put.
2️⃣ Focus on Fundamentals
Use this time to reassess business quality. If the company is improving operationally, the sideways move is just market digestion.
3️⃣ Track Relative Strength
In such periods, stocks showing strength while others move sideways are preparing for leadership. Spot them early.
4️⃣ Work on Self, Not Portfolio
Instead of tweaking your holdings every week, sharpen your process — backtest, read, or improve your discipline.
5️⃣ Revisit Allocation Strategy
Sometimes it's not what you buy, but how much and when. Fine-tune your position sizing based on conviction and volatility.
6️⃣ Zoom Out
Weekly and monthly charts help you stay objective. Sideways is painful only on a daily chart.
"Those who endure time corrections with clarity and composure often get rewarded when the market resumes its trend."
 Share this with someone who needs to hear this today.
Nishesh Jani,CFTe
#InvestingWisdom #StockMarketPatience #MarketPsychology #InvestorMindset #NisheshJaniInsights #nisheshjani #AhmedabadNest
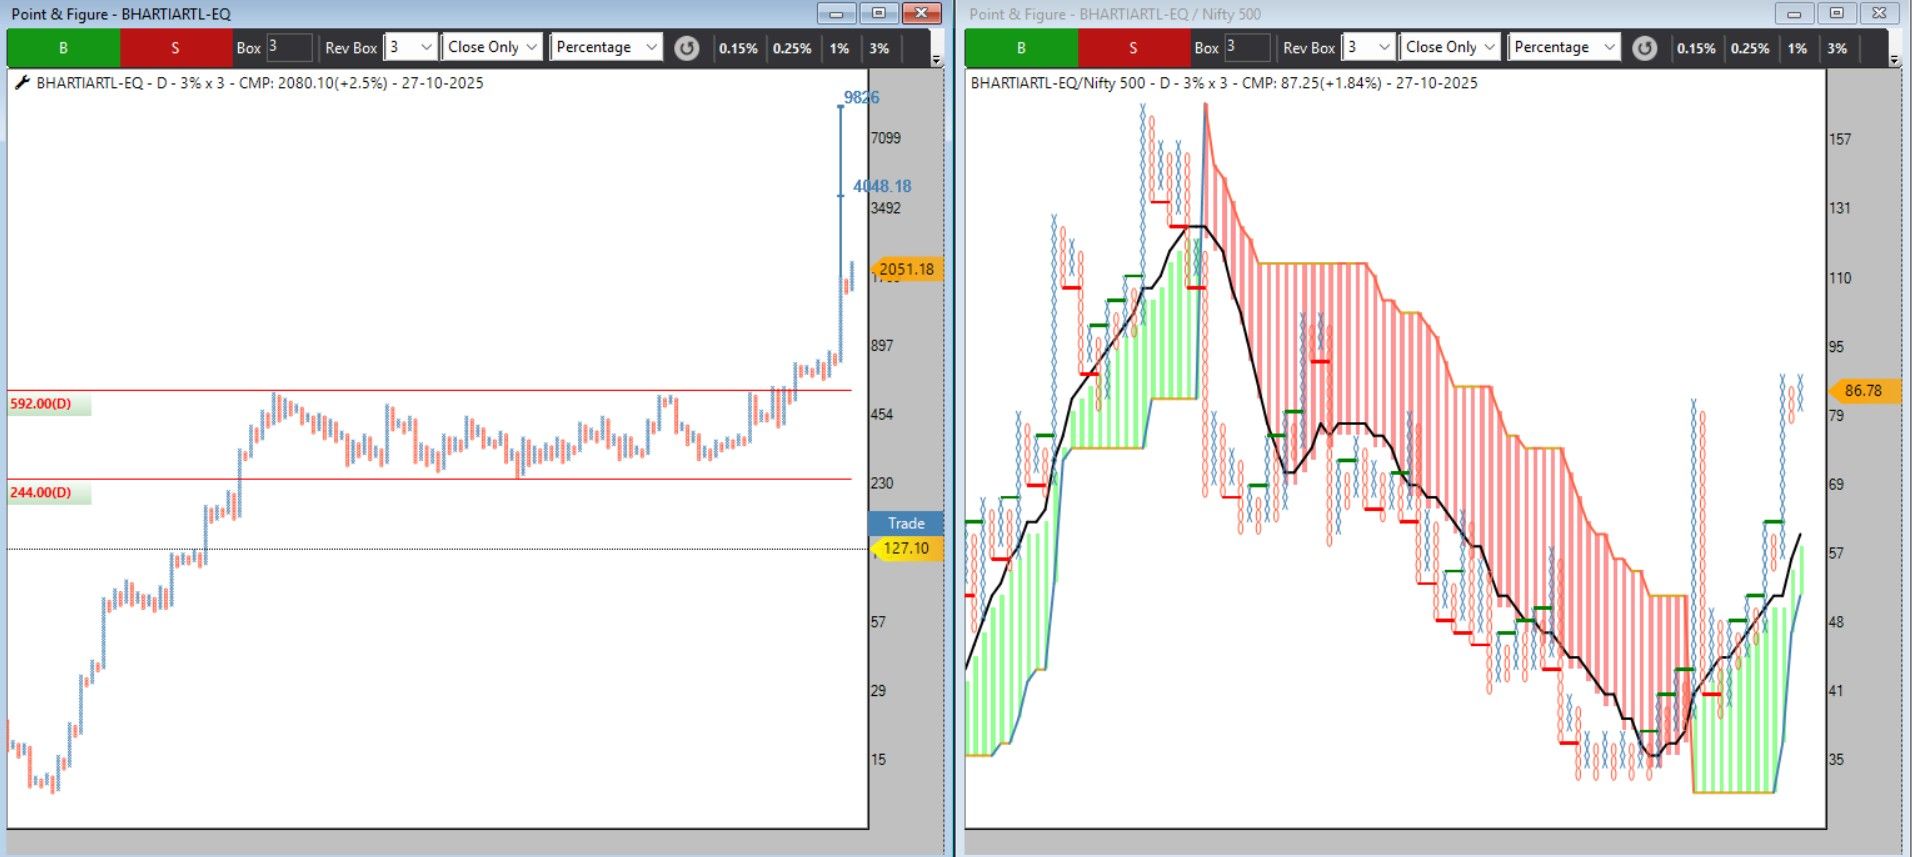
VGM Pick: Bharti Airtel
Bharti Airtel continues to show strong momentum on our VGM Relative Strength (RS) framework.
On the RS chart, the stock has given a PCR signal while continuing its Double Top Buy (DTB) formation, along with a Bullish Mast structure – a clear indication of strong trend continuation.
On the price chart, the pattern is an affordable breakout, opening up a conservative vertical target near ~₹4000 – which is almost 2x from current levels.
For Execution:
Investors and traders may choose their entry & exit based on the RS or Price structure, aligned to their affordable box size and trading system.
For simplicity, one may follow VGM RS rules with predefined price levels to maintain discipline.
Sometimes, clarity is more powerful than speed.
Stay systematic, stay consistent.
Nishesh Jani,CFTe
#VGMStrategy #MomentumInvesting #BhartiAirtel #SmartInvesting #DisciplinedTrading #WealthWithWisdom #MarketLeadership #nisheshjani #AhmedabadNest
Momentum Factor – Riding the Winners
Momentum is one of the most powerful drivers of stock performance. History shows that stocks which have been performing well tend to continue their winning streak in the near term.
This index captures momentum using both:
6-month performance (short-term momentum)
12-month performance (long-term momentum)
By applying risk-adjusted Z-scores and equally weighting both periods, the index ensures that only stocks with consistent strength– not just short-lived rallies – make it to the portfolio.
 Quality Factor – Strength Behind the Growth
Momentum alone is not enough. A stock must also represent a fundamentally strong company with a durable business model. The quality screen ensures this by measuring:
Return on Equity (ROE) – higher efficiency in generating returns.
Debt-to-Equity (D/E) Ratio – preference for financially stable companies.
Earnings Growth Stability (EPS) – lower volatility in profits over the last 5 years.
This way, only businesses with sustainable competitive advantages and reliable financial health qualify.
By combining momentum with quality, the portfolio reflects:
Growth + Stability
Performance + Reliability
Opportunities + Risk Management
 The Investor Advantage
For investors, this strategy means:
Exposure to high-potential mid and small-cap leaders.
A balance between short-term performance momentum and long-term fundamental strength.
A disciplined, rules-based approach that avoids emotional investing.
We start buying ETF of this potential opportunity -NSE ETF CODE=>MIDSMALL CMP 48.21
Nishesh Jani,CFTe
#MomentumQuality #InvestorAdvantage #MidSmallCap #GrowthWithStability #WealthWithWisdom #SmartInvesting #ETFInvesting #NSEIndia #MIDSMALL #DisciplinedInvesting #QualityMatters #RidingTheWinners #nisheshjani #AhmedabadNest
HEG | Structural Strength Emerging
HEG is a leading manufacturer of graphite electrodes, a critical input for steel production. With metals demand expected to improve, the company stands to benefit from a cyclical upturn in the steel value chain.
From a price-structure perspective, the stock is showing constructive signs. Multiple open vertical counts project potential towards 1000 and 1300. The recent negation of a bearish anchor column further strengthens the bullish setup.
Traders and investors can keep HEG on their radar and align positions as per their individual systems, as long as the stock holds the key level of 454 on a closing basis.
Not a recommendation.
Nishesh Jani,CFTe
#HEG #GraphiteElectrodes #SteelSector #Metals #TechnicalAnalysis #PriceStructure #StockMarket #TrendFollowing #nisheshjani #AhmedabadNest 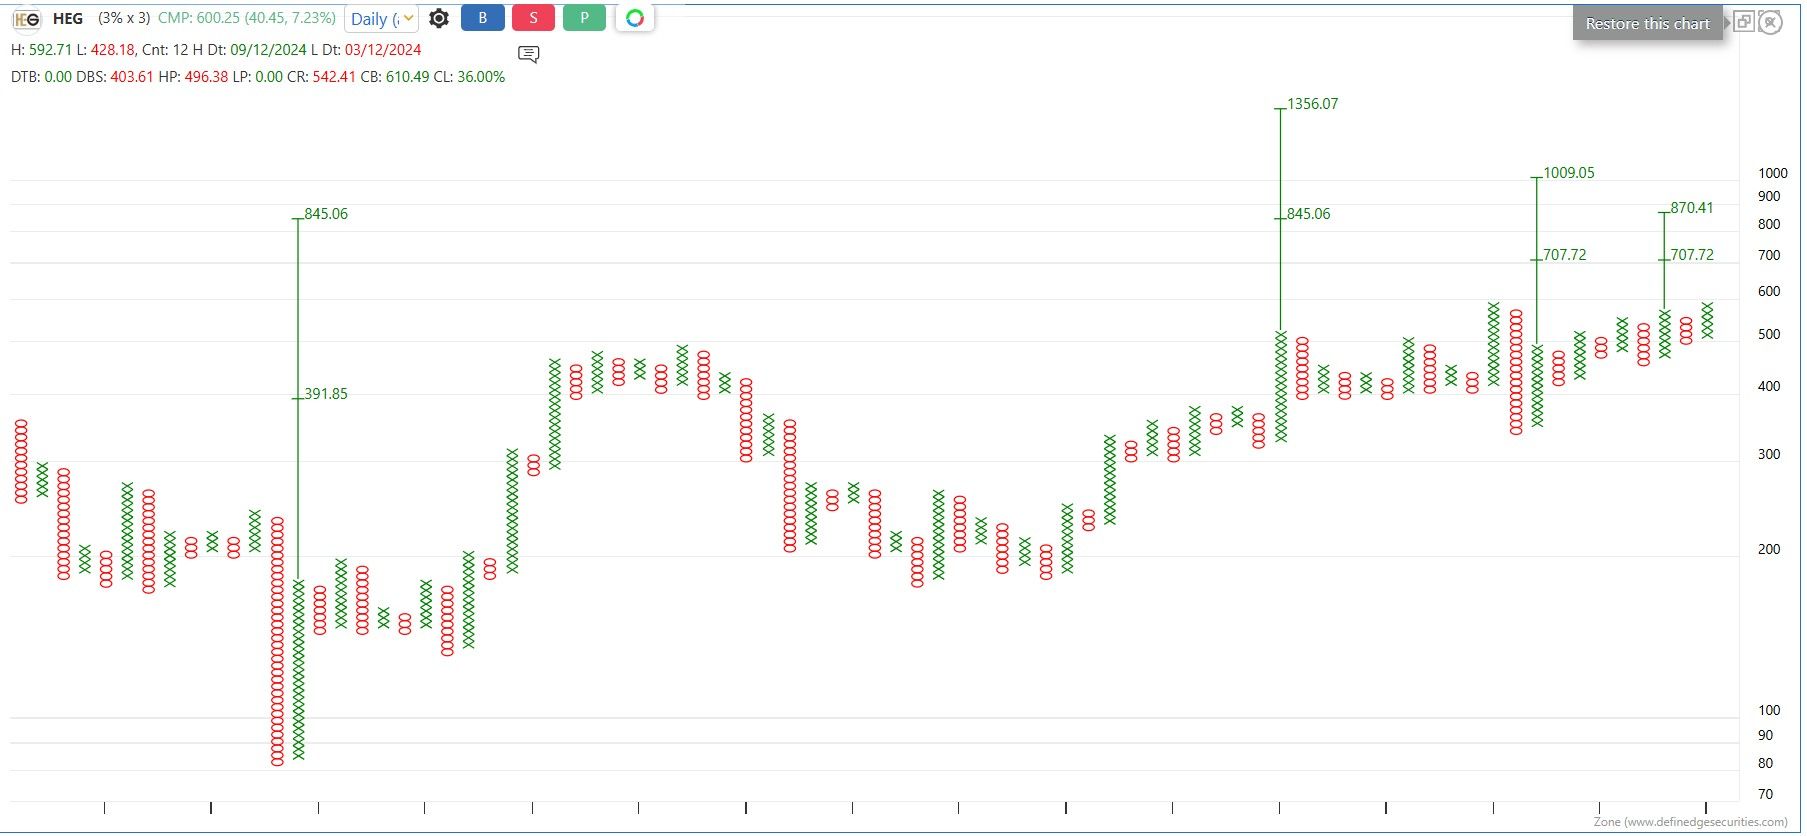

 Shubh Navratri to all my Stock Market Warriors!
Shubh Navratri to all my Stock Market Warriors!
Just like Navratri teaches us discipline, patience, and devotion, successful investing & trading also require faith in your process, discipline in execution, and patience in results.
 May Maa Durga bless you with the strength to hold your conviction, the wisdom to manage risks, and the courage to overcome market volatility.
This Navratri, let’s celebrate not just the festival, but also the journey of building wealth with positivity and balance. 
 Wishing you Profitable Trades & Peaceful Investments!
Nishesh Jani,CFTe
#HappyNavratri #StockMarketWisdom #DisciplineAndPatience #ProfitableJourney #ShubhNavratri #StockMarketIndia #InvestingWithFaith #TradingWithDiscipline #nisheshjani #AhmedabadNest
BPCL | Technical Breakout Update
BPCL | Technical Breakout Update
BPCL has confirmed a clean breakout from a well-formed rounding base (Cup & Handle pattern)—a classic sign of accumulation and trend continuation.
The structure suggests strong upside potential towards 460 and beyond
As long as the stock holds above 350 on a closing basis, the bullish setup remains intact
Traders can keep BPCL on their radar and participate strictly as per their own trading system and risk management rules
As always, price structure and follow-through will be key. Let the market validate the move.
Nishesh Jani,CFTe
#BPCL #TechnicalAnalysis #CupAndHandle #ChartPatterns #StockMarketIndia #TrendFollowing #PriceAction #TradingSetup #InvestingEducation #nisheshjani #AhmedabadNest 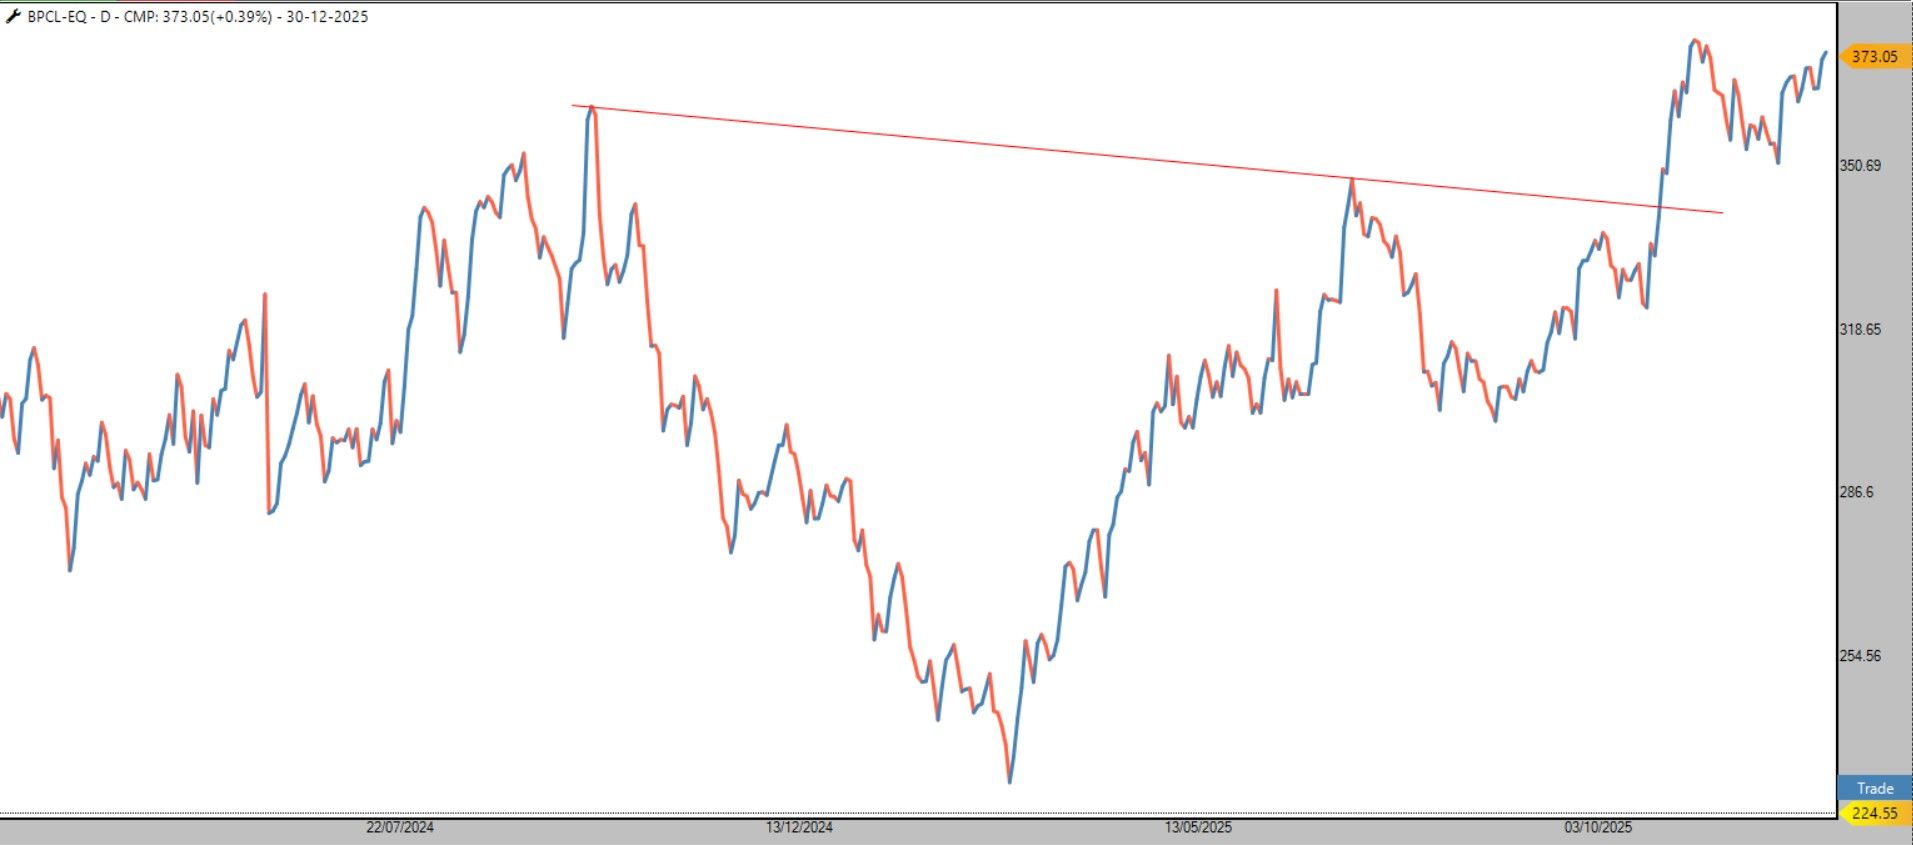
“Momentum may rest, but it never retires – dips are opportunities, not threats.”
we continue to accumulate our three momentum-driven ETFs – ALPHA, MOMENTUM50, and MIDSMALL – during this correction and consolidation phase.
Why? Because history shows that adding in weak phases builds the strongest foundation for long-term outperformance. When the market turns bullish, those who stayed disciplined and invested are the ones who reap the maximum fruits.
Stay calm, stay invested – this is the time to build, not to exit.
Nishesh Jani,CFTe
 #MomentumInvesting #ETFStrategy #SmartBeta #FactorInvesting #AlphaGeneration #MarketCorrection #BuyTheDip #StayInvested #LongTermWealth #PatiencePays #nisheshjani #AhmedabadNest
Aether Industries Ltd | Technical + Business Snapshot
a specialty chemicals company manufacturing advanced intermediates for pharma, agrochemicals, material science, coatings, additives, and oil & gas, with strong capabilities in CRAMS & contract manufacturing.
Technical View:
Stock has formed a Bullish Oops pattern
Breakout from the largest bearish 45° trendline indicates trend reversal
Structure suggests a potential move towards ATH and ₹1300
View remains positive as long as price holds ₹795 on a closing basis
Investors & traders: Keep this stock on radar and trade as per your own system with disciplined risk management.
Nishesh Jani,CFTe
#AetherIndustries #SpecialtyChemicals #TechnicalAnalysis #BreakoutStocks #BullishSetup #StockMarketIndia #Investing #TradingSetup #nisheshjani #AhmedabadNest 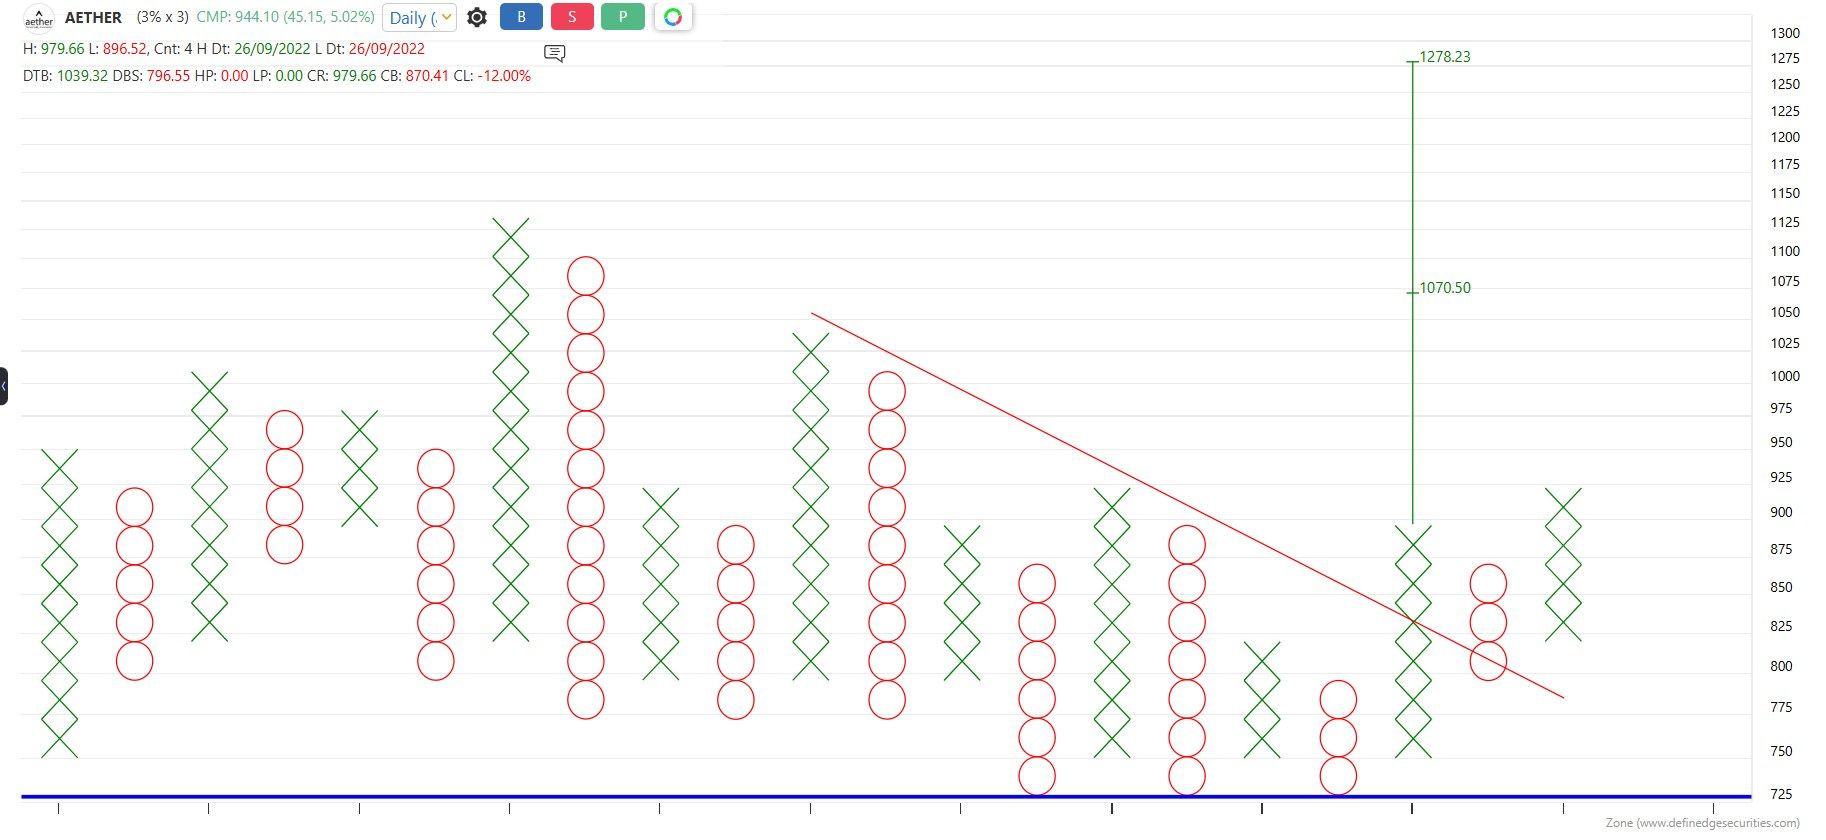
Seasonal Tailwinds Are Back! 
Seasonal Tailwinds Are Back!
Historically, November and December have been among the most rewarding months for Indian markets — with 67% and 74% positive ratios respectively.
Even more interesting, in years when January and February were negative, markets have often ended the year on a strong positive note — except 2011. With 2025 showing a similar pattern, the odds favor a robust year-end rally ahead.
Now is the time to stay invested or increase exposure to quality opportunities — and let seasonality work in your favor.
Participate with confidence. The trend may be your best ally this year-end!
We are constatly accumaling our Favourite ETFs
ALPHA->MOMENTUM50->MIDSMALL->MID150BEES
Nishesh Jani,CFTe
#MarketInsights #YearEndRally #InvestSmart #StockMarketIndia #SeasonalityEdge #WealthGrowth #EquityInvesting #StayInvested #nisheshjani #AhmedabadNest
GLENMARK | Technical Breakout Update
has decisively broken out of a Falling Wedge — a classic bullish continuation / reversal pattern after a strong prior uptrend.
Falling Wedge breakout signals trend resumption
Indicates absorption of supply and renewed buying strength
Structure supports a potential 30% upside over the coming phase
Path opens for higher levels ahead
🧭 Actionable Insight:
Traders & investors can keep on radar Trade as per your own system
Trend paused, digested gains, and is now preparing for the next leg higher.
Nishesh Jani,CFTe
#GLENMARK #TechnicalBreakout #FallingWedge
#IndianStockMarket #MomentumStocks #PriceAction
#StockOnRadar #TradeWithDiscipline #MarketStructure #nisheshjani #AhmedabadNest 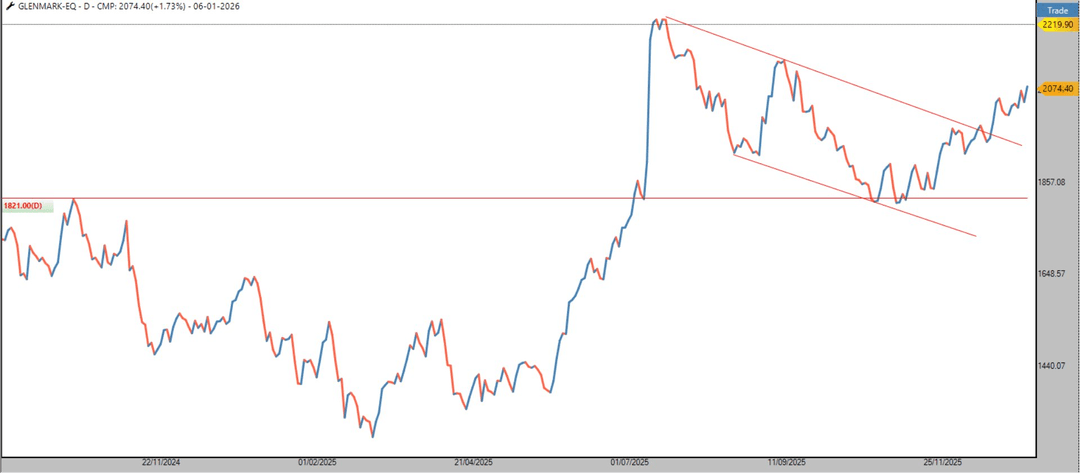
#VGM Case Study & Home Work – Tata Elxsi
A clear example of why Rotation & Trend Alignment matter.
In the past, Tata Elxsi was a running DTB stock on the RS (Relative Strength) + VGM setup.
With RS above MAST and price above DBS, the stock continued its trend and rallied towards ₹10,000 with remarkable simplicity.
But once the #VGM structure turned bearish
• RS slipped below MAST
• DBS triggered on price
• Momentum & strength shifted away
The same “hot” stock gradually became a forgotten one — almost halving from its peak.
Key Lesson
It’s not about falling in love with a stock.
It’s about staying aligned with the trend and strength.
Even great businesses go through phases.
Your edge comes from:
Staying with Rising RS + Bullish VGM setups
Exiting when the trend structure reverses
Homework for you
Pick your:
• Favourite stocks
• Mutual fund holdings
• HNI portfolio names
And check: How historically they have done on VGM and Price
You will gain clarity on rotation and understand where to stay invested.
Nishesh Jani,CFTe
#VGM #RelativeStrength #MomentumInvesting #TrendFollowing #SmartRotation #nisheshjani #AhmedabadNest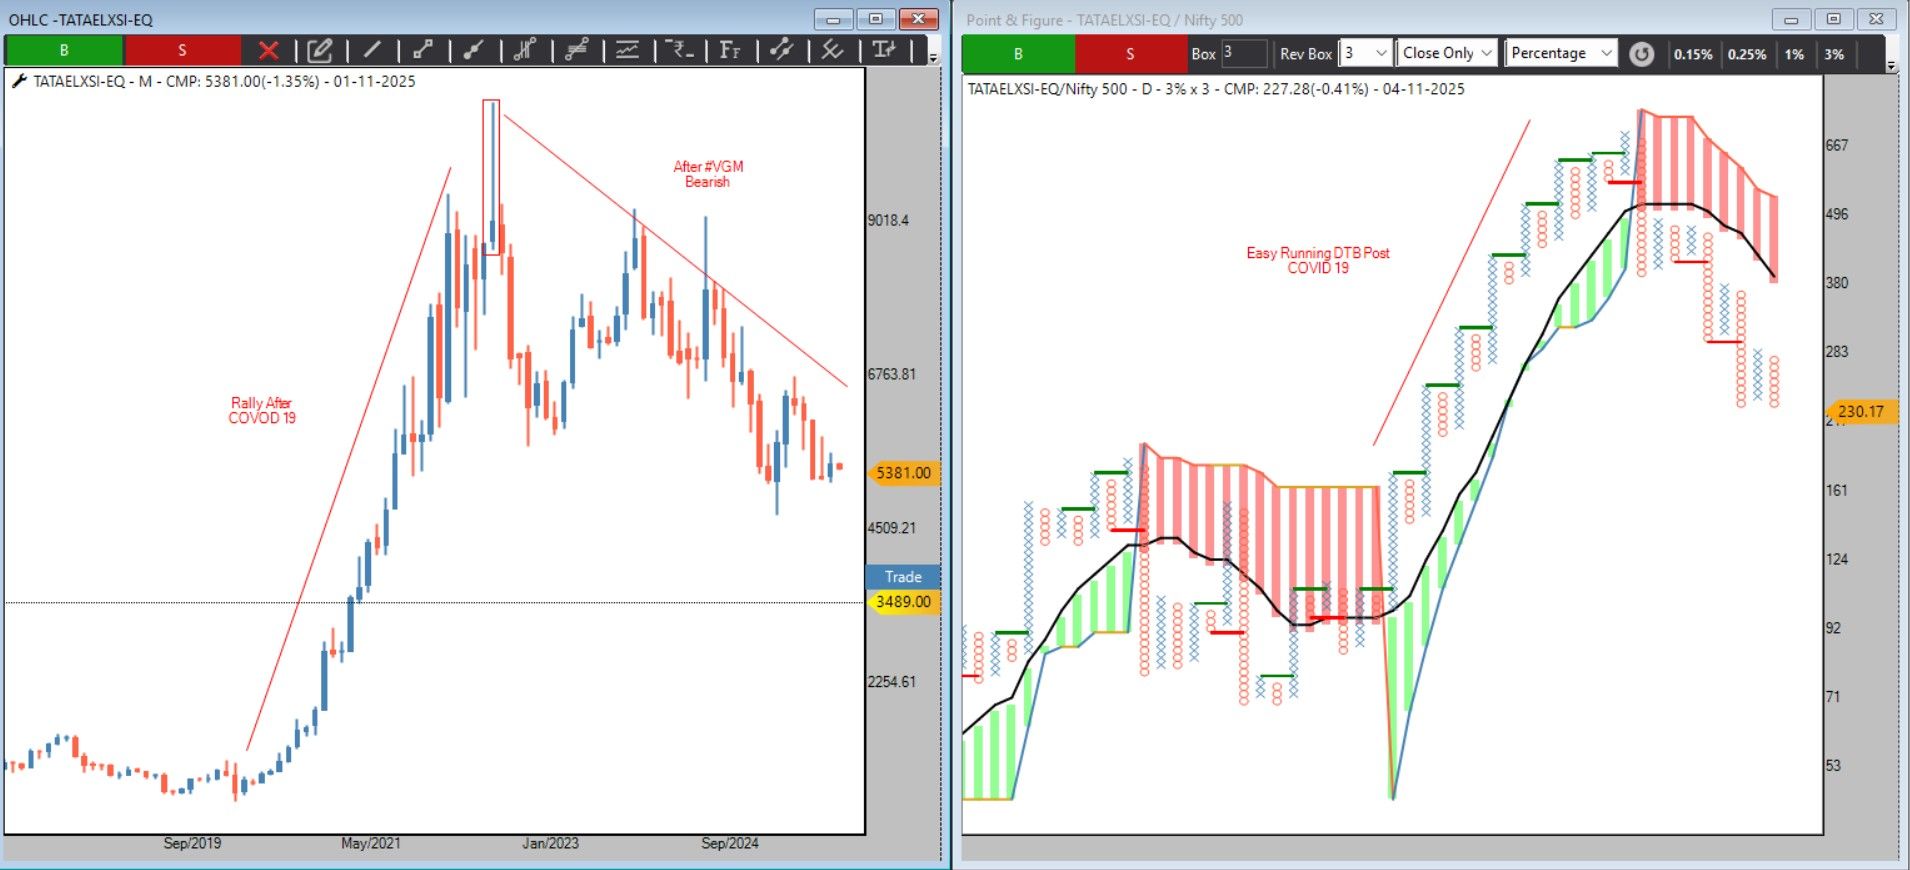
BSE Ltd.
Provides trading ecosystem across equities, debt, derivatives, mutual funds & commodity derivatives.
On #VGM, the stock is above MAST with last two column lows above MA, confirming a bullish structural setup.
Price has completed an ABC breakout, opening the path toward its first vertical count of 6691, offering compelling risk-reward from current levels near 2823.
As per VGM rules — current entry is via PCR, so model portfolio would allocate 50%, and wait for DTB to deploy the remaining 50%, with DBS as exit.
Both investors & traders may keep BSE on radar to execute as per their respective systems.
Nishesh Jani,CFTe
#MarketStructure #PriceAction #VGM #Breakout #IndianEquities #TradingSystems #Momentum #BSE #Nifty #Stocks #Investing #Portfolio #RiskManagement #TechnicalAnalysis #nisheshjani #AhmedabadNest 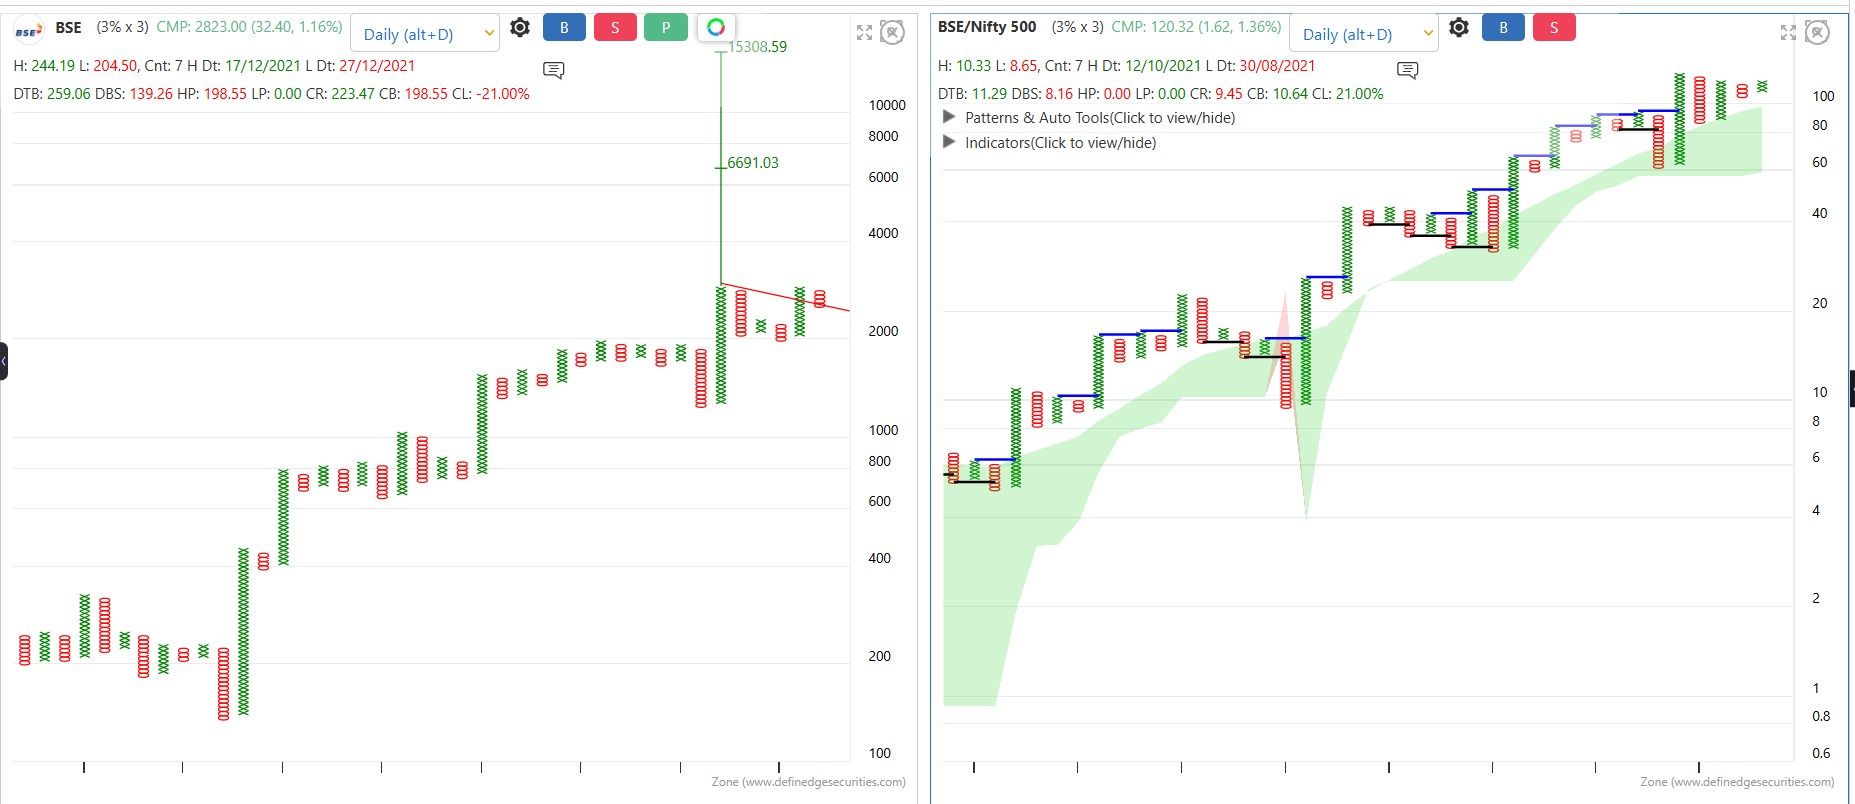
Strengthening Our #VGM Learning Community
I am pleased to see an increasing number of serious #VGM followers reaching out to discuss setups, clarify queries, and deepen their understanding of the methodology. The willingness to learn and the appreciation for simplicity in the concept reflect a mature and disciplined approach.
Our collective progress is built upon clear rules, structured thinking, and continuous learning. I sincerely value your trust, your engagement, and the thoughtful conversations we are consistently having.
Let us continue to uphold the principles, practice patience, and grow together with confidence and clarity.
Nishesh Jani, CFTe
https://t.me/+HOuDnn1VTdJjYzdl-Telegram Link to join
#VGM #MomentumInvesting #TechnicalAnalysis #CommunityLearning #nisheshjani #AhmedabadNest
Eternal: Zomato Ecosystem Showing Strength Across Segments
Zomato’s diversified ecosystem — Zomato (Food Delivery), Blinkit (Quick Commerce), Hyperpure (B2B Food Supply) & District (Events/Ticketing) — continues to demonstrate strong operating momentum.
On #VGM, structure has turned bullish as the last two column lows are above MA and the stock is trending within the Bullish MAST cloud.
Price-wise, the first open vertical count is nearly achieved. The next open vertical count is ₹820, offering attractive Risk–Reward from the current price zone around ₹300.
Current signal: PCR – Positive Column Reversal → triggering 50% allocation.
Awaiting DTB – Double Top Buy for the remaining 50% allocation with DBS – Double Bottom Sell as the exit mechanism.
Investors & traders may keep the stock on their radar to trade via their own system rules & discipline.
Nishesh Jani,CFTe
#Zomato #Blinkit #Markets #IndianEquity #TechnicalAnalysis #PriceAction #VGM #Momentum #Bullish #Trading #Investing #Nifty #Stocks #StockMarketIndia #nisheshjani #AhmedabadNest 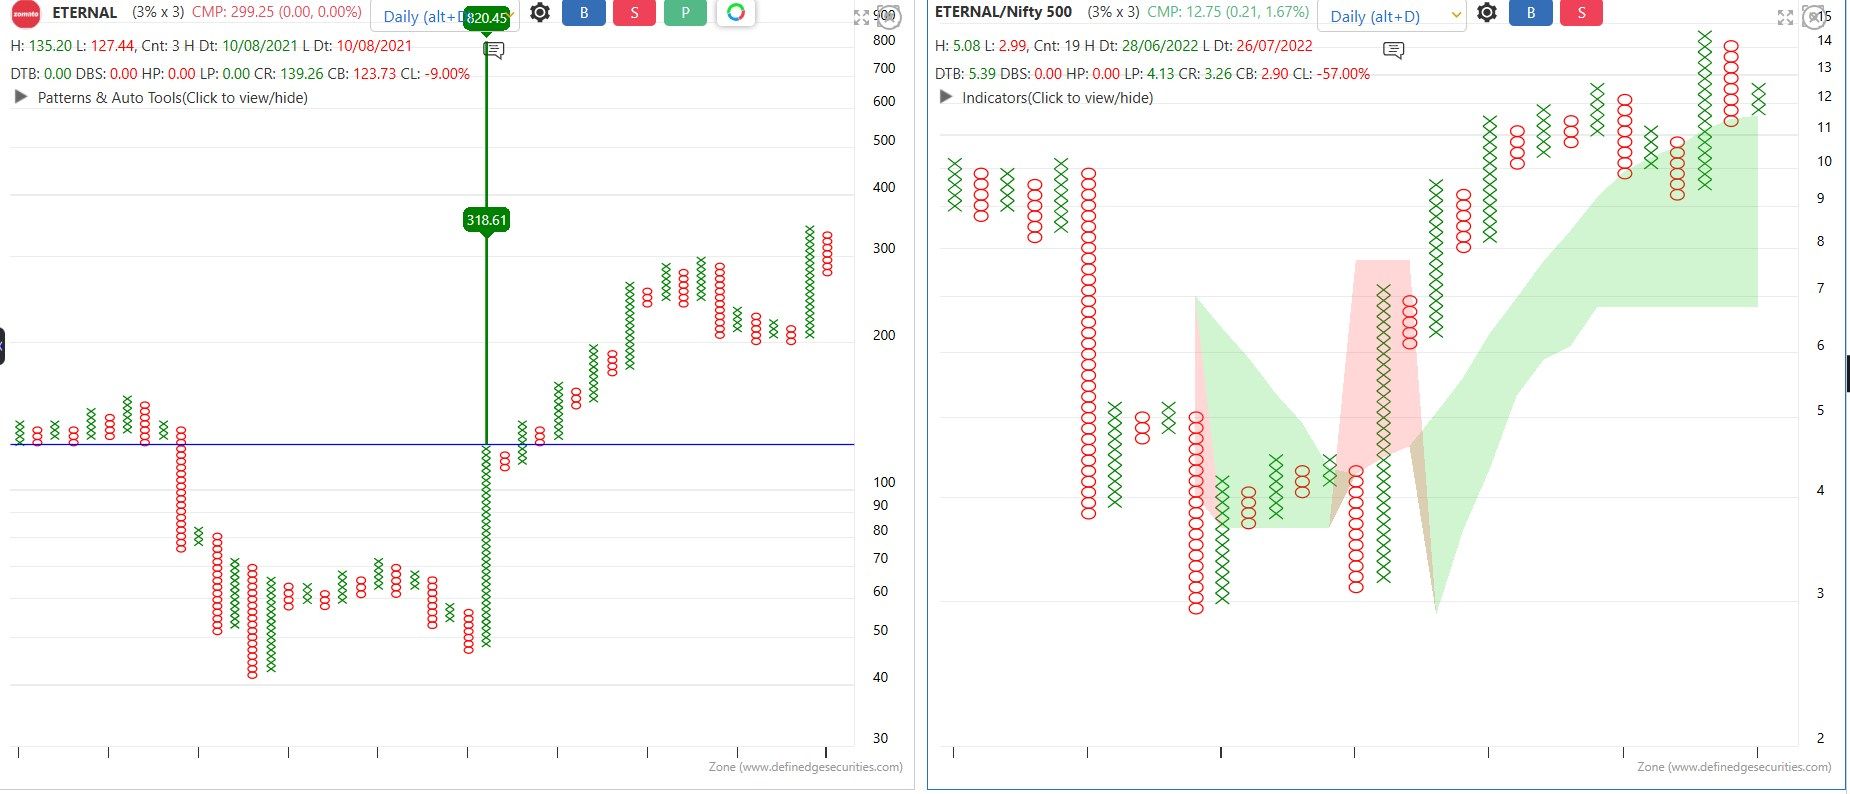
Motilal Oswal Large and Midcap Fund
Motilal Oswal Midcap Fund (Formerly known as Motilal Oswal Midcap 30 Fund)
Motilal Oswal Small Cap Fund
Motilal Oswal Focused Fund (Formerly known as Motilal Oswal Focused 25 Fund)
Motilal Oswal Flexi Cap Fund
Motilal Oswal Large Cap Fund
Motilal Oswal ELSS Tax Saver Fund (Formerly Known as Motilal Oswal Long Term Equity Fund)
NIFTY : GOLD Ratio — Renko View
NIFTY : GOLD Ratio — Renko View
Interesting historical pattern emerging on the NIFTY-to-GOLD Ratio!
Using Renko Charts, the Smoothed RSI has shown a unique recurring behavior:
 2009, 2012 & 2020
— Whenever RSI dropped below 20 and
— Made a lower low vs previous trough
→ Equities reversed sharply thereafter
We are witnessing the same setup again, with RSI sub-20 and breaking the previous bottom.
Keeping fingers crossed for another reversal in favor of equities and medium-term allocations into India’s growth cycle.
History doesn’t repeat — but it often rhymes.
Nishesh Jani,CFTe
#Nifty #Gold #RenkoCharts #TechnicalAnalysis #SmoothedRSI #MarketCycles #EquityInvesting #NiftyAnalysis #IndiaMarkets #MarketOutlook #AssetAllocation #Definedge #nisheshjani #AhmedabadNest 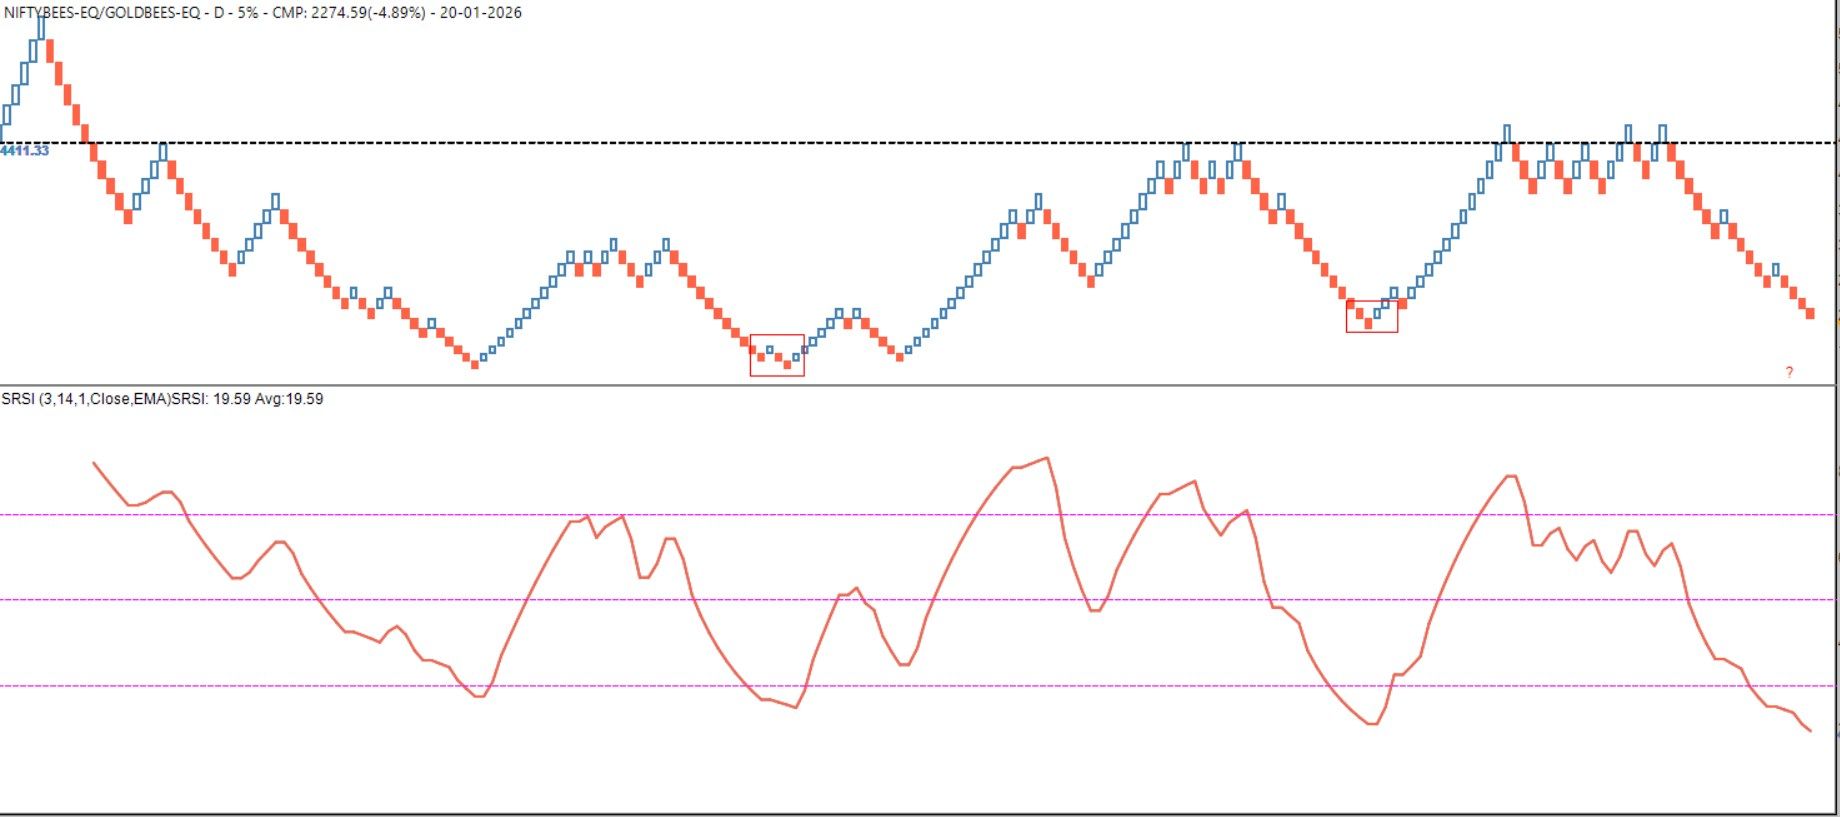
Parag Parikh Flexi Cap Fund
Parag Parikh ELSS Tax Saver Fund
Parag Parikh Conservative Hybrid Fund
Parag Parikh Dynamic Asset Allocation Fund
select only equity stocks and avoid arbitrage positions
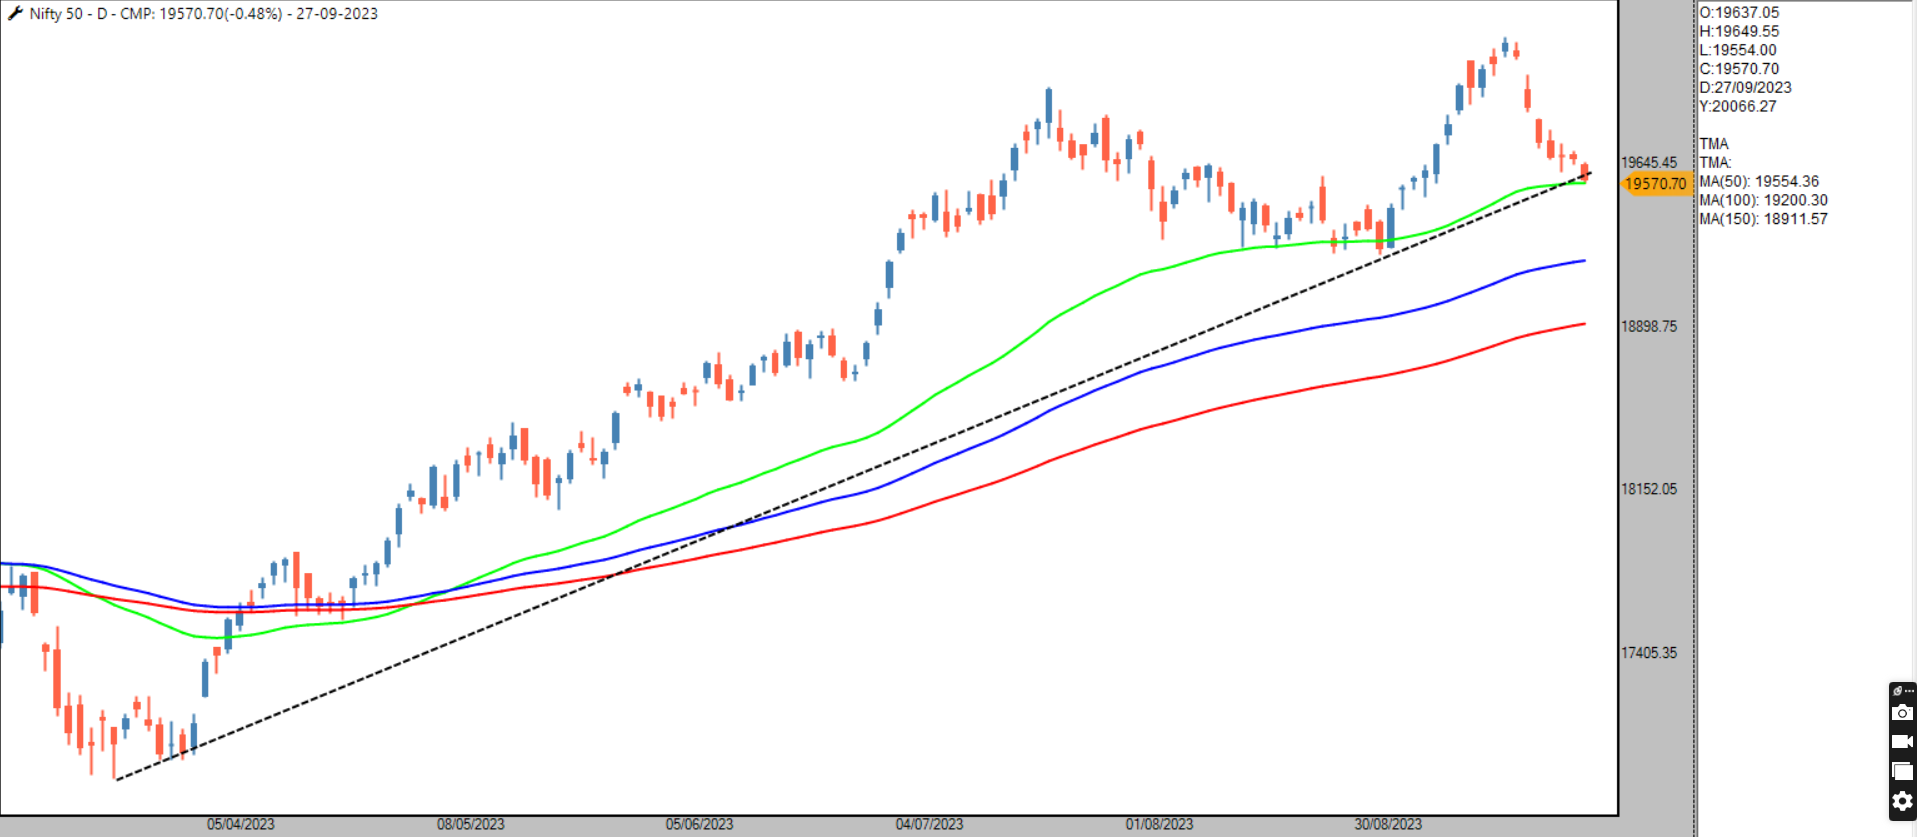
Nifty Technical View
Nifty Technical View
Nifty has taken support on the 150 EMA on three prior occasions, each time leading to a short-term reversal.
In two of those instances, Nifty even closed below the 150 EMA, only to form a bullish engulfing candle the very next day and reverse.
We are now at the 4th test of this zone — with price again sitting on the 150 EMA plus the lower rising channel trendline, making it an important confluence support area.
If the past behavior continues, odds favor a technical bounce, but candle confirmation remains key.
 Trigger Watch:
– Confirmation via bullish reversal candle
– Momentum follow-through above engulfing high (if formed)
– Structure valid as long as channel support holds
Nishesh Jani,CFTe
#Nifty #Nifty50 #NiftyAnalysis #TechnicalAnalysis #TrendAnalysis #SwingTrading #IndianMarkets #MarketOutlook #nisheshjani #Ahmedabadnest 
#VGM Capital Deployment Strategy – Stay Invested, Stay Smart
#VGM Capital Deployment Strategy – Stay Invested, Stay Smart
When you start practising #VGM, it takes time to build a full basket of 25 stocks. But your money shouldn’t stay idle — it should work for you every day.
Here’s how we ensure your capital is always productive
When Nifty 500 (our denominator) is above the D-SMART indicator (0.25% box) → we invest unallocated funds into Motilal Oswal Nifty 500 ETF-MONIFTY500, protected with a trailing SL as per indicator.
When Nifty 500 drops below D-SMART, we shift to LiquidBees, keeping your capital safe yet ready.
As new stocks qualify under #VGM, we redeem ETF units and move into outperforming opportunities — seamlessly and systematically.
Your money remains continuously deployed, balancing growth and safety, ensuring you never miss market participation while maintaining risk control and liquidity.
#VGM #SmartInvesting #SystemTrading #ClientFirst #DisciplinedApproach #EfficientCapitalUse
The broader market is sending an important structural message.
NIFTY 500 | Bigger Picture Alert
The broader market is sending an important structural message.
On a smaller box value, price has formed a Bullish Double Broadening pattern right at anchor support.
At the same time, the index has negated the recent mini top and confirmed a mini bottom — a classic shift in control.
Why this matters
Broadening patterns are back-to-back failure structures
They reflect extreme emotional price behavior
Volatility typically peaks near major cycle lows
This setup is often seen during:
Major market bottoms
Post-panic phases
The end of long bear or corrective cycles
This is the battlefield where bears lose control twice, and bulls quietly take charge.
️ Risk management (failure condition)
Structure fails only if price breaks the last swing low zone: 22,600–22,400, below anchor points.
Upside perspective
Open upside counts towards 26,500, offering a favorable risk–reward from a positional standpoint.
Markets don’t bottom with comfort — they bottom with volatility, confusion, and failed breakdowns. This structure fits that narrative perfectly.
Nishesh Jani,CFTe
#Nifty500 #BroaderMarket #MarketStructure #TechnicalAnalysis #AnchorPoints #BullishSetup #IndiaMarkets #RiskReward #nisheshjani #AhmedabadNest 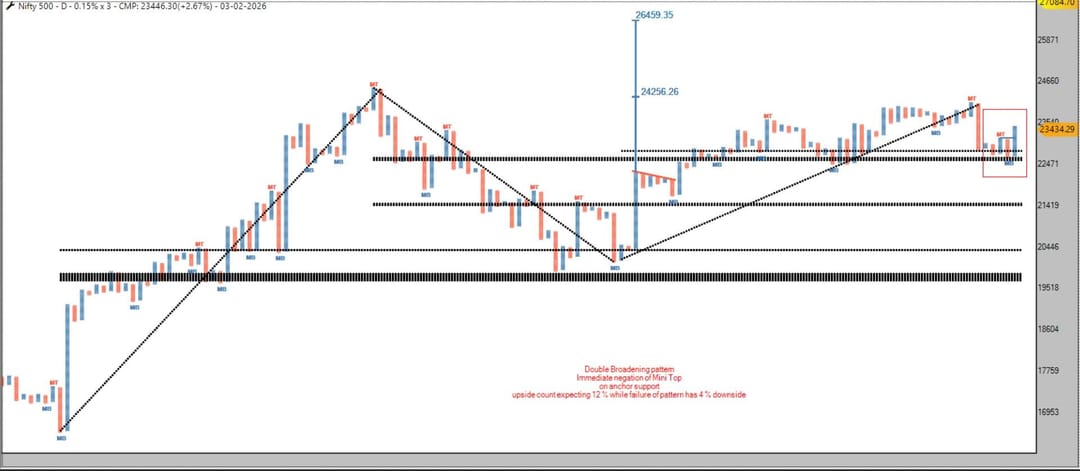
Market Pause or Final Shakeout? Use Both to Your Advantage.
Market Pause or Final Shakeout? Use Both to Your Advantage.
We may not know whether the market will spend the next few weeks grinding sideways or give a final flush in small-caps and micro-caps. But what we do know is this: phases of uncertainty quietly create some of the best opportunities for disciplined investors.
That’s why we are gradually accumulating four high-quality factor & segment ETFs:
Kotak ALPHA ETF
Motilal Oswal MOMENTUM50 ETF
Mirae MIDSMALL ETF
Nippon MID150BEES
Why add now?
Because by the end of December, all ETFs undergo rebalancing — removing the weakest underperformers and adding stronger, improving names. This naturally aligns portfolios toward potential future leaders without emotional decision-making.
In simple terms:
Volatility gives you better entry points.
Rebalancing positions you toward strength.
Discipline compounds over time.
Stay patient. Stay systematic. Position for leadership — not noise.
Nishesh Jani,CFTe
#SmartInvesting #ETFs #MomentumInvesting #MidcapStrategy #WealthBuilding #MarketInsights #DisciplinedInvesting #FactorInvesting #NisheshJani #AhmedabadNest
Smallcap 250 & Microcap 250 — consensus says “avoid”.
Market structure says “watch closely”.
Both indices are sitting on anchor support after completing meaningful price and time corrections.
Breadth data (which I track internally) is now in deeply oversold territory — a zone that historically precedes leadership shifts, not breakdowns.
If these levels hold or convert into a bear trap, the probability increases that small & micro caps reclaim leadership in the next phase of the cycle.
Markets reward accumulation during write-offs, not participation during headlines.
What I’m accumulating
• ALPHA
• MOMENTUM50
• MIDSMALL ETF
• MIDCAP150BEES
This is not about prediction — it’s about positioning when participation is lowest and risk-reward is asymmetric.
Watch price behavior.
Watch breadth.
🧠 Ignore the noise.
Nishesh Jani.CFTe
#SmallCaps #MicroCaps #MarketBreadth #BearTrap #AnchorSupport
#SmartMoney #ETFInvesting #IndiaMarkets #LeadershipRotation #RiskReward #nsiheshjani #AhmedabadNest 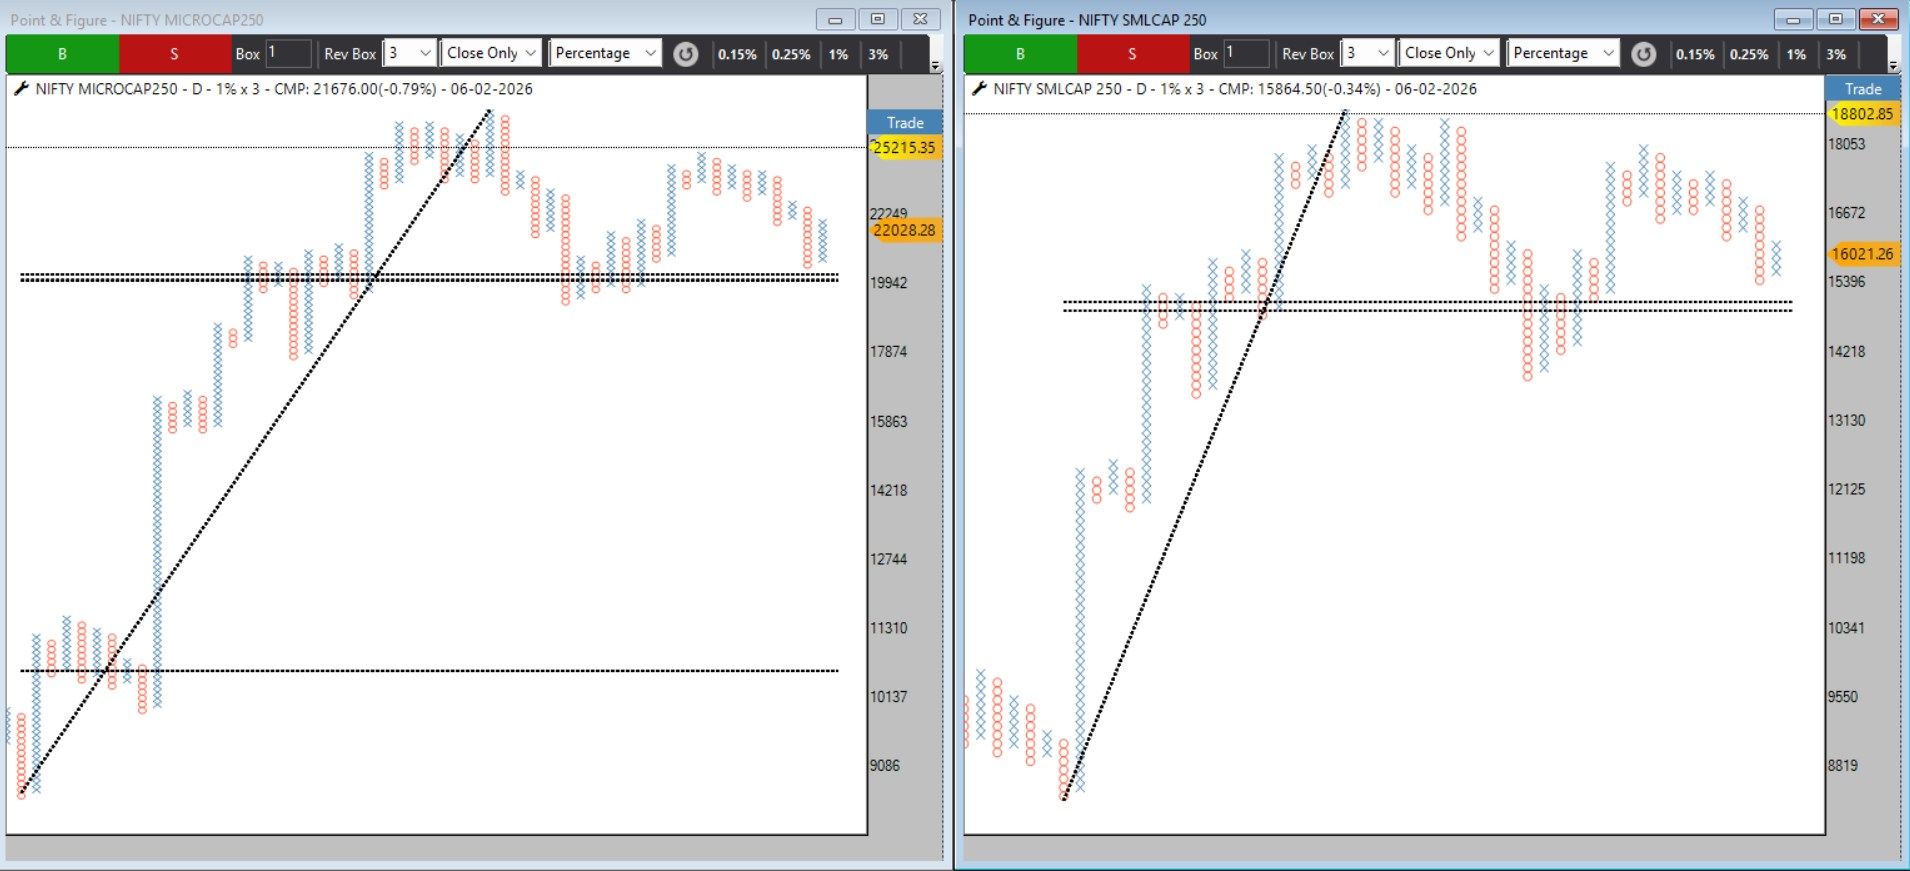
 Broader Market Turning Point? Small-Cap Funds Reopen After 22 Months
Broader Market Turning Point? Small-Cap Funds Reopen After 22 Months
ICICI Prudential Smallcap Fund is reopening for fresh subscriptions — a significant development after nearly 22 months of pause due to stretched valuations.
This move signals that fund managers are finally finding valuation comfort in the broader market.
A healthy market cycle often begins when leadership starts broadening beyond large caps.
For investors, this could be the right time to consider systematic exposure to quality mid & small caps — with disciplined position sizing and strong risk management.
A broader participation phase in equities may be setting up.
Nishesh Jani,CFTe
#ICICIPru #SmallCapFunds #IndianMarkets #Midcaps #WealthCreation #StockMarketIndia #MarketOutlook #FundFlows #EquityInvesting #nisheshjani #AhmedabadNest
Nifty 500:
18 months of consolidation continues. Now approaching the 50% Fibonacci retracement + major gap support zone (22,000–21,500).
With geopolitical tensions rising, VIX > 20, and ATR ~5%, the probability of a final panic flushout is increasing — something we had highlighted during our Diwali contrarian breadth analysis.
But remember: sudden geopolitical de-escalation can quickly normalize sentiment.
Historically, March has been a panic → bottoming phase for Indian markets.
We are very close to activating our “Horny Bull Market” setup — a phase that could trigger Indian market outperformance.
Stay prepared. Not fearful.
Nishesh Jani,CFTe
#Nifty500 #IndianMarkets #StockMarket #MarketOutlook #Volatility #nisheshjani #AhmedabadNest 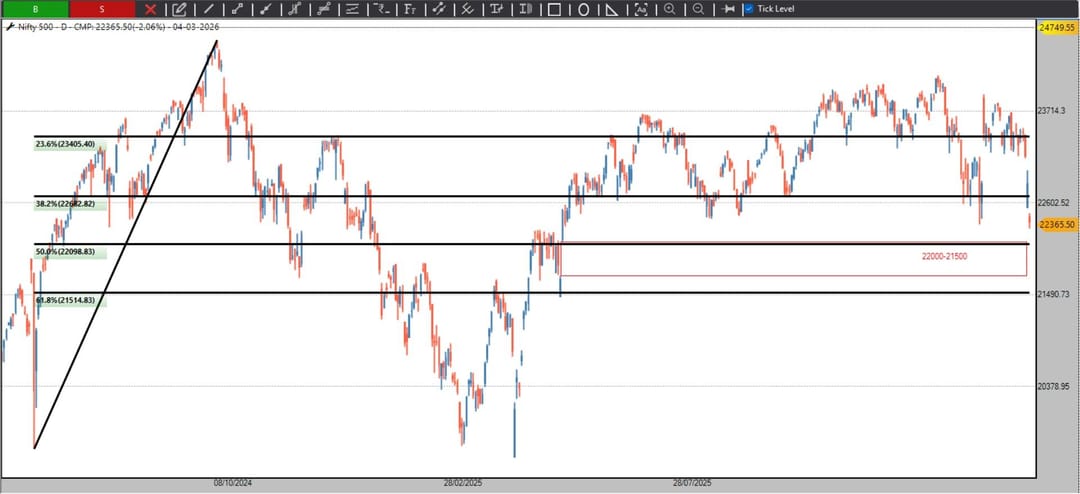
How Market Cycles Trick Our Minds
When markets keep rising, people start feeling very confident.
They buy more, take bigger risks, and stop worrying about what can go wrong.
When markets fall, the same people become extra cautious.
They avoid buying even good companies because fear takes over.
Prices become cheap, but they don’t feel like an opportunity.
This is how market cycles work:
• Good times make us ignore danger
• Bad times make us ignore opportunity
But the market doesn’t reward emotions.
It rewards patience and discipline.
The smart approach is simple:
Stay careful when everyone is excited,
and stay curious when everyone is scared.
You don’t need to predict the future.
You just need to avoid extremes.
In the long run, clarity wins over noise.
Nishesh Jani,CFTe
#InvestingMindset #MarketCycles #BehavioralFinance #LongTermThinking #nisheshjani #AhmedabadNest
️
Precious Metals at a Critical Inflection Point ️
Gold and Silver are approaching structural breakdown zones based on vertical count projections.
• Gold: A decisive close below ₹144000 opens the path towards ₹119000
→ Potential downside: ~17%
• Silver: A close below ₹2,30,000 signals a move towards ₹1,46,000
→ Potential downside: ~36%
This is not just about price levels — it’s about momentum exhaustion.
Once these levels are breached:
️ Upside momentum in metals is likely to fade
️ Risk-reward in commodities may deteriorate sharply
️ Capital could rotate towards equities, where relative strength emerges
Markets don’t move in isolation — they rotate.
Smart money doesn’t chase what has moved.
It prepares for what’s next.
Stay alert. Stay adaptive.
Nishesh Jani,CFTe
#Gold #Silver #Commodities #MarketOutlook #SectorRotation #SmartMoney #InvestingIndia #StockMarketIndia #MomentumTrading #WealthCreation #nisheshjani #AhmedabadNest 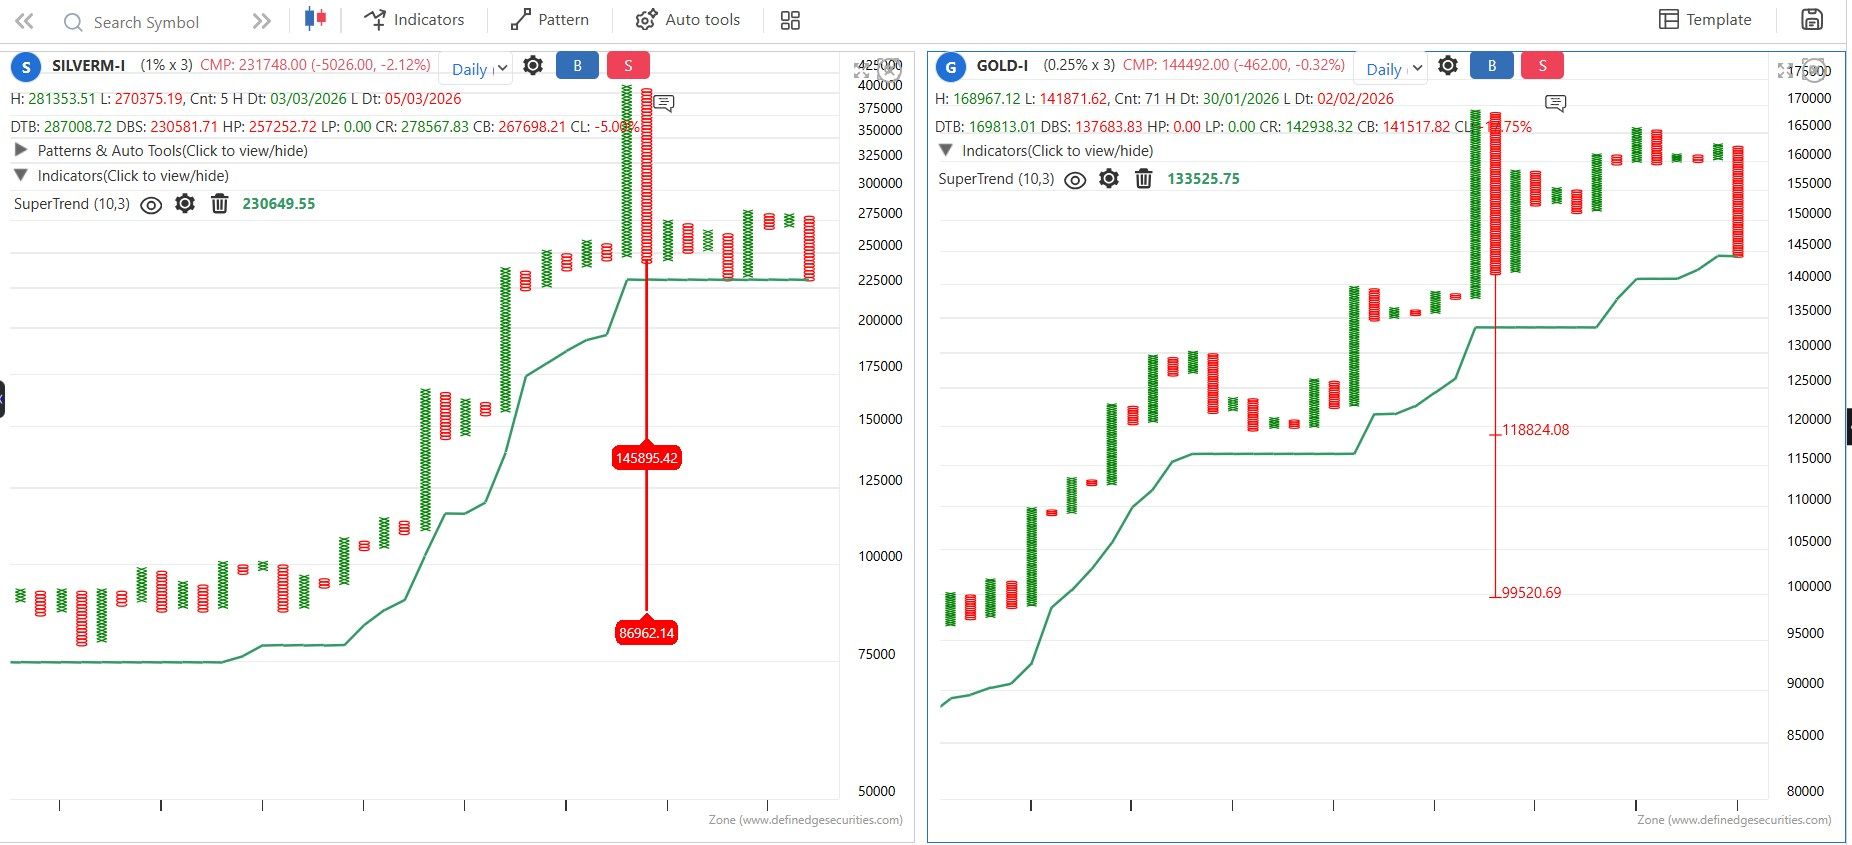
Conflict Creates Fear. Fear Creates Discount. Discount Creates Opportunity.
Every major geopolitical event in history has triggered sharp declines.
But history also shows — those declines eventually turned into powerful long-term buying opportunities.
Even if headlines remain uncertain, cycles eventually shift.
“occult science suggests a ceasefire may emerge soon.”
Whether through diplomacy, policy shifts, or time itself — tension does not stay permanent.
We are not reacting emotionally.
We are accumulating systematically.
Current Strategy: Gradual accumulation in our 4 high-conviction ETFs:
• Alpha
• Momentum50
• MIDSMALL
• MID150BEES
We don’t predict headlines.
We position for probabilities.
Volatility is uncomfortable — but it is also the raw material of long-term wealth.
Stay disciplined. Stay invested. Stay strategic.
Nishesh Jani,CFTe
#MarketVolatility #ETFStrategy #LongTermWealth #SystematicInvesting #WealthBuilding #nisheshjani #AhmedabadNest
GE SHIPPING – Process-Driven Opportunity
is aligning well on structure + relative strength.
VGM conditions met on RS
Bullish MAST formation
Running DTB setup
Last two column lows above MA → strength intact
PCR → first entry signal
Structure: Strong pattern offering favorable R:R
️ ₹1555 → ₹2522+ (zone, not prediction)
 ️ Execution Plan:
• 50% entry on PCR
• 50% on DTB confirmation
• SL: DBS
• RS practitioners: follow DBS exit
• Price-based traders: trail as per your system
🧠 Mentorship Note:
Clarity + Structure + Risk Management = Consistency
Trade the process, not the outcome.
#StockMarket #TradingDiscipline #RiskManagement #TechnicalAnalysis #MomentumTrading #ProcessOverOutcome #VGM #geship 
#VGM Framework – Live Portfolio Snapshot
#VGM Framework – Live Portfolio Snapshot
Sharing a transparent view of current Open Positions and recently Closed Positions generated through our #VGM (Volume–Growth–Momentum) framework.
This framework was originally presented at the E-Decnoch 2021 online conference by Definedge and continues to guide our systematic stock selection process.
🟢 Open Positions
Current open positions reflect stocks that continue to respect the bullish market structure within the VGM framework.
Some notable trends visible in the list:
• Strong leadership from Defence & Capital Goods
• Banks and Financials participating selectively
• Stocks like Acutaas Chemical, Karur Vysya Bank, MTAR Tech, GE Vernova T&D showing structural strength
These positions remain open because the trend structure defined by VGM is still intact.
 Closed Positions
Closed positions are not failures — they are disciplined exits.
In a rule-based system:
Positions are closed when structure weakens
Capital is recycled into stronger setups
Names like Affle, Dixon, Amber, Deepak Fertilisers, Bharti Hexacom were exited when VGM conditions were violated.
This is the core strength of systematic trading:
Let winners run
Cut weak structures early
 Collaborative Learning
We also run a dedicated #VGM Telegram community where investors and traders:
• Post setups
• Discuss market structure
• Solve doubts directly with me
Additionally, all VGM scanners and open conditions are published on RZONE so anyone can study and replicate the framework.
Markets reward process, not predictions.
Nishesh jani,CFTe
#VGM
#RuleBasedTrading
#MomentumInvesting
#ProcessOverPrediction
#IndianStockMarket
#SystematicTrading
#nisheshjani
#AhmedabadNest 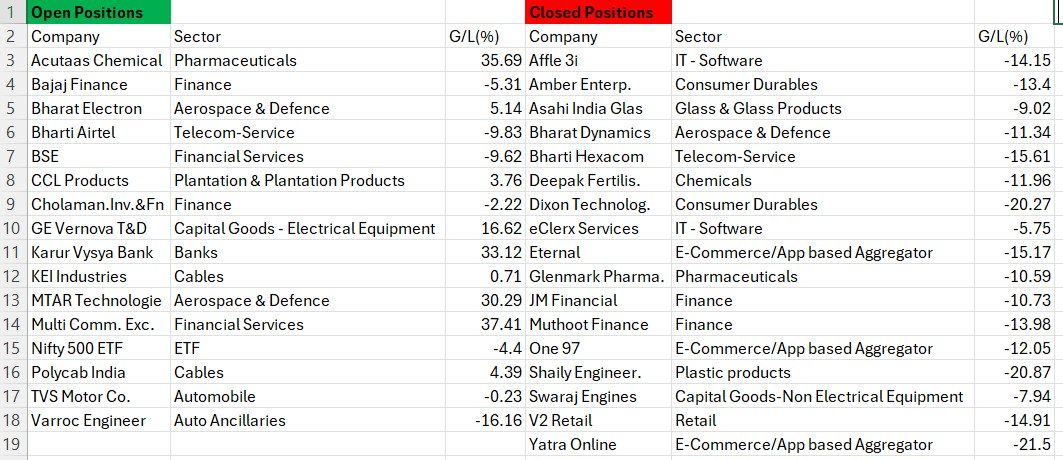
@Definedge
MTAR Technologies — a leading Indian precision engineering & manufacturing company catering to Space, Defence, Civil Nuclear & Clean Energy verticals.
On the technical side, the stock has qualified under our #VGM framework by delivering a clean DTB above the Bullish MAST indicator. Last two columns have not touched the MA and there is no immediate DBS, improving conviction.
Price structure shows a Trap + Anchor Follow-Through, opening vertical counts up to ~5100 and potentially higher. For now, we are considering the first count which is ~2x from current levels and offers an attractive Risk-Reward profile.
Investors & traders can keep the stock on radar and participate as per their own system.
Nishesh Jani,CFTe
#MTAR #StockMarketIndia #VGM #Momentum #PriceAction #TechnicalAnalysis #Investing #Trading #Space #Defense #CleanEnergy #nisheshjani #AhmedabadNest 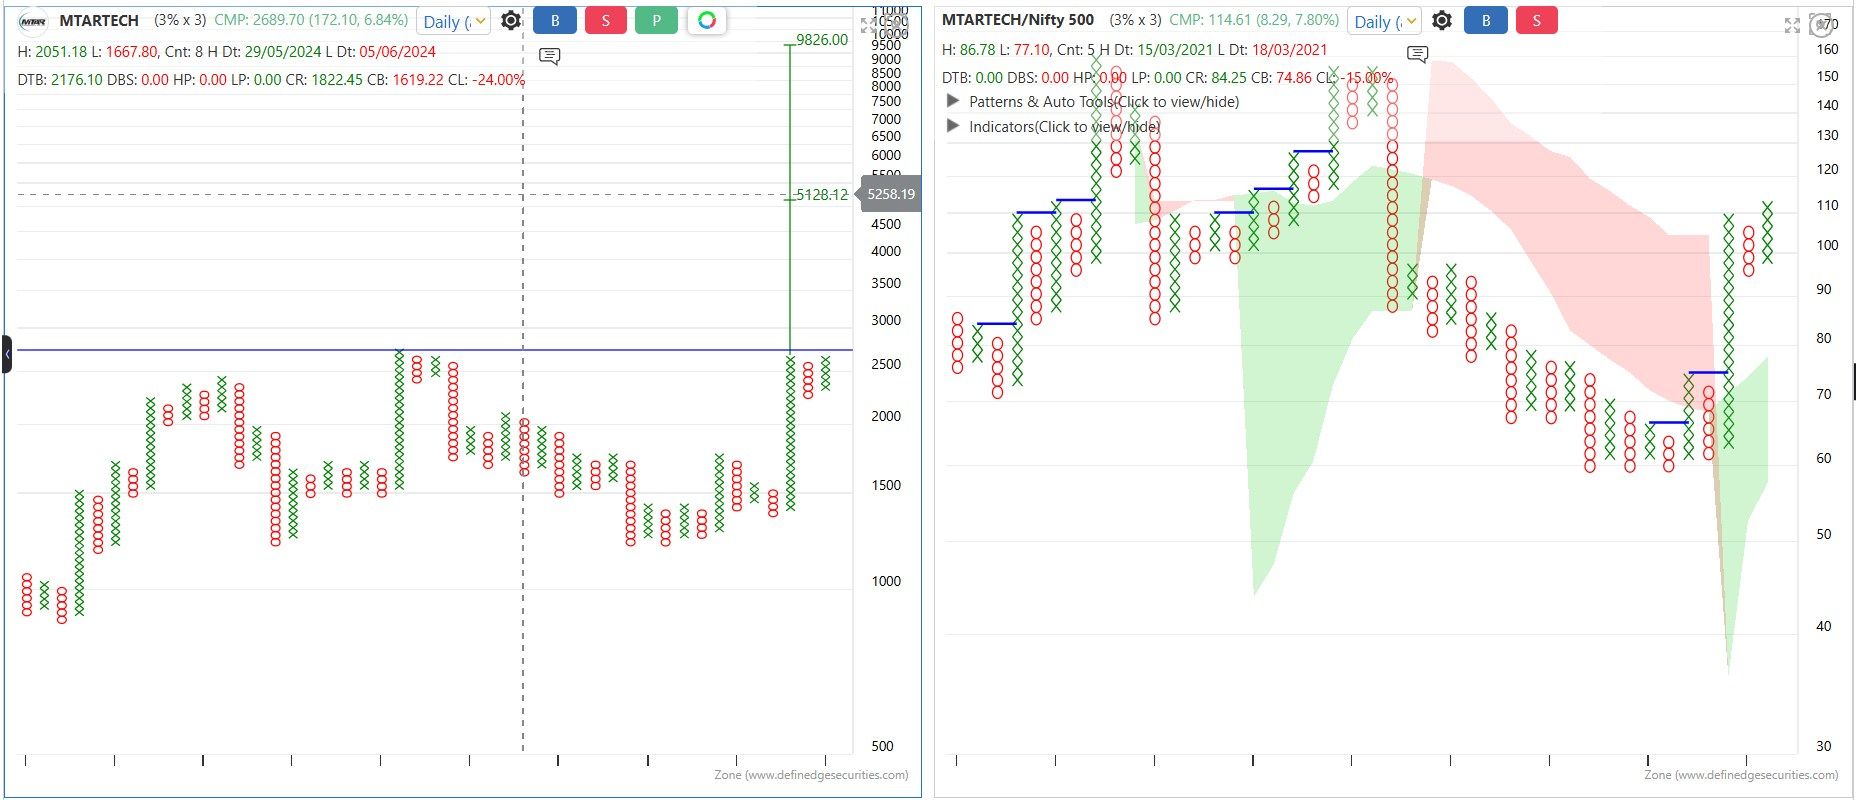
️
When Memes Enter the Market… History Says the Bottom May Be Near ️
In every major market correction, there is a fascinating behavioral pattern that repeats itself.
At the peak of panic, when volatility is high and sentiment is extremely negative, something unusual starts appearing across social media, WhatsApp groups, and trading communities:
️ Memes about stock market losses
️ Jokes about portfolios being destroyed
️ Friends & family suddenly discussing market crashes
While it may look like casual humor, behavioral finance tells us this is often a late-stage sentiment signal.
Why This Matters
Markets usually bottom not when fear begins but when fear becomes normalized and even humorous.
When investors start joking about their losses, it often reflects:
• Capitulation phase of sentiment
• Maximum pessimism in retail psychology
• Emotional exhaustion among investors
Historically, many market bottoms have formed around the time when despair turns into sarcasm and memes.
Add the Seasonality Factor
March has historically been a period of:
• High volatility
• Institutional repositioning
• Tax-related flows and portfolio adjustments
• Short-term panic phases before stabilization
This combination of extreme sentiment + seasonal volatility often creates bottoming environments rather than long-term tops.
A Simple Behavioral Indicator
If you start seeing:
Market crash memes everywhere
Friends suddenly asking about “Is market finished?”
Portfolio jokes flooding WhatsApp groups
It may not mean the market is collapsing.
It may actually mean the market is close to exhausting the sellers.
As legendary investors often emphasize:
Markets bottom on pessimism, not optimism.
Smart investors observe sentiment, behavior, and positioning — not just price.
Nishesh Jani,CFTe
#StockMarket
#BehavioralFinance
#MarketPsychology
#MarketSentiment
#InvestingWisely
#Volatility
#MarketCycles
#LongTermInvesting
#nisheshjani
#AhmedabadNest
SYRMA SGS | #VGM Update
continues to display a strong bullish relative strength structure and has generated another Double Top Buy (DTB) signal on the RS chart.
Bullish MAST
Rising EMA & Super Trend
Last two column lows above EMA
Strong RS structure intact
Fresh DTB signal
#VGM practitioners who were already allocated remain fully invested. Those who missed the earlier 50% allocation opportunity may consider adding exposure as per their own risk management framework.
For price-chart followers:
3% chart: Potential upside trajectory toward the 1800 zone remains intact.
1% chart: Useful for tracking medium-term trend progression.
0.25% chart: Can be used for managing shorter-term swings and trailing stops.
Traders and investors may keep the stock on their watchlist and participate based on their own trading or investment system.
Strong Relative Strength + Bullish Structure = Stock remains in leadership mode.
#SYRMASGS #VGM #RelativeStrength #MomentumInvesting #TrendFollowing #StockMarketIndia #TechnicalAnalysis #SwingTrading #PositionTrading #MomentumStocks #NisheshJaniCFTe 
When Markets Ignore Logic… They Eventually Return to It
A few months ago, during the madness in Gold & Silver, I highlighted something important:
Oversold signals didn’t matter
Divergences were ignored
Standard deviations were stretched
Mean reversion & disparity had no value
At that time, price was driven by emotion, momentum & narrative — not theory.
And what happened next?
️ The same ignored theories eventually proved themselves right.
Now, I’m seeing the same setup again… but on the downside in Indian markets.
Panic is dominating
Indicators are being ignored
Valuations & technical frameworks are being dismissed
But remember:
Markets can ignore theory temporarily… but not permanently.
Extreme deviations always seek equilibrium.
This phase is not about predicting bottoms…
It’s about recognizing when fear disconnects price from structure.
And when that gap closes —
the move is fast, sharp, and unexpected.
Stay objective. Stay disciplined. Trust process over noise.
Nishesh Jani,CFTe
#StockMarketIndia #MarketPsychology #MeanReversion #TradingMindset #InvestingWisdom #Nifty #MarketCycles #TechnicalAnalysis #ContrarianThinking #WealthCreation #nisheshjani #AhmedabadNest