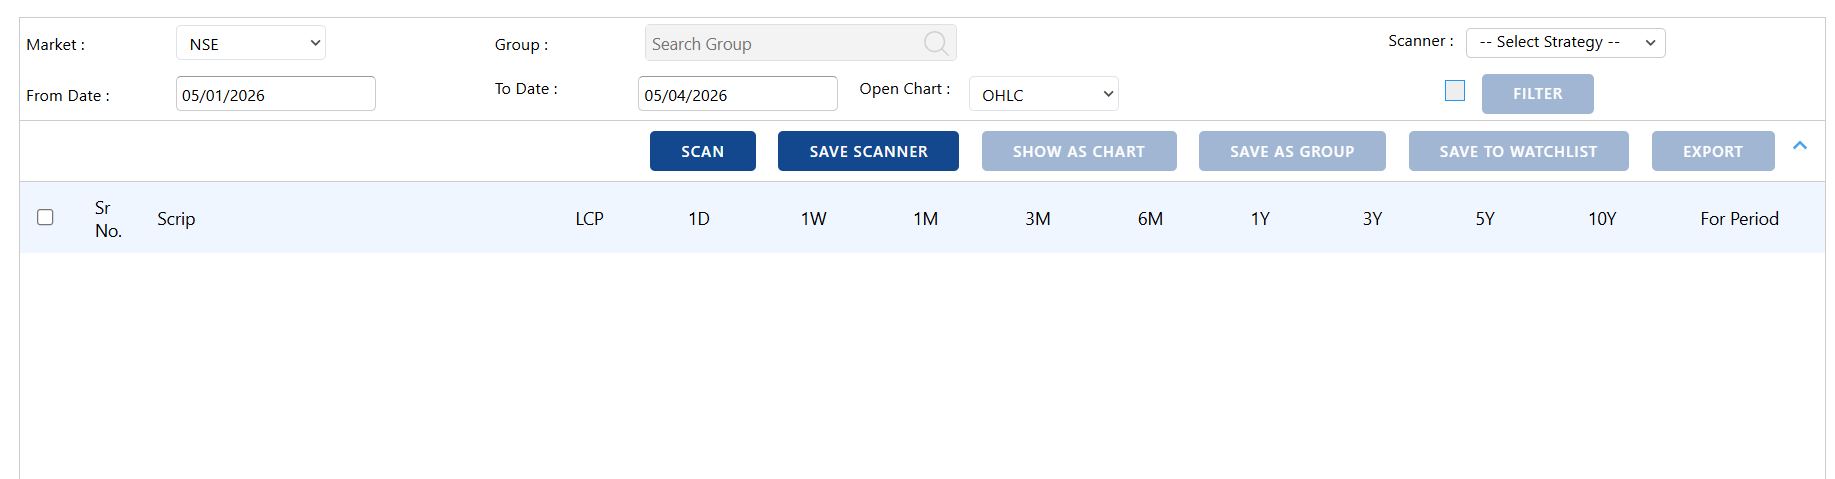
Hello team
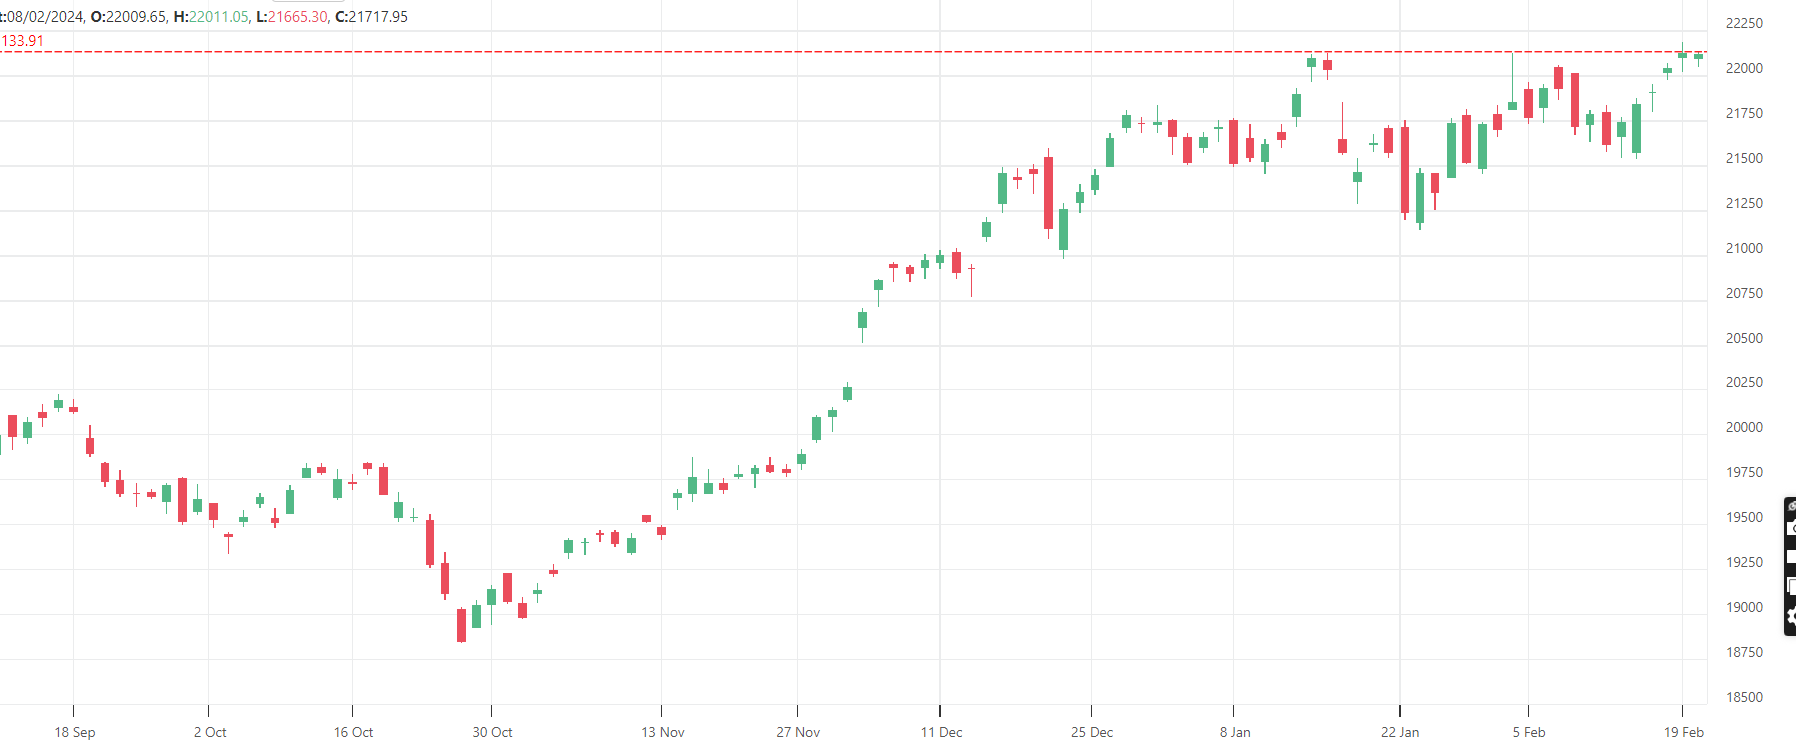
attaching screen shot which shows filter not qualified while manually i check market trend filter is qualified
please look into this ASAP
Thanks 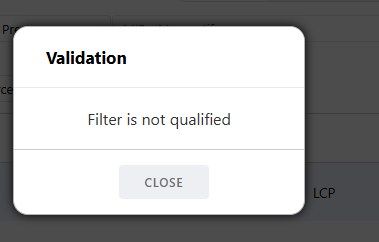
Pro User
Hello team
attaching screen shot which shows filter not qualified while manually i check market trend filter is qualified
please look into this ASAP
Thanks
#VGM Watchlist Update | TITAN
is now completing all major #VGM criteria:
 Bullish MAST
Rising EMA
Rising SuperTrend
Last two RS columns holding above EMA
Positive Column Reversal (PCR) entry on RS Charts
For #VGM Practitioners:
Allocate 50% position now
Add the remaining 50% on Double Top Buy (DTB)
Exit only on Double Bottom Sell (DBS) on RS Charts.
For Price Chart Followers:
Long-Term: 3% Box Size
Medium-Term: 1% Box Size with SuperTrend
Short-Term: 0.25% Box Size above SuperTrend, using SuperTrend as the trailing stop-loss.
As always, focus on process over prediction. Follow your position sizing and risk management rules.
Educational purpose only. Not a buy/sell recommendation.
#VGM #titan #RelativeStrength #PointAndFigure #TrendFollowing #MomentumInvesting #TechnicalAnalysis #RiskManagement 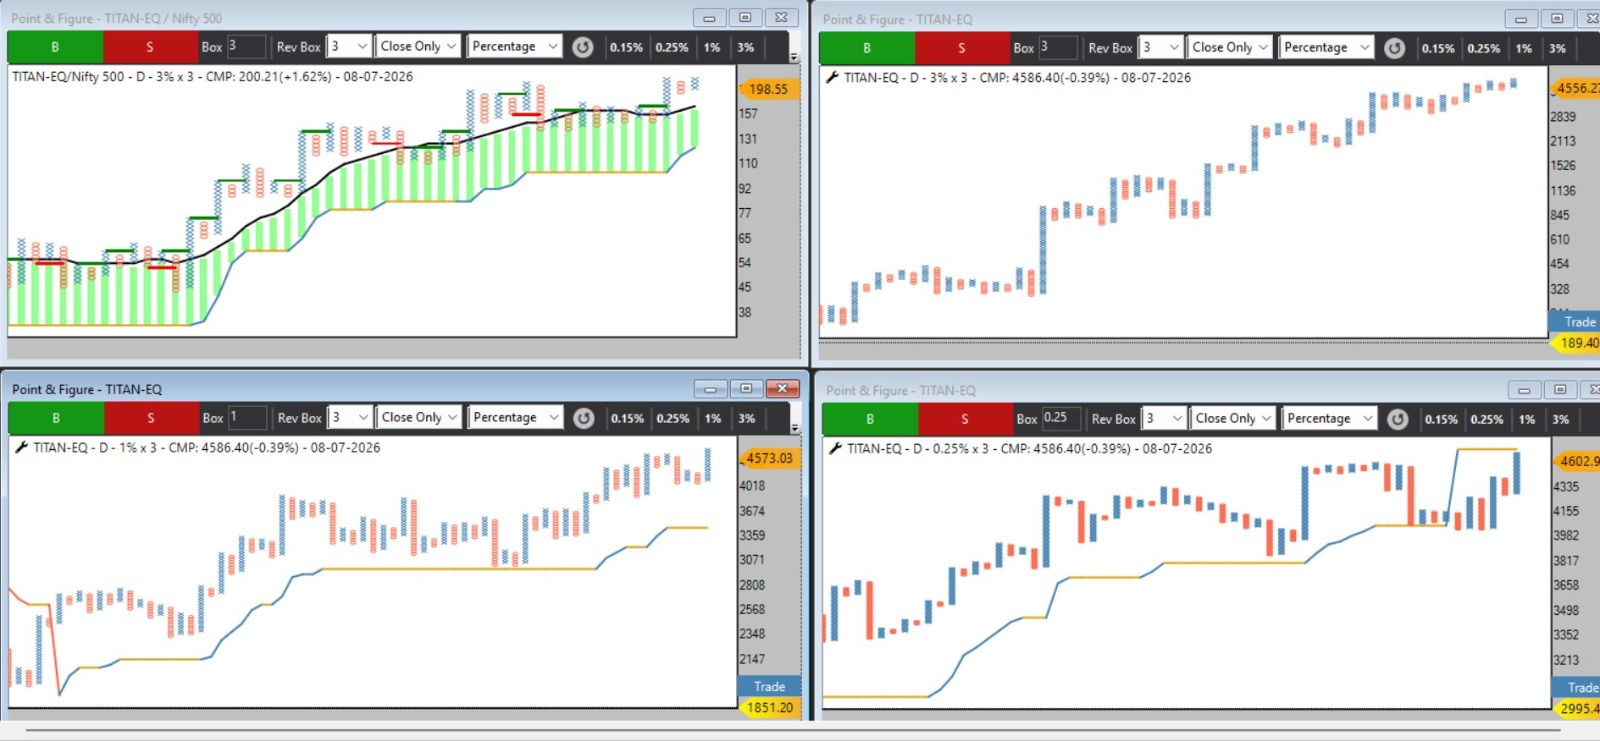
#VGM -value growth momentum presented at EDECNOCH 2021 available on you tube
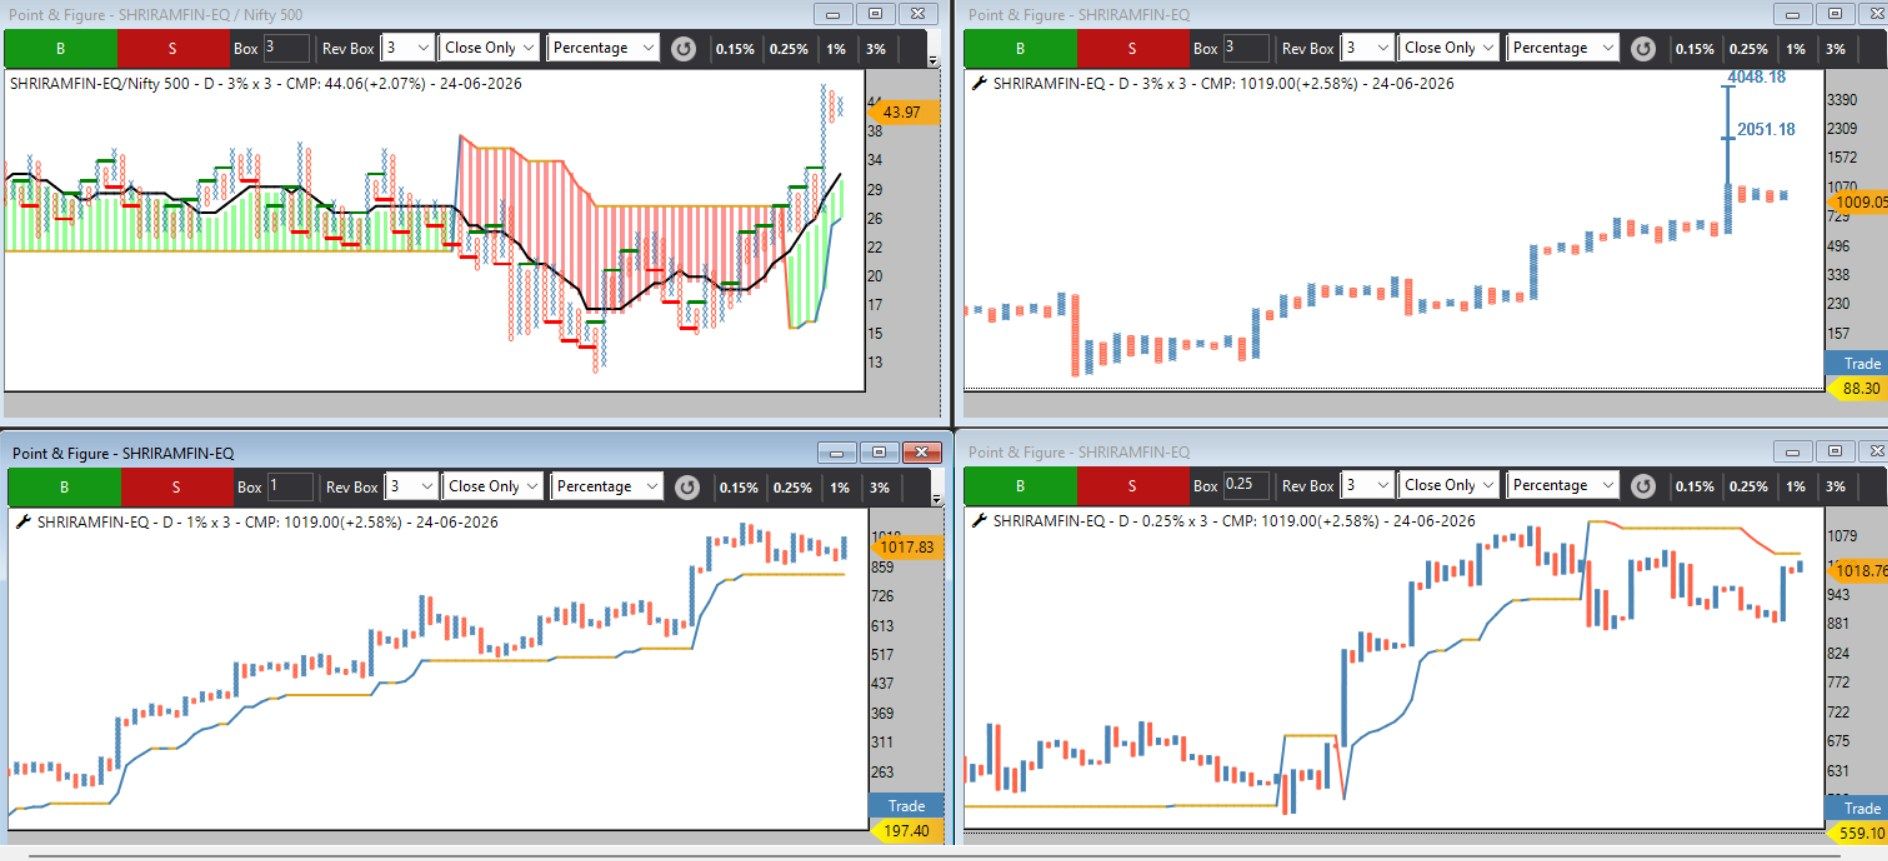
SHRIRAMFIN – A High-Quality #VGM Candidate on Radar
PCR has qualified under the #VGM framework, supported by multiple bullish factors:
Bullish MAST Indicator
EMA Rising
SuperTrend Rising
Active Double Top Pattern
Last Two Columns' Lows Above EMA
Healthy Minor Retracement After Anchor Column
Positive RS Column Reversal
From a risk-reward perspective, the setup remains attractive:
on 3% Price chart potential ABC breakout.
A successful breakout can offer a significantly larger upside compared to the current risk.
The stock is trading around 1% above SuperTrend, while RS is just 0.25% away from crossing its SuperTrend, indicating improving relative strength.
#VGM Positioning Approach
Allocate 50% position now
Add remaining 50% on DTB confirmation
Follow DBS as stop-loss
 Traders
Keep it on the watchlist
Trade it according to your own price-action or breakout system
.
#shriramfin
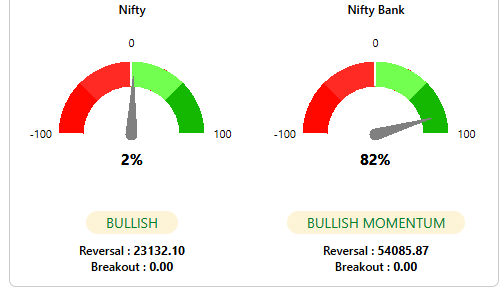
please add all index visual D Score setup like nifty bank nifty
Markets will always give reasons to worry.
Price structure gives reasons to stay focused.
 MIDCAP 150
24-25 month Cup & Handle formation in progress.
CMP: 22,600
Potential targets: 25,000 & 28,000
SMALLCAP 250
Anchor FT + Bullish ABC pattern.
CMP: 17,300
Potential targets: 19,000 & 22,000
MICROCAP 250
Bear Trap + Anchor FT + Bullish Turtle pattern.
CMP: 24,400
Potential targets: 27,000 & 33,333
The future is always uncertain.
That is why we follow price, not predictions.
While headlines create noise, we remain focused on:
ETFs Portfolio
India Growth Momentum Portfolio (15 Stocks)
Horney Bull Market Portfolio (5 Stocks)
VGM (Value • Growth • Momentum)
Monthly Rebalance 5 ETF Portfolio
Ranking 750 Stocks Every Week
Identifying High-Probability Intraday & Delivery Opportunities
Successful investing is not about knowing what will happen next.
It is about having a process that tells you what to do when it happens.
Let price structure guide you through uncertainty.
— Nishesh Jani, CFTe 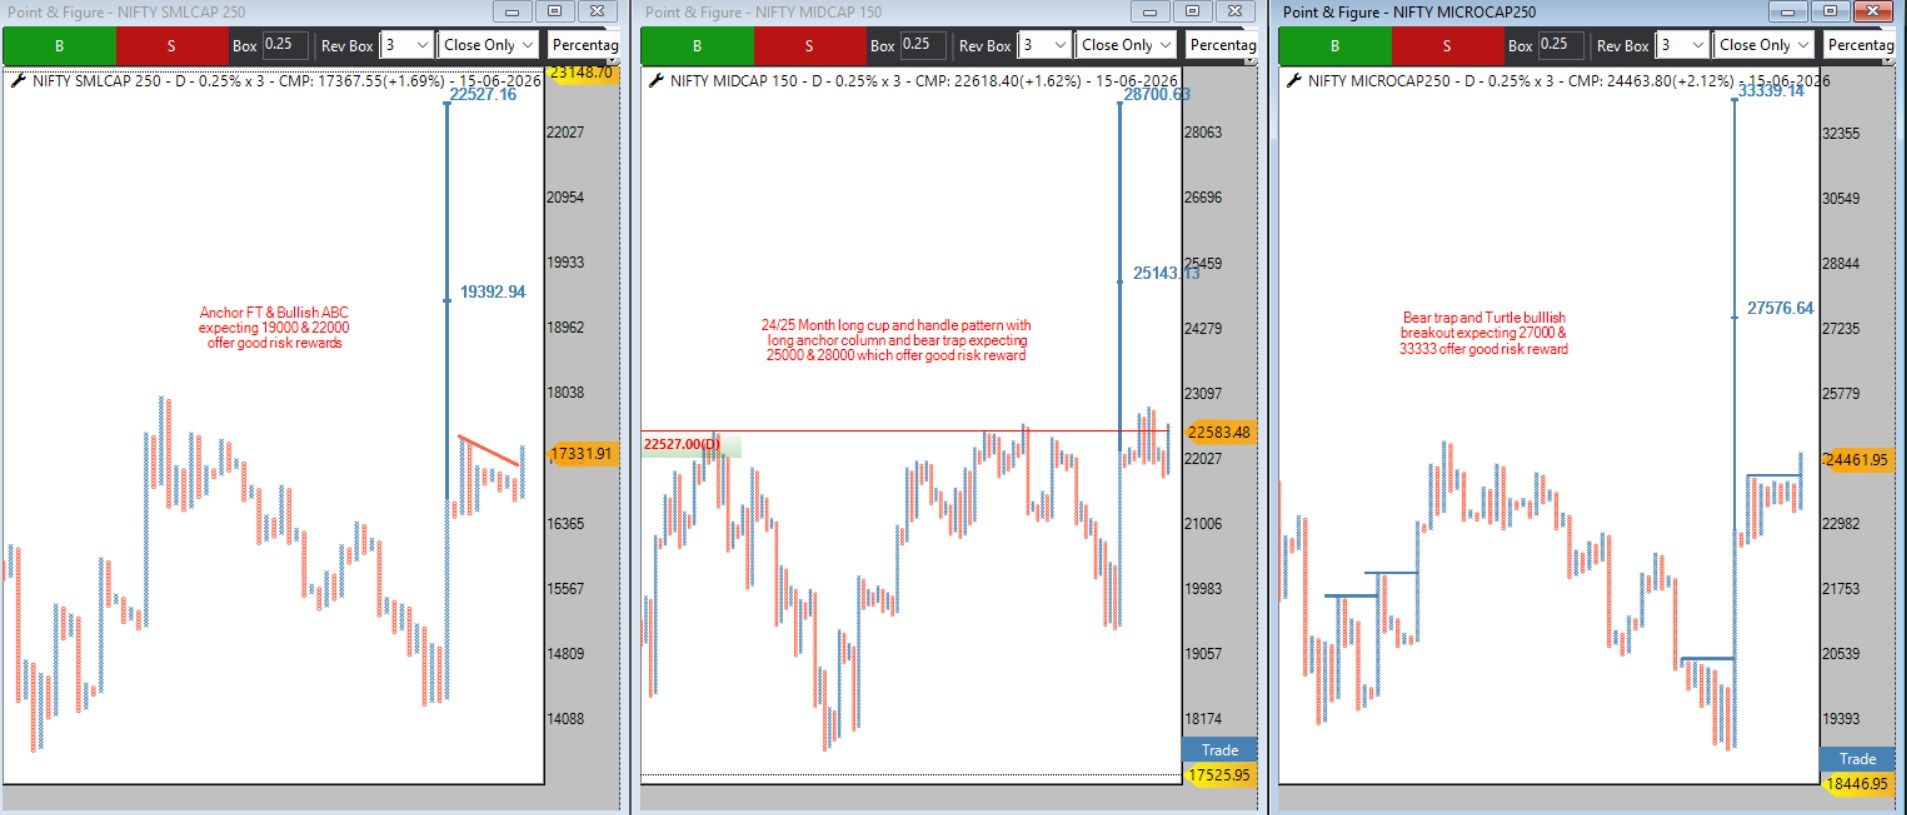
NH (#VGM Update)
now fulfilling all core #VGM conditions:
Bullish MAST
Rising EMA & SuperTrend
Last Two Column Lows Above EMA
Fresh Double Top Buy (DTB) Signal
For #VGM practitioners, this qualifies for 100% allocation as per the model rules, with Double Bottom Sell (DBS) on the Relative Strength chart acting as the exit signal.
 For those following price charts:
• 3% Chart: Long-term trend projection
• 1% & 0.25% Charts: Medium and short-term trade management
• SuperTrend can be used as a trailing stop-loss on price charts
NH has moved onto the active watchlist and deserves close monitoring for potential trend continuation.
Trade and invest only as per your own system, risk management, and position sizing rules.
#NH #VGM #MomentumInvesting #RelativeStrength #TrendFollowing #TechnicalAnalysis #StockMarketIndia #SwingTrading #Investing #NisheshJaniCFTe #valueinvesting #valuegrowthmomentum #momentumtrading #momentuminvesting 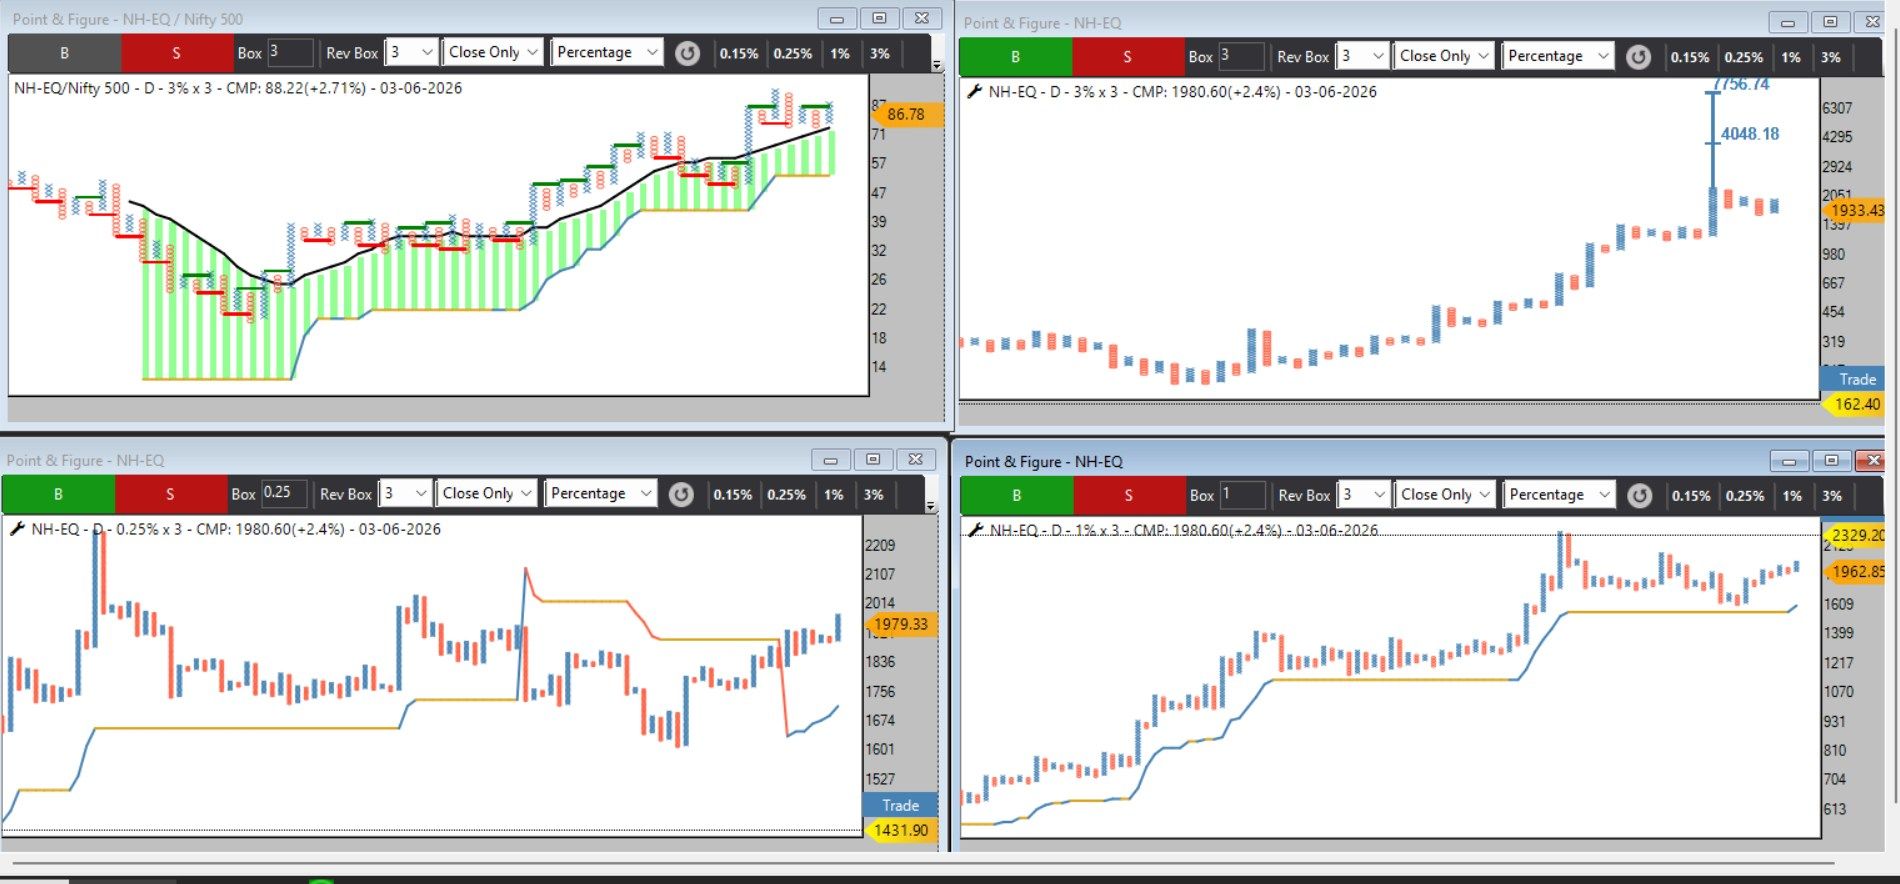
SYRMA SGS | #VGM Update
continues to display a strong bullish relative strength structure and has generated another Double Top Buy (DTB) signal on the RS chart.
Bullish MAST
Rising EMA & Super Trend
Last two column lows above EMA
Strong RS structure intact
Fresh DTB signal
#VGM practitioners who were already allocated remain fully invested. Those who missed the earlier 50% allocation opportunity may consider adding exposure as per their own risk management framework.
For price-chart followers:
3% chart: Potential upside trajectory toward the 1800 zone remains intact.
1% chart: Useful for tracking medium-term trend progression.
0.25% chart: Can be used for managing shorter-term swings and trailing stops.
Traders and investors may keep the stock on their watchlist and participate based on their own trading or investment system.
Strong Relative Strength + Bullish Structure = Stock remains in leadership mode.
#SYRMASGS #VGM #RelativeStrength #MomentumInvesting #TrendFollowing #StockMarketIndia #TechnicalAnalysis #SwingTrading #PositionTrading #MomentumStocks #NisheshJaniCFTe 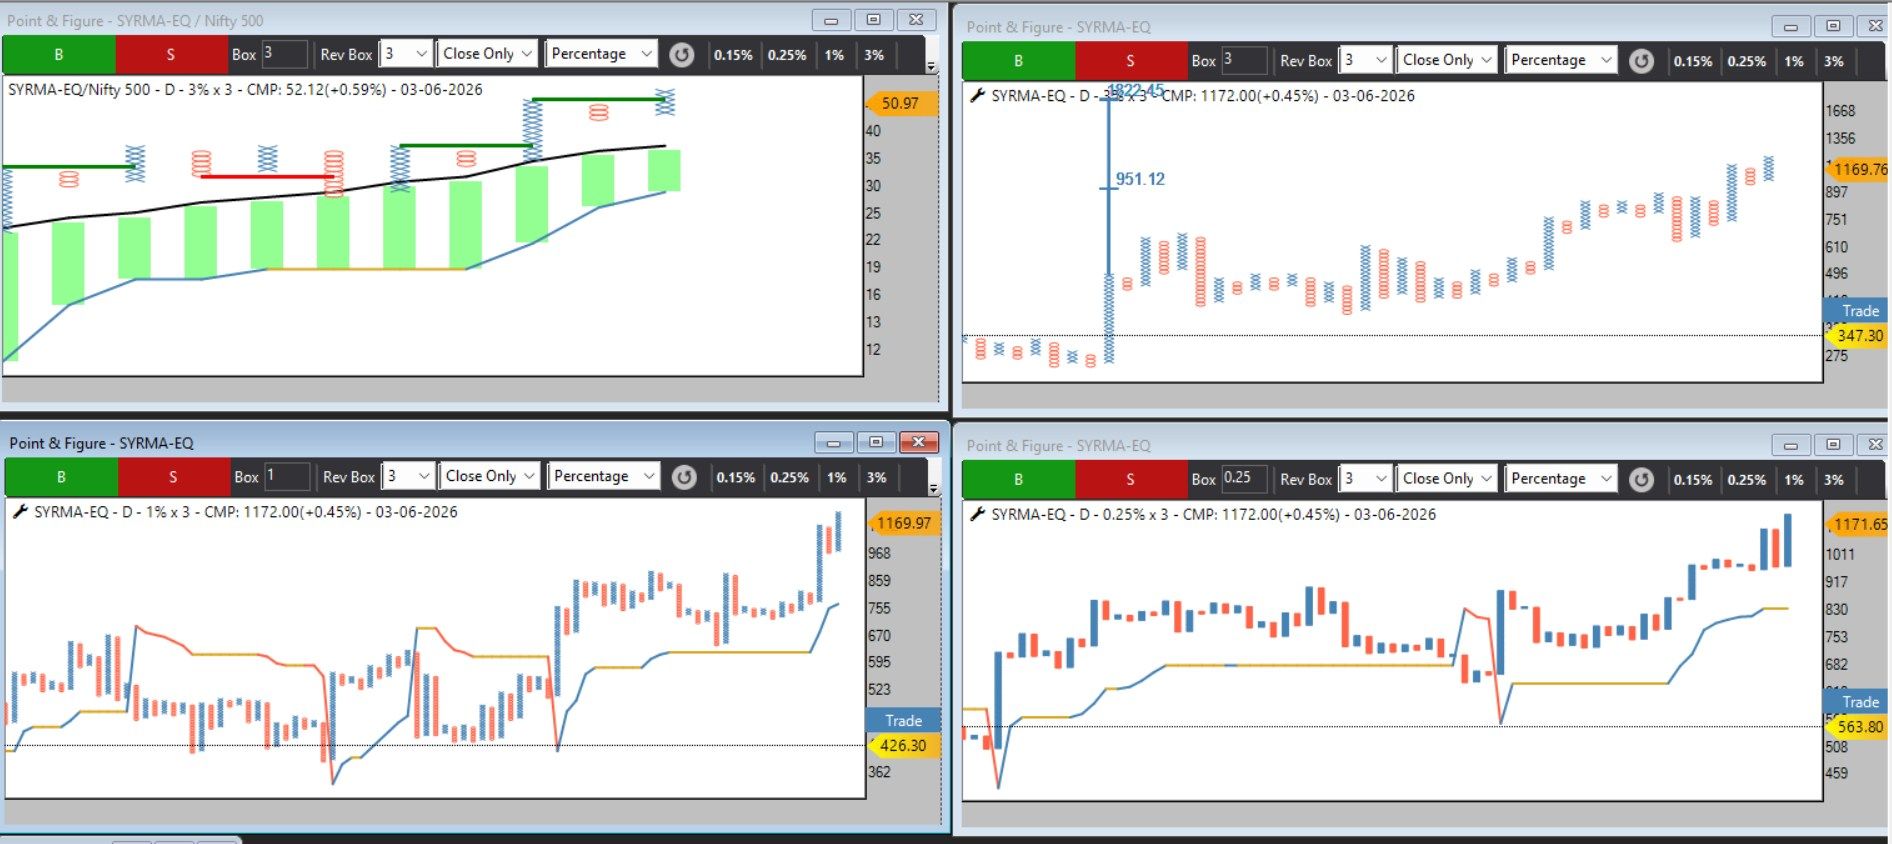
SKY GOLD Update
Yesterday, SKY GOLD triggered a PCR Entry. Today, the stock has followed through with a Double Top Buy (DTB) signal.
As per the VGM allocation framework:
Initial allocation was deployed on PCR Entry
Fresh 50% allocation will now be deployed on the DTB signal
Risk management remains the priority, with exits strictly based on system rules
A good reminder that successful investing is not about predicting; it's about executing a predefined process with discipline.
The market rewards those who follow a structured framework, manage risk, and allow winning positions to develop over time.
Process > Prediction
Discipline > Emotion
#VGM #MomentumInvesting #TrendFollowing #RiskManagement #StockMarket #TechnicalAnalysis #SKYGOLD #valueinvesting #valuegrowthmomentum #momentumtrading #momentuminvesting 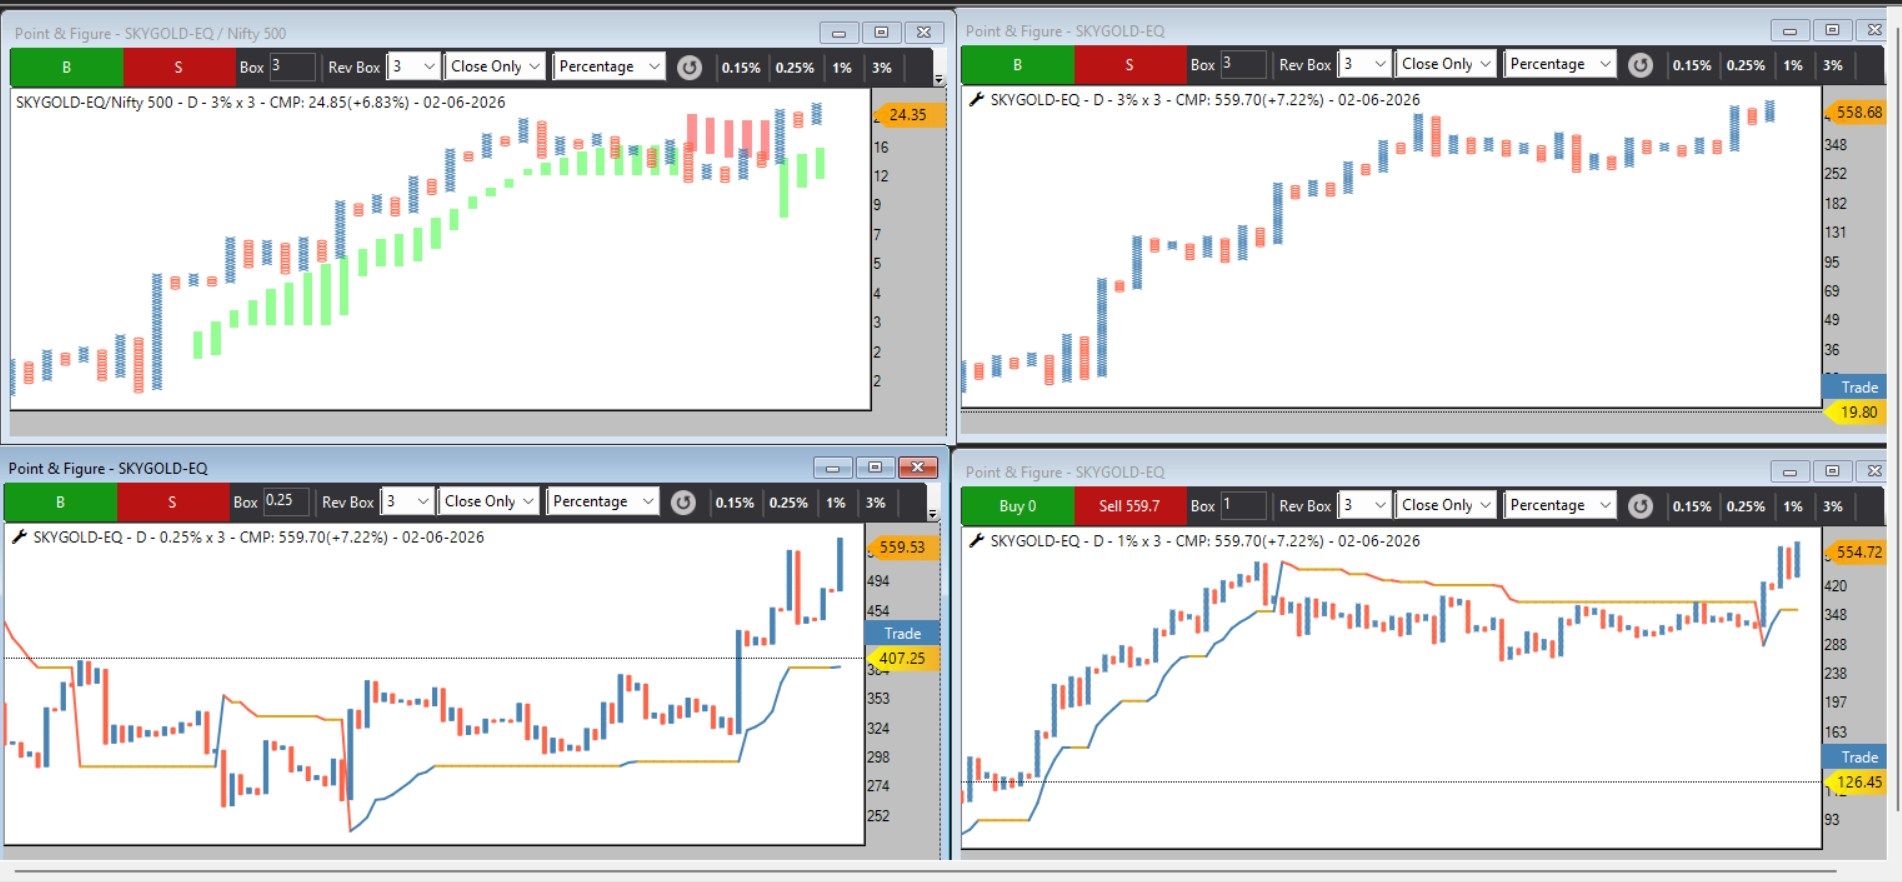
PTCIL: Relative Strength Leader Triggering Fresh VGM Entry
continues to satisfy all key #VGM conditions:
Bullish MAST Structure
Rising EMA & Super Trend
Last Two Column Lows Above EMA
Running Double Top Buy on RS Charts
Relative Strength at New All-Time High
Strong Relative Bullish Momentum
For #VGM practitioners, a fresh Double Top Buy (DTB) signal on the RS chart triggers 100% allocation, with Double Bottom Sell (DBS) on the RS chart acting as the risk management stop.
For price-chart-focused traders:
3% Chart – Long-term structure & price projections
1% Chart – Medium-term trend tracking
0.25% Chart – Short-term trading opportunities with Super Trend trailing stop
The stock is displaying both price strength and relative strength, making it a candidate for active watchlists across swing, positional, and trend-following strategies.
Keep it on your watchlist and trade it only as per your own system, position sizing, and risk management framework.
#PTCIL #VGM #RelativeStrength 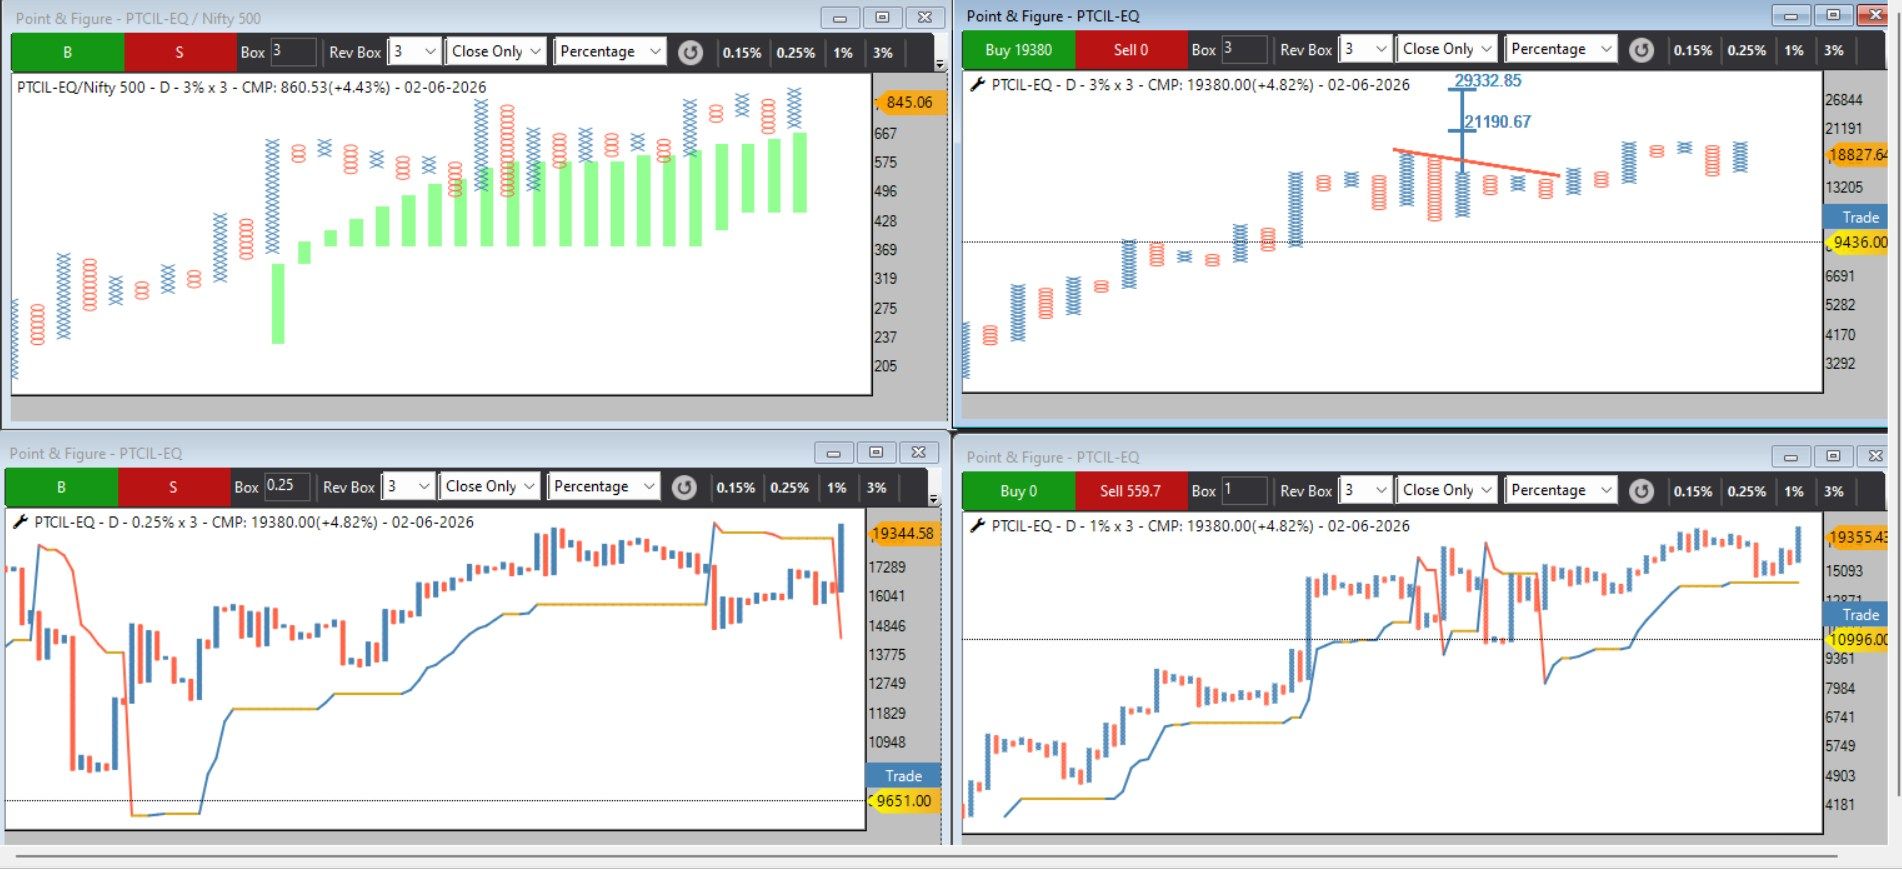
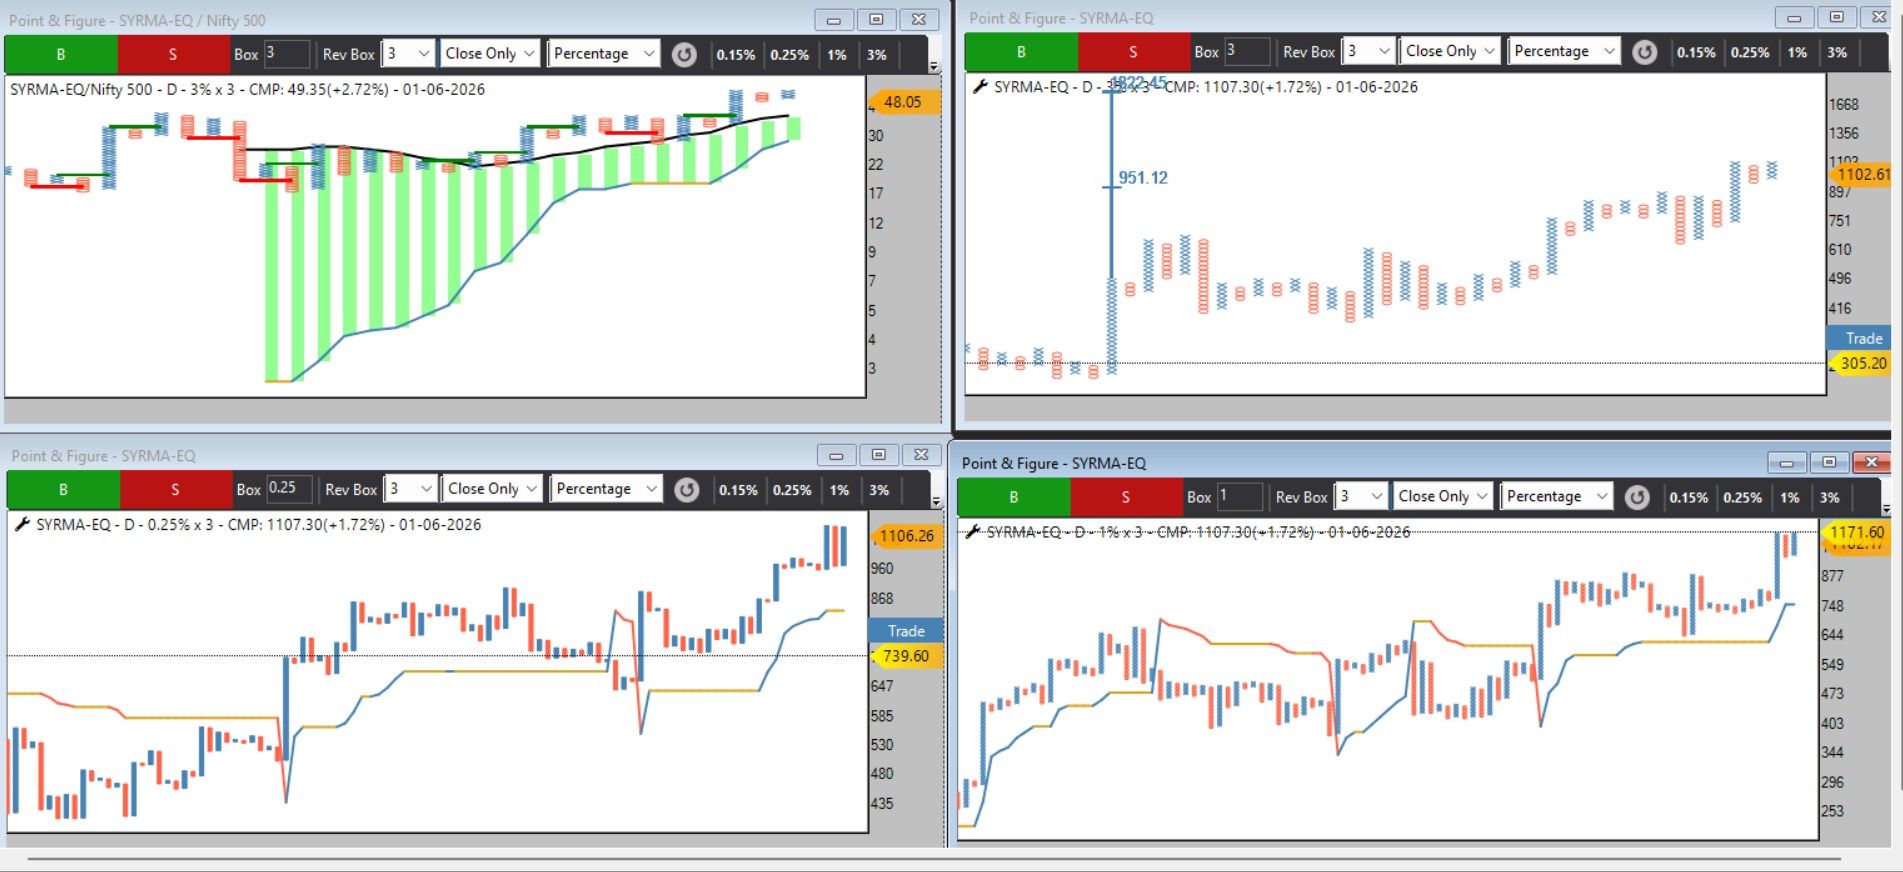
SYRMA SGS – #VGM Update
continues to fulfill all key #VGM criteria:
Bullish MAST
Last two column lows above EMA
EMA & Super Trend rising together
Active Double Top breakout structure
Healthy retracement setup
Positive Column Reversal (PCR)
The stock generated a PCR entry near ₹790 in March 2026 and is now up approximately 40%.
For followers of the #VGM framework, a fresh 50% allocation can be considered on the current PCR setup with Double Bottom Sell as the risk-management level on the RS chart.
For price-based traders:
• Long-Term: 3% chart (Open Count 1800)
• Medium-Term: 1% chart
• Short-Term: 0.25% chart with Super Trend trailing
A good reminder that strong trends often reward patience more than prediction. Focus on process, position sizing, and risk management.
Traders and investors can keep stock on watch list to trade own system
#VGM #SYRMASGS #MomentumInvesting #TechnicalAnalysis #TrendFollowing #PriceAction #StockMarketIndia #RiskManagement #SwingTrading #InvestingEducation
SKYGOLD – Emerging #VGM Opportunity
SKYGOLD – Emerging #VGM Opportunity
SKYGOLD is currently fulfilling all key #VGM criteria:
Bullish MAST Structure
Last Two Column Lows Above EMA
EMA Rising
Super Trend Rising
PCR Entry Triggered on Relative Strength Chart
For #VGM practitioners, this qualifies as a 50% allocation candidate within the framework, subject to individual portfolio construction and risk management guidelines.
For traders and investors using price-based charts:
 Long-Term: 3%
Medium-Term: 1%
Short-Term: 0.25%
Trail positions using Super Trend
The 3% Price Chart can be used to identify the broader trend structure and estimate probable target zones.
Within the #VGM framework, the objective is not to predict tops but to participate in the trend and exit only when a DBS signal appears on the Relative Strength chart.
Strong business. Strong relative strength. Clear process.
Follow the system. Respect risk. Let the trend do the heavy lifting.
#VGM #ValueGrowthMomentum #SKYGOLD #RelativeStrength #MomentumInvesting #TrendFollowing #TechnicalAnalysis #RiskManagement #ProcessDrivenInvesting
#valueinvesting #momentumtrading #momentuminvesting 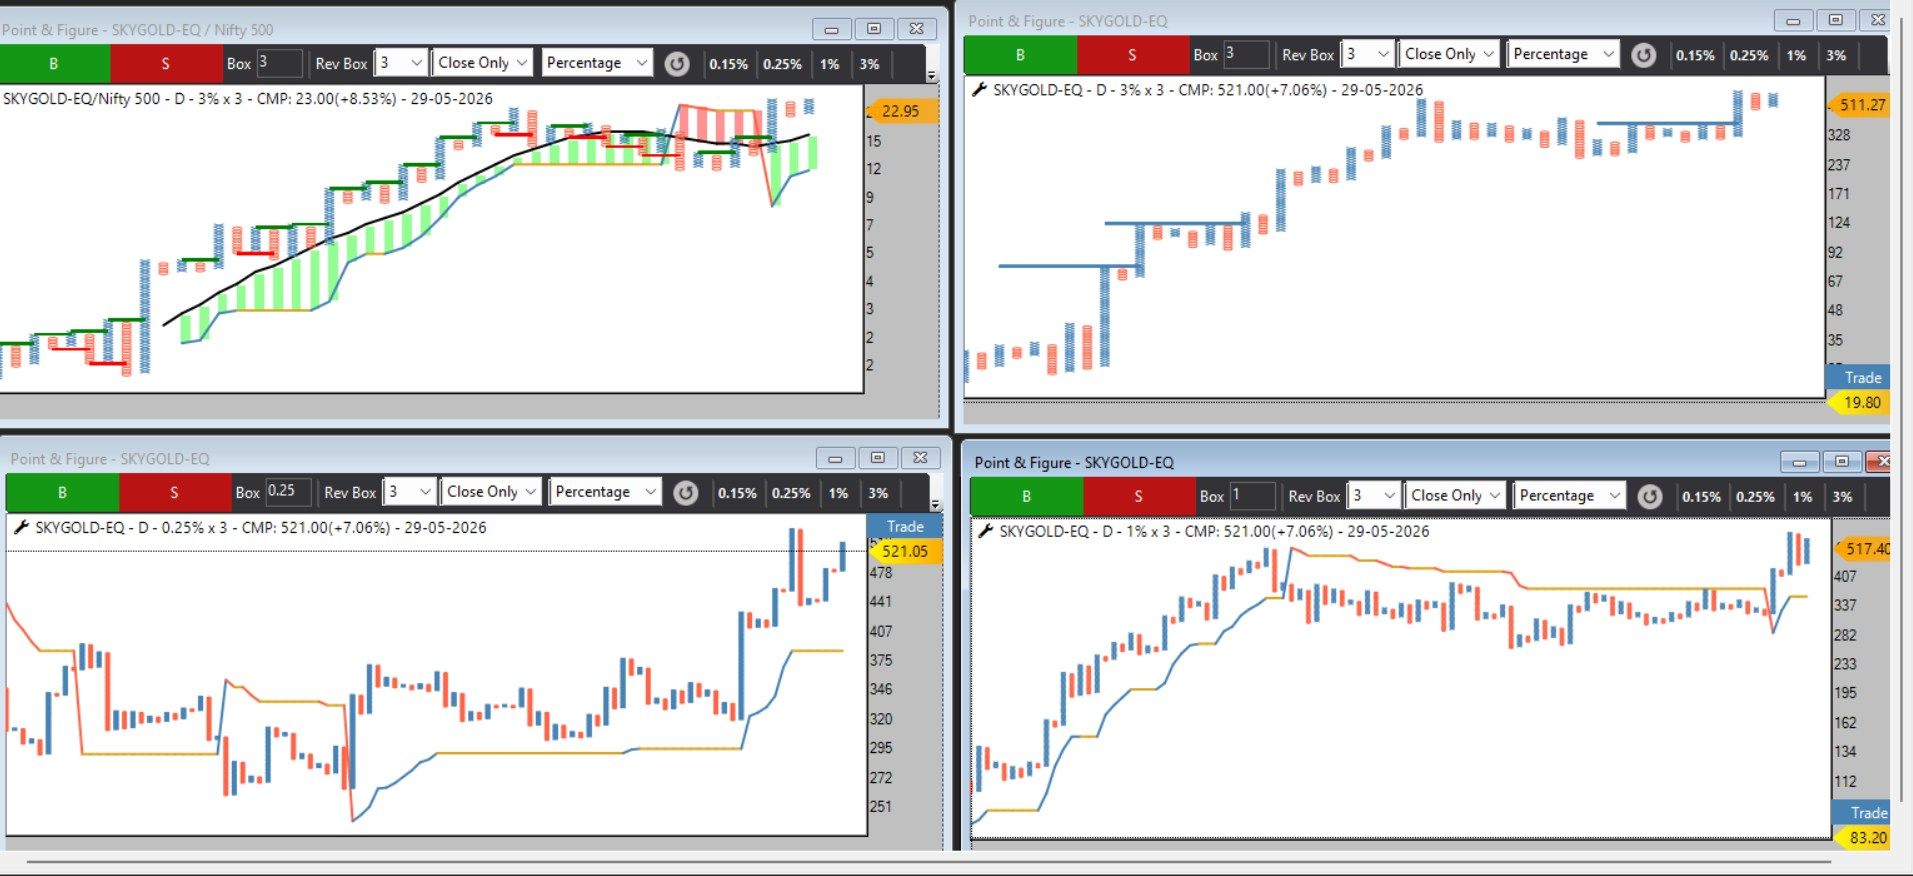
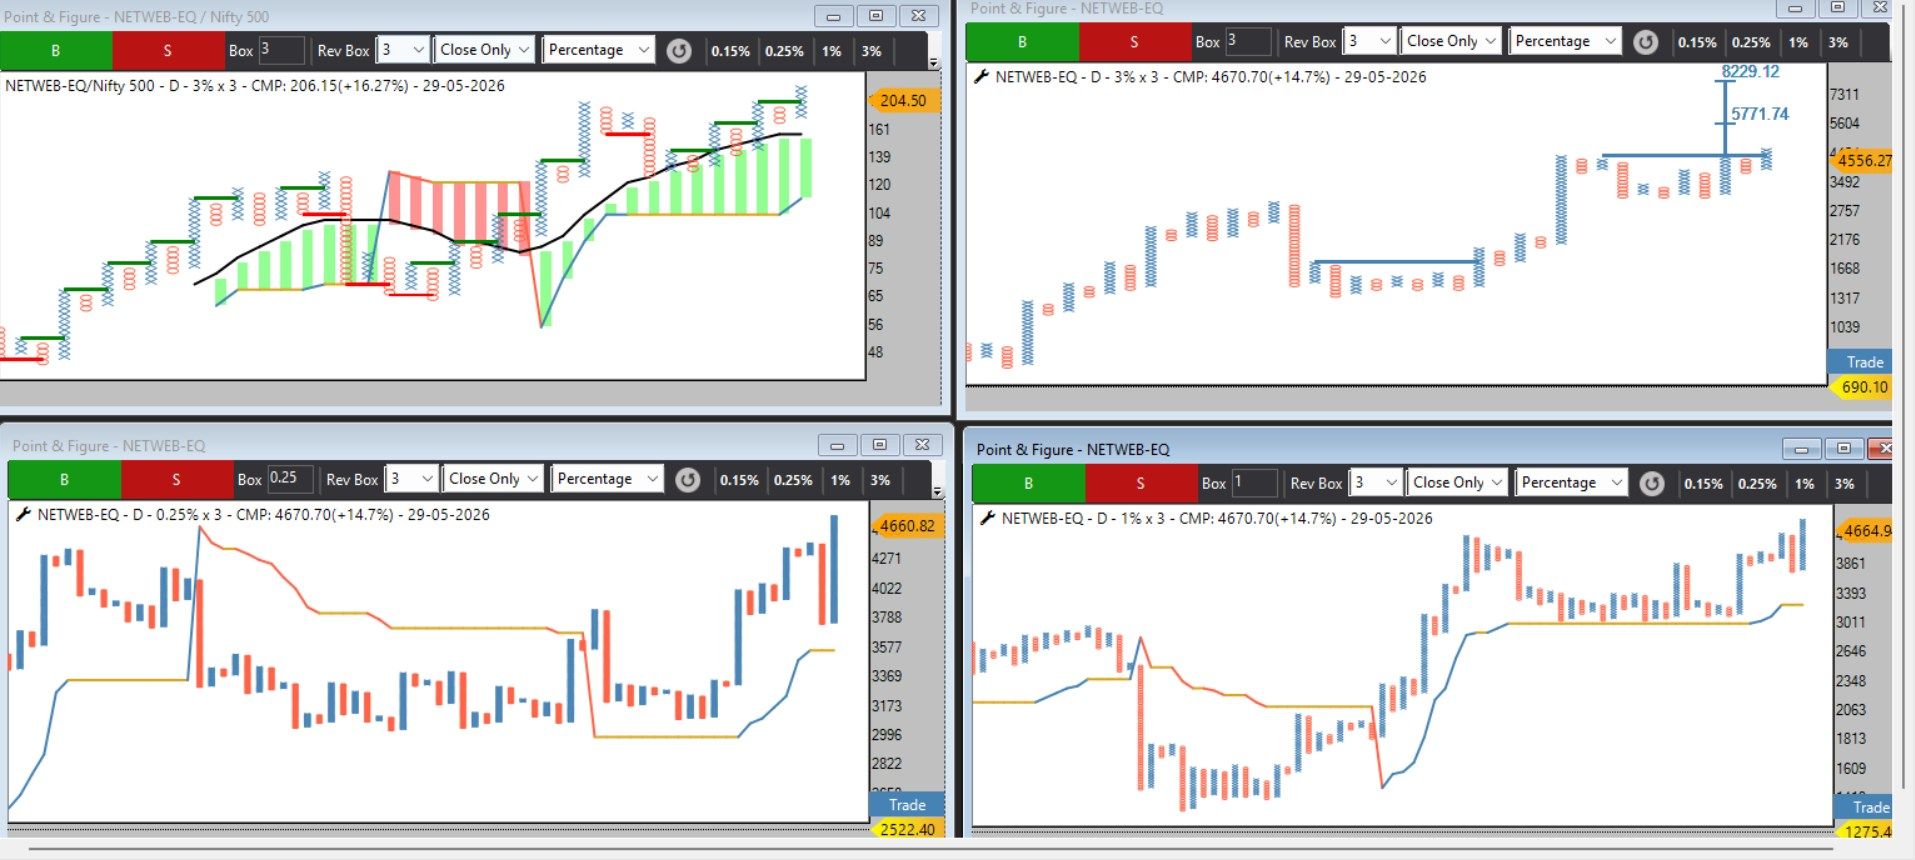
NETWEB – A Complete #VGM Setup in Action
NETWEB – A Complete #VGM Setup in Action
is currently fulfilling all core #VGM criteria:
Bullish MAST Structure
Last two columns low above EMA
EMA Rising
Super Trend Rising
PCR & DTB entry triggered on the same day
Relative Strength setup in place
For dedicated #VGM practitioners, this qualifies as a 100% allocation candidate within the framework, subject to individual risk management rules.
For traders and investors following price-based methods:
Long-Term Chart: 3%
Medium-Term Chart: 1%
Short-Term Chart: 0.25%
Trail positions using Super Trend
The 3% Price Chart can also be used to project probable target zones and assess the larger trend structure.
Within the #VGM framework, the focus remains on staying with the trend and exiting only when a DBS signal appears on the Relative Strength chart.
Process over Prediction.
Rules over Emotions.
Trend over Opinions.
#VGM #ValueGrowthMomentum #RelativeStrength #TrendFollowing #StockMarket #TechnicalAnalysis #MomentumInvesting #RiskManagement #ProcessDrivenInvesting #NETWEB
How to save session at RZONE
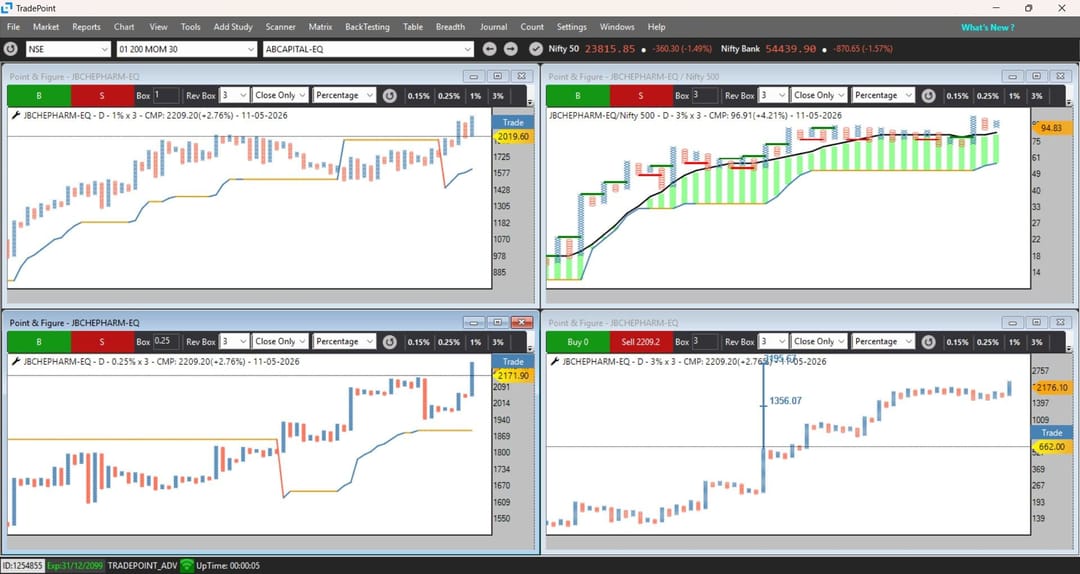
J B CHEM PHARMA fulfilling key #VGM setup conditions:
• Bullish MAST structure
• EMA trend rising
• No active bearish pattern
• Positive Column Reversal generated
Current structure offers a 50% deployment opportunity, while the remaining 50% can be considered on a Double Top Buy confirmation with Double Bottom Sell acting as SL.
Long-term price structure continues to keep open counts towards 3000+, offering favorable Risk-Reward potential. Lower box size charts (0.25% & 1%) are also shared for short-term and medium-term reference, especially for traders looking to trail positions based on price structure.
Traders & investors can keep this outperforming stock on radar and trade it based on their own system and risk management framework to potentially generate alpha.
#StockMarket #TechnicalAnalysis #VGM #MomentumTrading #SwingTrading #Investing #Alpha #RenkoCharts #TrendFollowing #IndianStockMarket #jbchem
EOD Market Analysis | Volatility Cooling, Momentum Expanding
EOD Market Analysis | Volatility Cooling, Momentum Expanding
Market structure continues to remain constructive as internal data is supporting the ongoing bullish undertone.
VIX is now comfortably below 18 and continues to decline.
ATR has normalized below 5 and is now heading towards the 3 zone — indicating controlled and stable volatility conditions.
This type of setup generally supports:
 ️ Trend continuation
️ Sector rotation
️ “Rally → Consolidation → Rally” type market structure
Breadth & Momentum Update
As discussed earlier, market breadth is continuously taking support near the neutral zone instead of slipping into bearish territory — a sign of underlying strength.
Today’s rally further confirmed that participation is broadening.
 Midcap, Smallcap & Microcap indices continue to lead the market.
All three are currently developing interesting breakout structures. Once the patterns mature and confirm, charts will be shared separately.
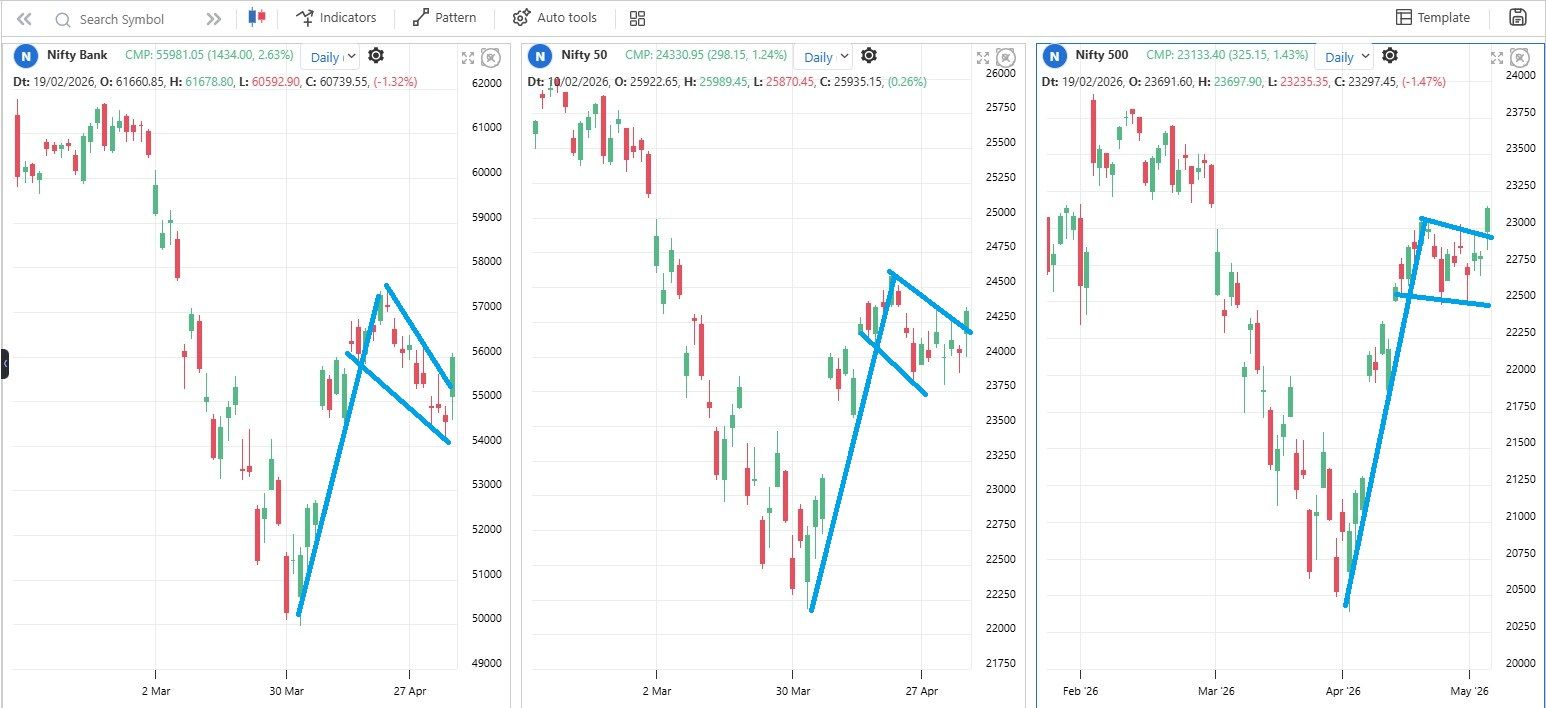
🧩 Important Chart Development
Today, the following indices are showing strong Pole & Flag continuation structures:
Nifty → Potential structure worth 2400 points
Bank Nifty → Potential structure worth 7000 points
Nifty 500 → Potential structure worth 3000 points
These are important continuation patterns and suggest that current consolidation may be preparing the base for the next directional move.
 What Could Fuel the Next Leg Up?
Many participants are still waiting for a deep correction, but:
Price structure + Breadth + Momentum + Volatility data currently suggest otherwise.
Potential macro tailwinds ahead:
Falling Crude Oil
Falling DXY (US Dollar Index)
A monthly close in DXY below 96 could potentially trigger stronger global liquidity flows towards emerging markets, including India.
🧠 Current Market Interpretation
My current reading continues to favor:
 ️ Rotational correction instead of broad market damage
️ Sector/index-wise time correction
️ Rally-base-rally market structure
️ Continued leadership from broader markets
In this phase, stock selection and sector rotation may matter more than predicting large index corrections.
#Nifty #BankNifty #StockMarket #MarketAnalysis #TechnicalAnalysis #BreadthAnalysis #MomentumTrading #SwingTrading #Investing #IndianStockMarket #Midcap #Smallcap #Microcap #MarketOutlook #PriceAction #FII #DXY #VIX #Trader #TradingView
 Horney Bull Market Portfolio – Weekly Update
Horney Bull Market Portfolio – Weekly Update
Clean, rule-based action—no attachment, only execution.
 Exits:
 LTF
LTF
AUBANK
 Fresh Entries:
ABCAPITAL
GLENMARK
5 Stocks for Next Week Focus
CUMMINS
ABCAPITAL
GLENMARK
BSE
HINDALCO
 Mentorship Note
This portfolio continues to reflect Horney Bull Market Phase—where momentum + structure + participation are aligned.
Use this as a focused watchlist, not blind entries:
Swing → Trade pullbacks in strong trends
Short-Term → Continuation setups & breakouts
Options → Structure trades around volatility & range
Positional → Trail with discipline
 Remember: Selection gives opportunity, execution creates returns.
 ️ Process Reminder
Have clarity on:
Entry trigger
Stop loss
Position sizing
No plan = no trade.
 Next Rebalance Update: 11/05/2026
 Comment the stock you’re tracking from this list.
#HorneyBullMarket #MomentumStocks #SwingTrading #OptionsTrading #TradeWithDiscipline #MarketProcess #TraderMindset
#VGM Method – A Proven Wealth Creator
Star Performer: MTARTECH
Entry: 9th January @ ₹2689
Current Gain: +122%
This isn’t luck. This is process-driven investing.
Back at EDECNOCH 2021, I shared a simple, structured framework —
️ Clear rules
️ Defined setups
️ Repeatable outcomes
Since then:
Detailed notes shared
Ready-to-use scanners published
300+ serious learners already exploring the method
What makes it powerful?
It removes noise
It builds conviction
It creates consistency
And most importantly —
You don’t trade alone. You grow with a community.
On our Telegram:
Live charts discussions
Setup-based learning
Active participation from serious market students
If you're genuinely curious to move from random trading → structured decision-making, this is your space.
 Join the community (Free):https://t.me/+HOuDnn1VTdJjYzdl
Let’s learn. Let’s grow. Let’s compound — together.
#StockMarket #VGM #MomentumInvesting #WealthCreation #TradingCommunity #LearnAndGrow #ProcessDriven #IndianMarkets
GE SHIPPING – Process-Driven Opportunity
is aligning well on structure + relative strength.
VGM conditions met on RS
Bullish MAST formation
Running DTB setup
Last two column lows above MA → strength intact
PCR → first entry signal
Structure: Strong pattern offering favorable R:R
️ ₹1555 → ₹2522+ (zone, not prediction)
 ️ Execution Plan:
• 50% entry on PCR
• 50% on DTB confirmation
• SL: DBS
• RS practitioners: follow DBS exit
• Price-based traders: trail as per your system
🧠 Mentorship Note:
Clarity + Structure + Risk Management = Consistency
Trade the process, not the outcome.
#StockMarket #TradingDiscipline #RiskManagement #TechnicalAnalysis #MomentumTrading #ProcessOverOutcome #VGM #geship 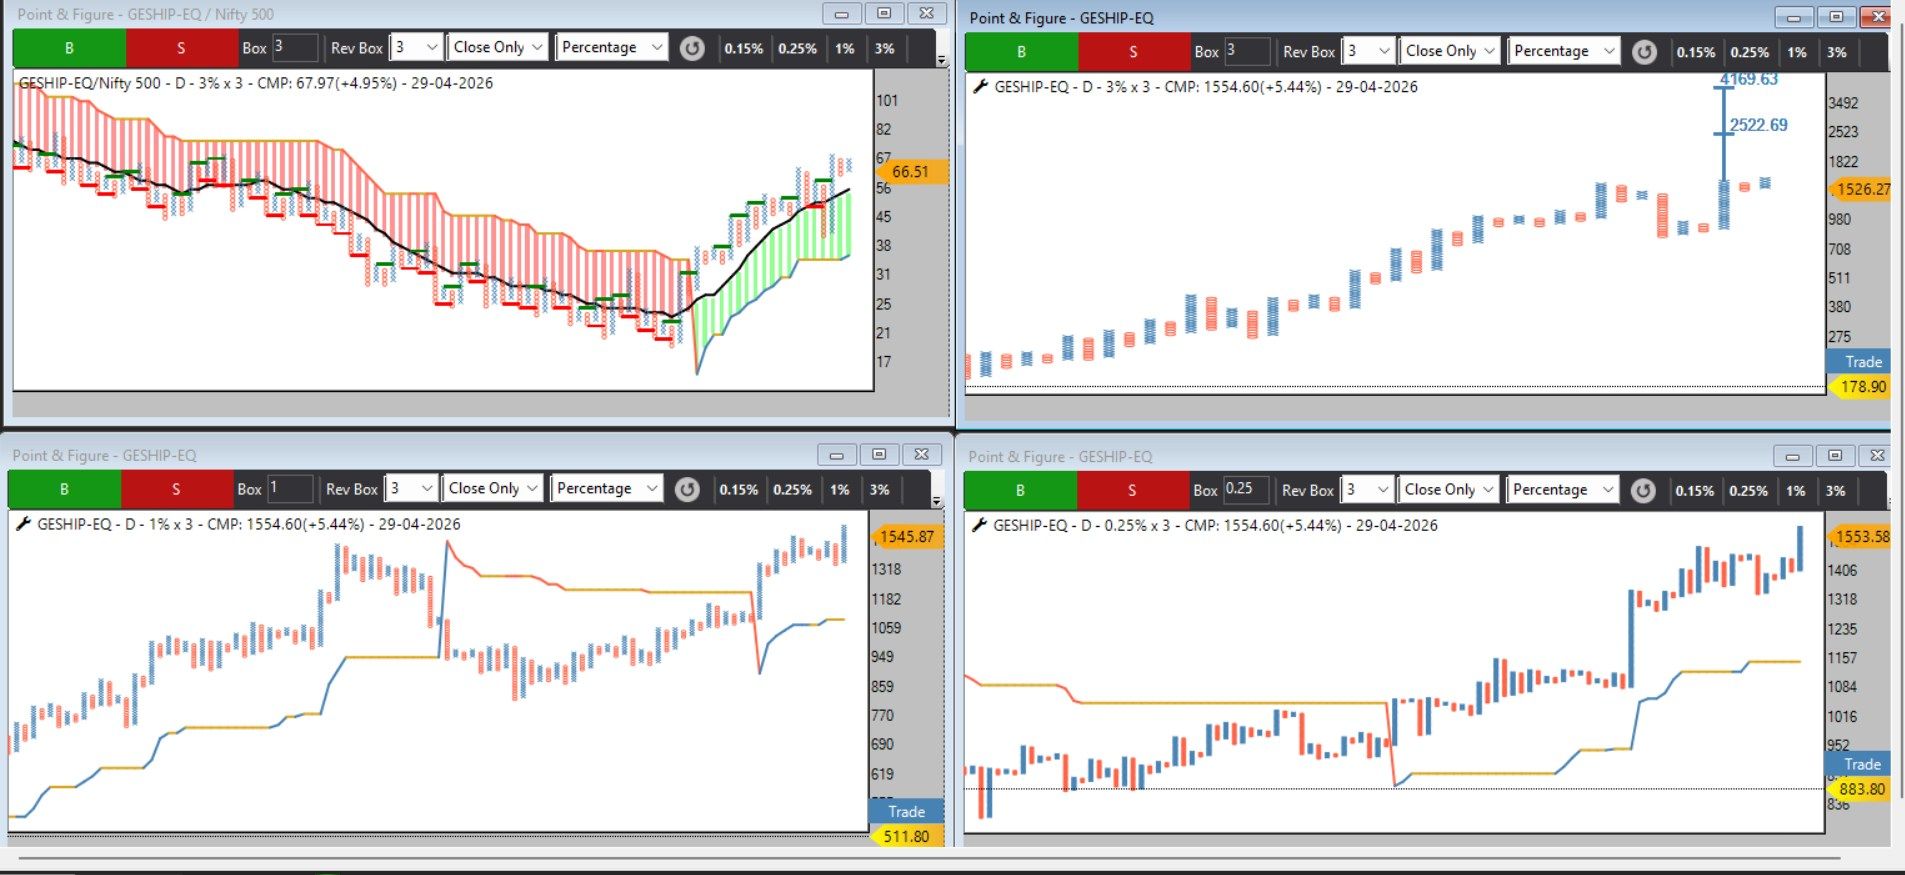
5 Stock “Horny” Bull Market Portfolio – Update
System-driven. Process-oriented. Aligned with market leadership.
 Rebalance Action:
Exit: ABCAPITAL
Entry: AUBANK
Current Portfolio:
AUBANK
CUMMINSIND
LTF
BSE
HINDALCO
This is what a true bull market framework looks like:
Leadership keeps rotating
Strength replaces strength (not weakness)
Outperformance comes from adaptability, not attachment
In this environment, portfolios must continuously evolve. Holding past winners without confirmation from the system can lead to underperformance.
Our approach remains clear:
Follow momentum & structure
Execute rule-based decisions
Stay aligned with emerging leaders
Framework Reminder:
Stick to your defined universe/watchlist
Trust your system signals
Focus on execution over prediction
 Next Rebalance: 04/05/2026
Portfolio aligned with current leadership… is yours?
Nishesh Jani,CFTe
#PortfolioUpdate #BullMarket #MomentumInvesting #SystemTrading #MarketLeadership #Discipline
Market Insight: Relative Strength Shift in Leadership
The Relative Strength (RS) chart of BANK vs IT (P&F format) is now signaling a decisive shift. An Inverse Head & Shoulders breakout (as highlighted in the rectangle) confirms strengthening momentum in the Banking space relative to IT.
At the same time, the earlier shared RS setup of PVT Banks vs PSU Banks is approaching a key support zone with a potential reversal structure.
What is getting clearer:
Banking sector is emerging as a relative outperformer vs IT
Within Banking, PVT Banks are likely to take leadership
This is how sector rotation unfolds—first at the index level, then narrowing down to stronger pockets within the sector.
Stay aligned with relative strength, not absolute narratives.
if you like the insights do motivate me with sharing in other groups and retweet the post
Nishesh Jani,CFTe
#SectorRotation #RelativeStrength #BankingSector #PrivateBanks #MarketLeadership #SmartMoney #TechnicalAnalysis #PnFChart #InvestingInsights 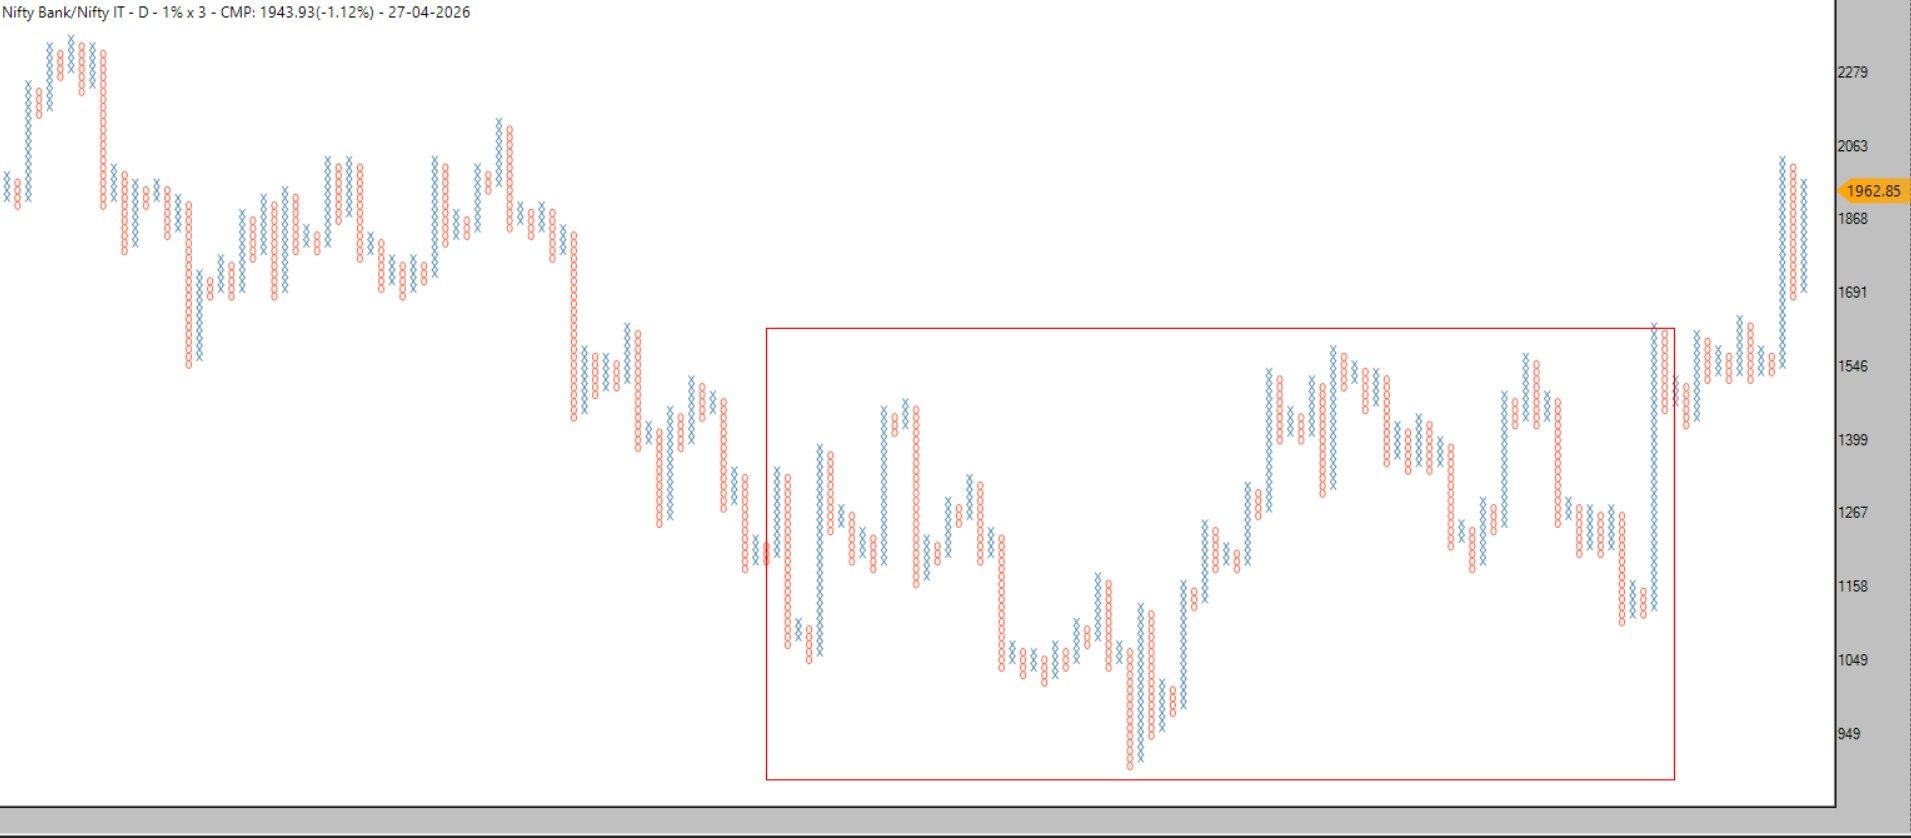
Bullish Structure Emerging Across Key Indices
Bullish Structure Emerging Across Key Indices
The broader market continues to exhibit strong bullish structure, with multiple indices showing positive momentum, improving breadth, and structural strength.
Both investors and traders can start preparing a focused watchlist from these segments and participate using their own systems and setups.
Bullish Indices Watchlist
Alpha 50
Healthcare
India MFG
LargeMid250
Microcap250
Mid Select
Midcap 100
Midcap 150
MidSml 400
Smallcap 100
Smallcap 50
50 Equal Weight
500 Multicap
CPSE
Capital Market
Commodities
Dividend Opportunities 50
EV
Energy
FinServ Ex Bank
High Beta 50
Housing
India Defence
MNC
MS Fin Service
Media
Metal
MidSmall Healthcare
Midcap 50
Multi Infra
Multi Mfg
Next 50
PSE
SME Emerge
Waves
200 Alpha 30
200 Value 30
500 Equal Weight
500 Flexicap
500 Health
500 LMS Equal
500 Quality 50
500 Value 50
MS400 MQ 100
Sml250 MQ 100
 Actionable Insight:
Structure is bullish, but selection & timing remain key
Focus on relative strength + momentum confirmation
Avoid chasing extended moves — wait for price-time correction setups
Build your watchlist → Track setups → Execute with discipline
Nishesh Jani,CFTe
#StockMarket #NiftyIndices #MomentumInvesting #SectorRotation #TradingStrategy #InvestingIndia
 ️
️
Gold vs Equity Rotation – A Timely Signal ️
During Diwali, I shared an observation on Nifty 500 vs Gold Relative Strength:
 Whenever Smoothed RS dips below 30 →
It has historically been the best zone to rotate from Gold to Equity
Global uncertainty & war-led panic recently gave that exact opportunity — equities were available at favorable levels while fear was high.
Fresh Observation:
Now adding another powerful layer:
️ When Smoothed RSI < 30
️ AND it gives a crossover above its EMA
️ This confirms momentum shift towards Equity
 Message for Gold Investors:
“Waqt rehte sambhal jao… warna waqt samjha dega.”
This is not about abandoning Gold —
This is about recognizing cycles & reallocating smartly.
Mentorship Insight:
Markets don’t reward comfort.
They reward timely rotation + conviction backed by data.
Right now, Risk-Reward is tilting towards Equity.
Nishesh Jani,CFTe
#AssetAllocation #RelativeStrength #EquityVsGold #MarketCycles #SmartMoneyMoves #Nifty500 #InvestingWisdom #goldbees 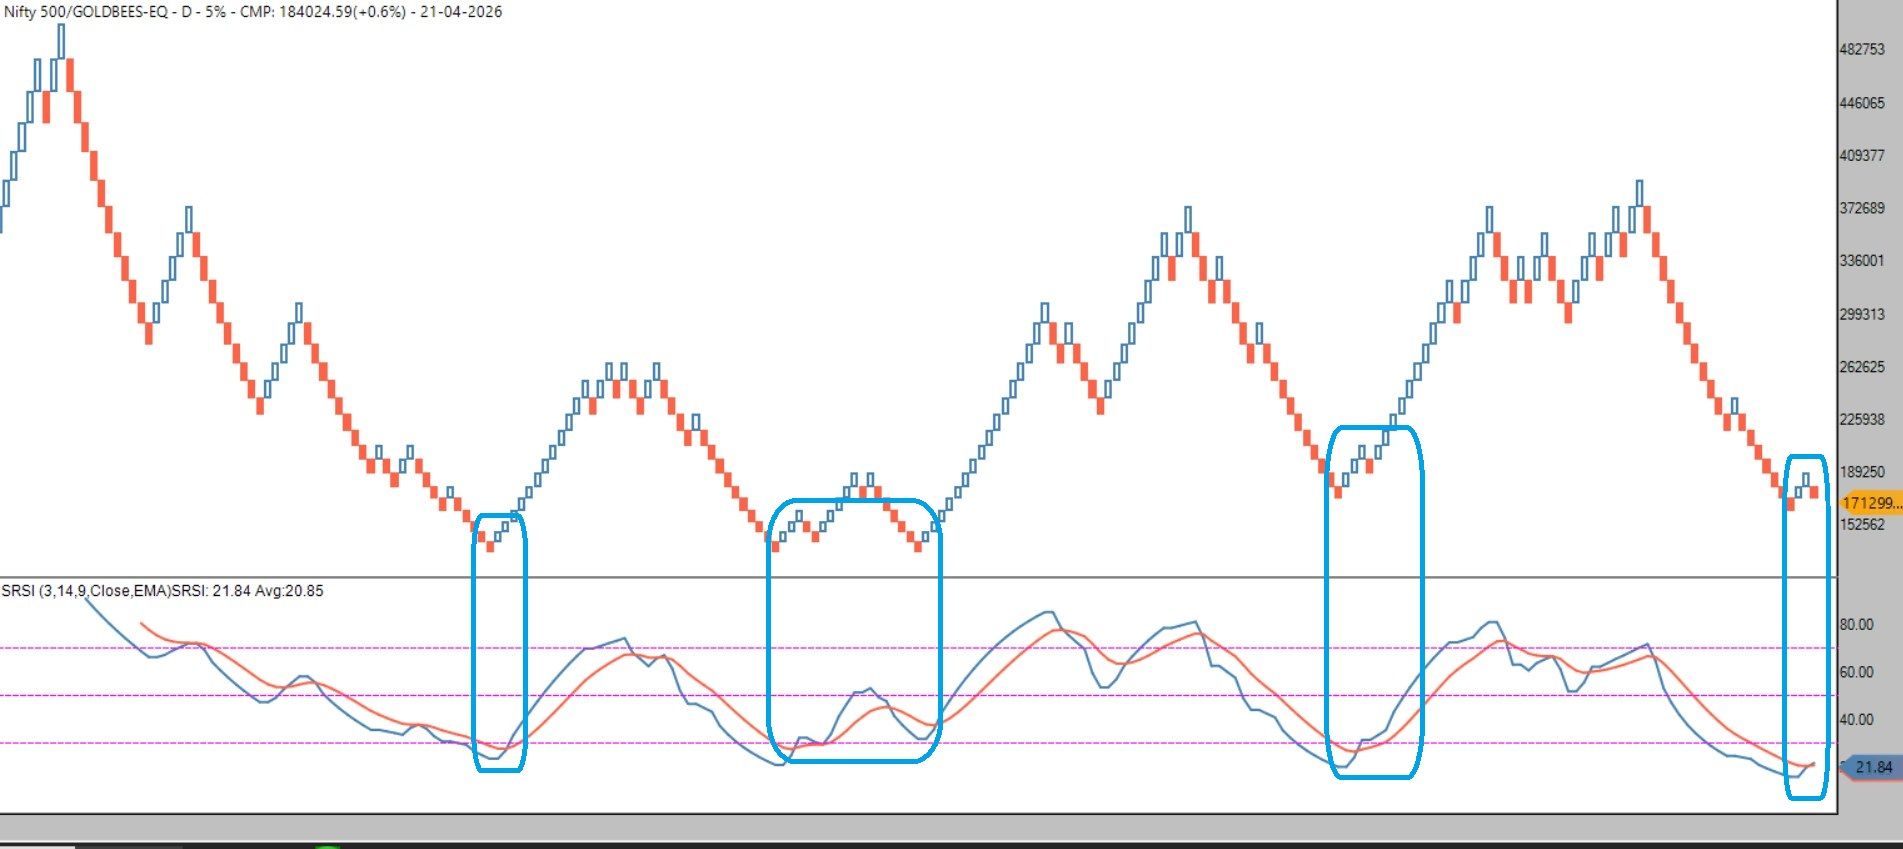
Strong Move in Radico Khaitan
9th March: PCR-based entry triggered at ₹2751
Current Price: ₹3340 → Solid momentum already captured
What’s happening now?
️ Fresh DTB entry as per #VGM model
️ Clear Bullish ABC breakout on price charts
️ Structure suggests a potential upside towards ₹5600
Strategy Insight:
VGM followers → DBS remains the exit rule
Traders & Investors → Can align entries/exits with price structure based on their system
️ Key Learning for Mentorship Group:
This is a classic example where:
Multiple systems (PCR + VGM + Price Pattern) align
Momentum + Structure + Confirmation = High probability setup
Action Plan:
Track continuation strength
Manage position sizing smartly
Nishesh Jani,CFTe
#VGM #PriceAction #MomentumTrading #StockMarketIndia #TradingSetup #WealthCreation #radico 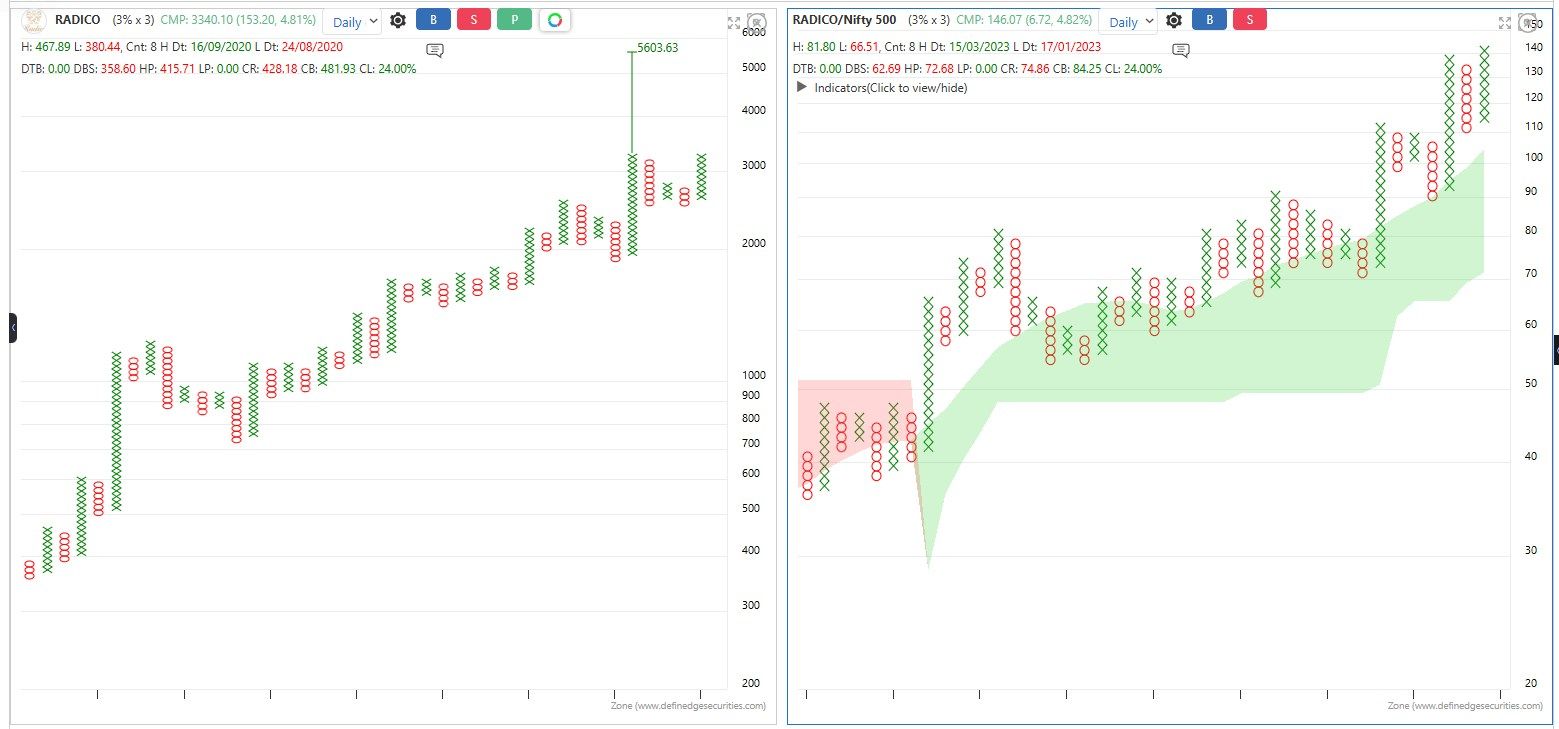
MIDSMALL vs Nifty 100 – What the Ratio Chart is Saying- “Tiger abhi zinda hai”
MIDSMALL vs Nifty 100 – What the Ratio Chart is Saying
Before COVID, MID & SMALL caps were clearly underperforming.
Then came the breakout — and what followed was a massive phase of outperformance.
 Post that rally, markets cooled off into a 2-year consolidation (sideways phase) — a necessary pause.
2023–2024 again belonged to MIDSMALL.
And now?
We are approaching a breakout from a falling trendline.
️ Interestingly,
Most analysts, fund managers & investors are currently tilted towards Large Caps.
But Relative Strength (RS) tells a different story…
 “Tiger abhi zinda hai” – MIDSMALL is not done yet.
 Our Positioning:
We are already well capitalized through our ETF allocation:
️ ALPHA
️ MOMENTUM50
️ MIDSMALL
️ MID150BEES
Message
Don’t follow consensus blindly.
Follow structure + relative strength + positioning.
Markets reward those who stay ahead of the narrative, not those who react late.
Nishesh Jani,CFTe
#Midcap #Smallcap #RelativeStrength #StockMarketIndia #ETFInvesting #MomentumInvesting #PortfolioStrategy #MarketOutlook #Nifty #WealthCreation #nisheshjani 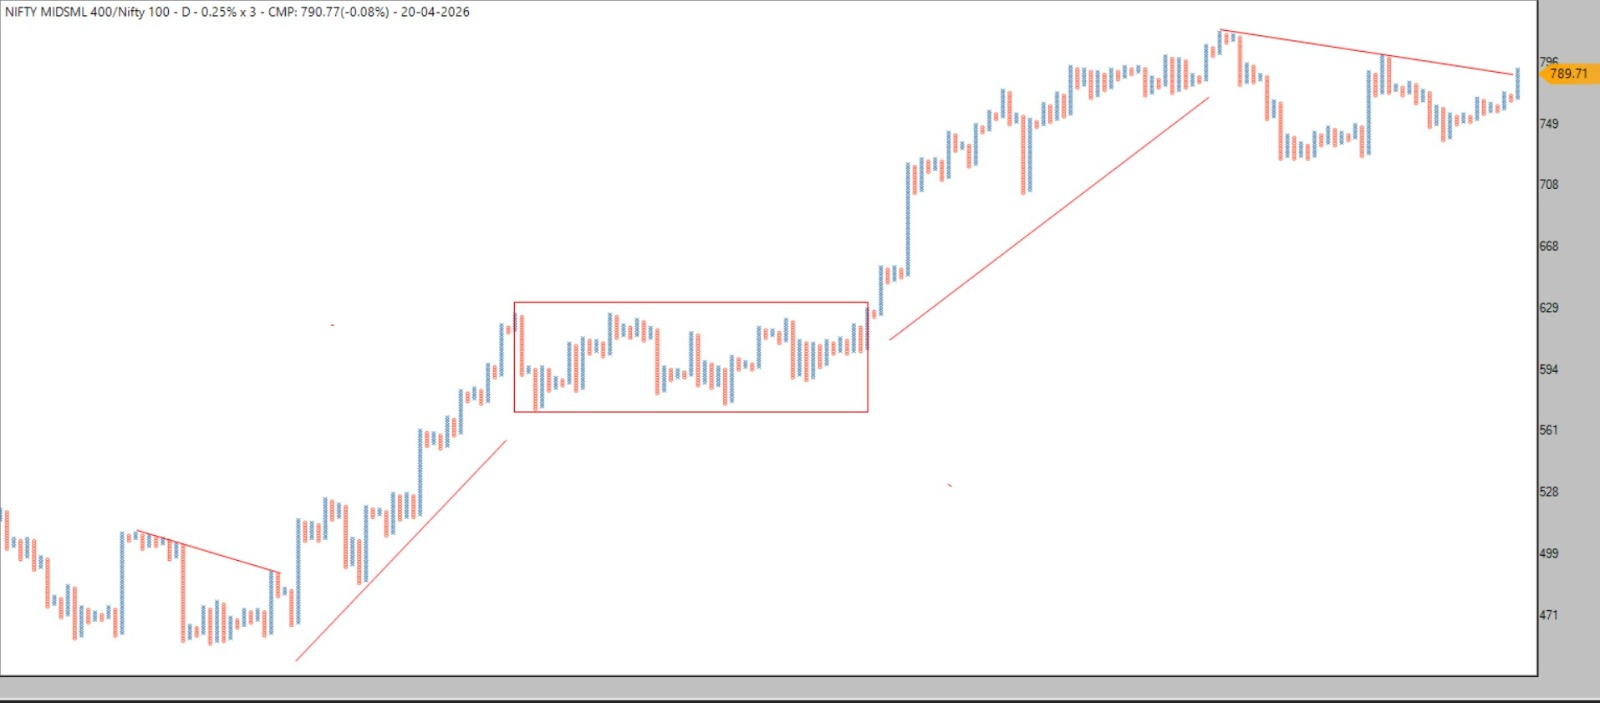
Horney Bull Market – Weekly Portfolio Update
Horney Bull Market – Weekly Portfolio Update
Rebalancing Action Taken:
Exit: AUBANK, INDIANBANK
Entry: CUMMINSIND, HINDALCO
Updated 5-Stock Portfolio (This Week):
BSE
CUMMINSIND
LTF
ABCAPITAL
HINDALCO
What to Do?
This list can be used as your weekly trading universe to apply any of your systems — momentum, breakout, positional, or intraday.
️ Remember:
Discipline > Prediction
Process > Emotion
Next Rebalance: 27/04/2026
Stay aligned with strength. Stay with structure.
Markets reward those who follow a system consistently.
Nishesh Jani,CFTe
#StockMarketIndia #MomentumTrading #SwingTrading #PortfolioUpdate #MarketStrategy #TechnicalAnalysis #TraderMindset #WealthCreation
 IS A “HORNY BULL MARKET” JUST BORN?
IS A “HORNY BULL MARKET” JUST BORN?
When the market speaks… smart money listens.
Right now, the MAST Indicator turning GREEN + +DMI crossing above -DMI is not just a signal…
It’s a regime shift.
This is what I call a “Horny Bull Market” phase — fast, aggressive, opportunity-rich.
What this phase typically delivers:
Strong Positive Momentum
Momentum strategies start printing money
Buy & Hold becomes rewarding again
Even simple systems outperform
Leverage / MTF becomes favorable (for disciplined traders)
Market Character Changes:
• High P/E & high leverage stocks start leading
• Cyclical, aggressive & re-rated stocks move FAST
• “Story + Momentum” beats “Only Fundamentals”
• Quality stocks may underperform in speed
• Even penny stocks start showing crazy moves
Positioning Update (Smart Money Move):
We’ve already started loading our favourite ETFs —
ALPHA | MOMENTUM50 | MIDSMALL | MID150BEES
Now we stay relaxed… and let the bull do the heavy lifting.
But Don’t Get Carried Away…
No bull market goes straight up.
You WILL see:
• Overbought indicators & stretched breadth
• Sharp pullbacks to short & medium-term MAs
• Volatility spikes during retracements
Classic Structure to Watch:
Higher Highs & Higher Lows (Dow Theory in action)
Best tool to trail stop losses intelligently
Seasonality will add fuel at the right time
Final Note
The market gives opportunity… but only the prepared benefit.
Find YOUR setup
Follow PRICE, not opinions
Respect Risk Management & Position Sizing
And in free time… keep upgrading your knowledge
This is not the time to be fearful…
It’s the time to be disciplined, prepared, and aggressive with control.
“The process is refined over years — happy to share outcomes, not the blueprint.”
“We operate on a proprietary framework — our focus is delivering consistent outcomes.”
Nishesh Jani,CFTe
#BullMarket #MomentumInvesting #ETFStrategy #Alpha #Midcap #Smallcap #StockMarketIndia #Nifty #PriceAction #RiskManagement #WealthCreation #nisheshjani 
Flash Update – Market Alert
Flash Update – Market Alert
99.99% probability: Horny Bull Market – Stage 1 is getting confirmed 
Early signals of accumulation are visible across indices — this is where smart money quietly builds positions before momentum becomes obvious.
Strategy:
Stay invested, start accumulating leaders, and be prepared for the next leg of expansion.
“Stage 1 is silent… Stage 2 is explosive.”
Nifty 500 (Broad Market) – Long-Term RSI Perspective
remember this accumlation alert ?
yes needed raised the query
team can u add rolling return calculation in performance table please ,currently it calcualte return between two periods exatly in some formula needed rolling return for consisitancy and smoothness of indicators Thanks
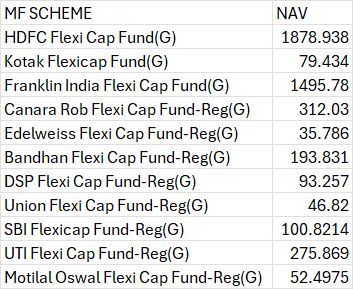
#mutualfunds some flexicap schemes look good to focus
When Markets Ignore Logic… They Eventually Return to It
A few months ago, during the madness in Gold & Silver, I highlighted something important:
Oversold signals didn’t matter
Divergences were ignored
Standard deviations were stretched
Mean reversion & disparity had no value
At that time, price was driven by emotion, momentum & narrative — not theory.
And what happened next?
️ The same ignored theories eventually proved themselves right.
Now, I’m seeing the same setup again… but on the downside in Indian markets.
Panic is dominating
Indicators are being ignored
Valuations & technical frameworks are being dismissed
But remember:
Markets can ignore theory temporarily… but not permanently.
Extreme deviations always seek equilibrium.
This phase is not about predicting bottoms…
It’s about recognizing when fear disconnects price from structure.
And when that gap closes —
the move is fast, sharp, and unexpected.
Stay objective. Stay disciplined. Trust process over noise.
Nishesh Jani,CFTe
#StockMarketIndia #MarketPsychology #MeanReversion #TradingMindset #InvestingWisdom #Nifty #MarketCycles #TechnicalAnalysis #ContrarianThinking #WealthCreation #nisheshjani #AhmedabadNest
Sectors Showing Strength — Time to Build Your Radar
Based on multiple studies and trend observations, the following sectors are currently displaying relative strength:
• Healthcare
• CPSE
• Capital Markets
• Commodities
• Energy
• Defence
• Metal
• Mid & Small Healthcare
• PSE
• Pharma
Strength doesn’t mean immediate buying — it means opportunity is building.
Smart approach:
Track leading stocks within these sectors
Wait for your system-based entries
Align with momentum, not emotions
Markets reward preparation, not prediction.
Stay ready. Stay disciplined.
Nishesh Jani,CFTe
#StockMarketIndia #SectorRotation #MomentumInvesting #TradingSetup #SmartMoney #MarketTrends #Nifty #EquityInvesting #TechnicalAnalysis #nisheshjani #AhmedabadNest
️
Precious Metals at a Critical Inflection Point ️
Gold and Silver are approaching structural breakdown zones based on vertical count projections.
• Gold: A decisive close below ₹144000 opens the path towards ₹119000
→ Potential downside: ~17%
• Silver: A close below ₹2,30,000 signals a move towards ₹1,46,000
→ Potential downside: ~36%
This is not just about price levels — it’s about momentum exhaustion.
Once these levels are breached:
️ Upside momentum in metals is likely to fade
️ Risk-reward in commodities may deteriorate sharply
️ Capital could rotate towards equities, where relative strength emerges
Markets don’t move in isolation — they rotate.
Smart money doesn’t chase what has moved.
It prepares for what’s next.
Stay alert. Stay adaptive.
Nishesh Jani,CFTe
#Gold #Silver #Commodities #MarketOutlook #SectorRotation #SmartMoney #InvestingIndia #StockMarketIndia #MomentumTrading #WealthCreation #nisheshjani #AhmedabadNest 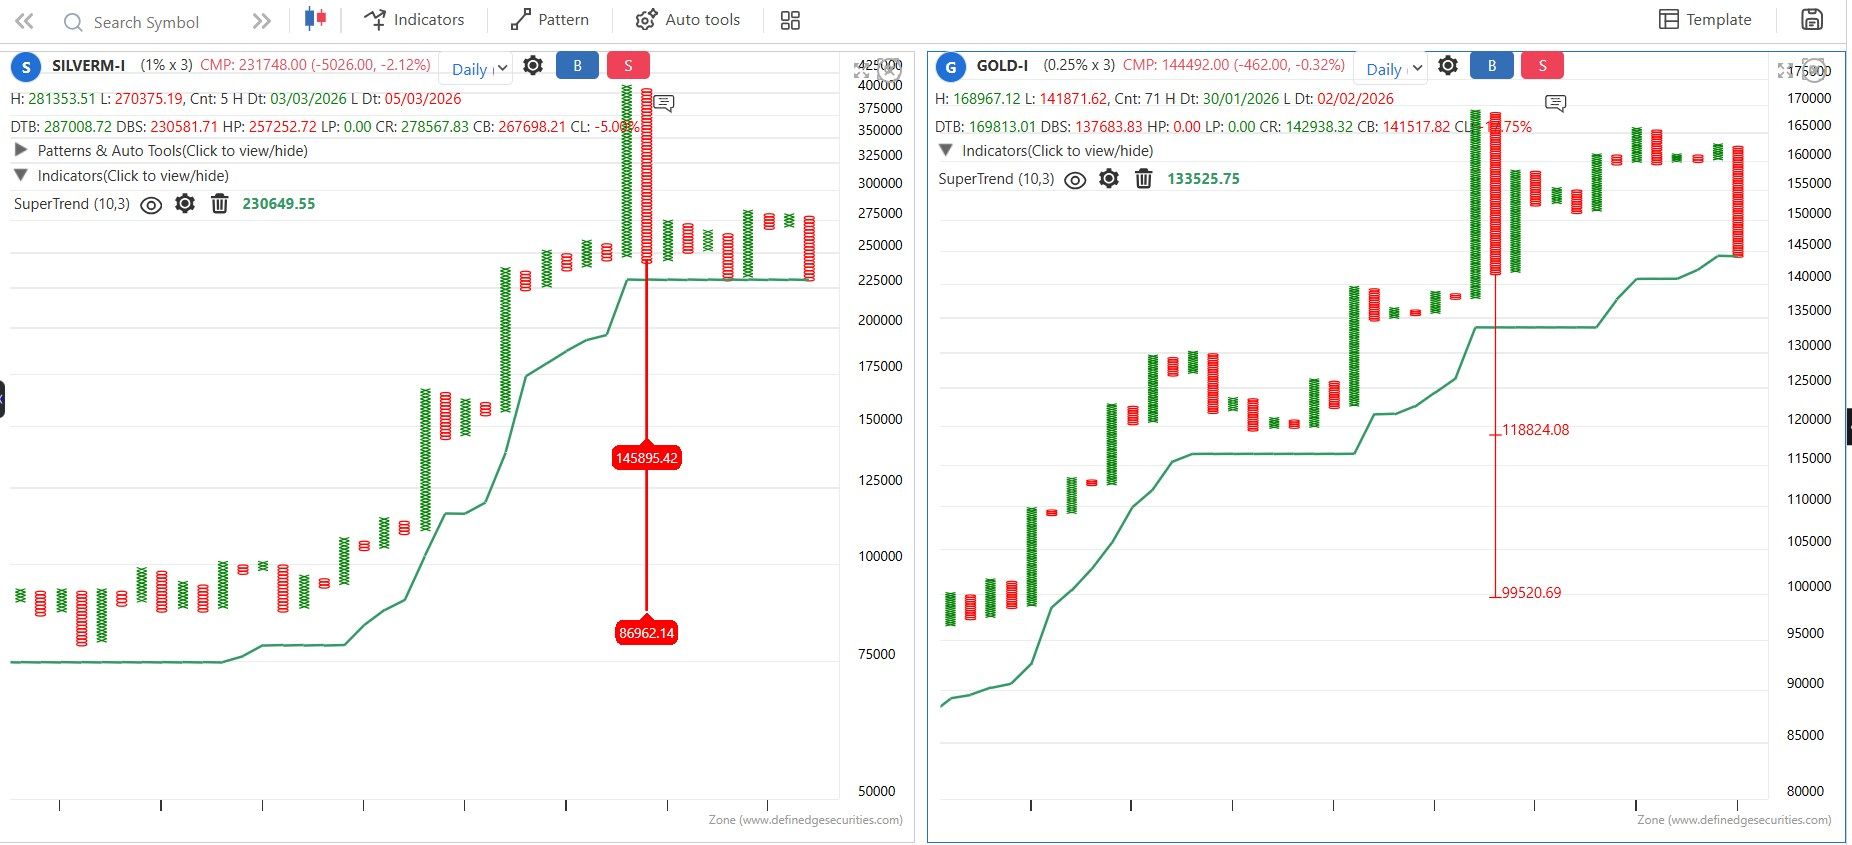
PTCIL– Momentum Setup Update (#VGM Framework)
the stock has qualified all key criteria, indicating a strong structural setup:
Bullish MAST alignment
Last two columns Low above 2 EMA (sustained strength)
Active Double Top Buy breakout structure
From a price projection perspective:
Open counts suggest ₹21,000 and ₹29,000 levels
Current price: ~₹17,400 → offers favorable risk-reward positioning
 Business Strength
The company operates across high-entry-barrier segments:
Aerospace
Defence
Oil & Gas
LNG & Cryogenic
Marine
Industrial Engineering
Strategy View
This is a structurally strong candidate with momentum confirmation.
Keep it on your active radar and execute as per your own trading system & risk framework.
Nishesh Jani,CFTe
#MomentumInvesting #VGM #StockMarketIndia #TechnicalAnalysis #BreakoutStocks #MakeInIndia #Aerospace #DefenceStocks #TrendFollowing #RiskManagement #nisheshjani #AhmedabadNest 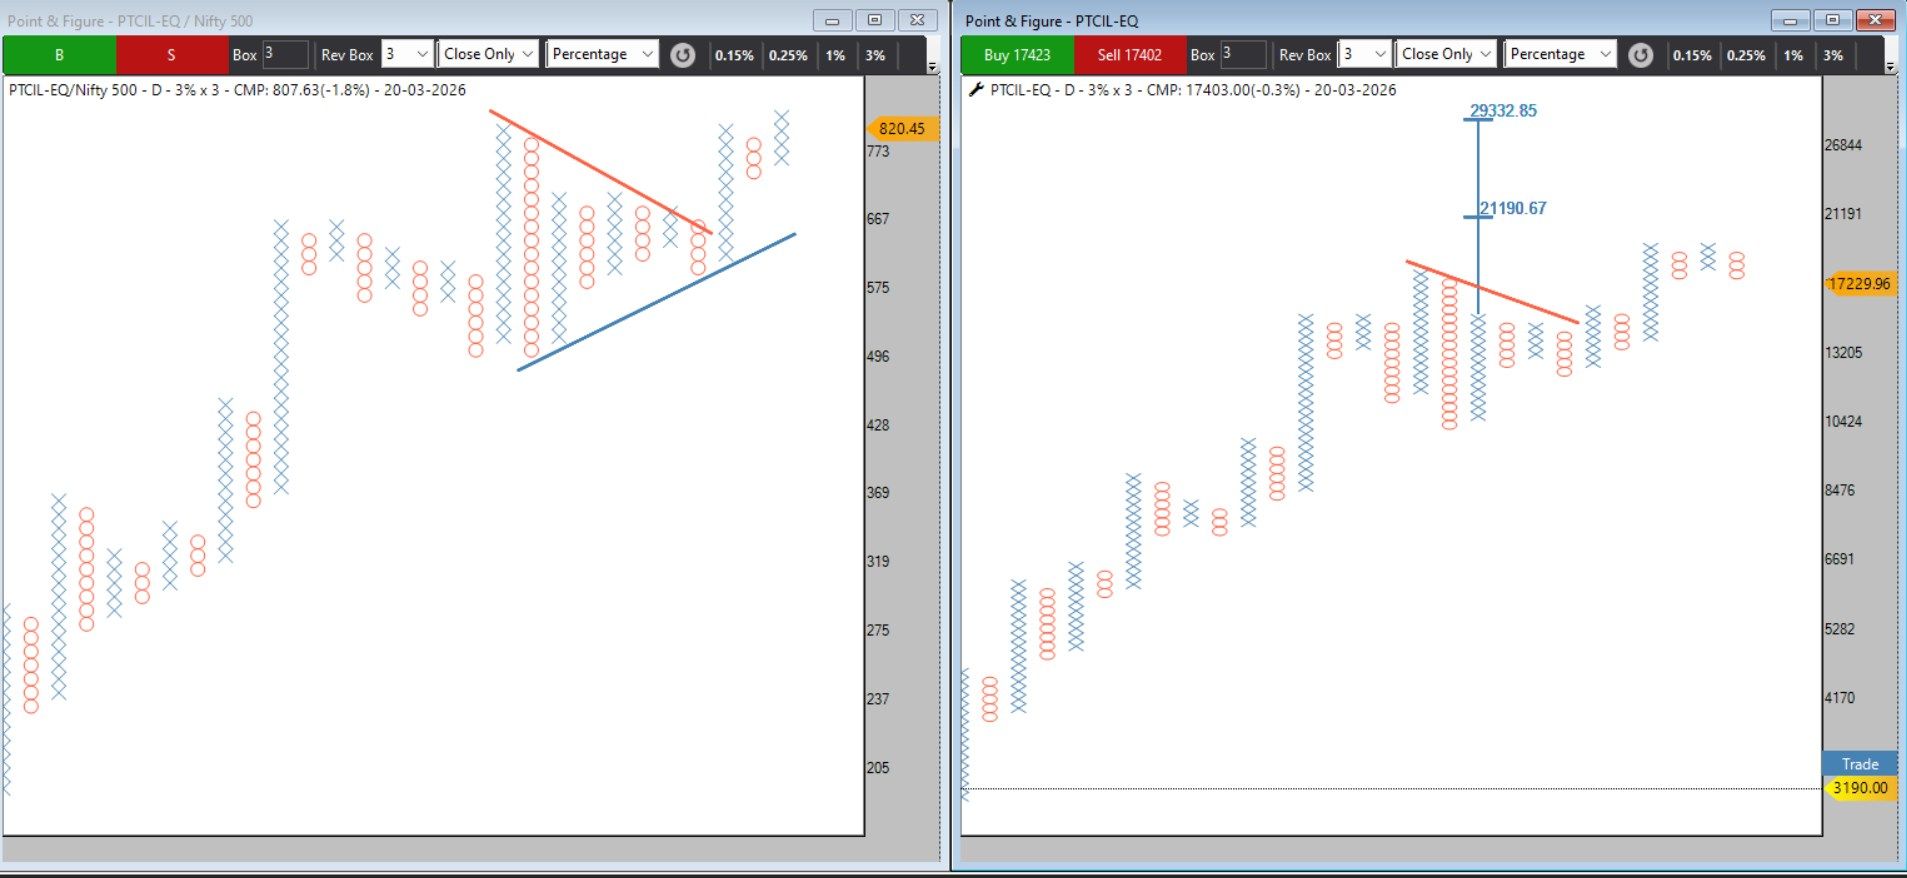
HDFC BANK – Structural Strength Case Study
Since mid-2021, has been a classic example of how a fundamentally strong stock may still fail to deliver easy momentum returns.
Structural Observation (Based on My Framework)
My model categorizes stocks into 4 phases:
Leadership → Trend → Choppy → Noise
Ideal focus: Leadership & Trend (easy money phase)
 What Happened in HDFC Bank?
Post mid-2021, the stock has largely remained in:
Choppy & Noise zones
No sustained Leadership phase
No clean Trend continuation
️ Frequent whipsaws & range-bound moves
️ Why Momentum Failed?
Continuous news flow & events disrupted structure
Volatility expansion without directional follow-through
Key Insight
Strong fundamentals ≠ Easy money
If structure is not aligned, even the best stocks can:
Consume time
Reduce capital efficiency
Test conviction
Actionable Learning
️ Focus on stocks in Leadership & Trend phase
️ Avoid Choppy & Noise for momentum strategies
️ Structure > Story > Sentiment
🧠 Final Thought
Markets reward clarity of trend, not quality of name
Nishesh Jani,CFTe
#HDFCBANK #StockMarketIndia #MomentumInvesting #TechnicalAnalysis #MarketStructure #nisheshjani #AhmedabadNest 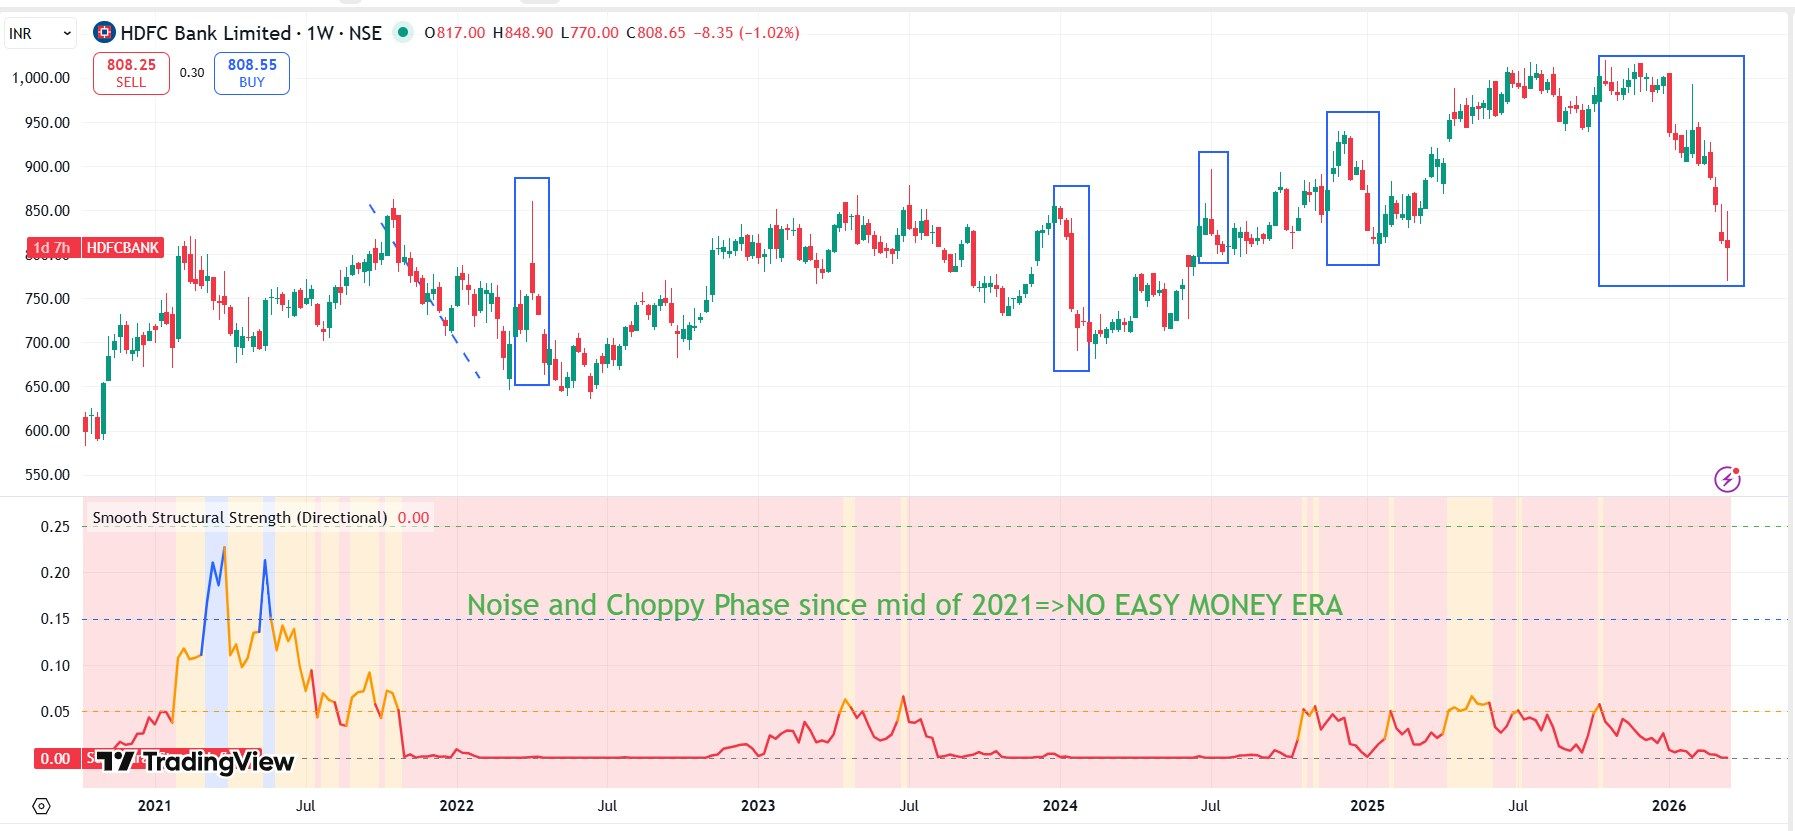
Markets rarely announce opportunity loudly.
They begin with quiet strength, often overlooked.
By the time the trend becomes obvious, participation turns aggressive.
That’s when discipline matters more than emotion.
True signals don’t wait for comfort—they demand clarity and conviction.
We continue to systematically accumulate our preferred ETFs —
ALPHA • MOMENTUM50 • MIDSMALL • MID150BEES — staying aligned with strength, structure, and relative performance.
This is not about chasing moves,
it’s about positioning early and riding quality momentum with discipline.
Process > Prediction | Discipline > Emotion
Nishesh Jani,CFTe
#MomentumInvesting #ETFStrategy #SmartBeta #StockMarketIndia #WealthCreation #SystematicInvesting #nisheshjani #AhmedabadNest
NSE Index Rebalance Update – Alpha 50
NSE has announced the latest rebalance for the Alpha 50 Index / Alpha ETF, where ~24% of the portfolio is being reshuffled.
This means:
Underperforming stocks are being removed
New high-potential, outperforming stocks are being added
What does this mean for investors?
Index rebalancing is not just a routine activity—it’s a structured process to maintain momentum and quality in the portfolio.
Systematic Profit Rotation: Capital shifts from laggards to leaders
Momentum Capture: Fresh entries typically reflect improving relative strength
Disciplined Investing: No emotional bias—pure data-driven replacement
Key Insight
Alpha-based indices are designed to stay aligned with performance leadership, not just market size.
This is exactly why such indices tend to outperform traditional benchmarks over time—they continuously evolve.
Investor Takeaway
Rebalancing = Opportunity Reset
New entrants = Stocks to track for momentum setups
Removed stocks = Signals of weakening trend
Stay aligned with strength, not attachment.
Nishesh Jani,CFTe
#NSE #IndexRebalance #Alpha50 #SmartBeta #MomentumInvesting #ETFIndia #StockMarketIndia #WealthCreation #nisheshjani #AhmedabadNest 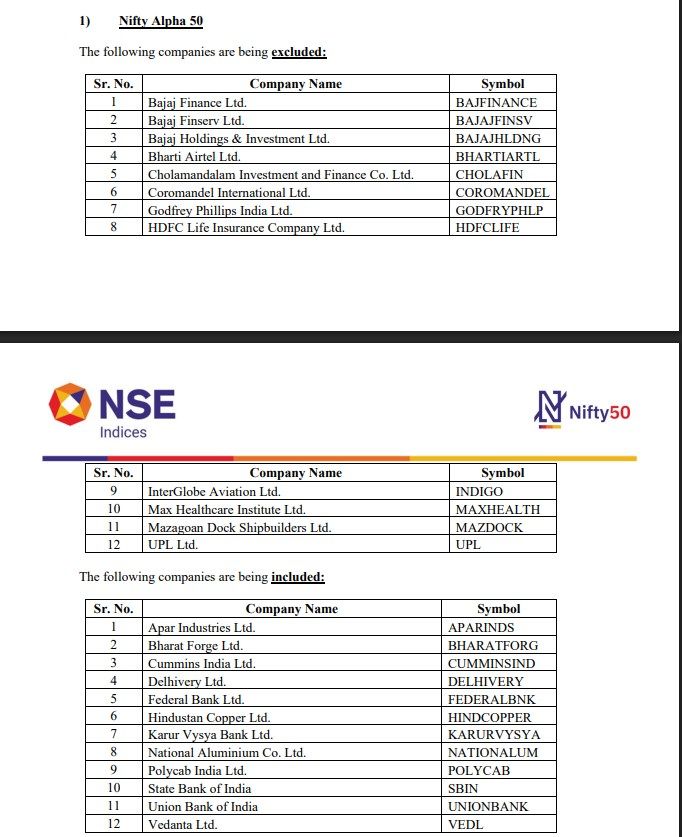

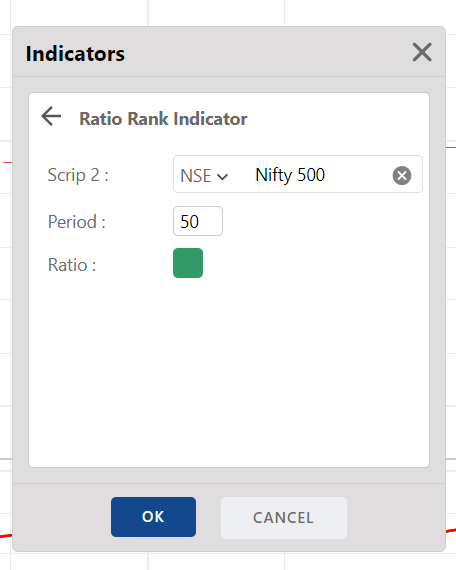
please add this bith scanner in scanner conditions of Ratio lets say i woild to scan any study with abv below zero RS in one click currently i have to run it differently two scanner -example i need weekly RSI > 60 and 60 week RS above zero then i need to run both seperetaly
Nifty 500 (Broad Market) – Long-Term RSI Perspective
Nifty 500 (Broad Market) – Long-Term RSI Perspective
The Nifty 500 Index, representing nearly 96% of India’s total market capitalization, offers one of the clearest pictures of overall market sentiment.
A study of the weekly RSI over the past two decades reveals an important pattern:
 Historical Observation
Since 2001, the weekly RSI has fallen below 30 only three times:
2001–2002: Dot-com aftermath
2008–2009: Global Financial Crisis
2020: COVID crash
Each of these instances coincided with major long-term market bottoms.
Normal Market Corrections
Outside of extreme crises, whenever the weekly RSI approaches the 30 zone, markets tend to form intermediate bottoms and stage strong recoveries.
️ What This Means for Investors
Periods when RSI approaches or dips near oversold territory historically coincide with maximum pessimism.
These phases often feel like the worst time emotionally, but statistically they have been among the best opportunities to accumulate long-term positions.
Key Insight
Markets typically bottom on fear and uncertainty, not on comfort or consensus.
Historically, oversold RSI zones in the broad market have marked phases of opportunity rather than panic exits.
For long-term investors and portfolio allocators, such periods should be viewed through the lens of strategic accumulation rather than emotional reaction.
Nishesh Jani,CFTe
#Nifty500 #StockMarketIndia #MarketCycle #TechnicalAnalysis #RSI #MarketBottom #Investing #StockMarket #LongTermInvesting #MarketInsights #nisheshjani #AhmedabadNest 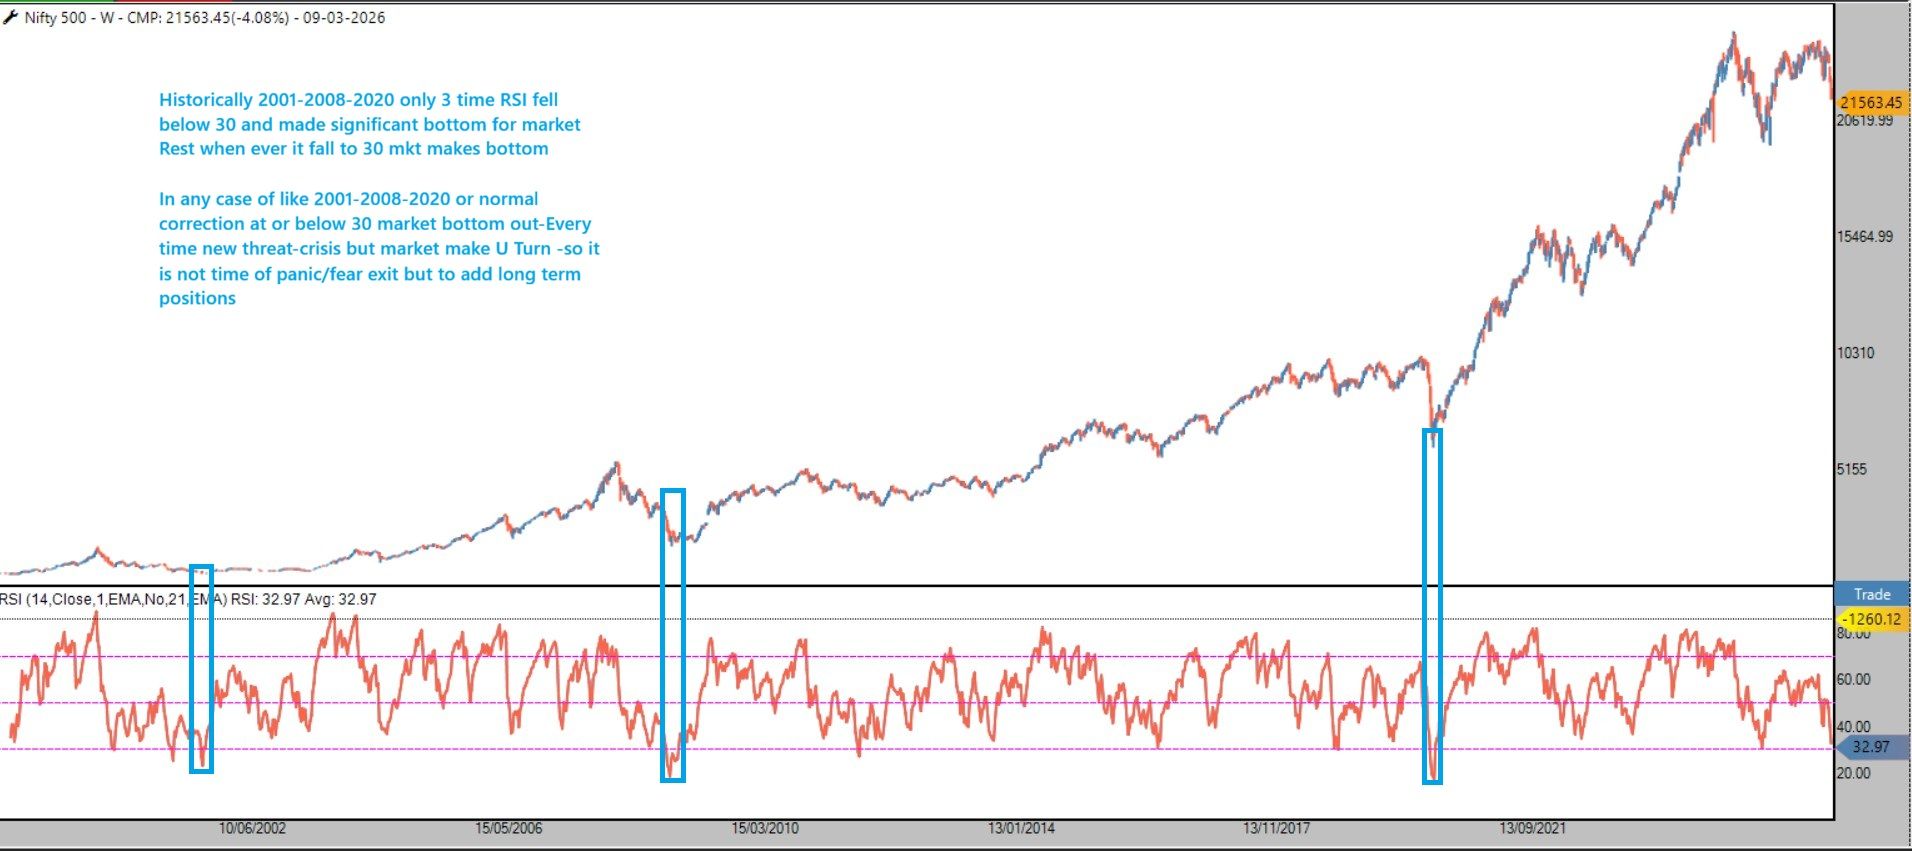
Market Mood Index hits Extreme Fear — Historically a Bottoming Zone
Market Mood Index hits Extreme Fear — Historically a Bottoming Zone
(MMI) tracks 6 key factors to capture the collective emotions driving Indian markets:
1️⃣ FII Activity – Gauges directional stance of foreign institutions via Index Futures positioning
2️⃣ Volatility & Skew – Measures risk expectations and downside probability via VIX & IV skew
3️⃣ Momentum – 90D vs 30D trend strength of Nifty 50
4️⃣ Market Breadth – Modified Arms Index showing participation & volume confirmation
5️⃣ Price Strength – % of stocks near 52W highs minus % near 52W lows
6️⃣ Demand for Gold – Relative performance of Gold vs Nifty (flight to safety)
🟣 Current Situation:
MMI has slipped into EXTREME FEAR territory.
Historical Behavior:
Every previous dip into the extreme fear zone has aligned with market bottoms and led to positive forward returns as sentiment mean-reverted from fear → neutrality → optimism.
Why this matters:
Extreme pessimism often marks an exhaustion zone where selling pressure fades and value buyers emerge.
Takeaway for Investors & Traders:
Fear-driven markets tend to create opportunities, not warnings — but timing & risk management remain essential.
Sentiment drives short-term moves. Fundamentals drive long-term outcomes.
Nishesh Jani,CFTe
#MarketMoodIndex #ExtremeFear #ContrarianSignals #Nifty50 #FIIData #VIX #MarketSentiment #IndiaMarkets #StockMarketIndia #Investing #Trading #MarketBottom #GoldVsEquity #nsiheshjani #AhmedabadNest 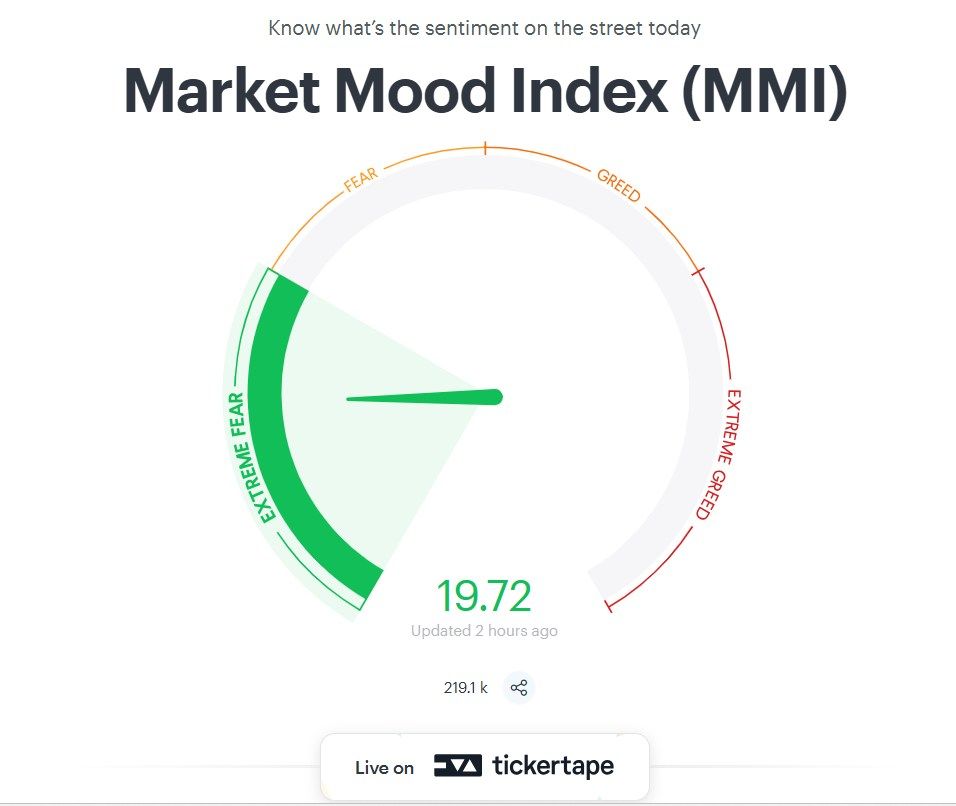
️
When Memes Enter the Market… History Says the Bottom May Be Near ️
In every major market correction, there is a fascinating behavioral pattern that repeats itself.
At the peak of panic, when volatility is high and sentiment is extremely negative, something unusual starts appearing across social media, WhatsApp groups, and trading communities:
️ Memes about stock market losses
️ Jokes about portfolios being destroyed
️ Friends & family suddenly discussing market crashes
While it may look like casual humor, behavioral finance tells us this is often a late-stage sentiment signal.
Why This Matters
Markets usually bottom not when fear begins but when fear becomes normalized and even humorous.
When investors start joking about their losses, it often reflects:
• Capitulation phase of sentiment
• Maximum pessimism in retail psychology
• Emotional exhaustion among investors
Historically, many market bottoms have formed around the time when despair turns into sarcasm and memes.
Add the Seasonality Factor
March has historically been a period of:
• High volatility
• Institutional repositioning
• Tax-related flows and portfolio adjustments
• Short-term panic phases before stabilization
This combination of extreme sentiment + seasonal volatility often creates bottoming environments rather than long-term tops.
A Simple Behavioral Indicator
If you start seeing:
Market crash memes everywhere
Friends suddenly asking about “Is market finished?”
Portfolio jokes flooding WhatsApp groups
It may not mean the market is collapsing.
It may actually mean the market is close to exhausting the sellers.
As legendary investors often emphasize:
Markets bottom on pessimism, not optimism.
Smart investors observe sentiment, behavior, and positioning — not just price.
Nishesh Jani,CFTe
#StockMarket
#BehavioralFinance
#MarketPsychology
#MarketSentiment
#InvestingWisely
#Volatility
#MarketCycles
#LongTermInvesting
#nisheshjani
#AhmedabadNest
When Time Corrections Are Tedious, Price Corrections Become Brutal
Markets periodically enter phases where price corrects far faster than time.
With India VIX above 20 and ATR expanding beyond 5, volatility spikes and panic spreads across the board.
Historically, such environments feel extremely uncomfortable — but they rarely last long. In fact, they often create the most attractive entry points for disciplined investors.
One additional signal we closely track is our proprietary Market Breadth Indicator.
Based on current readings and trajectory, it is likely to fall below the 100 zone in the coming week.
Historically, whenever this breadth measure has approached or moved below this level, it has shown very high accuracy in identifying market bottoms or near-bottom zones.
As Warren Buffett famously said:
"Be fearful when others are greedy and greedy when others are fearful."
The current phase resembles those rare moments when extreme pessimism creates exceptional opportunity.
Rather than reacting emotionally to volatility, we are systematically accumulating our preferred ETFs, focusing on diversified factor and market exposure:
• ALPHA
• Momentum 50
• MIDSMALL
• MID150BEES
Corrections like these reset valuations, flush out leverage, and prepare the ground for the next wealth-creation cycle.
The irony of investing is simple:
The best opportunities rarely appear when markets feel comfortable.
They appear when fear dominates the narrative.
And historically, those who stay disciplined during the bloodbath are the ones who benefit the most when stability returns.
Nishesh Jani,CFTe
#MarketVolatility #MarketBreadth #BuyWhenFearful #ETFInvesting #SmartInvesting #MarketCorrections #Nifty #StockMarketIndia #WealthCreation #InvestWithDiscipline #nsiheshjani #AhmedabadNest
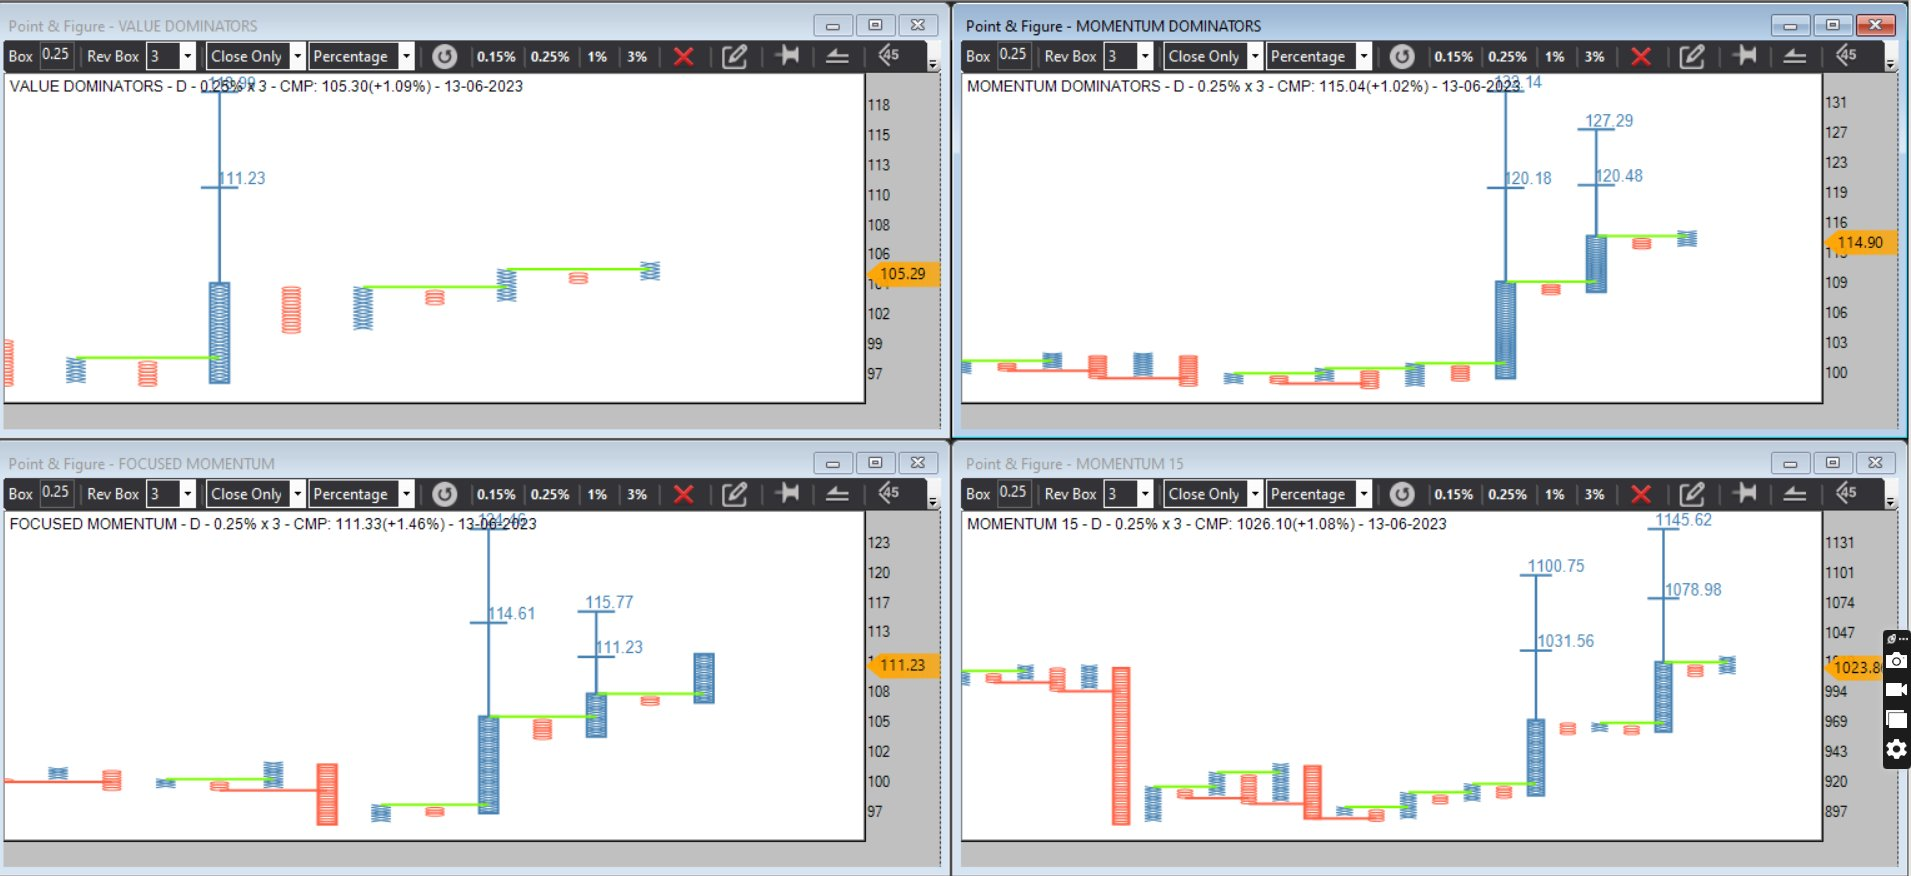
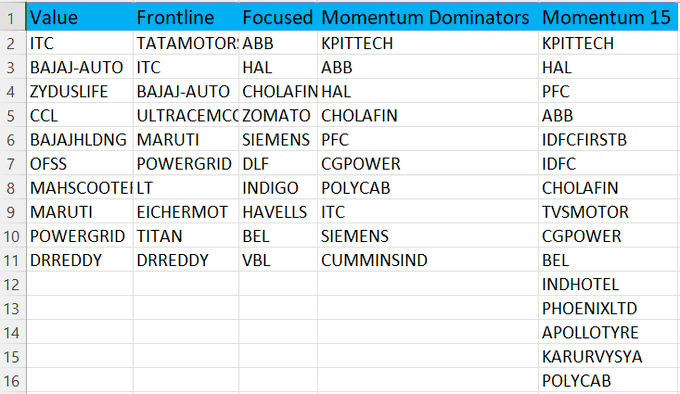
#VGM Framework – Live Portfolio Snapshot
This run on long trem RS on 3% so entry exit take times-let open position to run till exit we dont know how much profit they give but we have kept max SL 20% from entry levels-at definedge still we dont have RS based backtesting facility they are working on it but my observations is that this system generates alpha over 25 % over any good divercified MF so i cant say what is exat CAGR & DD
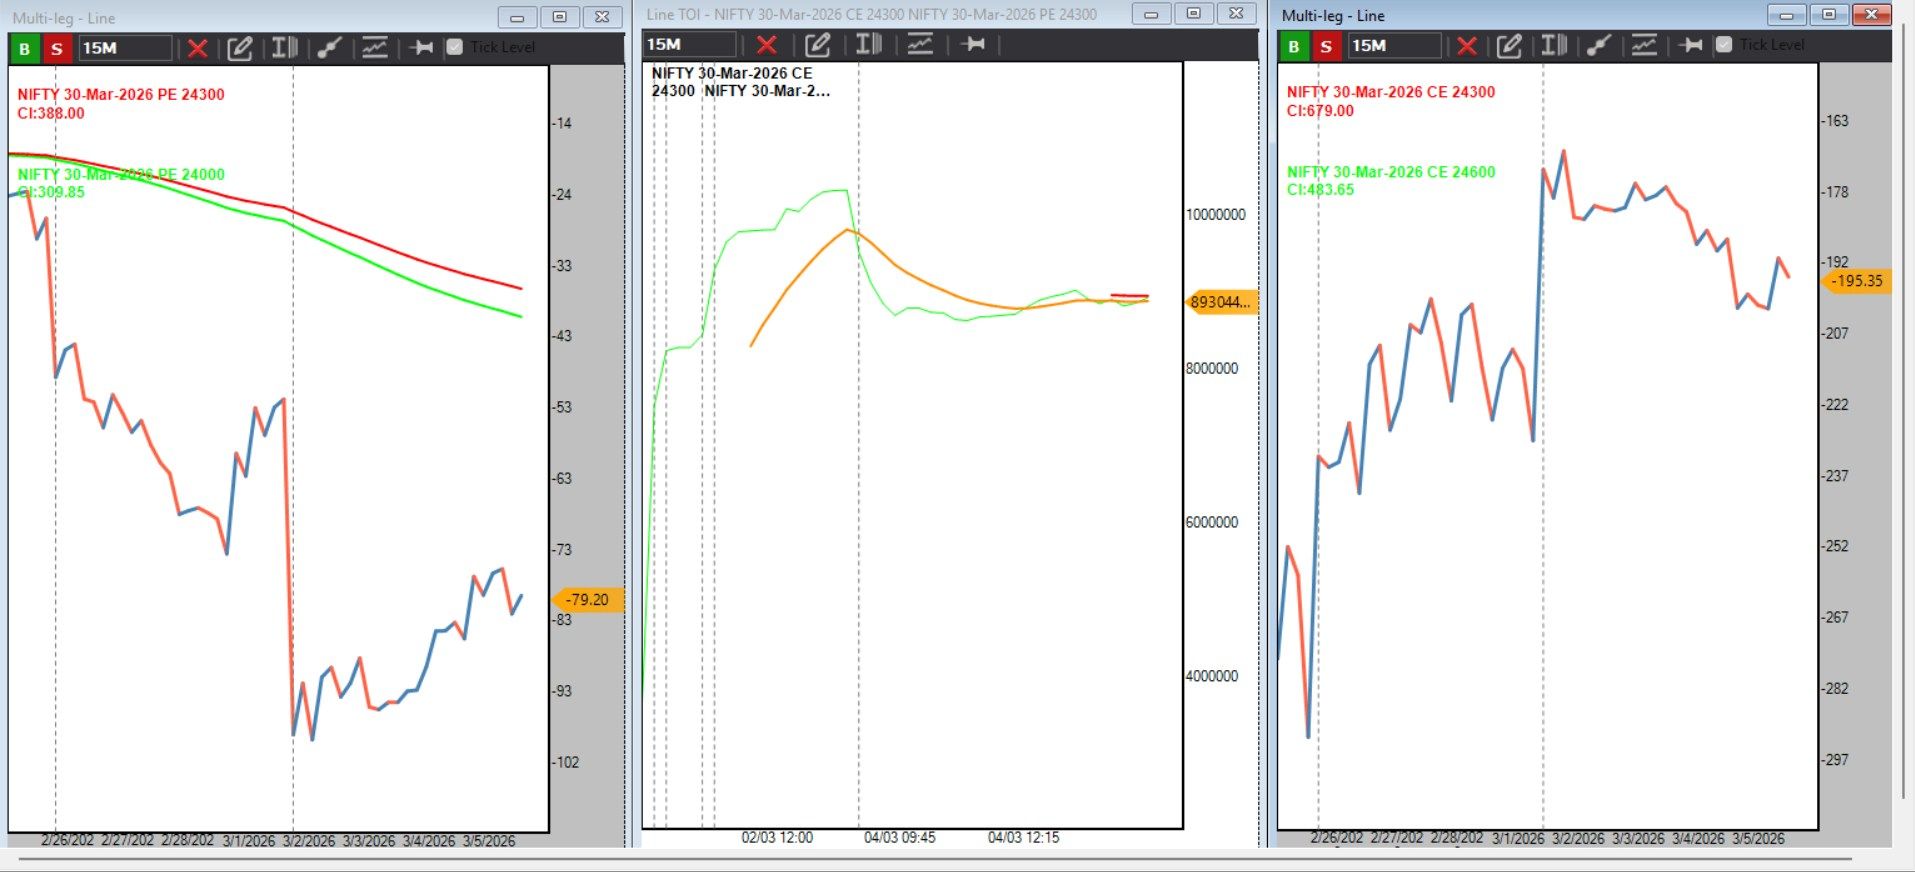
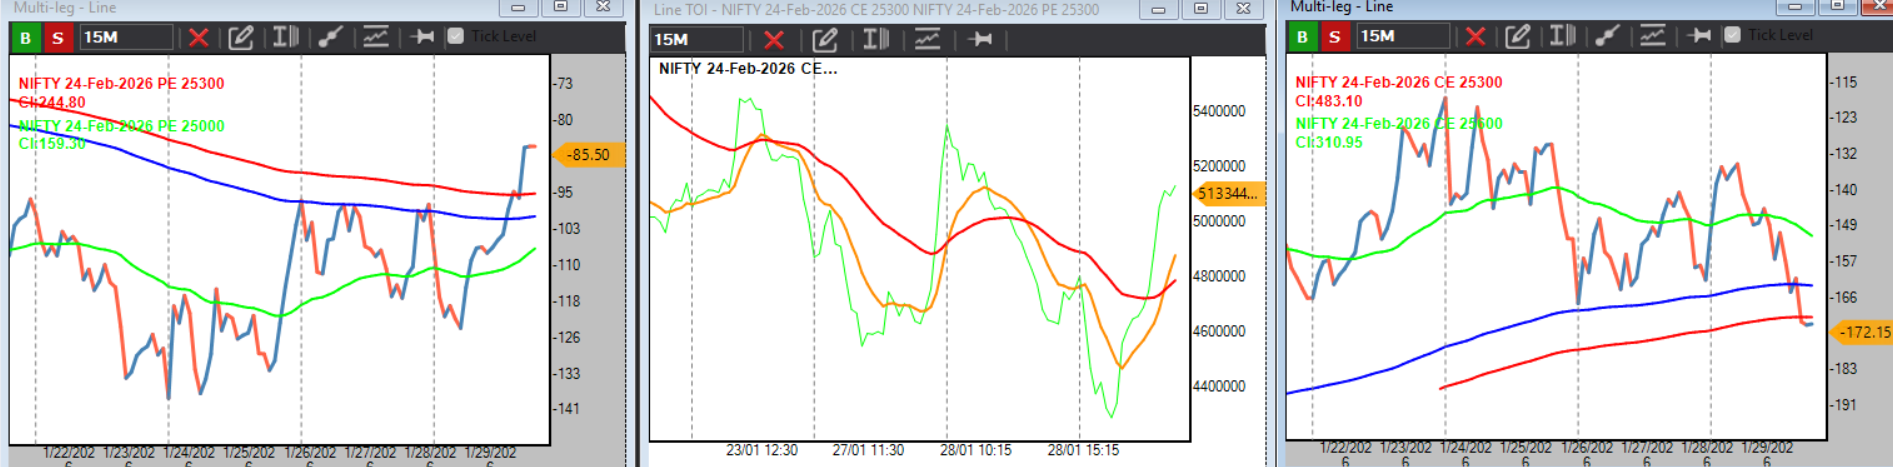
Key Observation from the Total Open Interest (TOI) Framework
One recurring pattern we have observed using the Total Open Interest (TOI) indicator — developed at Definedge with AP Sir — is related to data sufficiency for EMA calculations.
Observation:
Whenever TOI does not have sufficient data from the last 5 trading sessions, the system is unable to plot the 10-day & 30-day EMA and their respective spread.
️ What happens next?
Historically, such situations often occur near market exhaustion points, where the ongoing trend struggles to sustain momentum.
In several instances, this has been followed by:
• Market halting the current move
• Loss of directional strength
• Potential reversal or sharp mean reversion
Current Context
In yesterday’s data:
• TOI → Unable to plot its EMA
• CE Spread → Also unable to plot its EMA
This rare data condition is worth monitoring closely as it may signal a possible turning point in market direction.
Keeping fingers crossed for a reversal setup.
Nishesh Jani,CFTe
#OptionsData
#OpenInterestAnalysis
#MarketStructure
#Definedge
#DerivativesTrading
#Nifty
#InstitutionalData
#TradingInsights
#nsiheshjani #AhmedabadNest
@ap_pune
#VGM Framework – Live Portfolio Snapshot
#VGM Framework – Live Portfolio Snapshot
Sharing a transparent view of current Open Positions and recently Closed Positions generated through our #VGM (Volume–Growth–Momentum) framework.
This framework was originally presented at the E-Decnoch 2021 online conference by Definedge and continues to guide our systematic stock selection process.
🟢 Open Positions
Current open positions reflect stocks that continue to respect the bullish market structure within the VGM framework.
Some notable trends visible in the list:
• Strong leadership from Defence & Capital Goods
• Banks and Financials participating selectively
• Stocks like Acutaas Chemical, Karur Vysya Bank, MTAR Tech, GE Vernova T&D showing structural strength
These positions remain open because the trend structure defined by VGM is still intact.
 Closed Positions
Closed positions are not failures — they are disciplined exits.
In a rule-based system:
Positions are closed when structure weakens
Capital is recycled into stronger setups
Names like Affle, Dixon, Amber, Deepak Fertilisers, Bharti Hexacom were exited when VGM conditions were violated.
This is the core strength of systematic trading:
Let winners run
Cut weak structures early
 Collaborative Learning
We also run a dedicated #VGM Telegram community where investors and traders:
• Post setups
• Discuss market structure
• Solve doubts directly with me
Additionally, all VGM scanners and open conditions are published on RZONE so anyone can study and replicate the framework.
Markets reward process, not predictions.
Nishesh jani,CFTe
#VGM
#RuleBasedTrading
#MomentumInvesting
#ProcessOverPrediction
#IndianStockMarket
#SystematicTrading
#nisheshjani
#AhmedabadNest 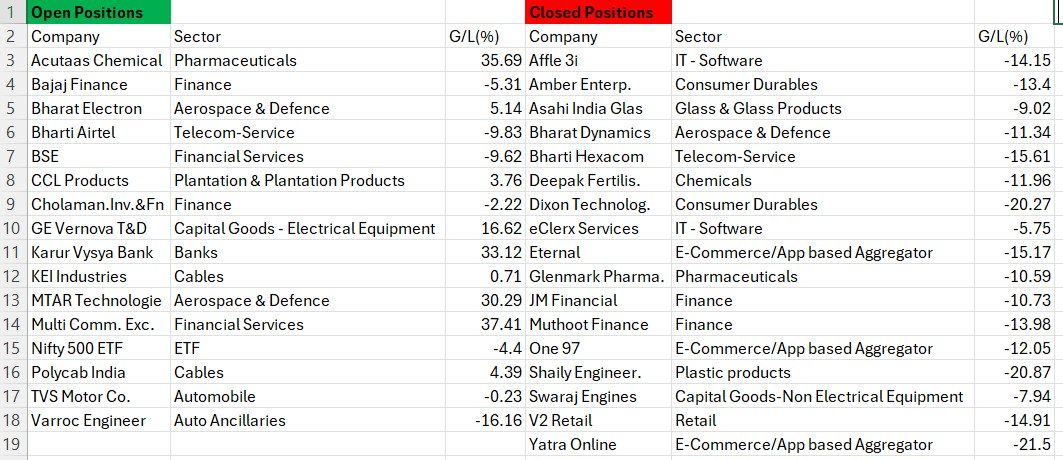
@Definedge
Sun Pharma – VGM RS Setup Alert
operates in high-value specialty drugs (dermatology, oncology, ophthalmology) along with branded generics, APIs, and OTC healthcare products.
From a VGM Relative Strength framework perspective:
• Positive Column Reversal confirming strength
• Green Bullish MAST intact
• Last two column lows above EMA
• Structure forming Higher Top – Higher Bottom
• No immediate Double Bottom Sell signal
Trade Framework
• PCR Entry triggered → 50% allocation
• Remaining allocation on Double Top Buy
• Risk Control: Stop loss at Double Bottom Sell on RS chart
A stock showing strong relative strength leadership — traders and investors can keep it on the radar to execute their own systems.
Nishesh Jani,CFTe
#StockMarketIndia #RelativeStrength #MomentumTrading #SunPharma #TradingSetup #VGM #nisheshjani #AhmedabadNest 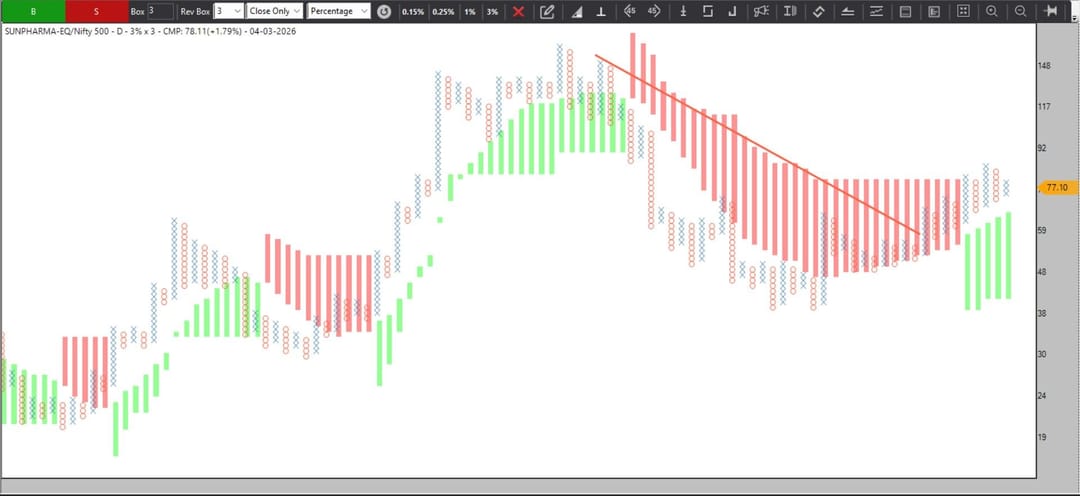
Conflict Creates Fear. Fear Creates Discount. Discount Creates Opportunity.
Every major geopolitical event in history has triggered sharp declines.
But history also shows — those declines eventually turned into powerful long-term buying opportunities.
Even if headlines remain uncertain, cycles eventually shift.
“occult science suggests a ceasefire may emerge soon.”
Whether through diplomacy, policy shifts, or time itself — tension does not stay permanent.
We are not reacting emotionally.
We are accumulating systematically.
Current Strategy: Gradual accumulation in our 4 high-conviction ETFs:
• Alpha
• Momentum50
• MIDSMALL
• MID150BEES
We don’t predict headlines.
We position for probabilities.
Volatility is uncomfortable — but it is also the raw material of long-term wealth.
Stay disciplined. Stay invested. Stay strategic.
Nishesh Jani,CFTe
#MarketVolatility #ETFStrategy #LongTermWealth #SystematicInvesting #WealthBuilding #nisheshjani #AhmedabadNest
Nifty 500:
18 months of consolidation continues. Now approaching the 50% Fibonacci retracement + major gap support zone (22,000–21,500).
With geopolitical tensions rising, VIX > 20, and ATR ~5%, the probability of a final panic flushout is increasing — something we had highlighted during our Diwali contrarian breadth analysis.
But remember: sudden geopolitical de-escalation can quickly normalize sentiment.
Historically, March has been a panic → bottoming phase for Indian markets.
We are very close to activating our “Horny Bull Market” setup — a phase that could trigger Indian market outperformance.
Stay prepared. Not fearful.
Nishesh Jani,CFTe
#Nifty500 #IndianMarkets #StockMarket #MarketOutlook #Volatility #nisheshjani #AhmedabadNest 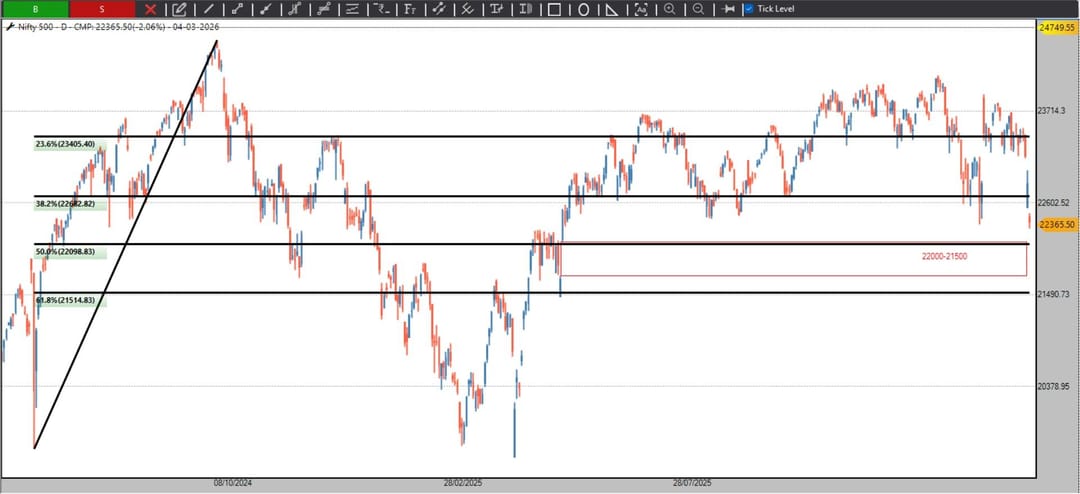
Polycab – Relative Strength Leadership Emerging
operates across three strong verticals:
• Wires & Cables
• Consumer Electrical Products (Fans, Lighting, Switches, etc.)
• Turnkey Power & Infrastructure Solutions
Under our Relative Strength #VGM concept, the stock has qualified with full rule compliance:
Bullish MAST Structure
Last two column lows above EMA
Positive Column Reversal
Double Top Buy Trigger
Multi-Timeframe Alignment:
Long Term (3% P&F Chart)
– Structural strength intact
– Probable long-term price projections activated
Medium Term (1% Box Size)
– Momentum continuation
– Structured trailing stop mechanism
Short Term (0.25% Box Size)
– Tactical trend alignment
– Dynamic trailing SL for active traders
The stock is displaying relative outperformance and momentum persistence, fitting both positional and swing frameworks.
Investors and traders may keep it on radar and align entries/exits as per their own risk management system.
Nishesh Jani,CFTe
#RelativeStrength
#VGM #polycab
#PointAndFigure
#MomentumInvesting
#TrendFollowing
#BreakoutStocks
#TechnicalAnalysis
#StockMarketIndia
#SwingTrading
#nisheshjani #AhmedabadNest 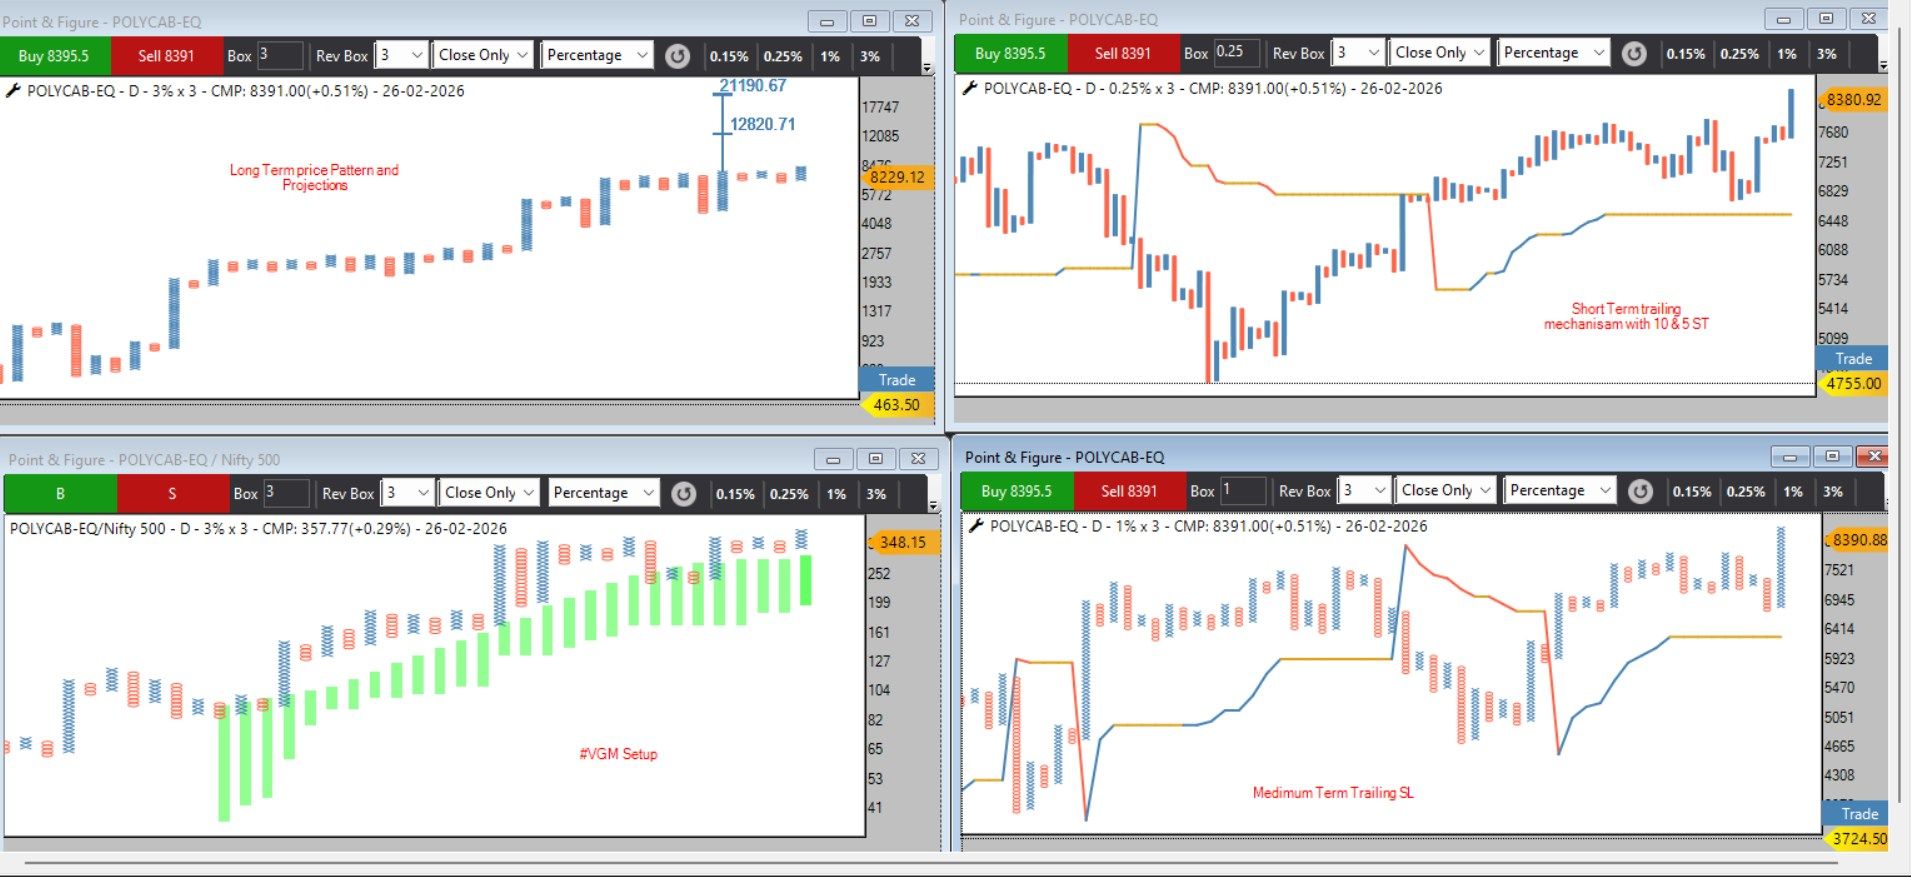
KEI Industries – Relative Strength Breakout on #VGM Framework
KEI’s revenue streams are driven by:
• Cables & Wires Manufacturing
• EPC Projects
• Stainless Steel Wire
On our Relative Strength #VGM concept, the stock has triggered:
Positive Column Reversal
Double Top Buy
Bullish MAST Structure
Last two column lows well above MA
No immediate Double Bottom Sell
Multi-Timeframe View:
Long Term (3% P&F Chart)
– Structural breakout intact
– Higher column formation
– Probable projection targets activated
Medium Term (1% Chart)
– Momentum continuation pattern
– Trailing SL as per column reversal
Short Term (0.25% Chart)
– Tactical entry alignment
– Tight trailing stop structure
Stock is showing relative outperformance vs broader market peers and fits momentum + trend continuation criteria.
Investors & traders may keep this counter on radar and align with their own risk management system.
Nishesh jani,CFTe
#RelativeStrength
#PointAndFigure
#MomentumInvesting
#StockMarketIndia
#BreakoutStocks
#TrendFollowing
#TechnicalAnalysis
#SwingTrading
#InvestSmart
#nisheshjani
#AhmedabadNest 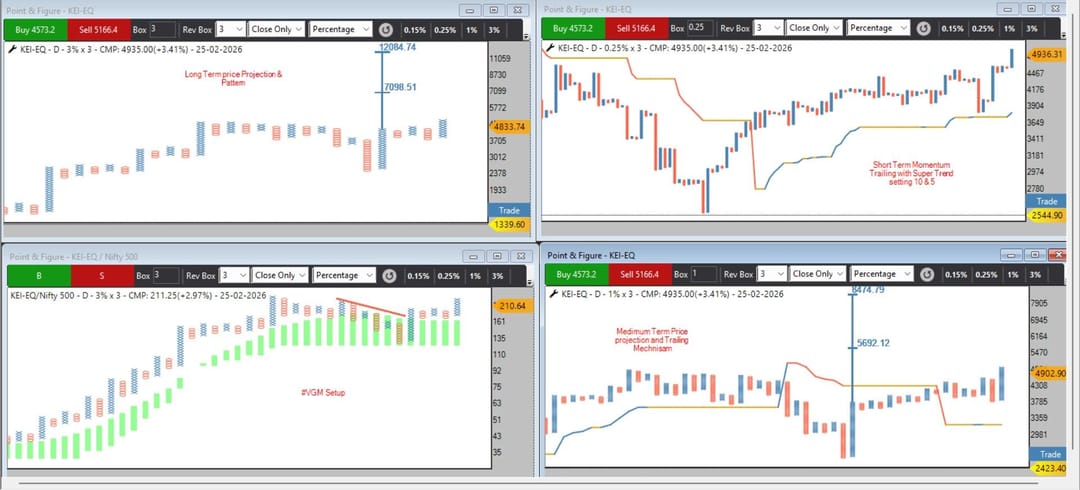
️
NIFTY IT – Structural Breakdown on Renko ️
Nifty IT has triggered a clear Head & Shoulder breakdown on the Renko chart around 31,000.
Downside Levels to Watch:
• 27,000 – First major corrective zone
• 24,600 – Extended support if momentum accelerates
Broader Technical Picture:
Majority IT stocks trading below 200 EMA
Monthly DMI in bearish trend mode
Monthly RSI below 50 → Indicates structural weakness
This suggests the correction could be deeper and time-wise extended, not a one-way fall.
Expect intermittent pullbacks toward resistance, but probability favors lower lows unless structure reclaims strength.
Strategy Focus:
Trade with trend. Avoid aggressive bottom fishing until reversal signals emerge.
Nishesh Jani,CFTe
#NiftyIT #StockMarketIndia #TechnicalAnalysis #Renko #SectorRotation #MarketOutlook 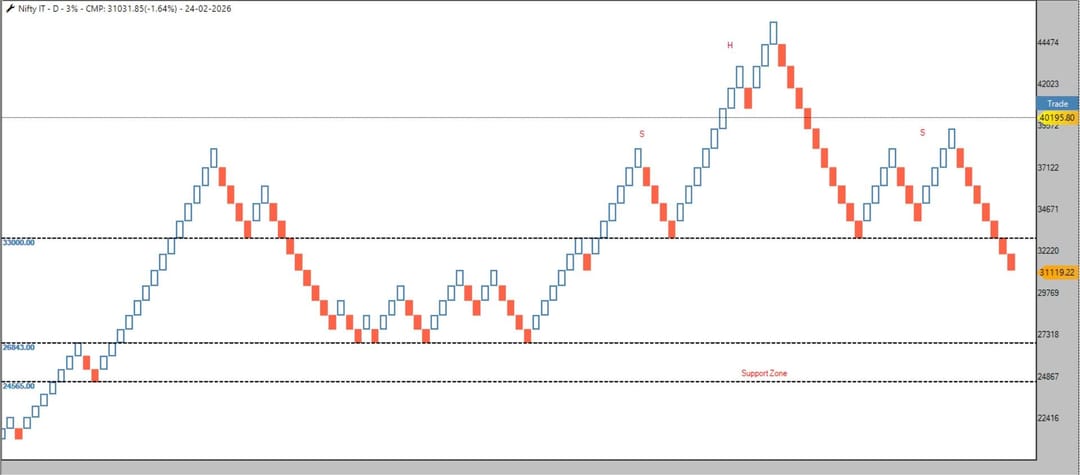
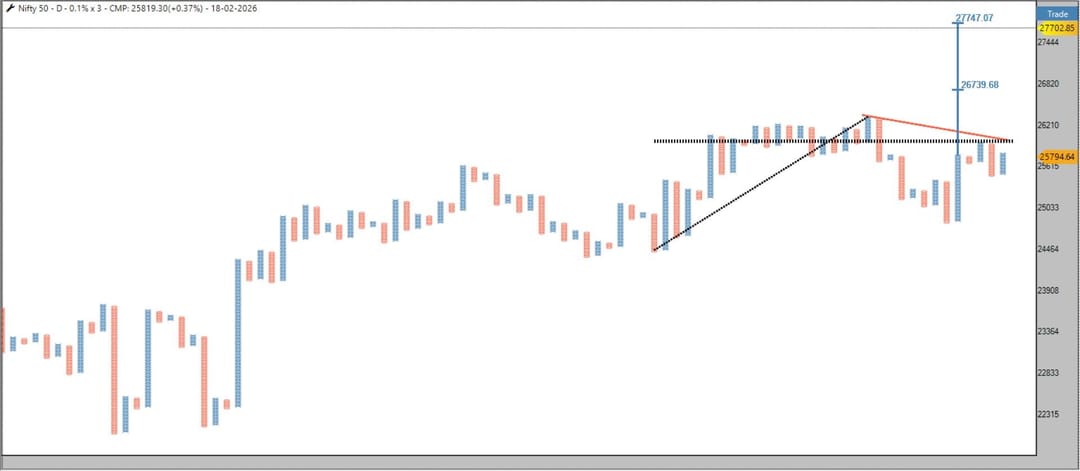
NIFTY P&F Insight | Anchor Points in Focus
NIFTY – Dhamaka Move Loading? 5% Rally Setup in Play!
Nifty is quietly setting up for a potential explosive breakout.
Here’s what the structure is saying 
Active Double Broadening Pattern
Perfect reversal from Anchor Points
Respecting the same value zone of the Bearish 45° Trendline
Energy compression just below a key psychological level
Trigger Level: 26,000 (Closing Basis)
Once Nifty sustains above 26,000, the structure opens room for a potential 5% rally towards 27,700.
This isn’t hope.
This is geometry + structure + level confirmation.
Markets reward preparation, not prediction.
Watch the close.
Respect the trigger.
Let price confirm.
If 26,000 breaks with strength — it could turn into a momentum expansion phase.
Are you positioned… or still watching? 
Nishesh Jani,CFTe
#Nifty #BreakoutAlert #TechnicalAnalysis #MomentumTrading #DhamakaTrade #StockMarketIndia #nisheshjani #AhmedabadNest
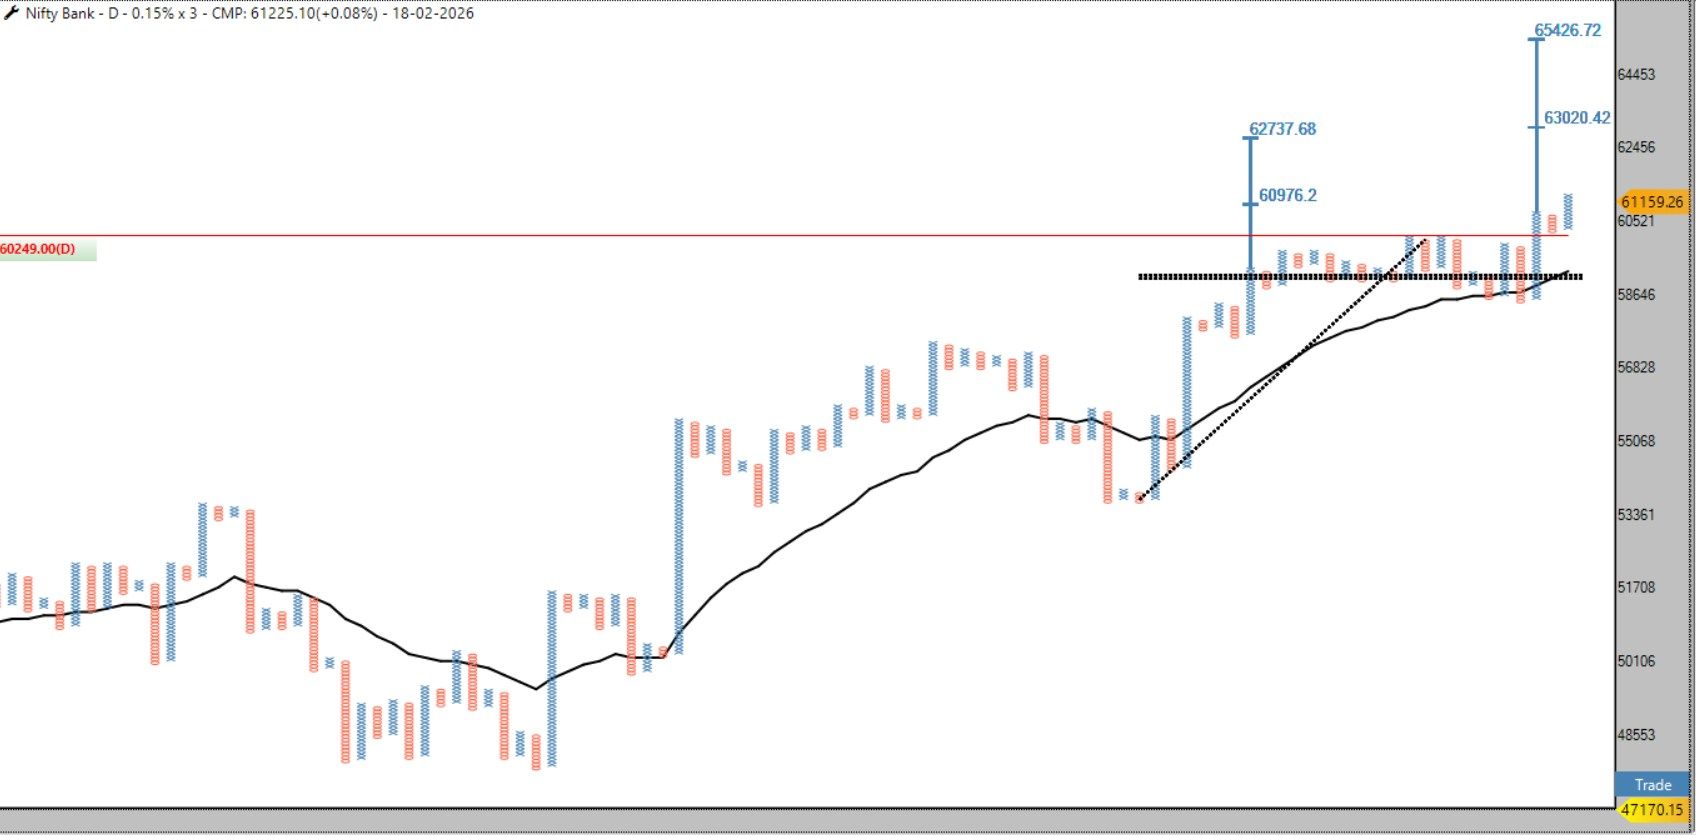
BANK NIFTY – Structure is Speaking Loud & Clear
Trend Check
• Trading ABOVE EMA → Bullish Structure
• Holding Above Anchor Point → Strong Control
• Double Broadening Pattern → Volatility Expansion Phase
Now we are witnessing affordable breakouts — smart money accumulation zones.
My Trading View:
As long as 60159 holds on a closing basis, I remain structurally bullish.
Upside Open Counts:
62737
63020
This is not prediction.
This is price structure + pattern logic + level discipline.
️ Risk is defined.
Structure is supportive.
Momentum building.
Remember:
Big moves start when most traders hesitate.
Are you trading noise… or structure?
Nishesh Jani,CFTe
#BankNifty #PriceAction #MomentumTrading #TechnicalAnalysis #MarketStructure #IndianMarkets #NiftyTrader #nsiheshjani #AhmedabadNest
If you value structured market thinking, stay http://connected.do like share-re tweet for wider reach
🟡 Gold & Silver at a Breaking Point
The correction is no longer “healthy.”
Retracements are expanding.
The volatility squeeze looks done.
Now comes the real test.
Gold – Eye on the recent low near $4,400
Silver – Critical support around $64
Structure suggests a high probability retest…
And if those levels crack?
Expect acceleration.
Expect liquidation.
Expect momentum to flip hard.
This isn’t about bias.
It’s about respecting price structure.
When squeeze fails, moves don’t whisper —
They explode.
Stay tactical. Stay sized right.
Nishesh Jani,CFTe
#Gold #Silver #Commodities #MarketStructure #TechnicalAnalysis #Momentum #nisheshjani #AhmedabadNest
Muthoot Finance | #VGM Setup Update
part of the cycle-always keep 25 stock equal weightage portfolio -system will give entry/exit
Muthoot Finance | #VGM Setup Update
Muthoot Finance | #VGM Setup Update
On our #VGM setup, Muthoot Finance has fulfilled all key selection criteria:
RS: Bullish
MAST: Bullish
P&F Structure: Last two column lows above EMA
Current Signal: Positive Column Reversal
Allocation Strategy:
50% allocation triggered on PCR
 Remaining 50% on Double Top Buy
 ️ Risk Management: Double Bottom Sell as exit
On price charts, the stock has already achieved its first conservative target near 3600. With trend structure intact, it is now opening higher P&F counts, projecting long-term potential towards 8000, subject to trend continuation.
 Business Snapshot
Muthoot Finance is India’s largest gold-loan focused NBFC, with a strong presence across rural and semi-urban markets. Its core business is secured lending against gold, complemented by microfinance, housing finance, personal & business loans, insurance and wealth product distribution, making it a steady compounder backed by collateral strength.
Traders and long-term investors can keep the stock on their radar and act as per their own system and risk profile.
Nishesh Jani,CFTe
#VGM #RelativeStrength #PointAndFigure #TrendFollowing #RiskManagement #NBFC #GoldLoans #StockMarketIndia #TradingSetup #InvestorMindset #nisheshjani #AhmedabadNest 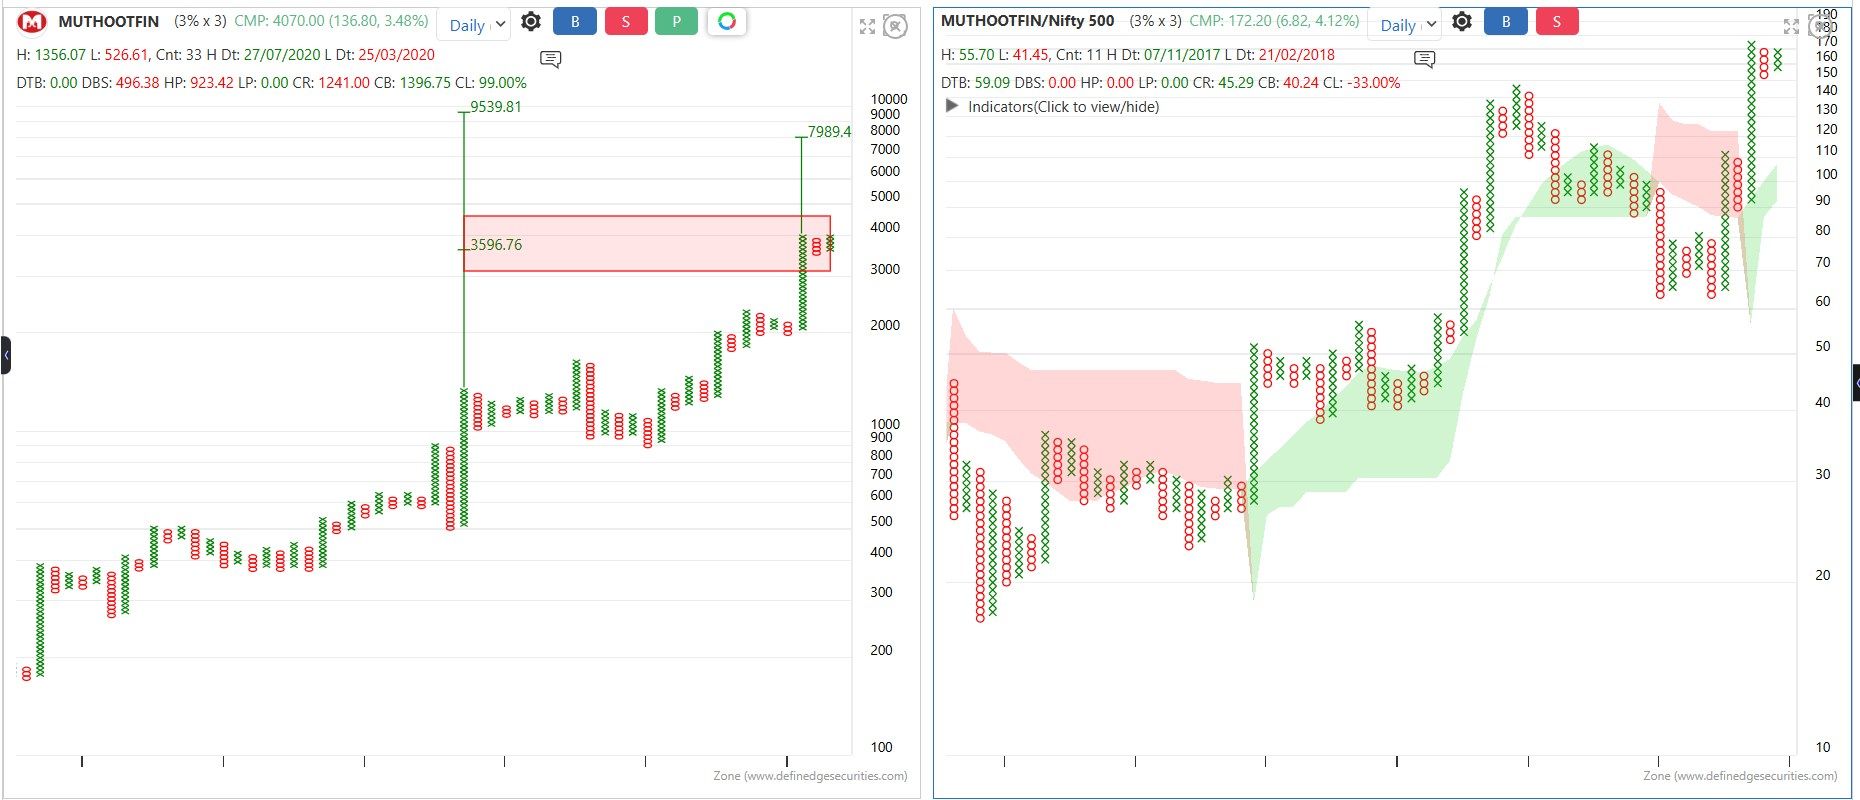
#VGM System Update | Pricol
is a leading Indian automotive technology company engaged in driver information systems, sensors, pumps, and telematics, supplying to major OEMs globally. In the EV space, Pricol is actively developing EV-ready clusters, sensors, connected solutions, and BMS-related offerings, positioning itself for the next mobility cycle.
As per the #VGM system, the stock has triggered a Positive Column Reversal entry, fulfilling all key conditions:
️ Bullish MAST
️ Last two columns’ lows above EMA
️ No immediate Double Bottom Sell
️ PCR-based allocation suggests 50% exposure initially
Allocation & Risk Management
50% allocation now
Remaining 50% on Double Top Buy
Exit risk defined via Double Bottom Sell
Traders and investors can keep the stock on radar and trade strictly as per their own systems.
Technical structure + improving business alignment makes this one worth tracking.
Nishesh Jani,CFTe
#Pricol #VGM #TechnicalAnalysis #PriceAction #MarketBreadth #IndianStocks #EVTheme #AutoAncillary #TrendFollowing #RiskManagement #TradingSetup #nisheshjani #AhmedabadNest 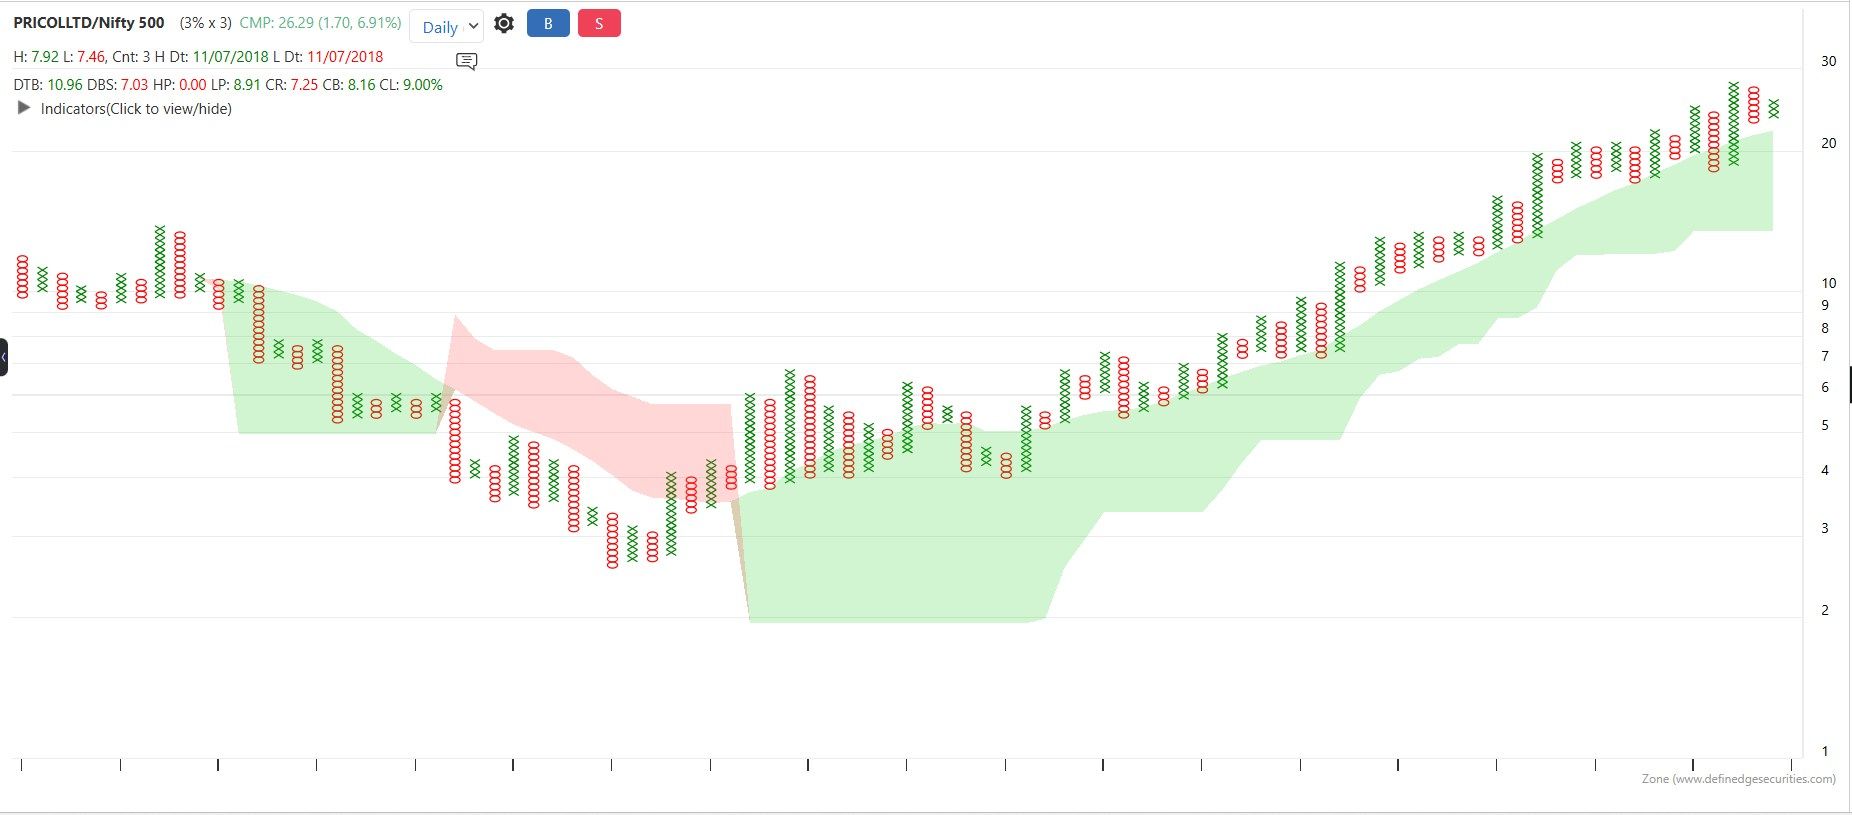
Smallcap 250 & Microcap 250 — consensus says “avoid”.
Market structure says “watch closely”.
Both indices are sitting on anchor support after completing meaningful price and time corrections.
Breadth data (which I track internally) is now in deeply oversold territory — a zone that historically precedes leadership shifts, not breakdowns.
If these levels hold or convert into a bear trap, the probability increases that small & micro caps reclaim leadership in the next phase of the cycle.
Markets reward accumulation during write-offs, not participation during headlines.
What I’m accumulating
• ALPHA
• MOMENTUM50
• MIDSMALL ETF
• MIDCAP150BEES
This is not about prediction — it’s about positioning when participation is lowest and risk-reward is asymmetric.
Watch price behavior.
Watch breadth.
🧠 Ignore the noise.
Nishesh Jani.CFTe
#SmallCaps #MicroCaps #MarketBreadth #BearTrap #AnchorSupport
#SmartMoney #ETFInvesting #IndiaMarkets #LeadershipRotation #RiskReward #nsiheshjani #AhmedabadNest 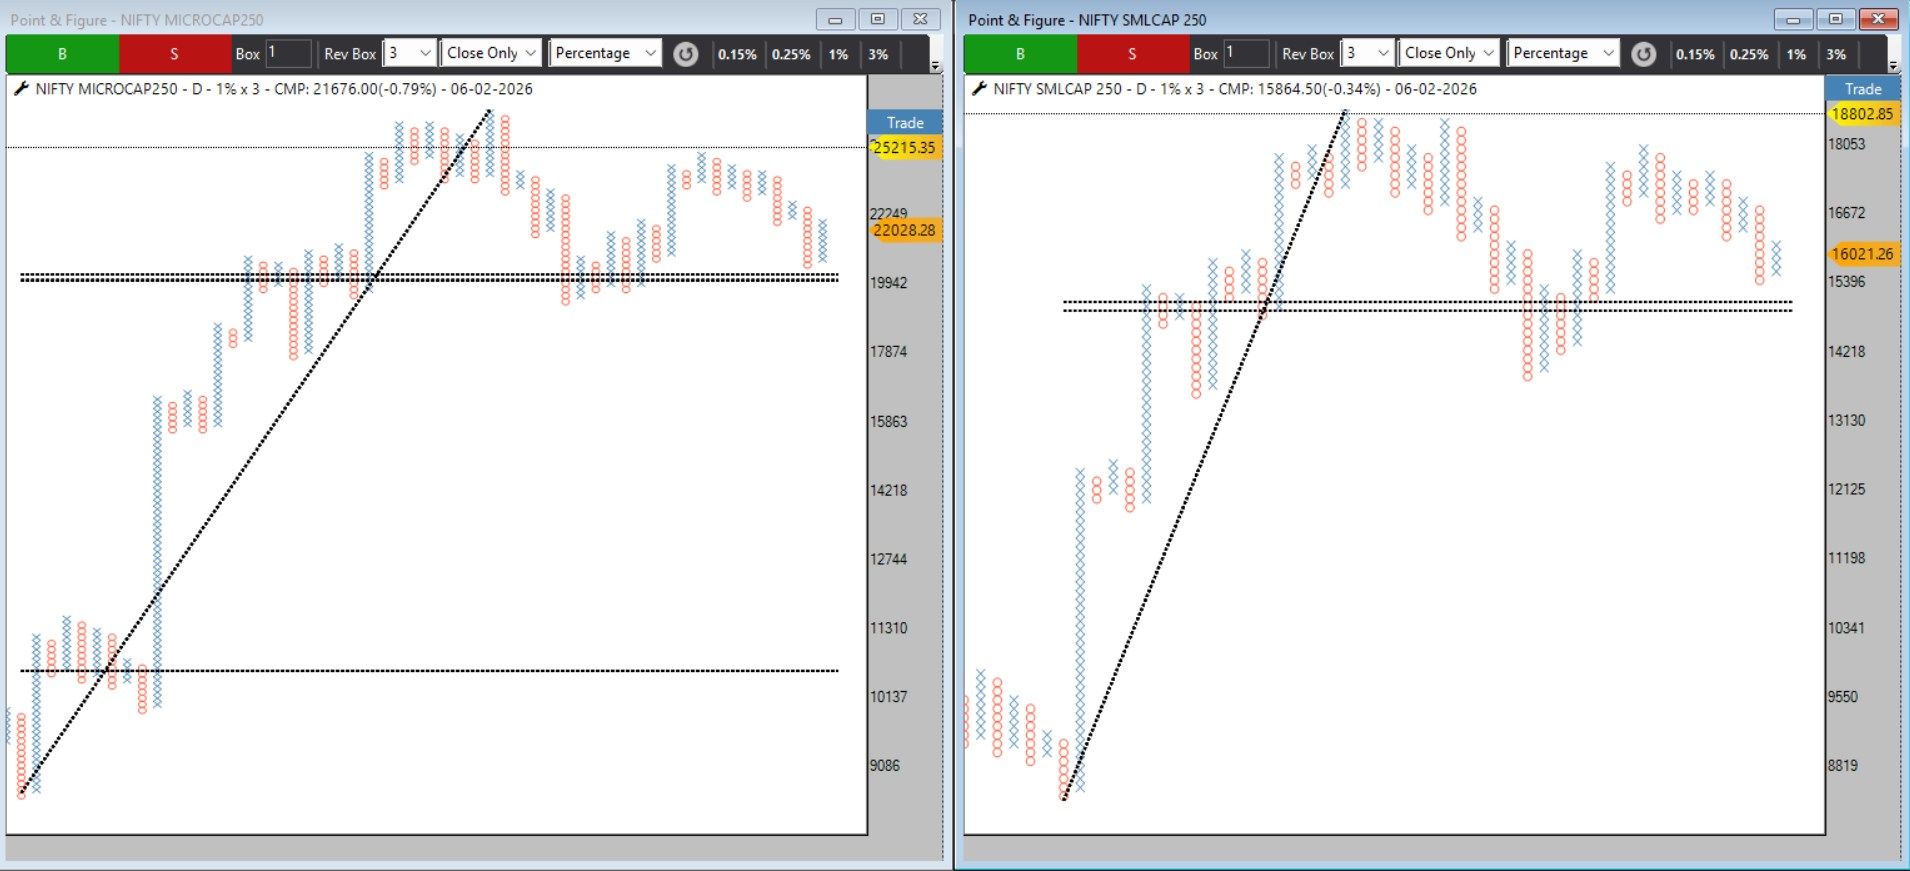
Stock in Focus: VARROC
Stock in Focus: VARROC
operates across automotive lighting systems, polymers, electricals, electronics, and metallic components, making it a diversified auto-ancillary play.
Technical Setup – VGM Framework
Stock has moved into a Column of X, indicating demand emergence
All VGM conditions fulfilled
Price above MAST indicator – trend strength intact
Last two columns’ lows above EMA – confirms higher-low structure
Point & Figure Count (Open Cluster) suggests target zone above ₹1000, offering a favorable risk–reward setup
️ Risk Management (as per VGM)
DBS level remains the exit point
PCR-based entry active, hence position sizing restricted to 50% only
This is a system-driven setup, not a prediction.
Keep this stock on your radar and participate only as per your trading system and risk rules.
Disciplined execution > random participation.
Nishesh Jani,CFTe
#Varroc #VGMSetup #TechnicalAnalysis #PointAndFigure #RiskManagement #AutoAncillary #SystemBasedTrading #PriceAction #StockMarketEducation #nisheshjani #AhmedabadNest 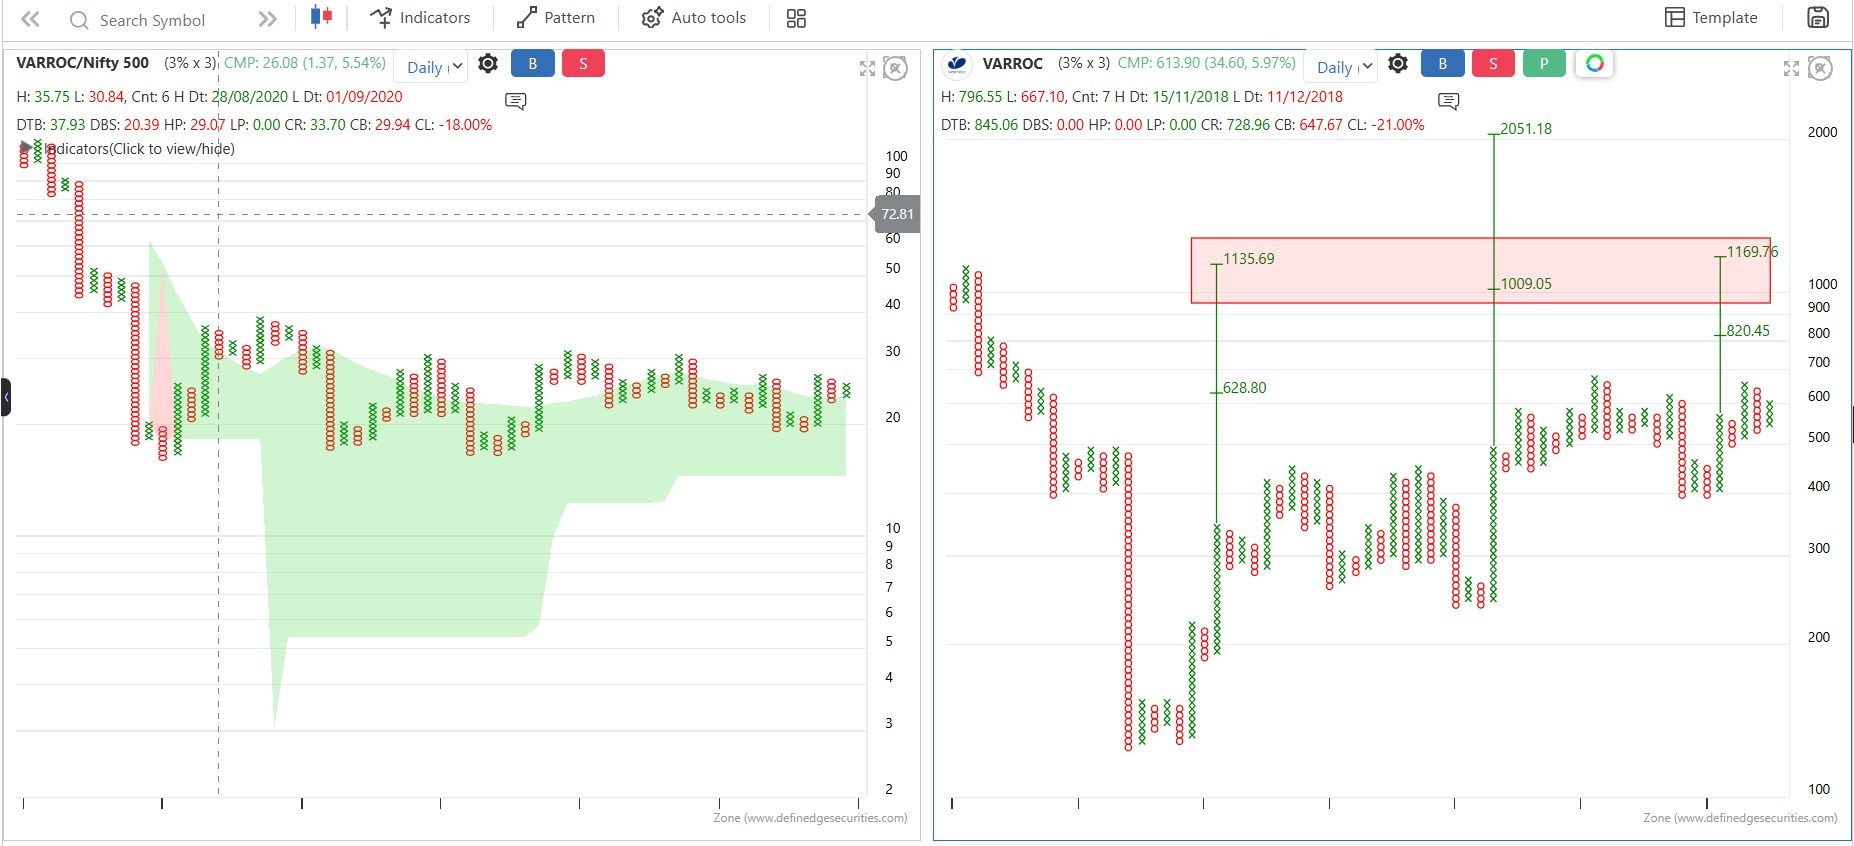
BANK NIFTY | Selling Climax in Play?
is flashing an important structural signal worth tracking closely.
Structure developing
A strong Anchor column of O (aggressive selling) has appeared
It is immediately followed by an Anchor column of X
Volume in the X column > Volume in the O column → a key confirmation condition
A similar structure was seen in Oct 2025, after which Bank Nifty rallied ~10% post breakout.
🧩 What makes this time more interesting
The pattern is forming right at anchor points, adding an extra layer of structural support
The current Anchor X column is still open
Watching for a decisive close with higher volume to validate the setup
 What a Selling Climax typically tells us
The downtrend may be:
Ending
Pausing
Transitioning into accumulation
Probability of further sharp downside reduces
Risk–reward starts shifting in favor of bulls
Markets don’t reverse when fear disappears — they reverse when selling exhausts itself and strong hands step in quietly. Bank Nifty may be approaching that zone.
Nishesh Jani,CFTe
#BankNifty #SellingClimax #MarketStructure #AnchorPoints #VolumeAnalysis #RiskReward #TechnicalAnalysis #IndiaMarkets #nisheshjani #AhmedabadNest 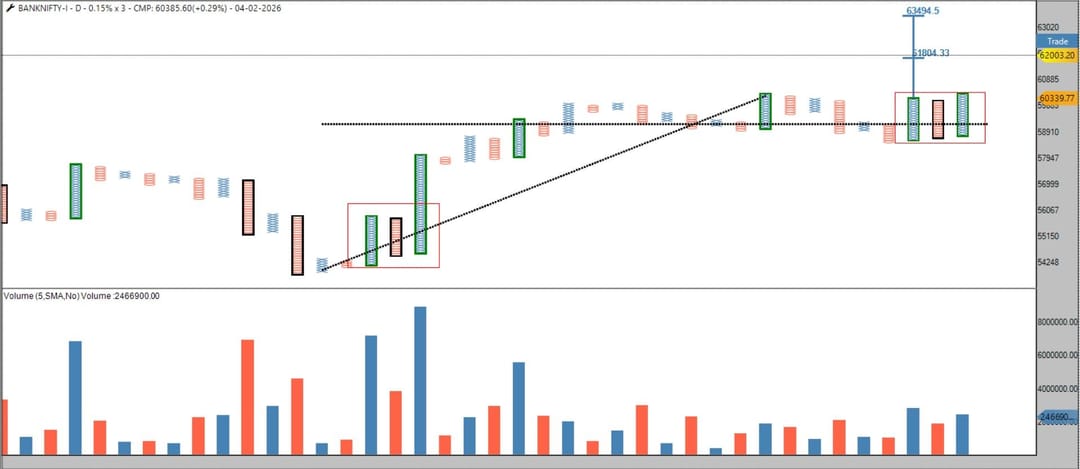
The broader market is sending an important structural message.
NIFTY 500 | Bigger Picture Alert
The broader market is sending an important structural message.
On a smaller box value, price has formed a Bullish Double Broadening pattern right at anchor support.
At the same time, the index has negated the recent mini top and confirmed a mini bottom — a classic shift in control.
Why this matters
Broadening patterns are back-to-back failure structures
They reflect extreme emotional price behavior
Volatility typically peaks near major cycle lows
This setup is often seen during:
Major market bottoms
Post-panic phases
The end of long bear or corrective cycles
This is the battlefield where bears lose control twice, and bulls quietly take charge.
️ Risk management (failure condition)
Structure fails only if price breaks the last swing low zone: 22,600–22,400, below anchor points.
Upside perspective
Open upside counts towards 26,500, offering a favorable risk–reward from a positional standpoint.
Markets don’t bottom with comfort — they bottom with volatility, confusion, and failed breakdowns. This structure fits that narrative perfectly.
Nishesh Jani,CFTe
#Nifty500 #BroaderMarket #MarketStructure #TechnicalAnalysis #AnchorPoints #BullishSetup #IndiaMarkets #RiskReward #nisheshjani #AhmedabadNest 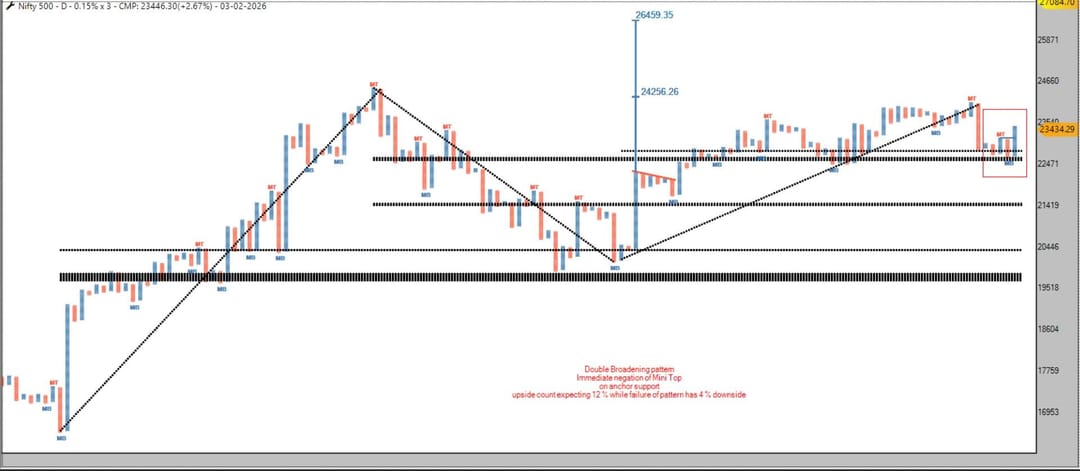
NIFTY P&F Insight | Anchor Points in Focus
NIFTY P&F Insight | Anchor Points in Focus
on Point & Figure charts are critical pivot zones—levels from where price direction decisively shifts upward or downward.
Current Observation
A sustainable close above 25460 signals a Bear Trap formation
This indicates selling pressure getting absorbed at support and bears getting trapped
What it means
Once confirmation is seen above the Anchor Point, bullish bias activates
Risk remains clearly defined at 24585, making this a high-quality risk–reward setup
Big Picture
When markets trap participants at important structural levels, the next directional move is often sharp and decisive. Anchor-based P&F structures help spot such professional-grade opportunities early.
Discipline in confirmation + strict risk management = edge.
Nishesh Jani,CFTe
#Nifty #PointAndFigure #AnchorPoints #BearTrap #MarketStructure #RiskManagement #TechnicalAnalysis #SmartMoney #IndianMarkets #nisheshjani #AhmedabadNest 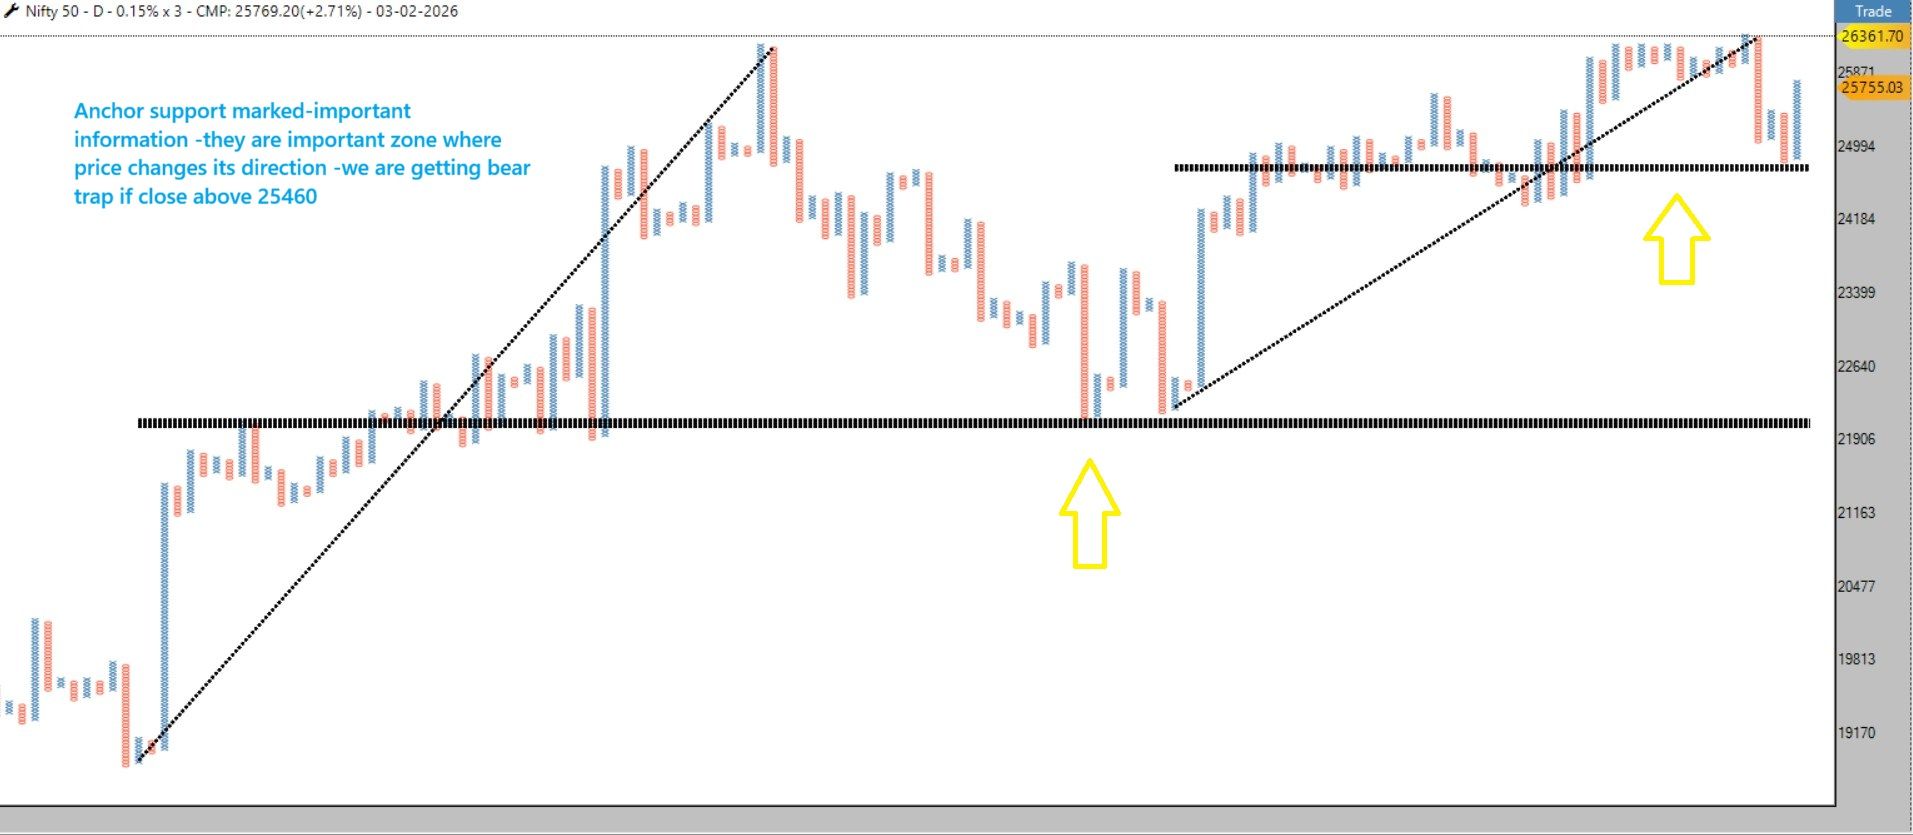
How Market Cycles Trick Our Minds
When markets keep rising, people start feeling very confident.
They buy more, take bigger risks, and stop worrying about what can go wrong.
When markets fall, the same people become extra cautious.
They avoid buying even good companies because fear takes over.
Prices become cheap, but they don’t feel like an opportunity.
This is how market cycles work:
• Good times make us ignore danger
• Bad times make us ignore opportunity
But the market doesn’t reward emotions.
It rewards patience and discipline.
The smart approach is simple:
Stay careful when everyone is excited,
and stay curious when everyone is scared.
You don’t need to predict the future.
You just need to avoid extremes.
In the long run, clarity wins over noise.
Nishesh Jani,CFTe
#InvestingMindset #MarketCycles #BehavioralFinance #LongTermThinking #nisheshjani #AhmedabadNest
 Broader Market Turning Point? Small-Cap Funds Reopen After 22 Months
Broader Market Turning Point? Small-Cap Funds Reopen After 22 Months
ICICI Prudential Smallcap Fund is reopening for fresh subscriptions — a significant development after nearly 22 months of pause due to stretched valuations.
This move signals that fund managers are finally finding valuation comfort in the broader market.
A healthy market cycle often begins when leadership starts broadening beyond large caps.
For investors, this could be the right time to consider systematic exposure to quality mid & small caps — with disciplined position sizing and strong risk management.
A broader participation phase in equities may be setting up.
Nishesh Jani,CFTe
#ICICIPru #SmallCapFunds #IndianMarkets #Midcaps #WealthCreation #StockMarketIndia #MarketOutlook #FundFlows #EquityInvesting #nisheshjani #AhmedabadNest
Market Mood Index hits Extreme Fear — Historically a Bottoming Zone
Market Mood Index hits Extreme Fear — Historically a Bottoming Zone
(MMI) tracks 6 key factors to capture the collective emotions driving Indian markets:
1️⃣ FII Activity – Gauges directional stance of foreign institutions via Index Futures positioning
2️⃣ Volatility & Skew – Measures risk expectations and downside probability via VIX & IV skew
3️⃣ Momentum – 90D vs 30D trend strength of Nifty 50
4️⃣ Market Breadth – Modified Arms Index showing participation & volume confirmation
5️⃣ Price Strength – % of stocks near 52W highs minus % near 52W lows
6️⃣ Demand for Gold – Relative performance of Gold vs Nifty (flight to safety)
🟣 Current Situation:
MMI has slipped into EXTREME FEAR territory.
Historical Behavior:
Every previous dip into the extreme fear zone has aligned with market bottoms and led to positive forward returns as sentiment mean-reverted from fear → neutrality → optimism.
Why this matters:
Extreme pessimism often marks an exhaustion zone where selling pressure fades and value buyers emerge.
Takeaway for Investors & Traders:
Fear-driven markets tend to create opportunities, not warnings — but timing & risk management remain essential.
Sentiment drives short-term moves. Fundamentals drive long-term outcomes.
Nishesh Jani,CFTe
#MarketMoodIndex #ExtremeFear #ContrarianSignals #Nifty50 #FIIData #VIX #MarketSentiment #IndiaMarkets #StockMarketIndia #Investing #Trading #MarketBottom #GoldVsEquity #nsiheshjani #AhmedabadNest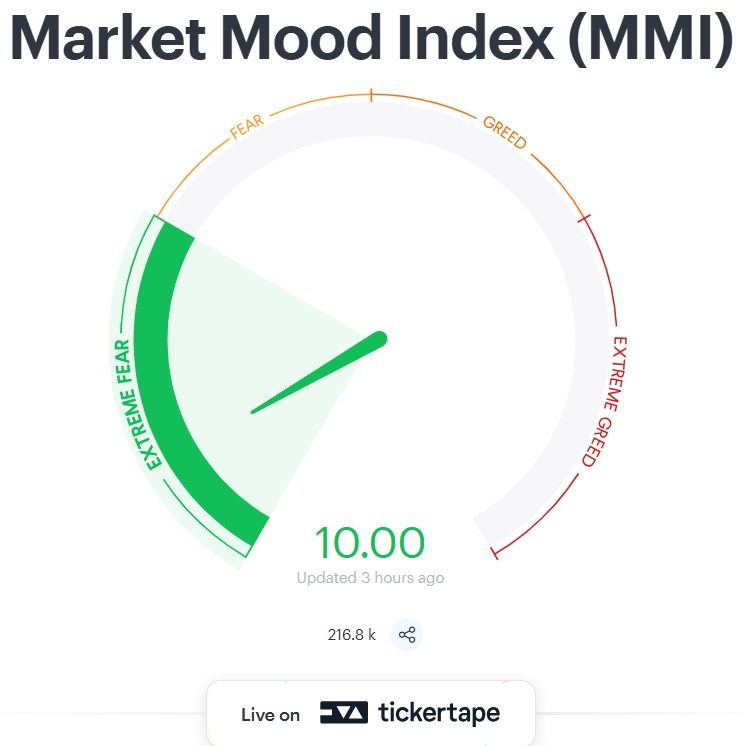
Nifty Technical View
Nifty Technical View
Nifty has taken support on the 150 EMA on three prior occasions, each time leading to a short-term reversal.
In two of those instances, Nifty even closed below the 150 EMA, only to form a bullish engulfing candle the very next day and reverse.
We are now at the 4th test of this zone — with price again sitting on the 150 EMA plus the lower rising channel trendline, making it an important confluence support area.
If the past behavior continues, odds favor a technical bounce, but candle confirmation remains key.
 Trigger Watch:
– Confirmation via bullish reversal candle
– Momentum follow-through above engulfing high (if formed)
– Structure valid as long as channel support holds
Nishesh Jani,CFTe
#Nifty #Nifty50 #NiftyAnalysis #TechnicalAnalysis #TrendAnalysis #SwingTrading #IndianMarkets #MarketOutlook #nisheshjani #Ahmedabadnest 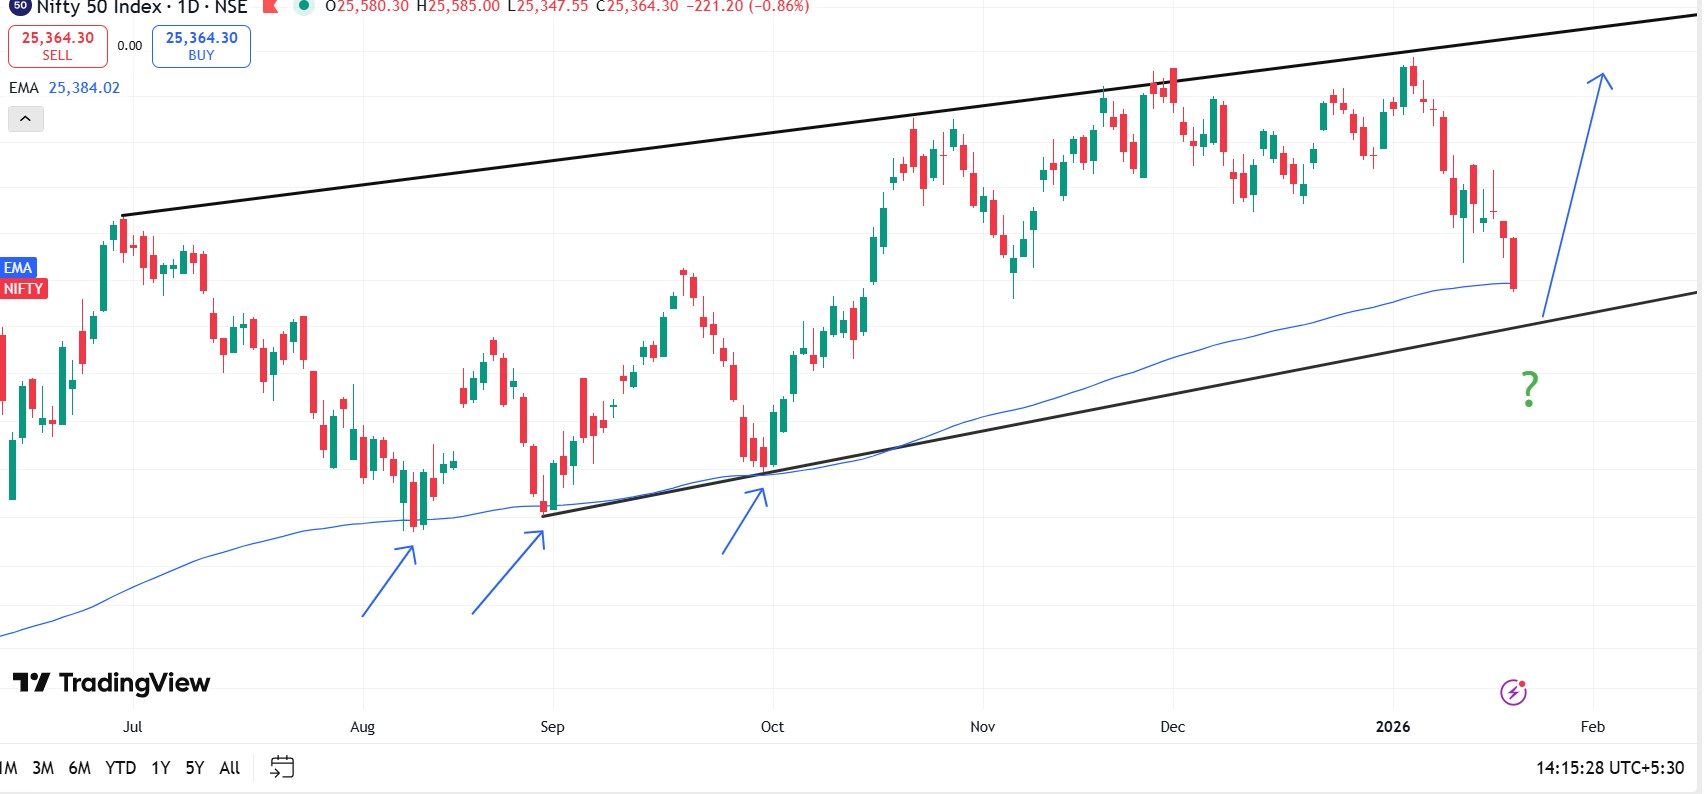
NIFTY : GOLD Ratio — Renko View
NIFTY : GOLD Ratio — Renko View
Interesting historical pattern emerging on the NIFTY-to-GOLD Ratio!
Using Renko Charts, the Smoothed RSI has shown a unique recurring behavior:
 2009, 2012 & 2020
— Whenever RSI dropped below 20 and
— Made a lower low vs previous trough
→ Equities reversed sharply thereafter
We are witnessing the same setup again, with RSI sub-20 and breaking the previous bottom.
Keeping fingers crossed for another reversal in favor of equities and medium-term allocations into India’s growth cycle.
History doesn’t repeat — but it often rhymes.
Nishesh Jani,CFTe
#Nifty #Gold #RenkoCharts #TechnicalAnalysis #SmoothedRSI #MarketCycles #EquityInvesting #NiftyAnalysis #IndiaMarkets #MarketOutlook #AssetAllocation #Definedge #nisheshjani #AhmedabadNest 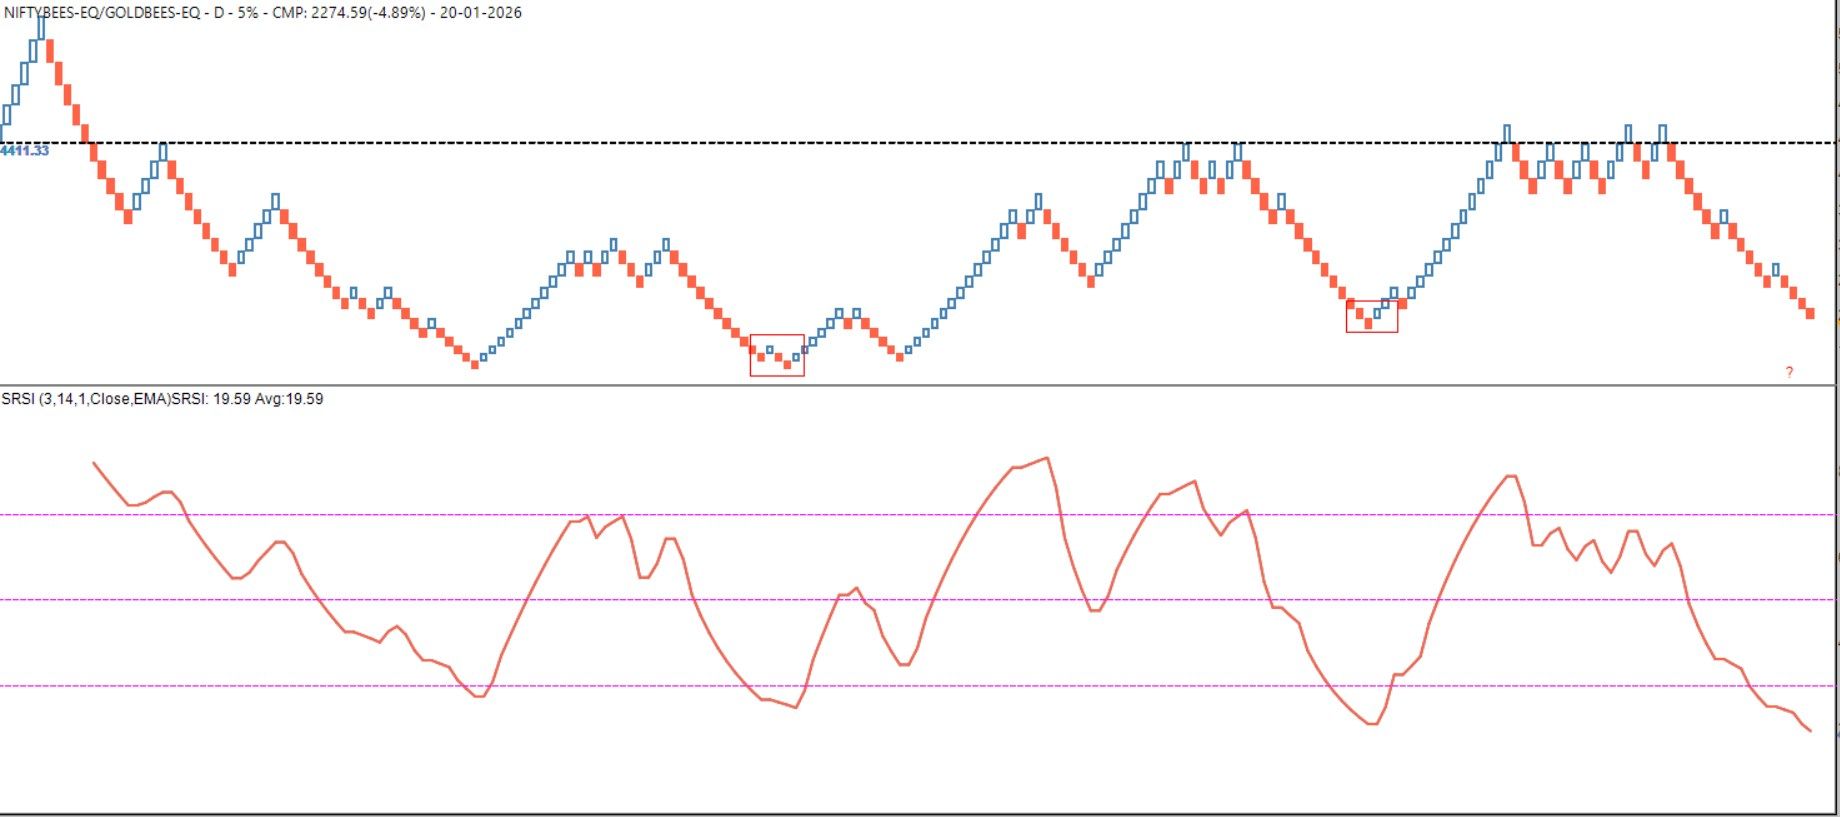
Tata Steel is trading at ATH (All-Time High).
Pattern-wise the stock has printed a Bullish Oops / O at same level, a structurally strong bullish setup.
Price-wise, as long as it holds ₹150 on a closing basis, upside targets open toward ₹244 and higher levels.
Structurally, the stock also stands to benefit from the ongoing bullish phase in metals.
Traders and investors can keep stock on radar to trade own system
Nishesh Jani,CFTe
#TataSteel #Bullish #Markets #Investing #TechnicalAnalysis #PnF #StocksToWatch #TrendFollowing #Breakout #Metals #Commodities #Nifty #Trading #Momentum #nisheshjani #AhmedabadNest 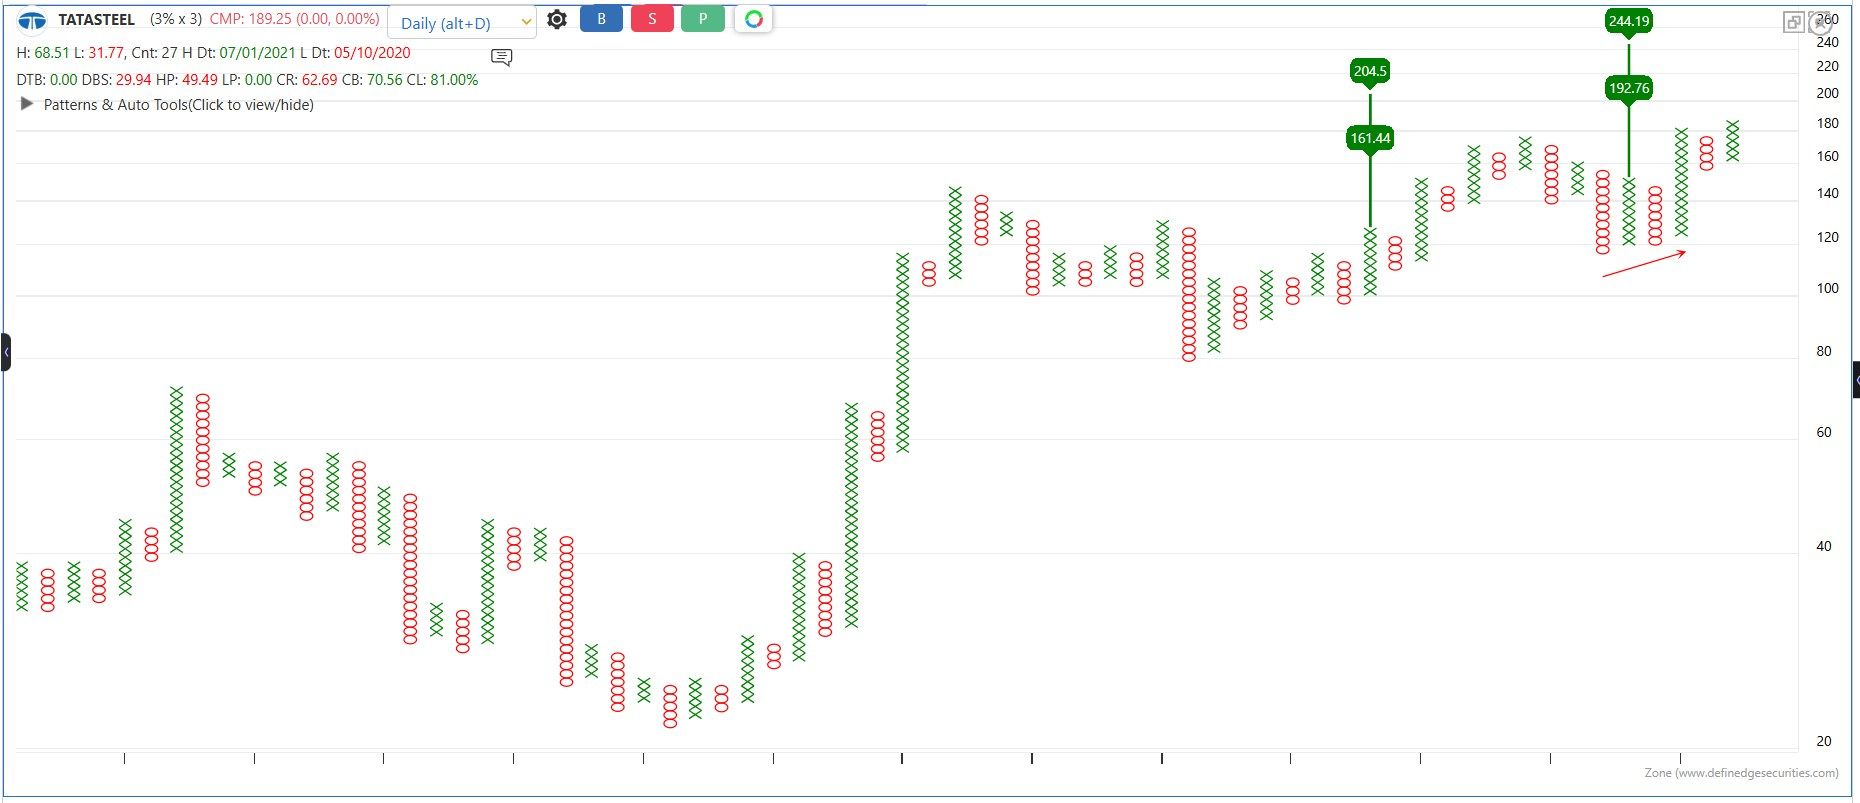
Eternal: Zomato Ecosystem Showing Strength Across Segments
Zomato’s diversified ecosystem — Zomato (Food Delivery), Blinkit (Quick Commerce), Hyperpure (B2B Food Supply) & District (Events/Ticketing) — continues to demonstrate strong operating momentum.
On #VGM, structure has turned bullish as the last two column lows are above MA and the stock is trending within the Bullish MAST cloud.
Price-wise, the first open vertical count is nearly achieved. The next open vertical count is ₹820, offering attractive Risk–Reward from the current price zone around ₹300.
Current signal: PCR – Positive Column Reversal → triggering 50% allocation.
Awaiting DTB – Double Top Buy for the remaining 50% allocation with DBS – Double Bottom Sell as the exit mechanism.
Investors & traders may keep the stock on their radar to trade via their own system rules & discipline.
Nishesh Jani,CFTe
#Zomato #Blinkit #Markets #IndianEquity #TechnicalAnalysis #PriceAction #VGM #Momentum #Bullish #Trading #Investing #Nifty #Stocks #StockMarketIndia #nisheshjani #AhmedabadNest 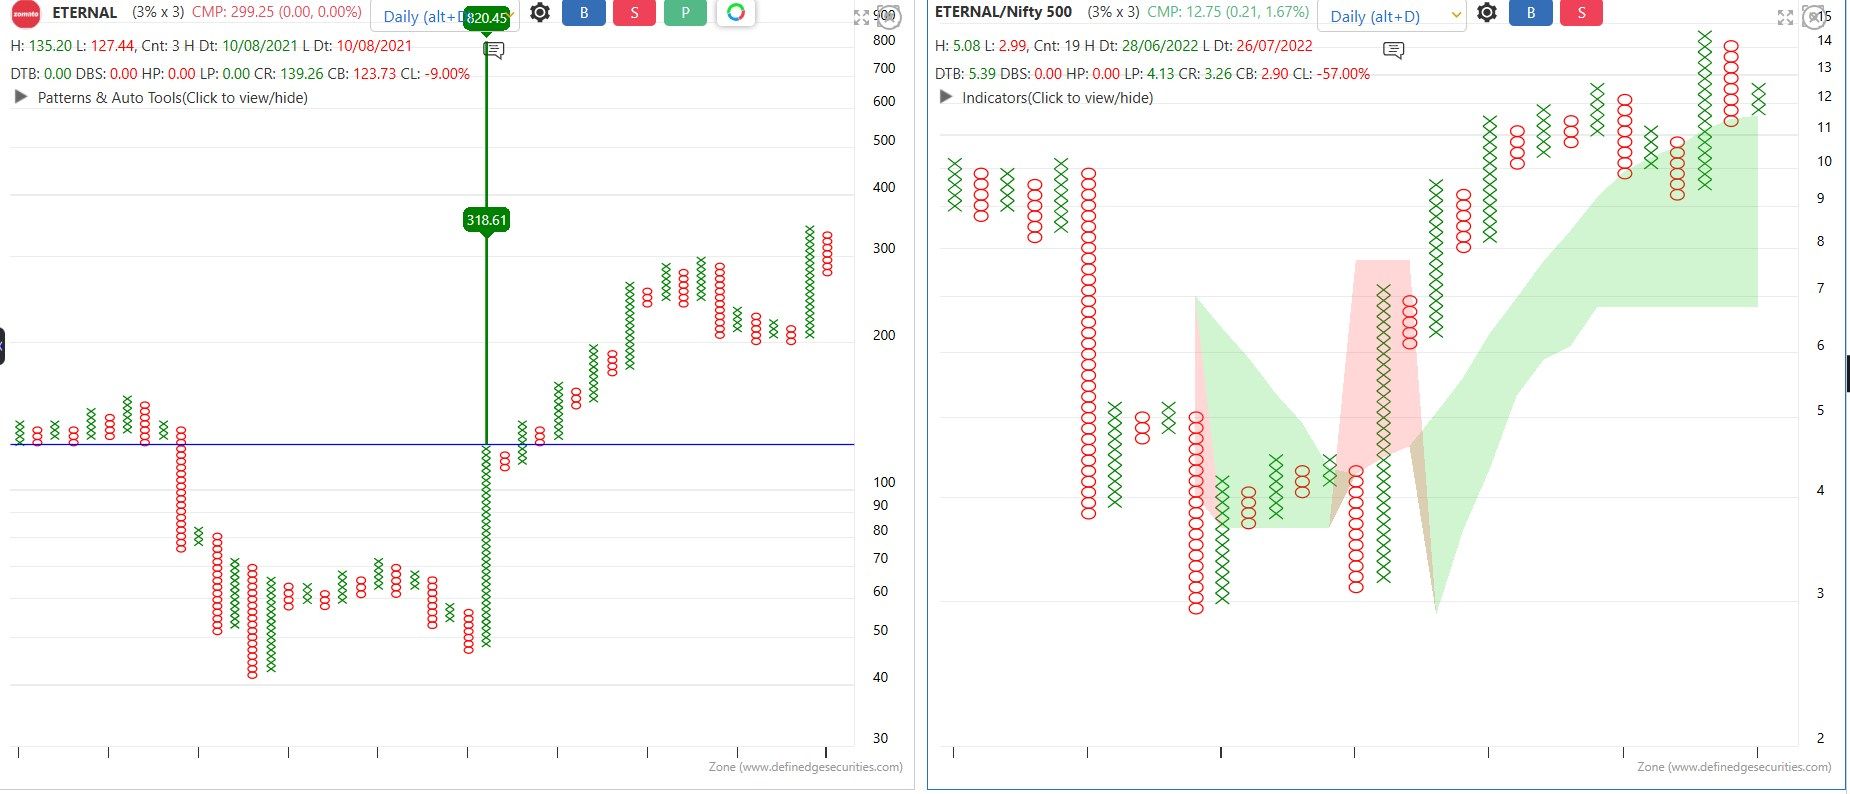
BSE Ltd.
Provides trading ecosystem across equities, debt, derivatives, mutual funds & commodity derivatives.
On #VGM, the stock is above MAST with last two column lows above MA, confirming a bullish structural setup.
Price has completed an ABC breakout, opening the path toward its first vertical count of 6691, offering compelling risk-reward from current levels near 2823.
As per VGM rules — current entry is via PCR, so model portfolio would allocate 50%, and wait for DTB to deploy the remaining 50%, with DBS as exit.
Both investors & traders may keep BSE on radar to execute as per their respective systems.
Nishesh Jani,CFTe
#MarketStructure #PriceAction #VGM #Breakout #IndianEquities #TradingSystems #Momentum #BSE #Nifty #Stocks #Investing #Portfolio #RiskManagement #TechnicalAnalysis #nisheshjani #AhmedabadNest 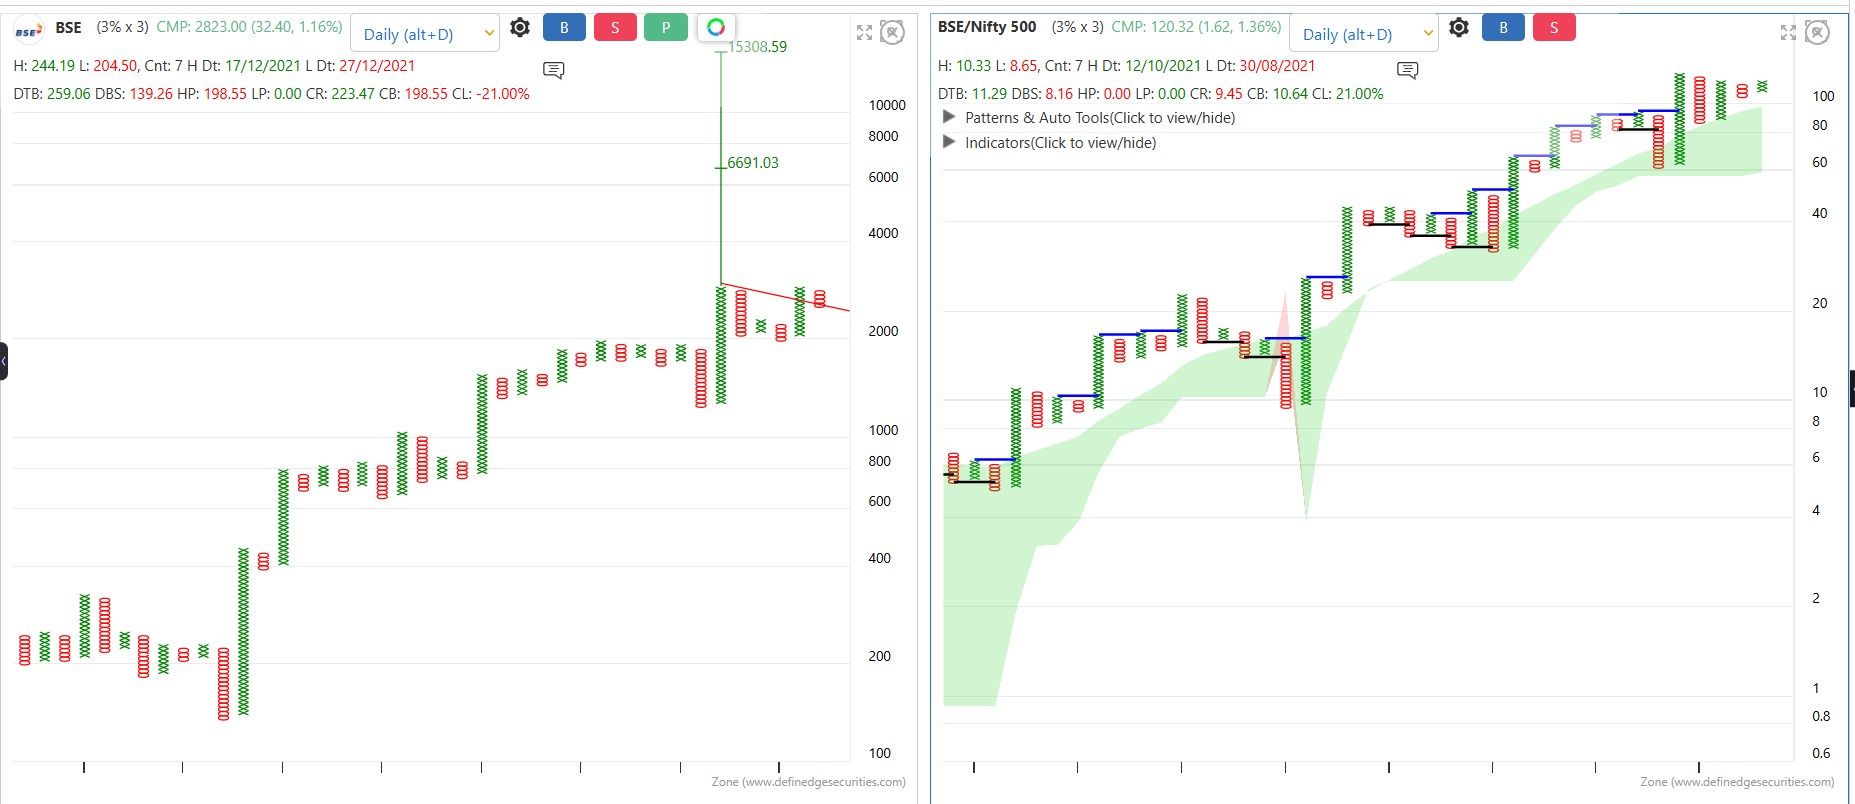
MTAR Technologies — a leading Indian precision engineering & manufacturing company catering to Space, Defence, Civil Nuclear & Clean Energy verticals.
On the technical side, the stock has qualified under our #VGM framework by delivering a clean DTB above the Bullish MAST indicator. Last two columns have not touched the MA and there is no immediate DBS, improving conviction.
Price structure shows a Trap + Anchor Follow-Through, opening vertical counts up to ~5100 and potentially higher. For now, we are considering the first count which is ~2x from current levels and offers an attractive Risk-Reward profile.
Investors & traders can keep the stock on radar and participate as per their own system.
Nishesh Jani,CFTe
#MTAR #StockMarketIndia #VGM #Momentum #PriceAction #TechnicalAnalysis #Investing #Trading #Space #Defense #CleanEnergy #nisheshjani #AhmedabadNest 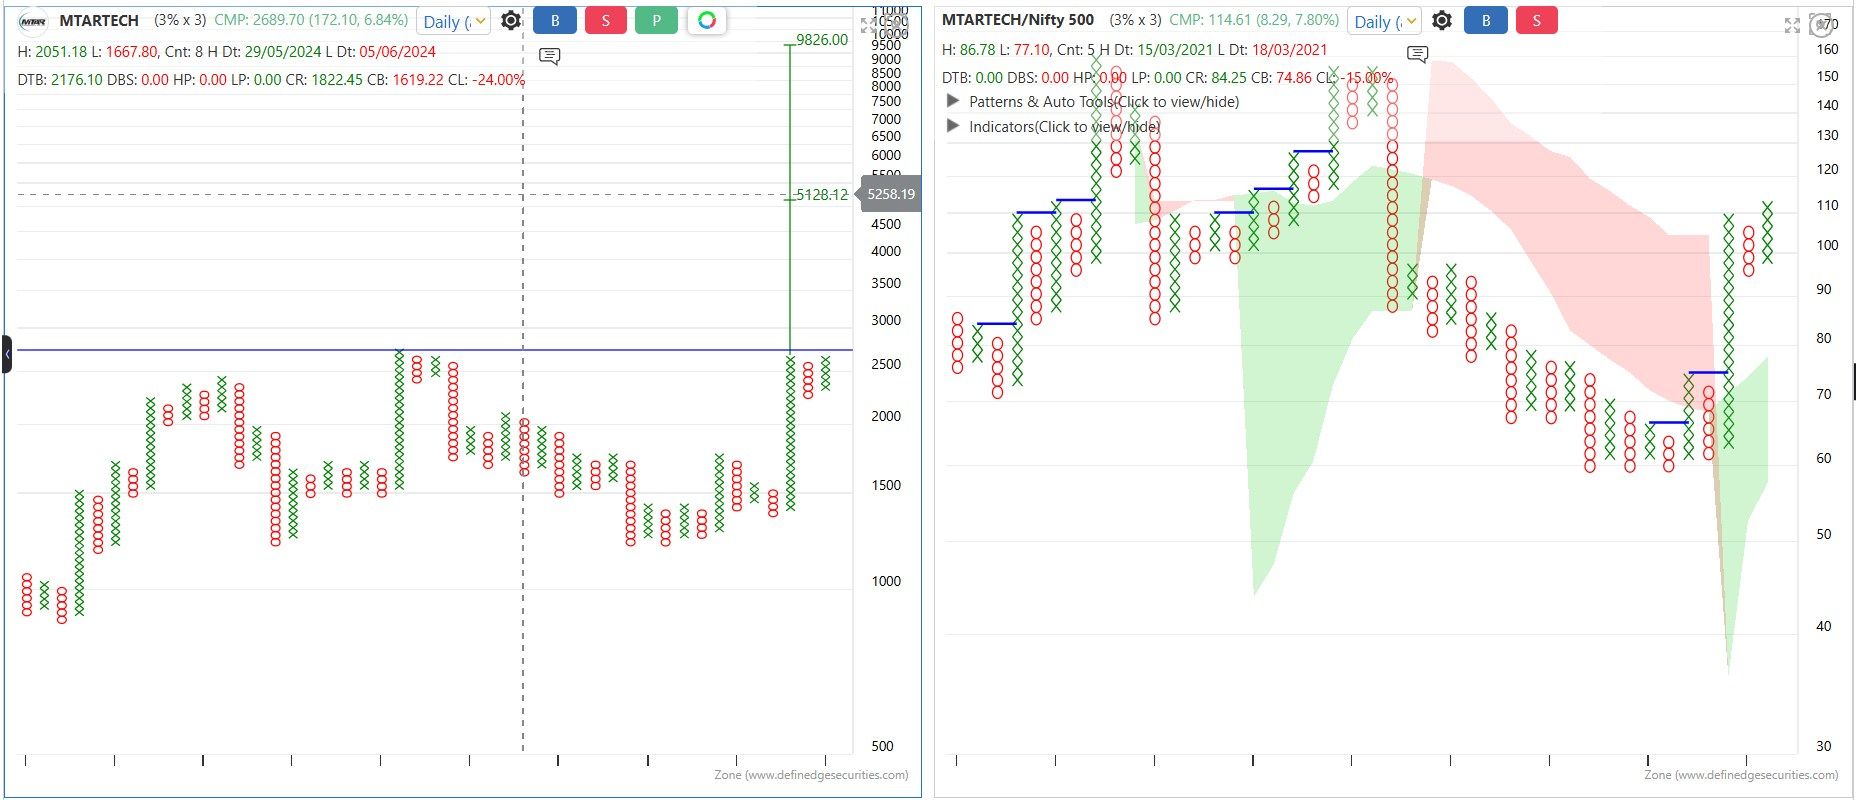
POLYCAB | VGM + Relative Strength Setup
continues to strengthen both fundamentally and technically. With leadership across house wires, industrial cables, optical fiber, LED lighting, switchgear (MCBs, RCCBs) and home automation, the stock is now flashing a high-quality VGM setup.
VGM Technical Highlights
Relative Strength fulfilling all VGM conditions
Bullish MAST with rising MA
Last 2 columns’ lows above MA → strong structural strength
PCR triggered → first entry signal
DBS defined as risk-managed exit
Super Pattern on Point & Figure
Two active vertical counts (cluster) pointing towards 12820
With price around 7900, the setup offers a favorable risk–reward profile if strength sustains.
Traders and investors can keep the stock on their radar and trade strictly as per their own system and risk management.
Nishesh Jani,CFTe
#POLYCAB #VGM #RelativeStrength #IndianStocks #TechnicalAnalysis #MomentumInvesting #nisheshjani #AhmedabadNest 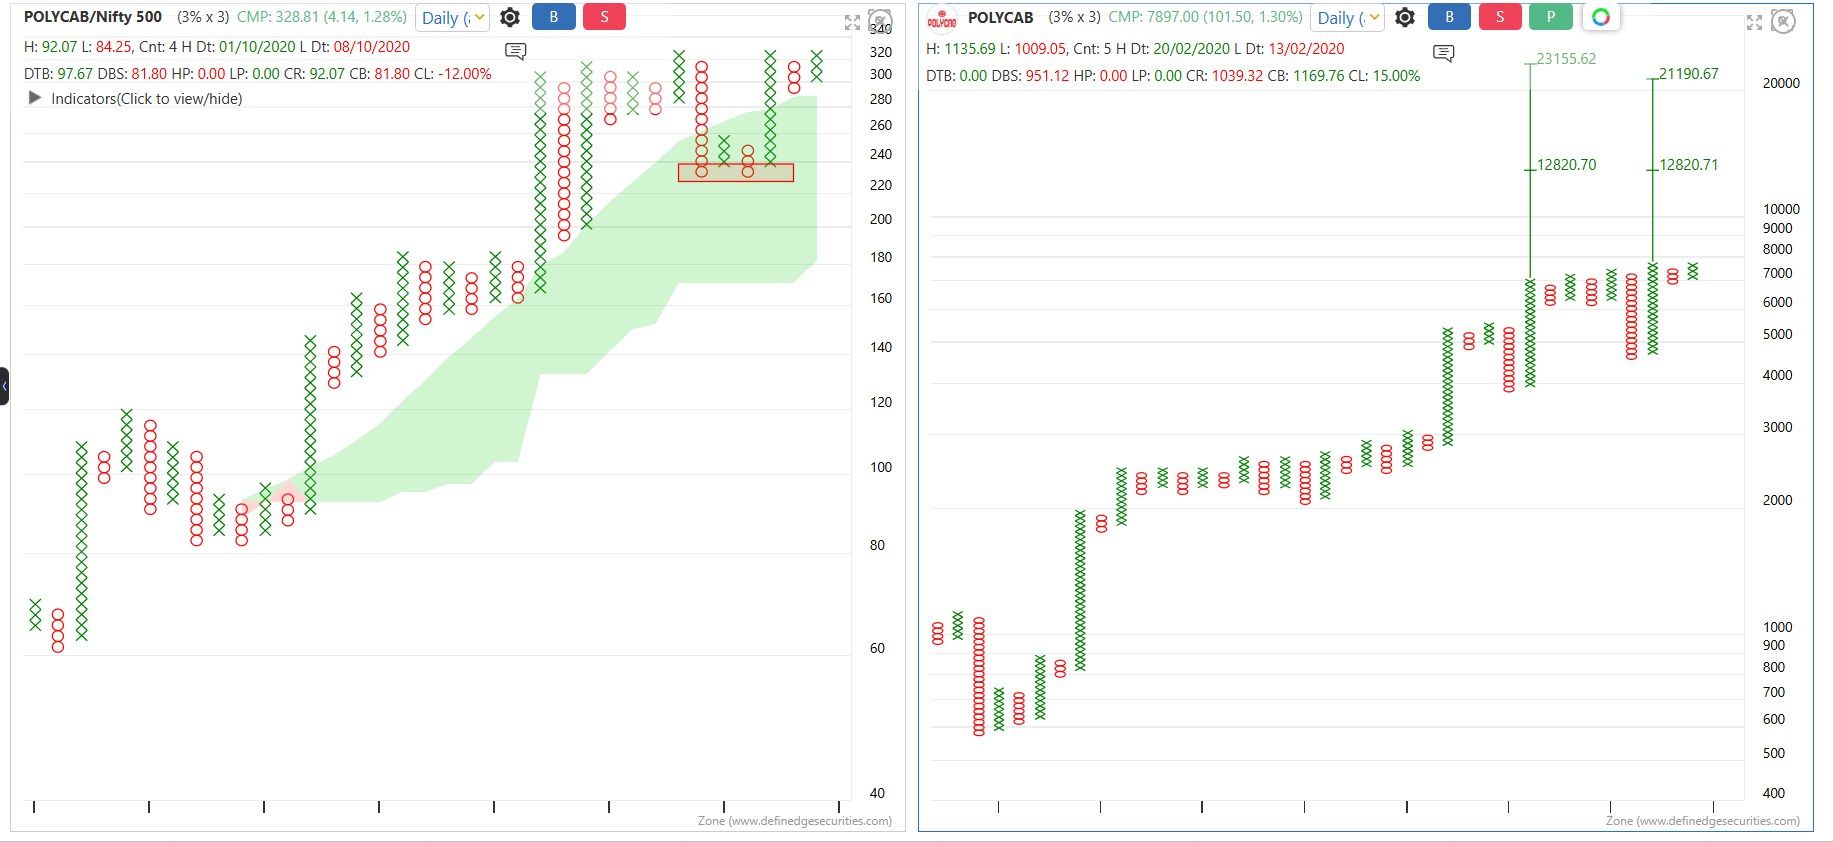
EMCURE Pharma | Strong Technical Setup Emerging
EMCURE Pharma | Strong Technical Setup Emerging
operates across high-growth therapeutic areas — Gynaecology, Cardiology, Oncology, Respiratory, CNS, and HIV — giving it a diversified and resilient business profile.
Technical View:
Post listing, the stock corrected into negative returns, forming a healthy base
Now attempting to reclaim and cross its All-Time High (ATH)
As long as price holds above 1241 (closing basis), the structure remains bullish
Upside potential seen towards 2112 and beyond, entering uncharted territory
Actionable Insight:
Investors and traders can keep on radar and participate as per their own trading/investing systems.
Nishesh Jani,CFTe
#EMCURE #IndianPharma #TechnicalBreakout #MomentumStocks #StockMarketIndia #nisheshjani #AhmedabadNest 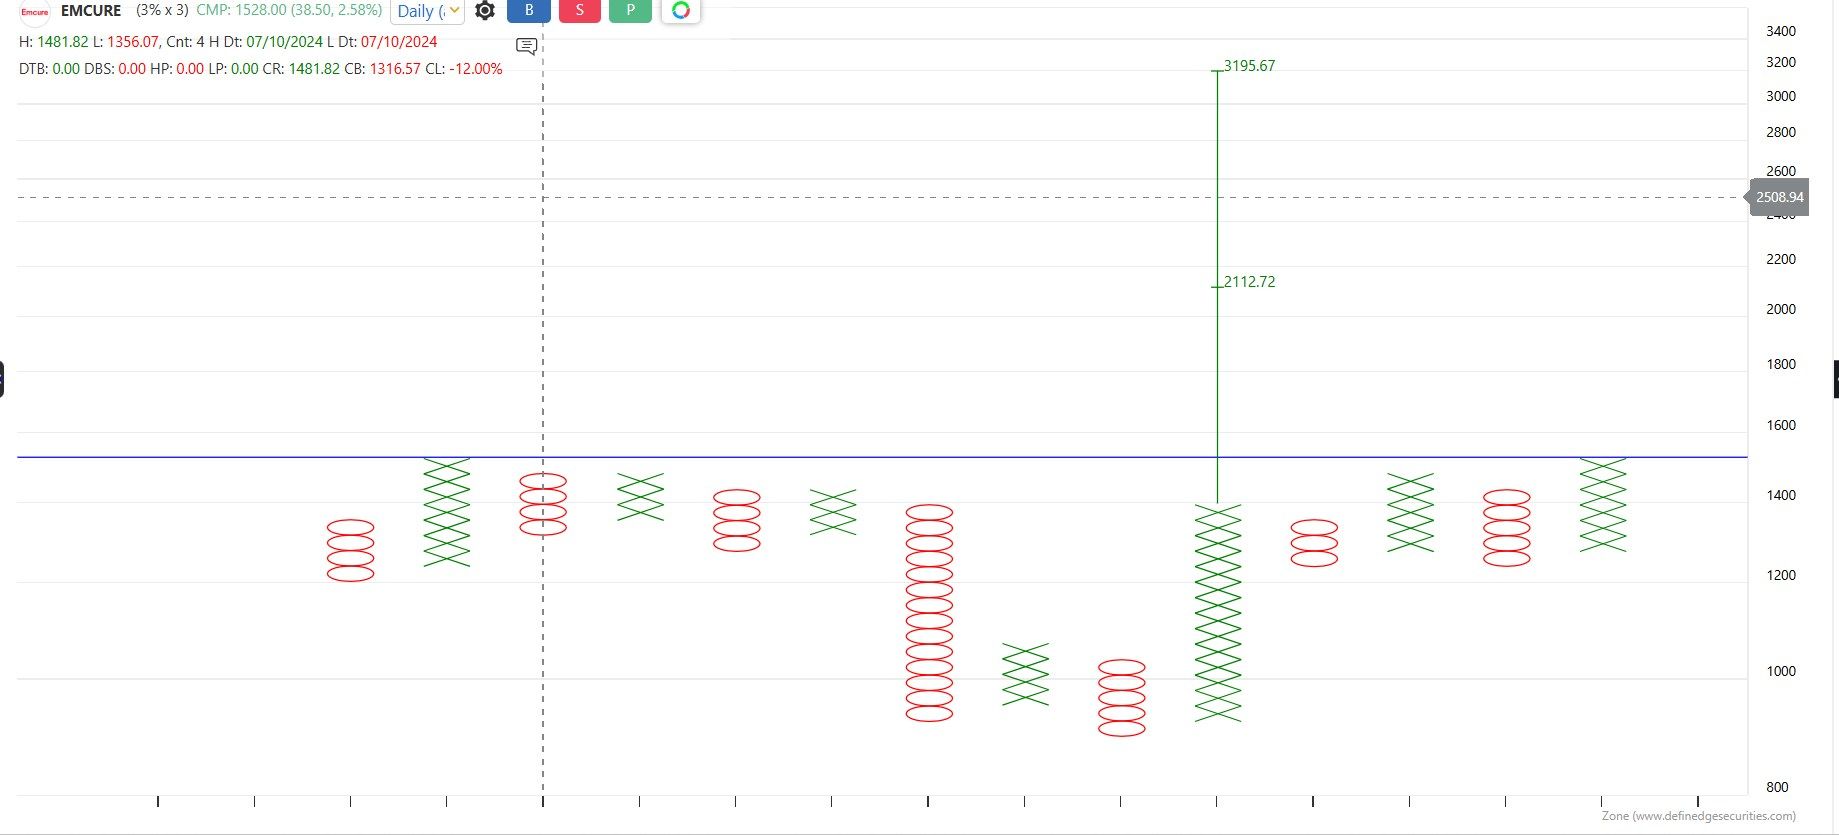
ICICI Prudential Life | Bullish Structure in Play
ICICI Prudential Life | Bullish Structure in Play
operates across Life Insurance, Pensions, Health Insurance, Savings Plans, and ULIPs, positioning it well within India’s long-term financialization theme.
Technical View:
Strong base formation near 520
Clear Bullish OOPS pattern visible on charts
As long as price holds above 520, the bullish bias remains intact
Upside potential towards cluster target of 820, with triple-digit levels ahead as marked on charts
Actionable Insight:
Investors and traders can keep ICICIPRULI on radar and trade as per their own systems and risk management.
Nishesh Jani,CFTe
#ICICIPRULI #InsuranceStocks #BullishSetup #IndianStockMarket #MomentumInvesting #nisheshjani #AhmedabadNest 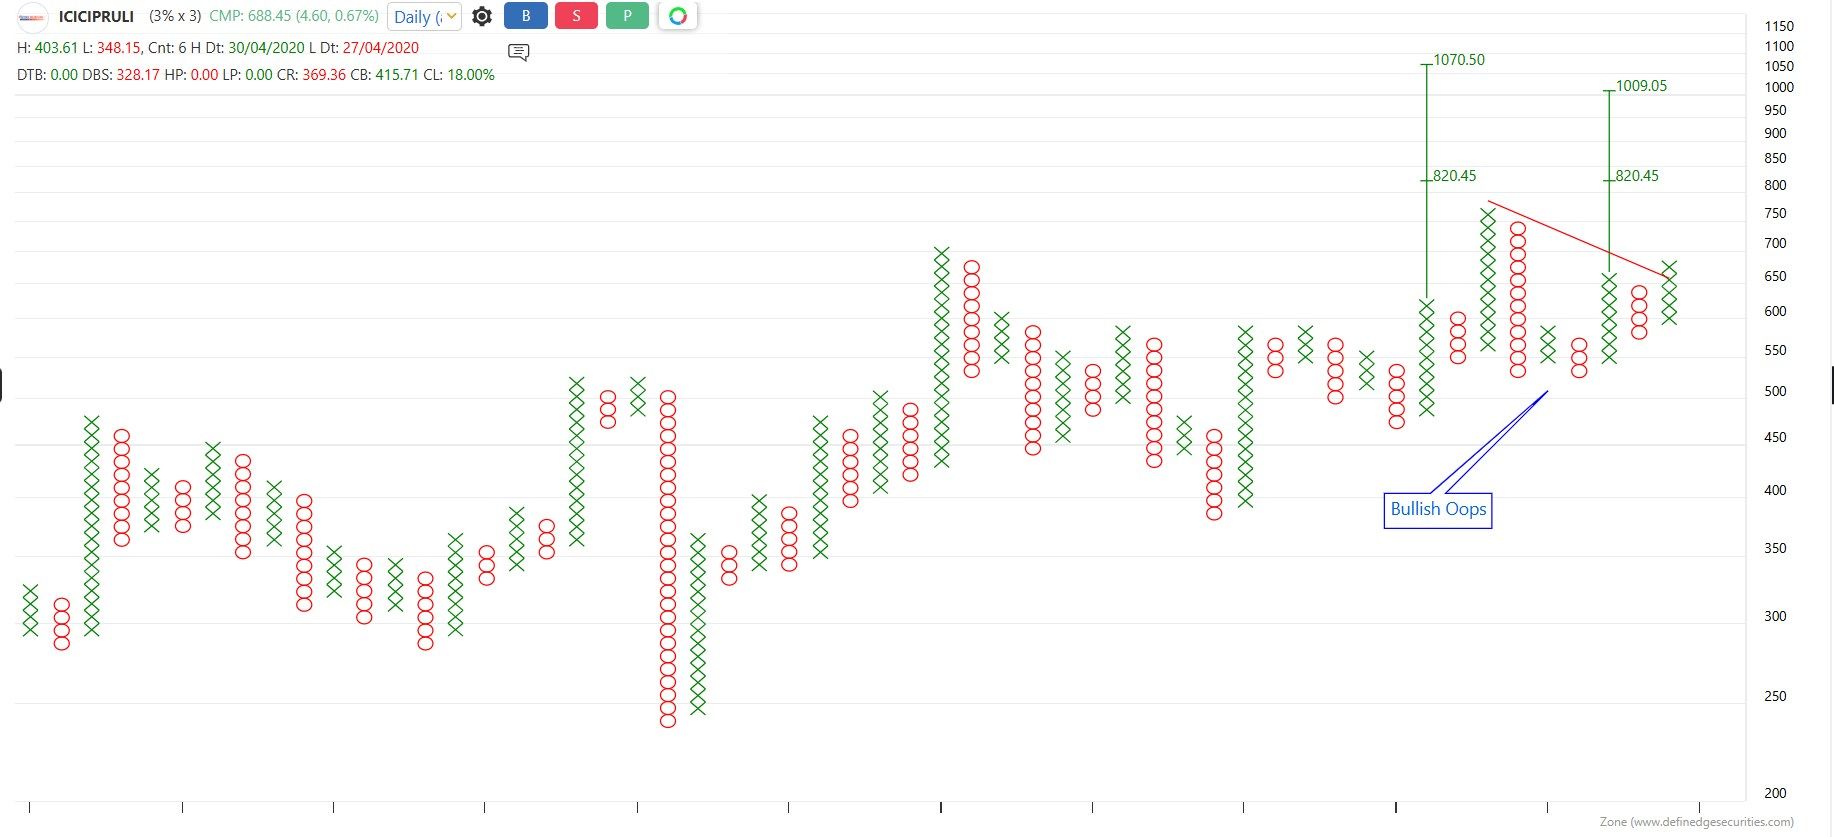
Voltas Ltd | Multiple Bullish Reversal Signals
Voltas Ltd | Multiple Bullish Reversal Signals
operates across Home Appliances, and is a leader in HVAC, commercial refrigeration, electro-mechanical projects, water treatment, textile machinery, and large-scale infrastructure cooling & building management systems.
Technical View:
Strong consolidation base around 1200
Formation of Bear Trap followed by a Bullish OOPS pattern — a powerful reversal combination
As long as price holds above 1200 (closing basis), the structure remains bullish
Upside potential seen towards 2500 and higher
Actionable Insight:
Investors and traders can keep Voltas on radar and participate as per their own trading systems and risk management.
Nishesh Jani,CFTe
#Voltas #BullishReversal #HVAC #IndianStockMarket #MomentumStocks #nisheshjani #AhmedabadNest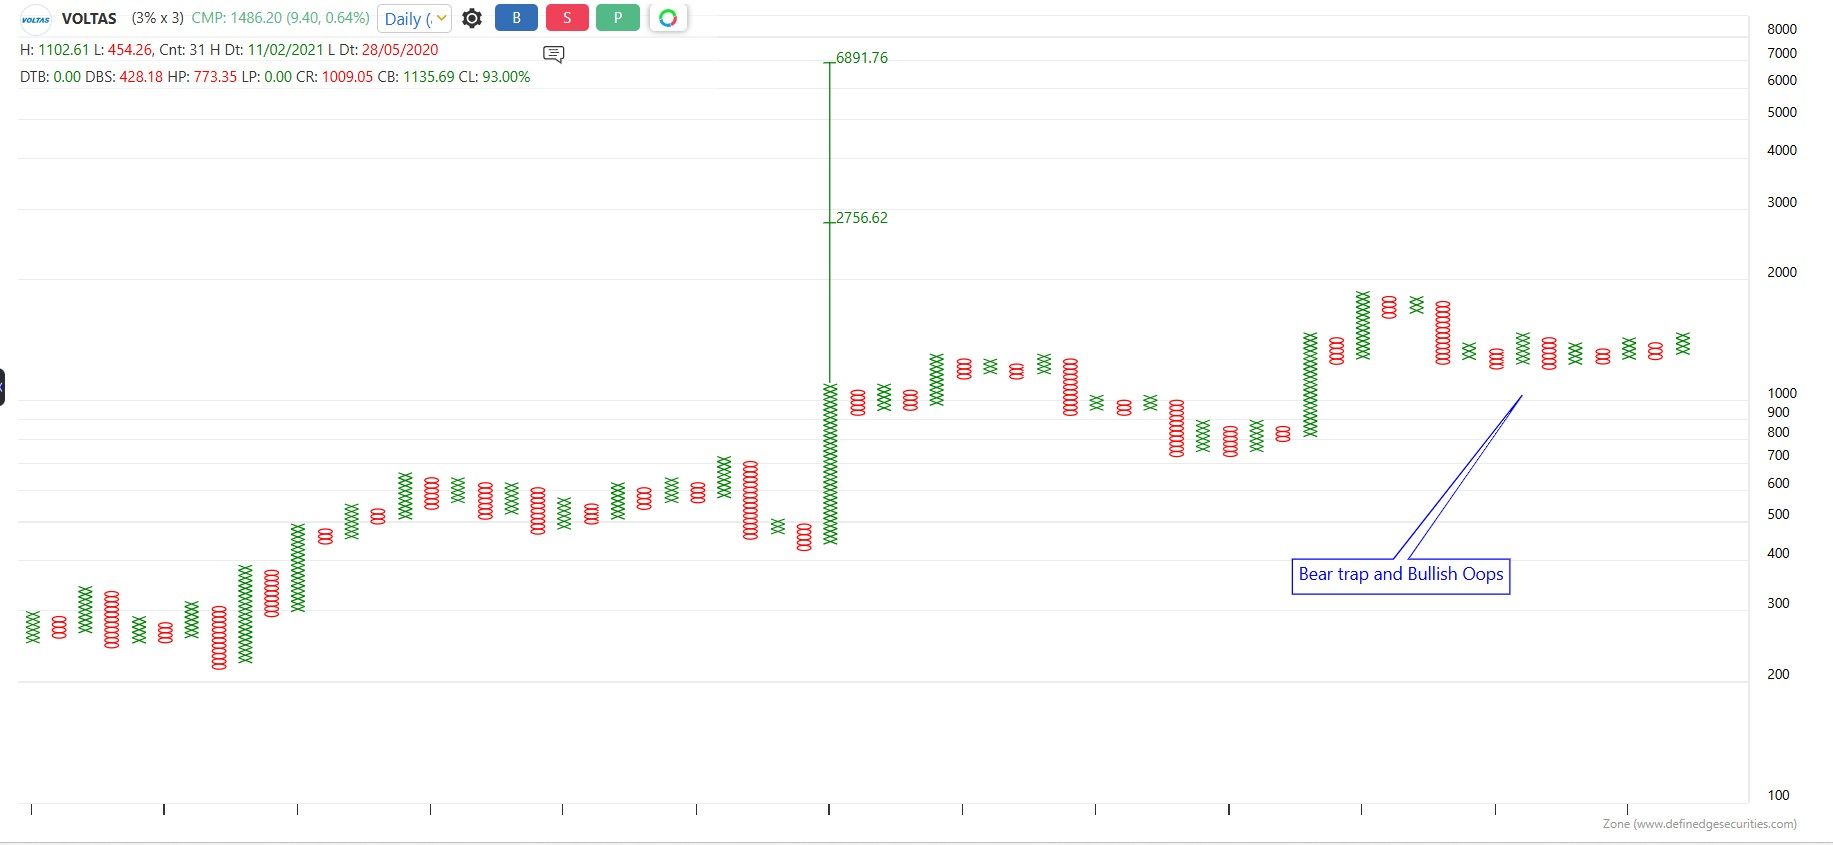
CHOLAFIN | #VGM Technical Strength Setup
CHOLAFIN | #VGM Technical Strength Setup
is displaying a high-quality VGM setup — a classic DTB after consolidation, aligning perfectly with our strength-filtering framework.
What makes this setup powerful?
Last 2 columns did NOT touch the MA of the Bullish MAST indicator
No immediate DBS, indicating healthy continuation structure
Last 3 columns holding ABOVE MAST
MA is rising, confirming trend maturity and strength
When these conditions align, history shows a high probability of double strength vs the broader market — making it one of the cleanest ways to identify and participate in strong, outperforming stocks with controlled risk.
️ Want to spot such setups early?
If you’re not already using the public VGM scanner on RZONE, do check it out,where all conditions are open to read
Strong structure. Strong relative strength. Disciplined participation.
Nishesh Jani,CFTe
#CHOLAFIN #VGM #MASTIndicator #RelativeStrength #Outperformance #TrendFollowing #IndianStockMarket #RZONE #SystemBasedTrading #TechnicalAnalysis #definedge #nisheshjani #AhmedabadNest

GLENMARK | Technical Breakout Update
has decisively broken out of a Falling Wedge — a classic bullish continuation / reversal pattern after a strong prior uptrend.
Falling Wedge breakout signals trend resumption
Indicates absorption of supply and renewed buying strength
Structure supports a potential 30% upside over the coming phase
Path opens for higher levels ahead
🧭 Actionable Insight:
Traders & investors can keep on radar Trade as per your own system
Trend paused, digested gains, and is now preparing for the next leg higher.
Nishesh Jani,CFTe
#GLENMARK #TechnicalBreakout #FallingWedge
#IndianStockMarket #MomentumStocks #PriceAction
#StockOnRadar #TradeWithDiscipline #MarketStructure #nisheshjani #AhmedabadNest 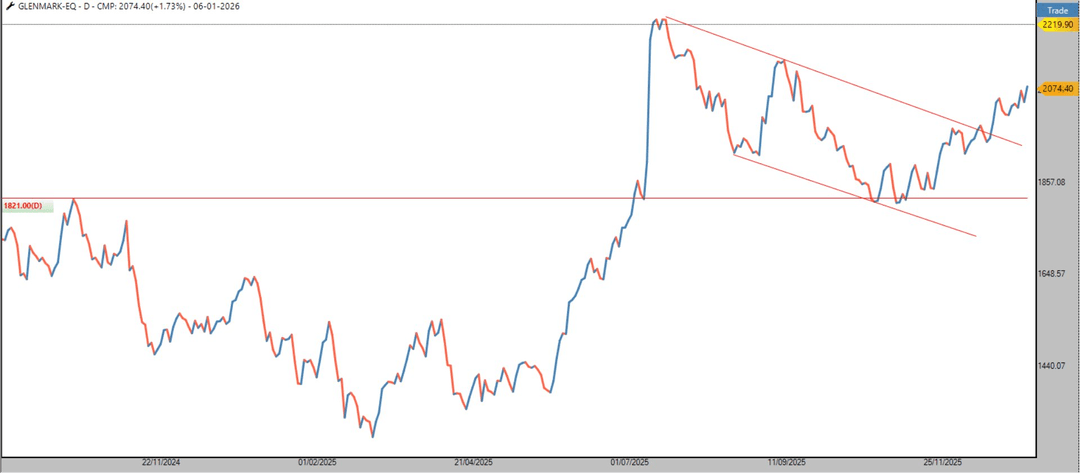
MSUMI Bullish Technical Setup
MSUMI Bullish Technical Setup
is a leading Indian manufacturer of automotive wiring harnesses and electrical distribution systems, playing a critical role in ICE, EV, and next-gen mobility platforms.
Technical View:
The stock failed to give a bearish anchor follow-through and has now negated that setup, which strengthens the bullish bias.
As long as ₹43 holds on a closing basis, the structure remains constructive.
Upside Levels to Watch:
️ ₹62 – near-term objective
️ ₹92 – structural target on sustained momentum
Actionable Insight:
Traders and investors can keep MSUMI on their radar and participate strictly as per their own trading/investment systems with disciplined risk management.
Theme: Auto Ancillaries | EV Play | Relative Strength Improving
Nishesh Jani,CFTe
#MSUMI #AutoAncillary #EVTheme #BullishSetup #TechnicalAnalysis #IndianStocks #MomentumInvesting #StockMarketIndia #TradeWithDiscipline #nisheshjani #AhmedabadNest 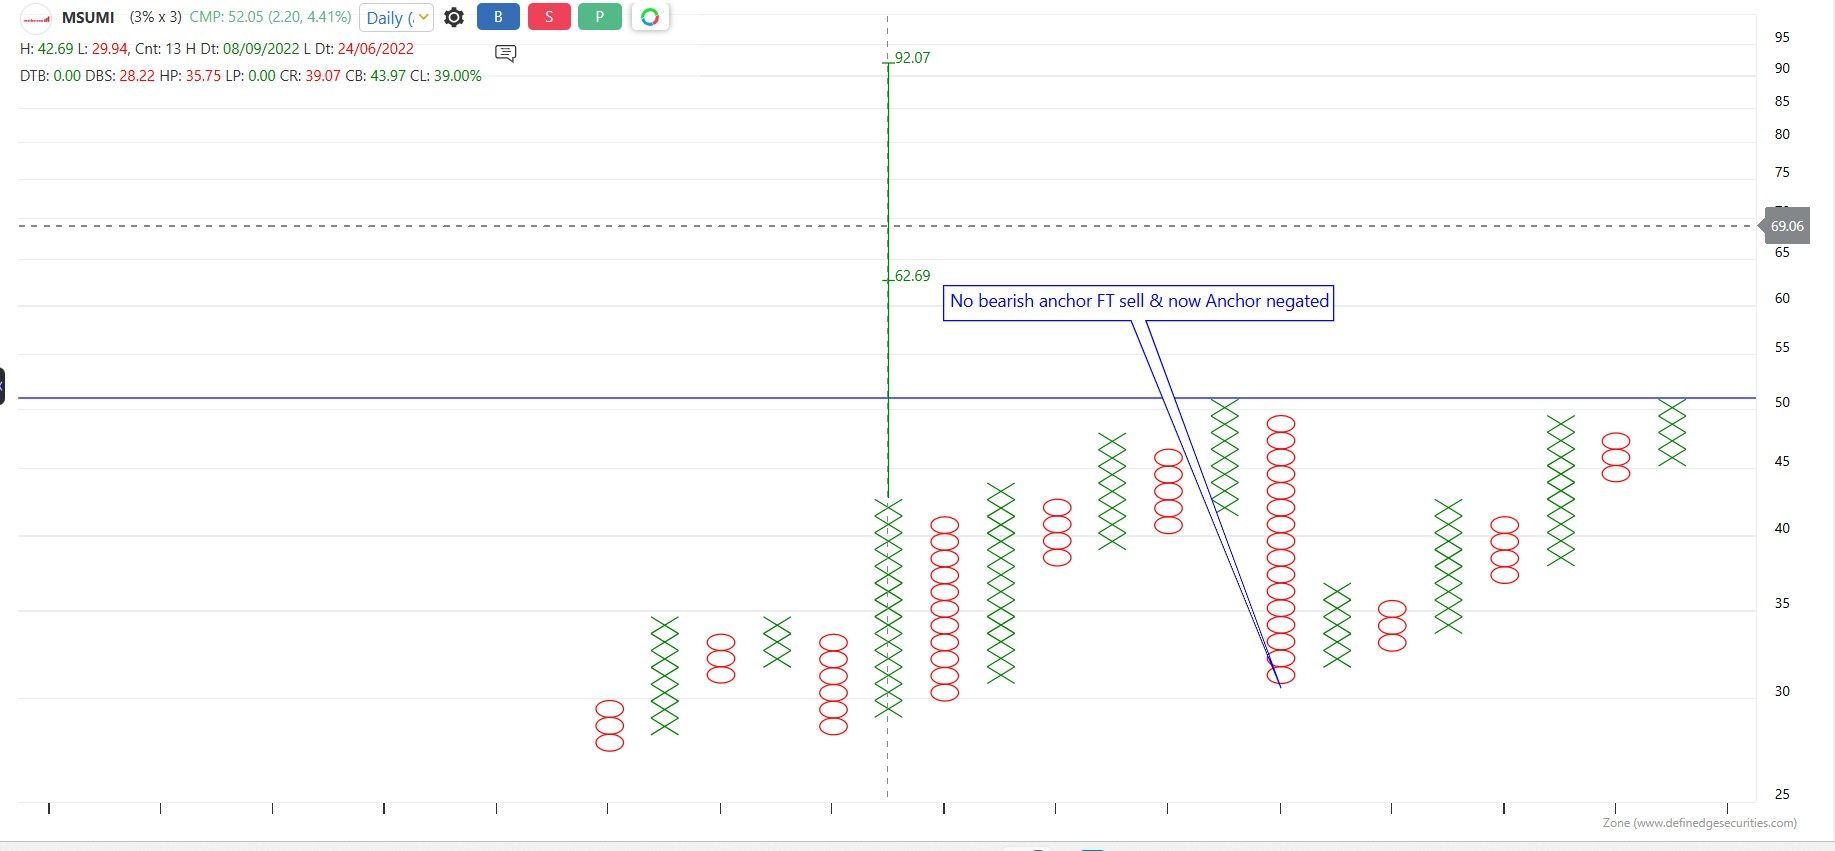
Voltas Technical + Fundamental Setup
After correcting nearly 40% from its peak, itappears to have completed a base formation and is now attempting an upside breakout from a consolidation box. This structure suggests renewed momentum, with a potential move towards a fresh ATH
Upside Potential: From current levels around ₹1,484, the setup indicates a ~30% rally if the breakout sustains.
Business Strength:
• Market leader in air-conditioners & consumer durables
• Strong presence in MEP & EPC HVAC projects
• Exposure to industrial engineering (textile & mining)
• Growth lever via Voltas Beko JV in home appliances
Conclusion: A classic post-correction base + breakout attempt aligned with a fundamentally strong franchise.
Investors & traders: Keep the stock on radar and trade strictly as per your system and risk framework.
Nishesh Jani,CFTe
#Voltas #TechnicalBreakout #BaseFormation #ConsumerDurables #IndianStocks #TrendFollowing #MomentumInvesting #StockOnRadar #nisehshjani #AhmedabadNest 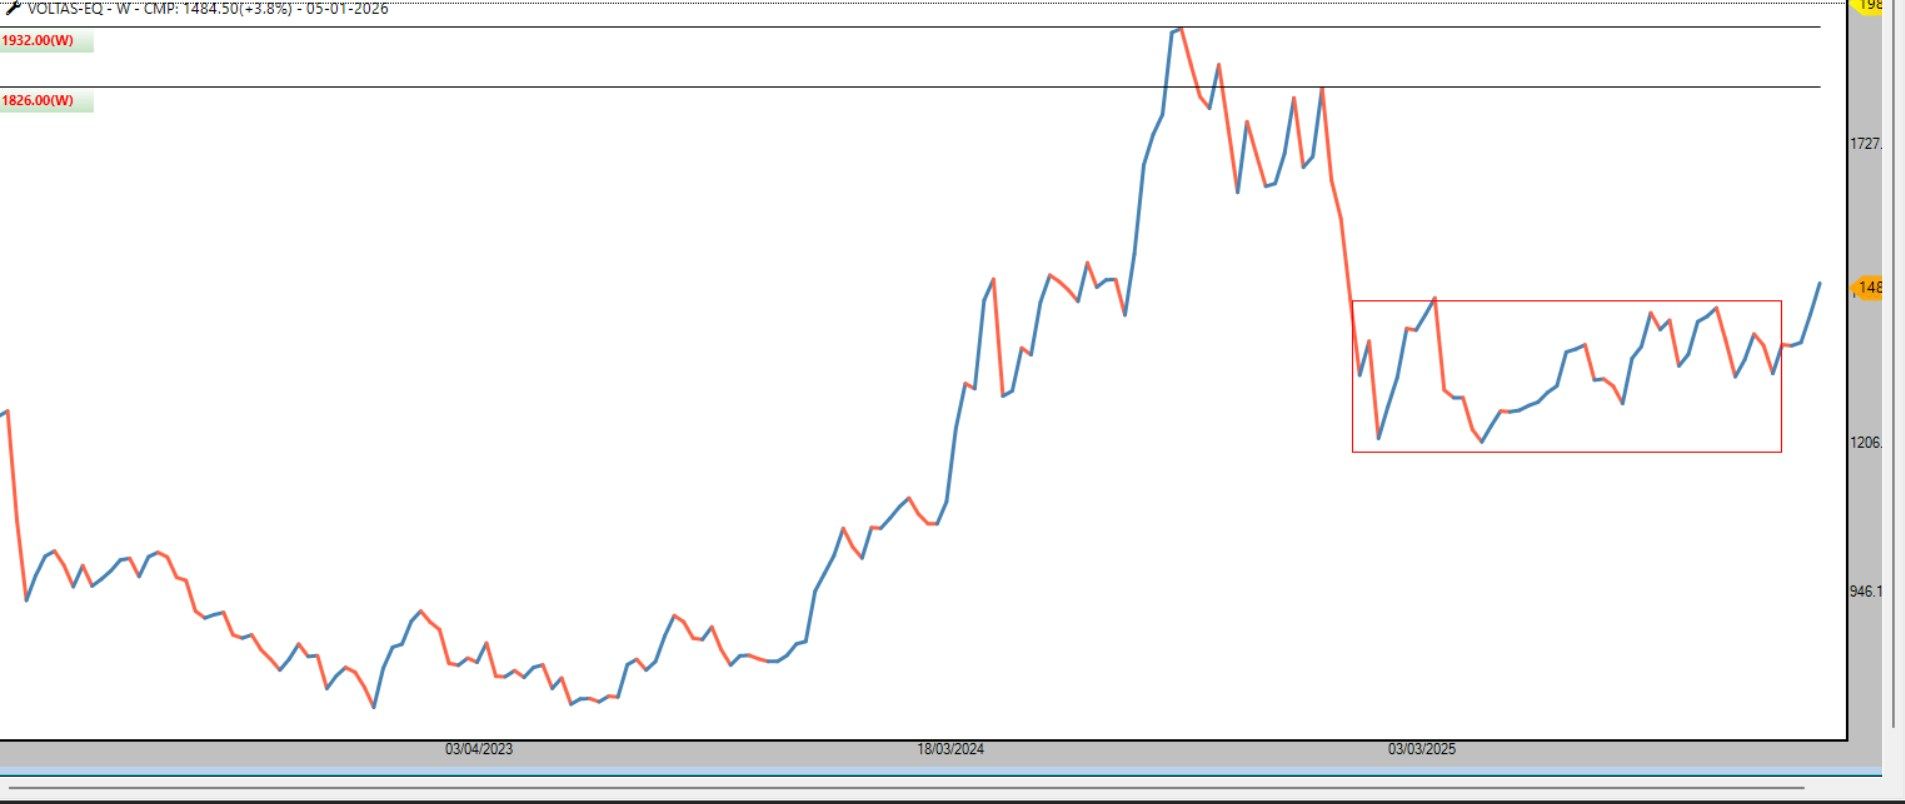
Aether Industries Ltd | Technical + Business Snapshot
a specialty chemicals company manufacturing advanced intermediates for pharma, agrochemicals, material science, coatings, additives, and oil & gas, with strong capabilities in CRAMS & contract manufacturing.
Technical View:
Stock has formed a Bullish Oops pattern
Breakout from the largest bearish 45° trendline indicates trend reversal
Structure suggests a potential move towards ATH and ₹1300
View remains positive as long as price holds ₹795 on a closing basis
Investors & traders: Keep this stock on radar and trade as per your own system with disciplined risk management.
Nishesh Jani,CFTe
#AetherIndustries #SpecialtyChemicals #TechnicalAnalysis #BreakoutStocks #BullishSetup #StockMarketIndia #Investing #TradingSetup #nisheshjani #AhmedabadNest 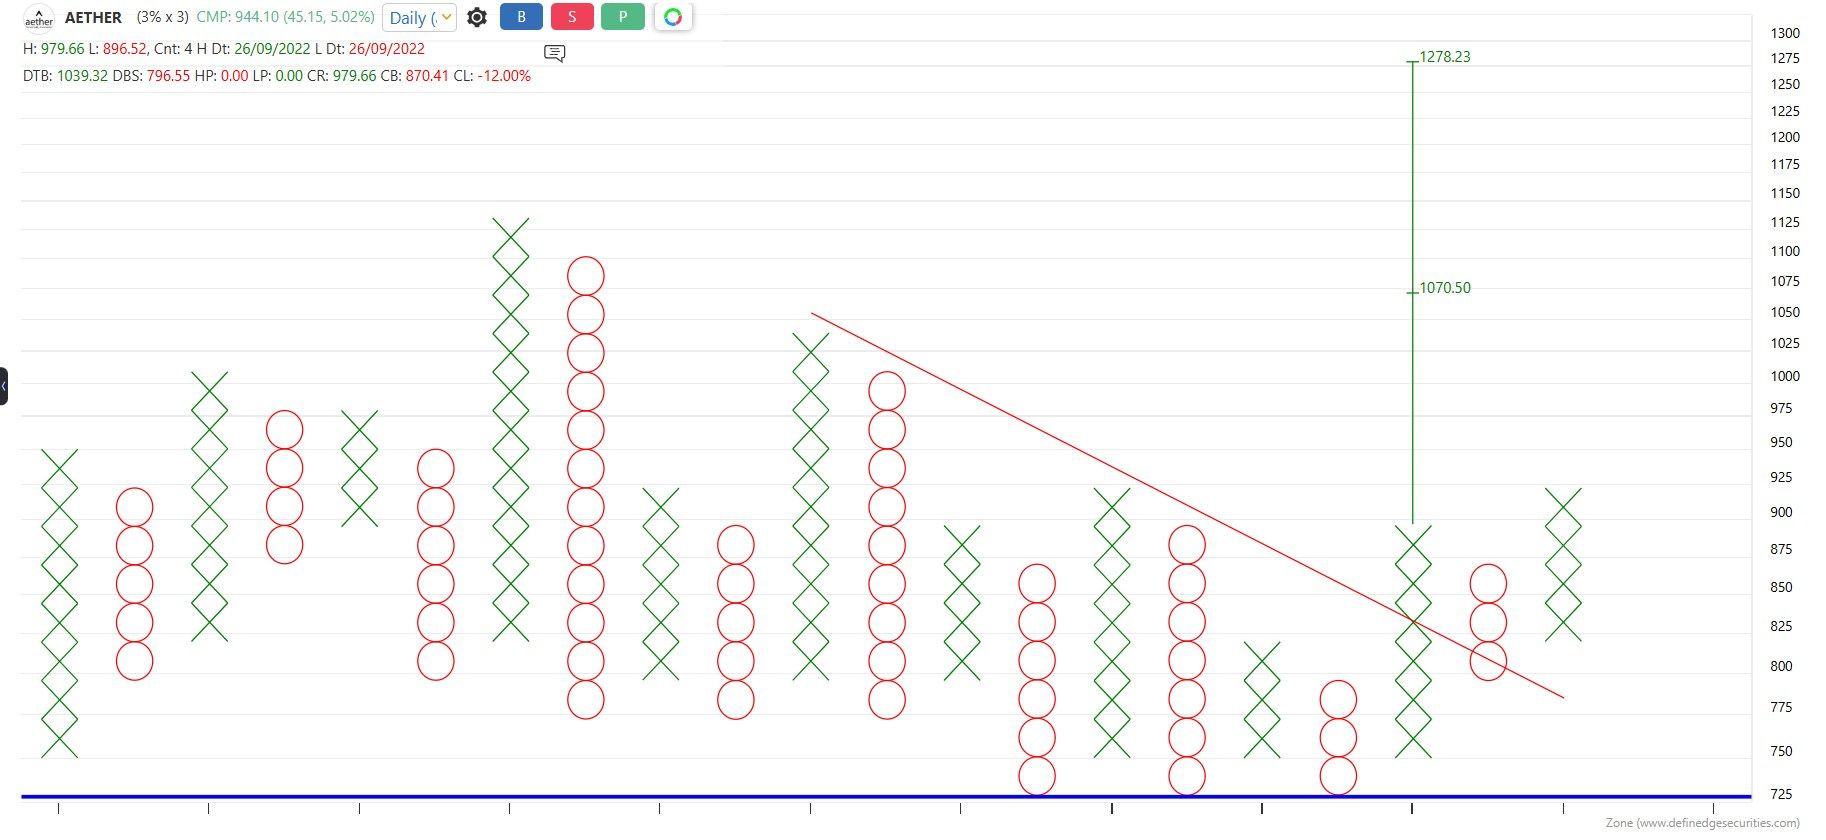
#VGM Update | CHOLAFIN – Momentum Re-ignites
#VGM Update | CHOLAFIN – Momentum Re-ignites
Cholamandalam Finance continues to strengthen its Value–Growth–Momentum profile with fresh technical developments
Positive Column Reversal confirms renewed demand
RS chart in consolidation, likely shaping a Bullish ABC structure
Price breakout from Turtle consolidation – a classic trend-following signal
Open vertical counts pointing towards 2500 & 2700
With consolidation resolving on both price and relative strength, #CHOLAFIN remains firmly on the radar for momentum-oriented traders and investors.
As always, trade as per your system and risk framework.
Nishesh Jani,CFTe
#IndianStockMarket #StocksToWatch #TechnicalAnalysis #MomentumStocks #BreakoutStocks #SwingTrading #InvestingIndia #NSE #TrendFollowing #nisheshjani #AhmedabadNest 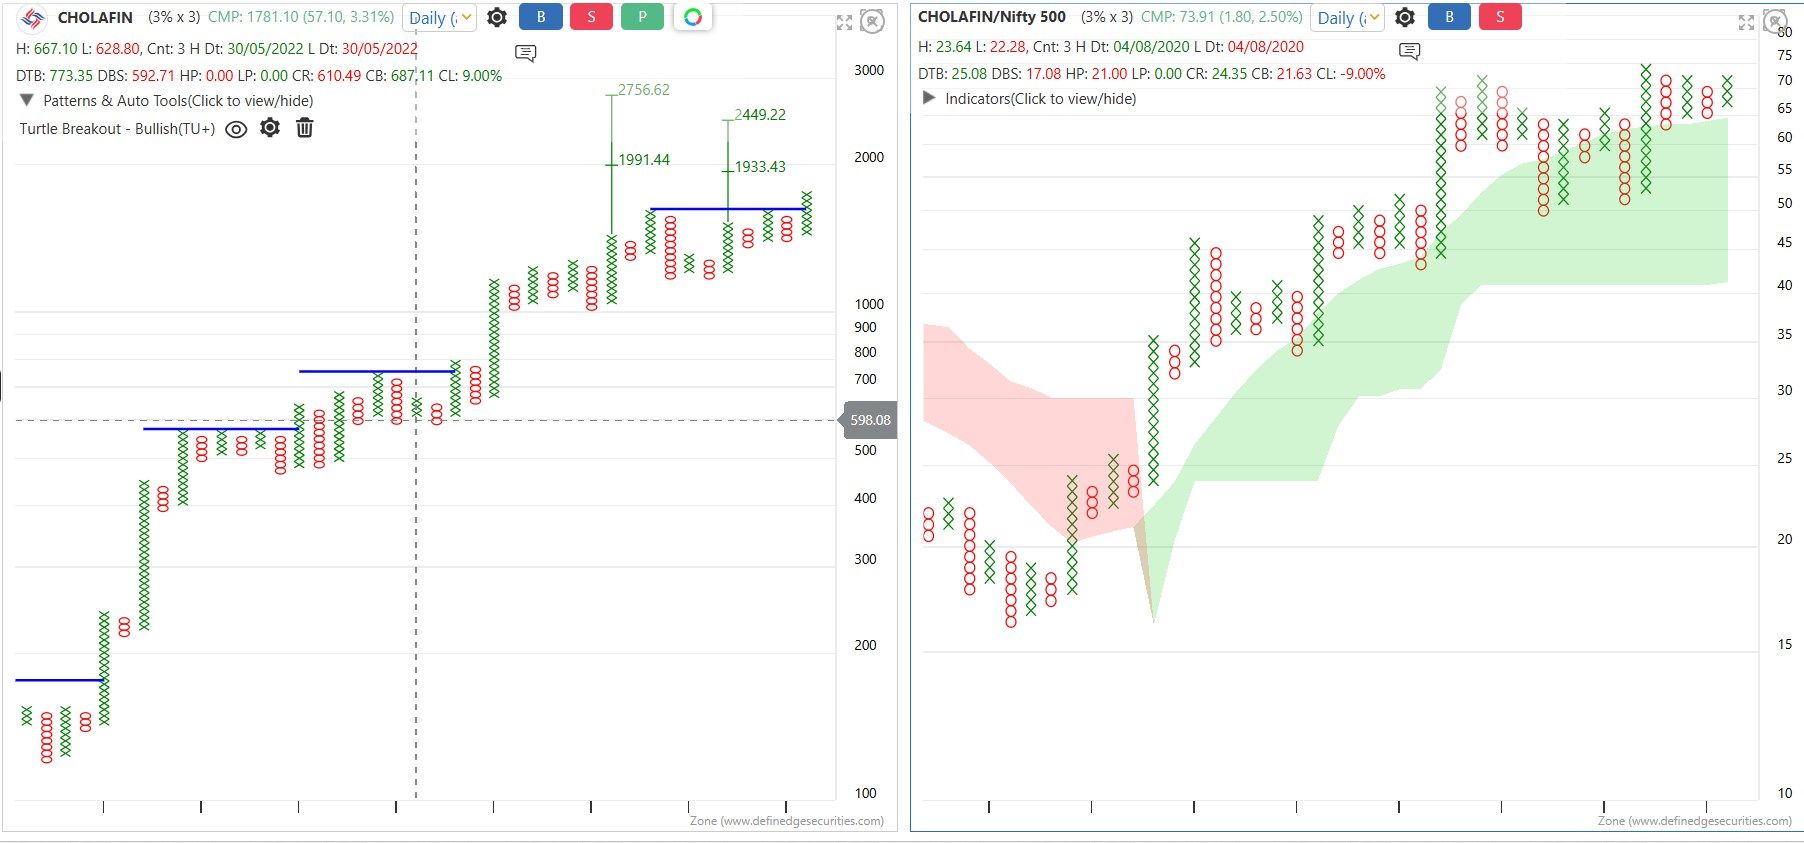
APL APOLLO | Long-Term Structural Breakout Watch
products are a backbone of modern infrastructure—used extensively in buildings, bridges, transmission towers, solar plants, and large-scale industrial projects. This makes the company a direct play on India’s long-term infrastructure and energy transition story.
Technical View
After spending nearly 2 years in a broad consolidation range, the stock is now attempting a decisive breakout. Such long consolidations often act as strong bases for meaningful trending moves.
 Key Observation
Sustained strength above the consolidation zone can open the door for a fresh expansion phase
Potential upside projections lie around 2600 and 3800, implying significant scope from current levels if the breakout sustains
Strategy Note
Both investors and traders can keep APL Apollo on their radar and participate strictly as per their own trading or investment system, with disciplined risk management.
As always, price action will be the final guide—let the market confirm the move.
Nishesh Jani,CFTe
#APLAPOLLO #TechnicalAnalysis #BreakoutWatch #InfrastructureTheme #IndiaGrowthStory #PriceAction #StockMarketIndia #TrendFollowing #nisheshjani #AhmedabadNest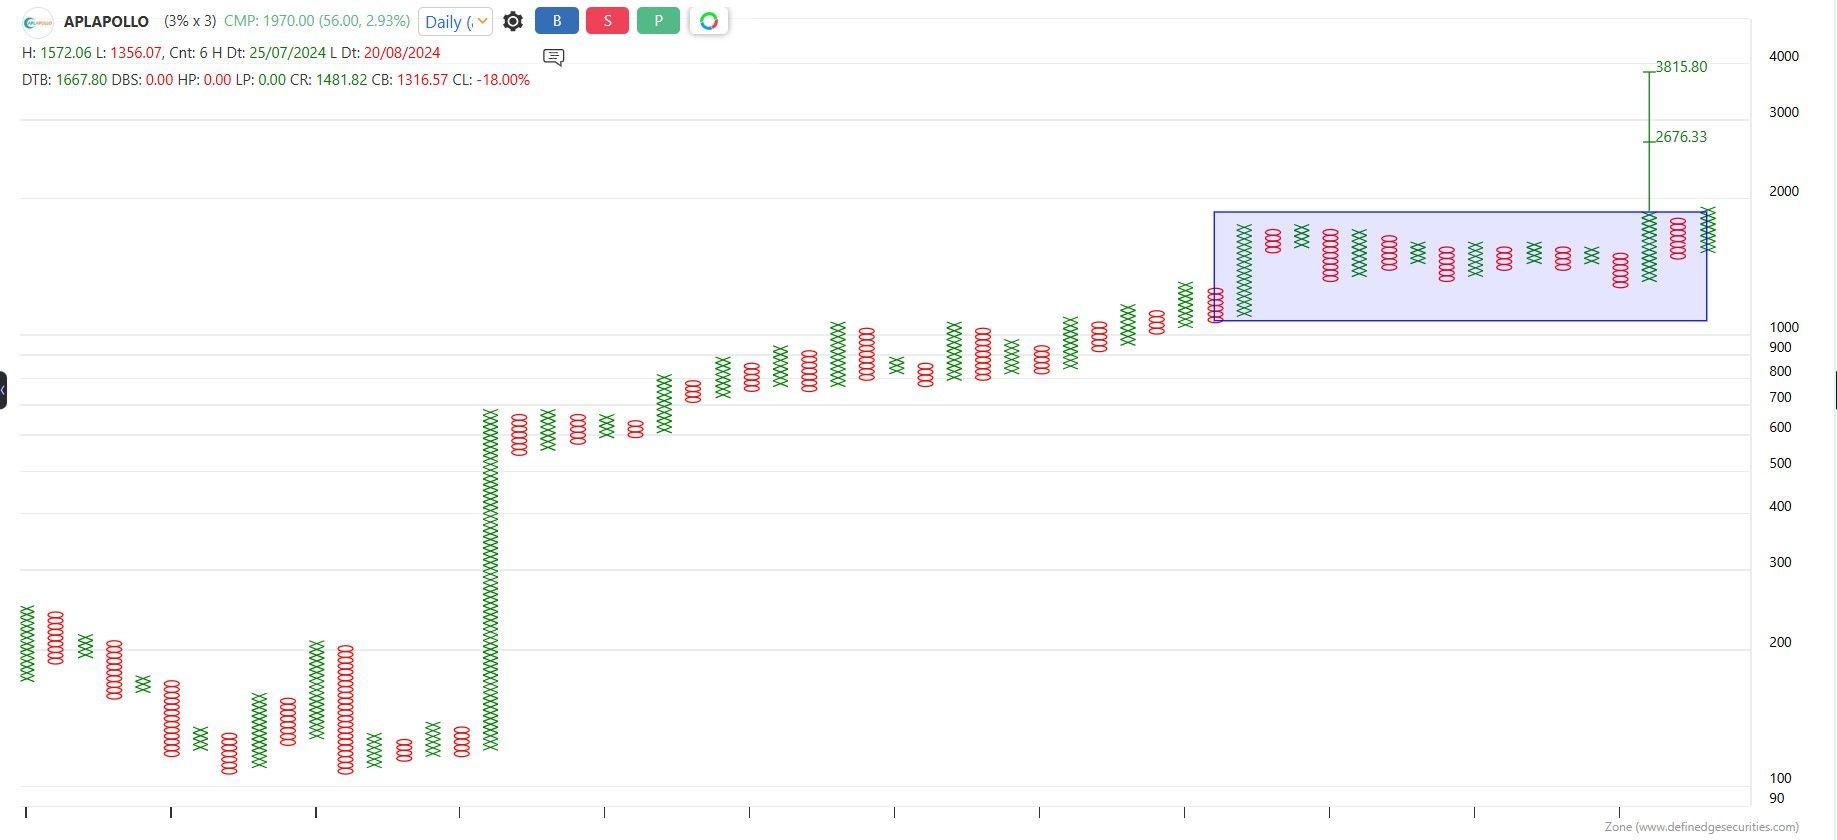

INDUS TOWERS | Structural Bullish Setup
India’s largest telecom tower company, plays a critical role in the country’s digital and urban infrastructure. Beyond telecom towers, the company is actively involved in smart city infrastructure (smart poles, CCTV, public Wi-Fi), green technology initiatives (solar-powered sites), and advanced Tower Operations Centers—making it a long-term digital infrastructure play.
Technical View
A well-defined OPPS bullish pattern has formed near the 300 zone, indicating strong base formation
The stock is now trading near its all-time high (ATH), a zone where leadership stocks often emerge
A decisive breakout above ATH can trigger the next momentum leg
Upside Potential
Post breakout, the structure suggests a potential move towards 900+ over time
🧭 Strategy Note
Both traders and investors can keep INDUS TOWERS on their radar and participate strictly as per their own trading system and risk framework.
Let price lead and discipline follow.
Nishesh Jani,CFTe
#INDUSTOWERS #TechnicalAnalysis #BullishSetup #DigitalInfrastructure #SmartCities #GreenEnergy #BreakoutStocks #PriceAction #nisheshjani #AhmedabadNest
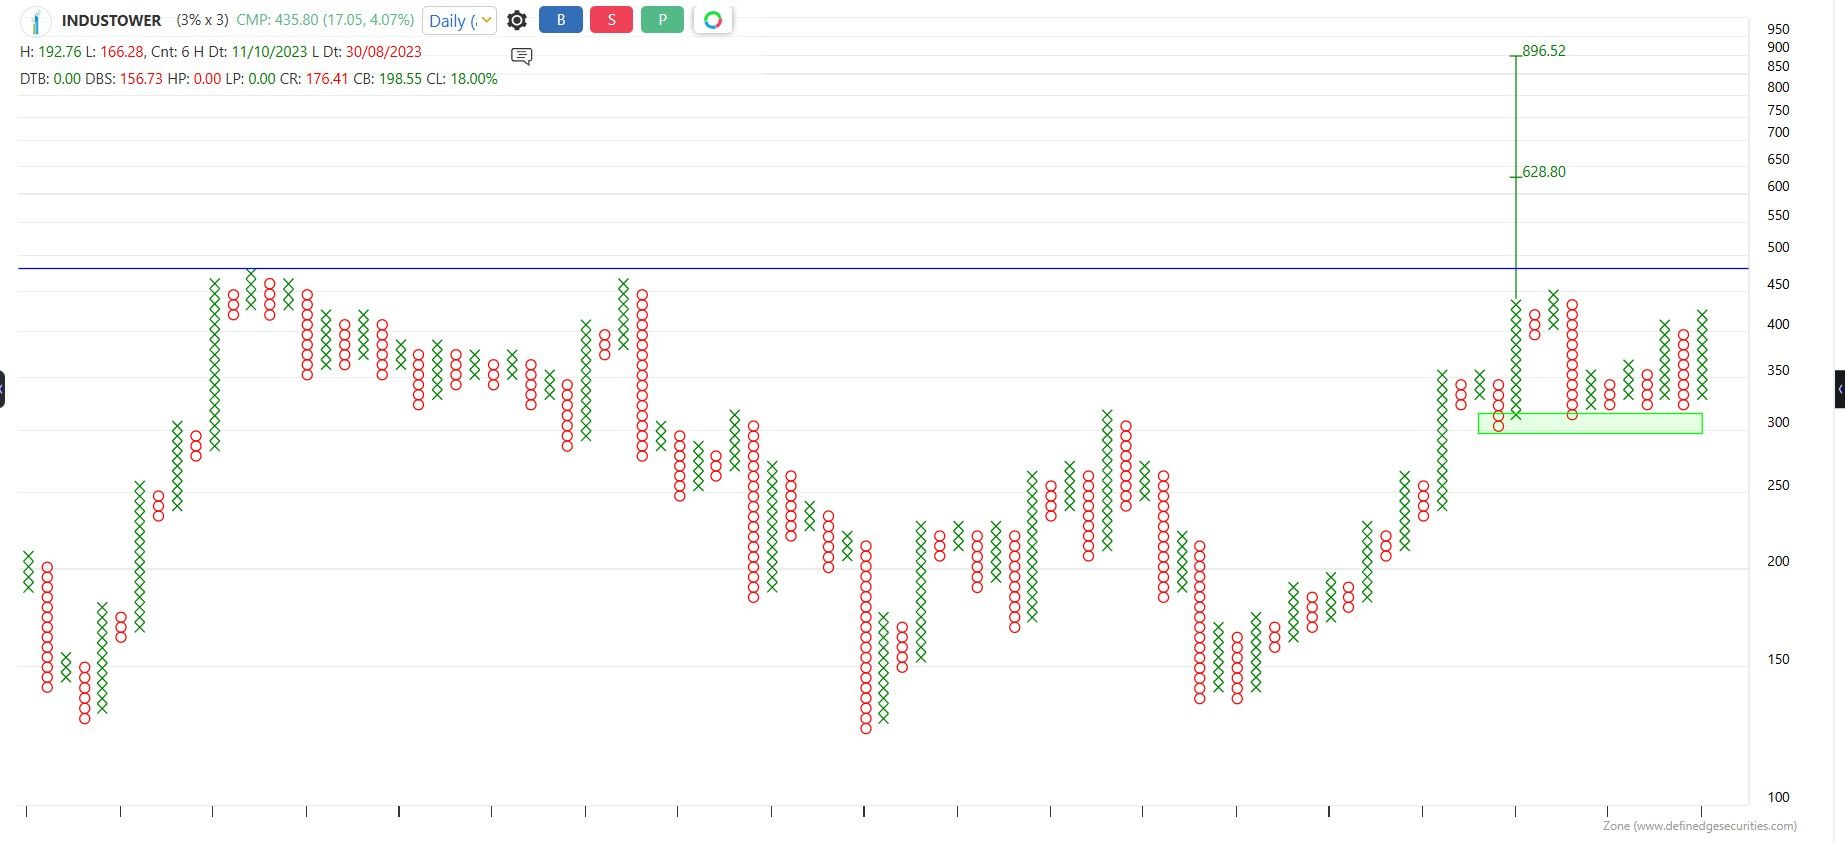
 ️ GMRAIRPORT – Ready for Takeoff?
️ GMRAIRPORT – Ready for Takeoff?
After spending decades consolidating below its all-time highs, GMRAIRPORT, a major global airport platform, is now showing signs of a structural turnaround.
Technical View:
Price structure indicates a long-term breakout setup
As long as the stock holds above ₹97 on a closing basis, the trend remains constructiveand fresh up-move towards ₹160 and beyond
Bigger Picture:
With increasing air traffic, infrastructure expansion, and India’s growing role in global aviation, airport platforms remain a strong structural theme over the long term.
Actionable Insight:
Keep GMRAIRPORT on radar and participate strictly as per your trading/investment system with proper risk management.
Nishesh Jani,CFTe
#GMRAIRPORT #AviationSector #InfrastructureTheme #TechnicalAnalysis #BreakoutStocks #IndianMarkets #LongTermSetup #nisheshjani #AhmedabadNest 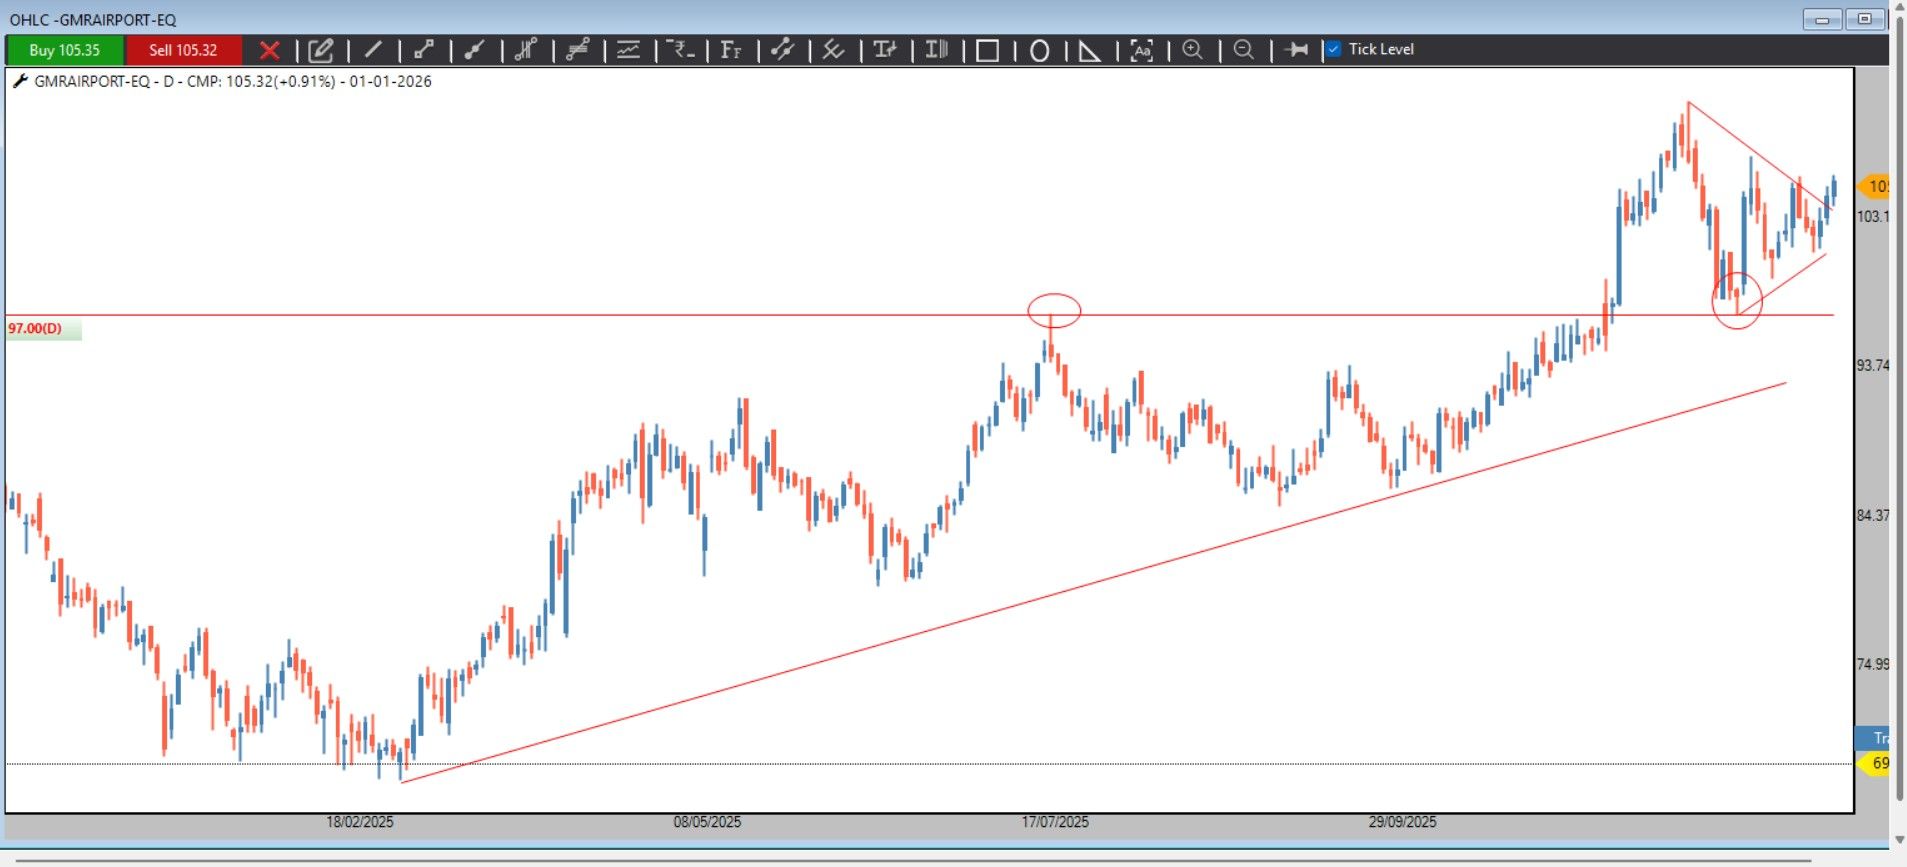
JSL | Technical & Sectoral View
is showing signs of a fresh breakout attempt towards its ATH, backed by a structurally strong stainless steel industry.
As long as the stock holds above ₹700 on a closing basis, the setup remains constructive, with cluster-based upside projections extending towards ₹1800 over the medium to long term.
From an industry perspective, JSL caters to multiple high-growth segments, including:
Automotive, Railways & Transport (ART)
Architecture, Building & Construction (ABC)
Chemical & Petrochemical industries
Capital Goods
Kitchenware & Food Processing
SS continues to be one of the fastest-growing metals globally, driven by diversification beyond traditional usage, adding fundamental strength to the technical structure.
The stock can be kept on radar and traded strictly as per one’s own system and risk management.
Nishesh Jani,CFTe
#JSL #JindalStainless #StainlessSteel #TechnicalAnalysis #BreakoutStocks #MetalStocks #PriceAction #StockMarketIndia #SectoralTrends #nisheshjani #AhmedabadNest 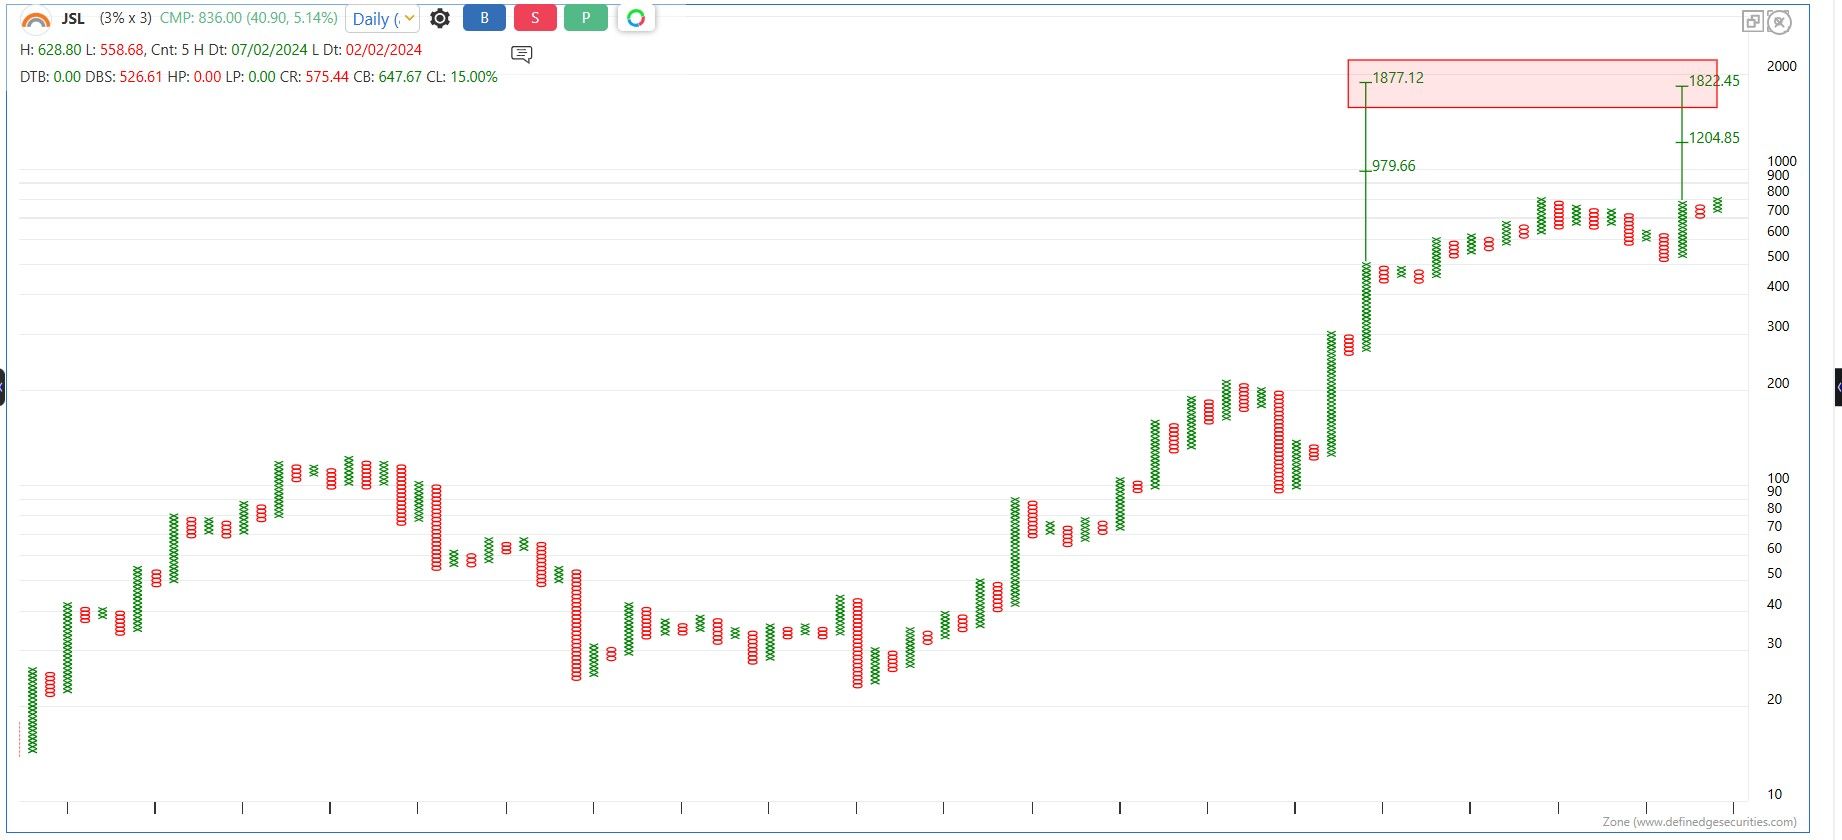
BPCL | Technical Breakout Update
BPCL | Technical Breakout Update
BPCL has confirmed a clean breakout from a well-formed rounding base (Cup & Handle pattern)—a classic sign of accumulation and trend continuation.
The structure suggests strong upside potential towards 460 and beyond
As long as the stock holds above 350 on a closing basis, the bullish setup remains intact
Traders can keep BPCL on their radar and participate strictly as per their own trading system and risk management rules
As always, price structure and follow-through will be key. Let the market validate the move.
Nishesh Jani,CFTe
#BPCL #TechnicalAnalysis #CupAndHandle #ChartPatterns #StockMarketIndia #TrendFollowing #PriceAction #TradingSetup #InvestingEducation #nisheshjani #AhmedabadNest 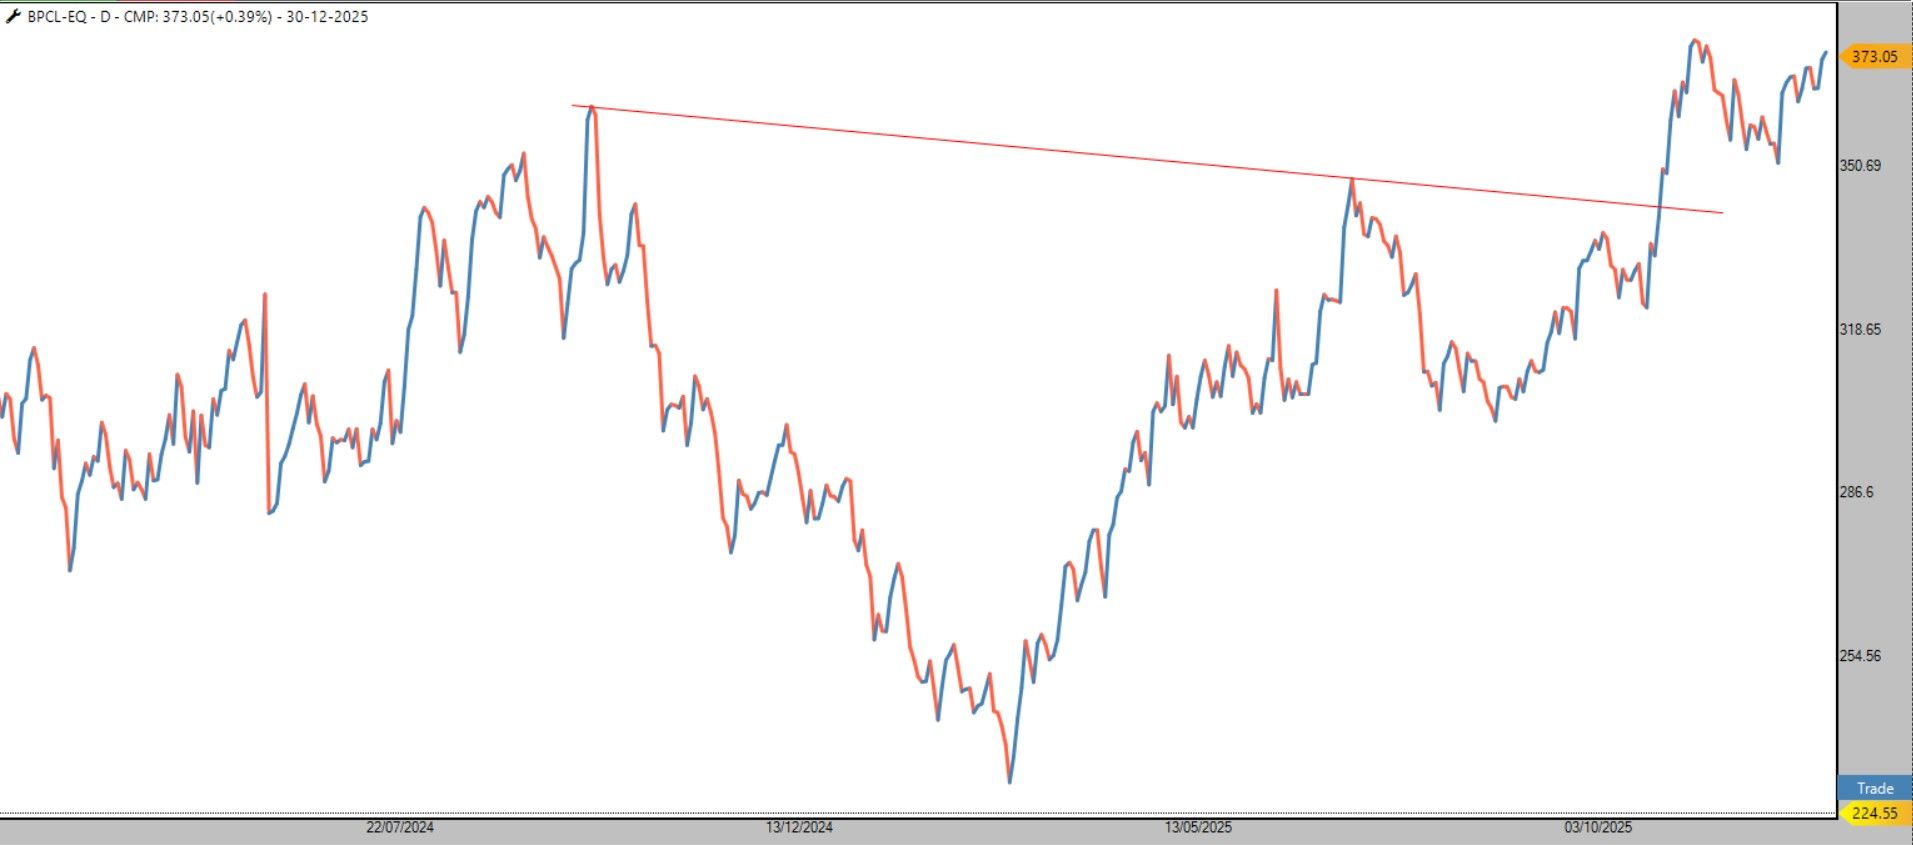
DIXON | Technical Risk Alert
After a strong run, DIXON now shows clear signs of distribution at higher levels. The bearish follow-through is active, indicating that smart money may have already exited.
Technical structure suggests a high probability of a 30%+ correction from recent highs.
Momentum and price behavior indicate the stock may remain out of market fancy for some time.
️ This phase calls for capital protection over return chasing.
For traders and investors, it’s important to respect the trend and avoid emotional bias. Sometimes, staying on the sidelines is also a strategy.
Nishesh Jani,CFTe
#DIXON #TechnicalAnalysis #MarketStructure #RiskManagement #CapitalProtection #BearishTrend #PriceAction #SmartMoney #StockMarketIndia #TradingDiscipline #StayObjective #nisheshjani #AhmedabadNest 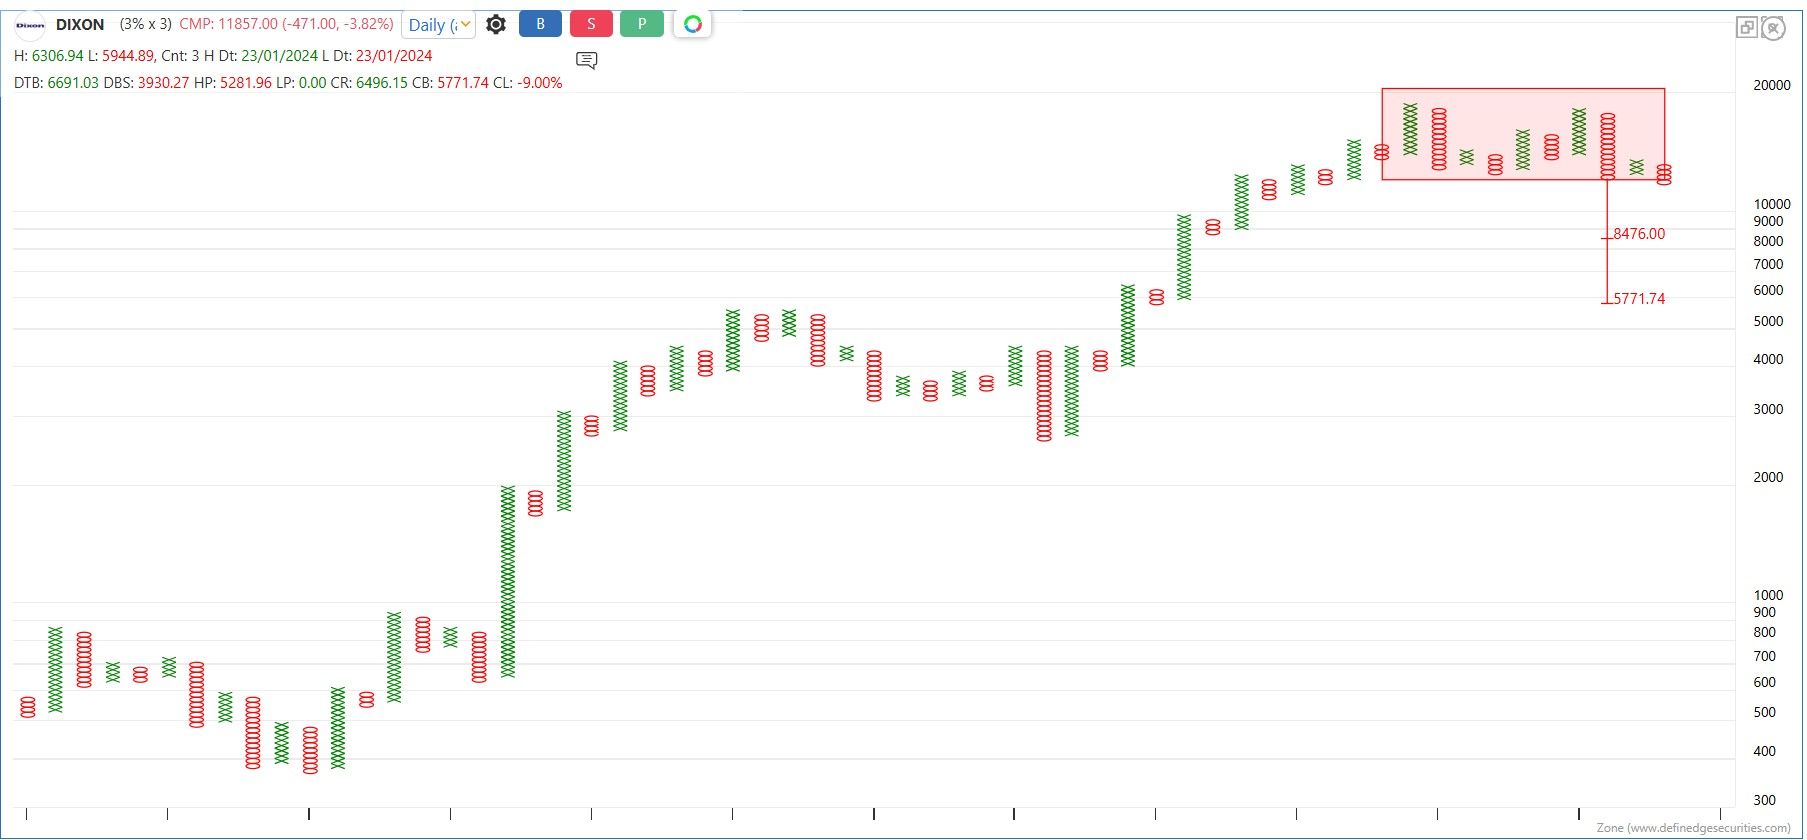
HEG | Structural Strength Emerging
HEG is a leading manufacturer of graphite electrodes, a critical input for steel production. With metals demand expected to improve, the company stands to benefit from a cyclical upturn in the steel value chain.
From a price-structure perspective, the stock is showing constructive signs. Multiple open vertical counts project potential towards 1000 and 1300. The recent negation of a bearish anchor column further strengthens the bullish setup.
Traders and investors can keep HEG on their radar and align positions as per their individual systems, as long as the stock holds the key level of 454 on a closing basis.
Not a recommendation.
Nishesh Jani,CFTe
#HEG #GraphiteElectrodes #SteelSector #Metals #TechnicalAnalysis #PriceStructure #StockMarket #TrendFollowing #nisheshjani #AhmedabadNest 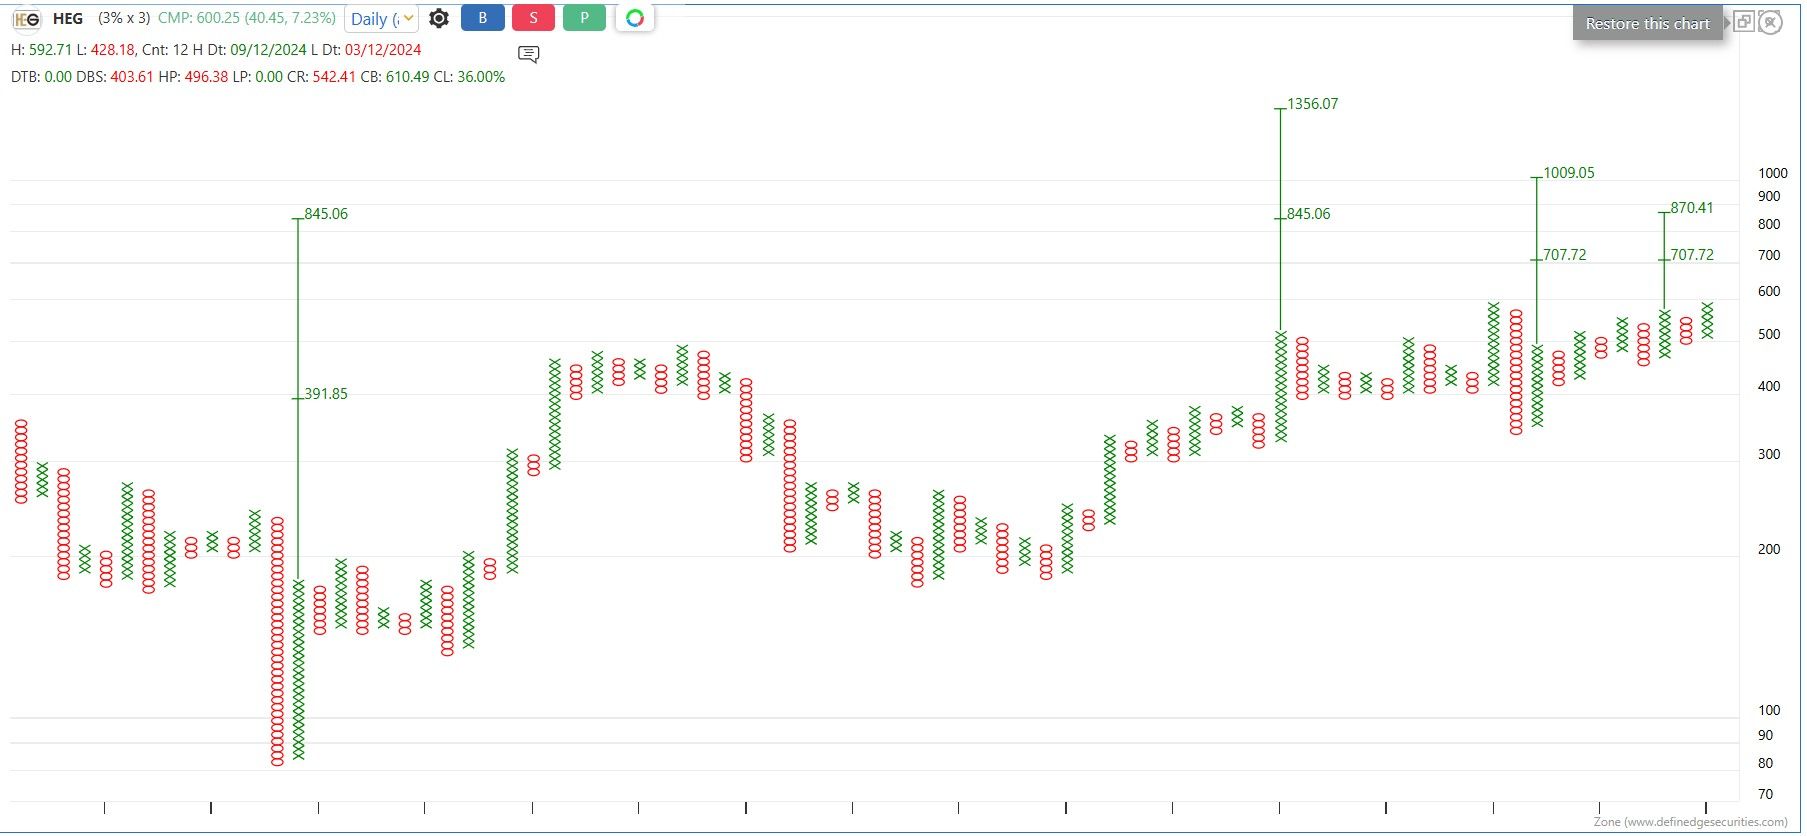
Index Strength vs Investor Stress: The Hidden Market Damage
While headline indices continue to project strength, the internal picture tells a very different story.
Nifty MicroCap is down ~20% from ATH
Nifty SmallCap is down ~15% from ATH
Nifty is hovering near all-time highs
India VIX is close to all-time lows
The real stress is clearly visible beneath the surface — concentrated in small and micro-cap stocks. This divergence often goes unnoticed by investors focused only on index levels.
In several of my earlier posts, I have consistently cautioned against exposure to small & micro caps during this phase and emphasized gradual accumulation of diversified ETFs instead. In such environments, risk management and capital preservation matter far more than chasing short-term returns.
Markets reward patience, discipline, and respect for market structure.
Nishesh Jani,CFTe
#MarketStructure #RiskManagement #CapitalPreservation #ETFs #MarketCycles #InvestorAwareness #nisheshjani #AhmedabadNest
When Narratives Clash, Let the Charts Speak
Two contrasting schools of thought are currently shaping the market discourse.
One emphasizes patience, structural growth, and long-term participation.
The other focuses on excesses, stretched pricing, and the risks of complacency.
Both perspectives carry merit. Markets are complex, adaptive, and rarely one-dimensional.
From a technical perspective, labels matter less than evidence. Price, trend, and participation continue to offer the most objective feedback. Rather than aligning emotionally with any narrative, it pays to observe, measure, and respond.
In the end, price action remains the final arbiter. Staying flexible and unbiased is often the strongest edge.
Nishesh Jani,CFTe
#MarketWisdom #TechnicalPerspective #PriceAction #RiskAwareness #AdaptiveThinking #TradingDiscipline
#nisheshjani
#AhmedabadNest
“When Calm Becomes Risk: Understanding Sub-10 India VIX”
India VIX has slipped below 10 — a zone that demands heightened caution, especially for option writers.
While low VIX is often interpreted as comfort and stability, history tells a different story.
Sub-10 VIX levels have frequently marked complacency zones, where markets appear calm but are actually setting up for sudden expansion in volatility.
Key insight:
Ultra-low VIX reflects suppressed option premiums and crowd consensus.
This is often the phase where choppy consolidation ends.
What follows is usually a swift, directional trend, catching option writers off-guard due to rapid volatility repricing.
️ Risk management matters more than strategy here:
Avoid over-leveraging short premium positions
Keep defined risk, wider hedges, and flexible exits
Focus on survival, not just decay
Markets reward discipline when complacency peaks.
Nishesh Jani,CFTe
#IndiaVIX #Volatility #OptionsTrading #RiskManagement #OptionWriters #MarketCycles #TradingEducation #StayHedged #nisheshjani #AhmedabadNest
Index Rebalancing Update: Why I’m Focusing on ETFs in This Phase
Since the end of February, markets have been in a correction–rally–consolidation mode. In phases like this, instead of taking direct stock exposure, I prefer staying positioned through ETFs until my “Horny Bull Market Setup” triggers for fresh stock entries.
An important update for ETF investors:
NSE has announced major index rebalancing:
ALPHA 50 Index: 30% stocks replaced
MOMENTUM 50 Index: 48% stocks replaced
MIDSMALL Index: 68% stocks replaced
This is a powerful reminder that indices consistently remove underperformers and add outperformers.
If you are a technical trader or investor, ask yourself:
Are you rebalancing your portfolio with the same discipline?
Are you systematically exiting laggards and rotating into strength—just like the indices do?
In uncertain phases, ETFs provide efficient, rules-based exposure, allowing us to stay aligned with leadership without manually tracking every stock.
Stay systematic. Stay aligned with strength.
Nishesh Jani,CFTe
#SmartInvesting #IndexRebalancing #ETFStrategy #MomentumInvesting #TechnicalTrader #WealthWithDiscipline #nisheshjani #AhmedabadNest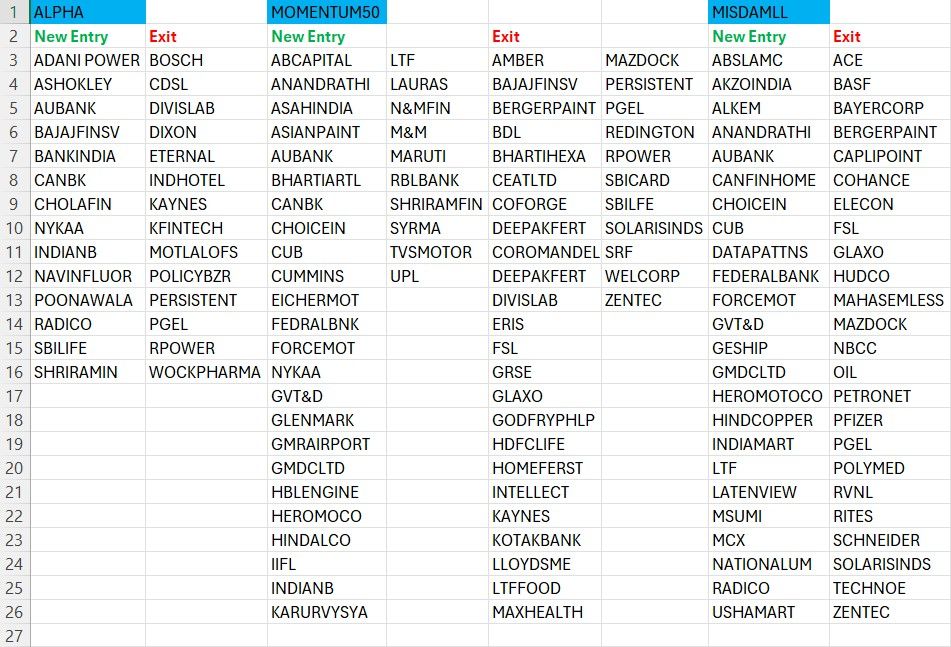
Market Health Check: Where Strength Lies & Where Caution Is Needed
Market Health Check: Where Strength Lies & Where Caution Is Needed
When we analyze how many stocks are down 25% or more from their 52-week highs, the picture becomes very clear:
Nifty 50 → Only 6% corrected
Strongest pocket of the market
Leadership, stability, institutional support
NiftyNext 50 → 22% corrected
Moderate strength
Selective opportunities
Midcap Index → 31% corrected
Mixed zone
Stock-specific strength, but caution needed
Smallcap Index → 51% corrected
Clear weakness
Broad stress, lack of follow-through buying
Microcap Index → 66% corrected
Deep risk zone
High volatility, low liquidity, avoid bottom-fishing
🧭 What This Means for Investors
Stay aligned with strength— Largecaps continue to show leadership and resilience.
Be selective in midcaps — Only quality and trend-supported names deserve capital.
Reduce exposure to smallcaps & microcaps— More than half the universe is in deep correction, signalling structural weakness.
Follow market trends, not hopes — Price damage this large usually reflects sentiment, liquidity, and fundamental concerns.
Simple Takeaway
Markets are telling you where to stay invested and where to step aside.
Strength = Nifty & quality largecaps
Risk = Smallcaps & microcaps
Let data guide decisions, not emotions.
Nishesh Jani,CFTe
#MarketUpdate #SmartInvesting #RiskManagement #MarketTrends #DataDrivenInvesting #StayWithStrength #nisheshjani #AhmedabadNest
Market Pause or Final Shakeout? Use Both to Your Advantage.
Market Pause or Final Shakeout? Use Both to Your Advantage.
We may not know whether the market will spend the next few weeks grinding sideways or give a final flush in small-caps and micro-caps. But what we do know is this: phases of uncertainty quietly create some of the best opportunities for disciplined investors.
That’s why we are gradually accumulating four high-quality factor & segment ETFs:
Kotak ALPHA ETF
Motilal Oswal MOMENTUM50 ETF
Mirae MIDSMALL ETF
Nippon MID150BEES
Why add now?
Because by the end of December, all ETFs undergo rebalancing — removing the weakest underperformers and adding stronger, improving names. This naturally aligns portfolios toward potential future leaders without emotional decision-making.
In simple terms:
Volatility gives you better entry points.
Rebalancing positions you toward strength.
Discipline compounds over time.
Stay patient. Stay systematic. Position for leadership — not noise.
Nishesh Jani,CFTe
#SmartInvesting #ETFs #MomentumInvesting #MidcapStrategy #WealthBuilding #MarketInsights #DisciplinedInvesting #FactorInvesting #NisheshJani #AhmedabadNest
RGD Countertrend Breadth Update — A Critical Point for Market Structure
Over the past few years, whenever our RGD breadth gauge crossed above the 300 oversold zone (May-June 2022 and Feb–Mar 2025), the market was in deep corrective phases. Both those periods eventually led to healthy rebounds
Today, breadth has once again reached that same oversold zone — but with one major difference:
the market is sitting near all-time highs, not in a downtrend.
This divergence makes the current setup far more nuanced and opens three clear paths ahead:
1️⃣ Short-Term Shakeout (5–7% pullback)
A mild correction to reset excess positioning, allow sectors to rotate, and improve market-wide risk-reward.
2️⃣ Time Correction (8–12 weeks of consolidation)
Markets hold higher levels while smallcaps and microcaps continue their flush-out phase. This would allow quality leadership to strengthen.
3️⃣ Liquidity-Driven Breakout
Fresh liquidity flows into market → breadth normalizes → indices achieve a decisive breakout above ATH with participation from from heavyweights sectors.
As always, we track breadth, liquidity, and sector rotation together to identify the most probable path — and adjust our strategy proactively rather than reactively.
Staying disciplined matters more than predicting.
Nishesh jani,CFTe
#MarketBreadth #RGDIndicator #MarketOutlook #RiskManagement #SmartInvesting #EquityResearch #nisheshjani #AhmedabadNest 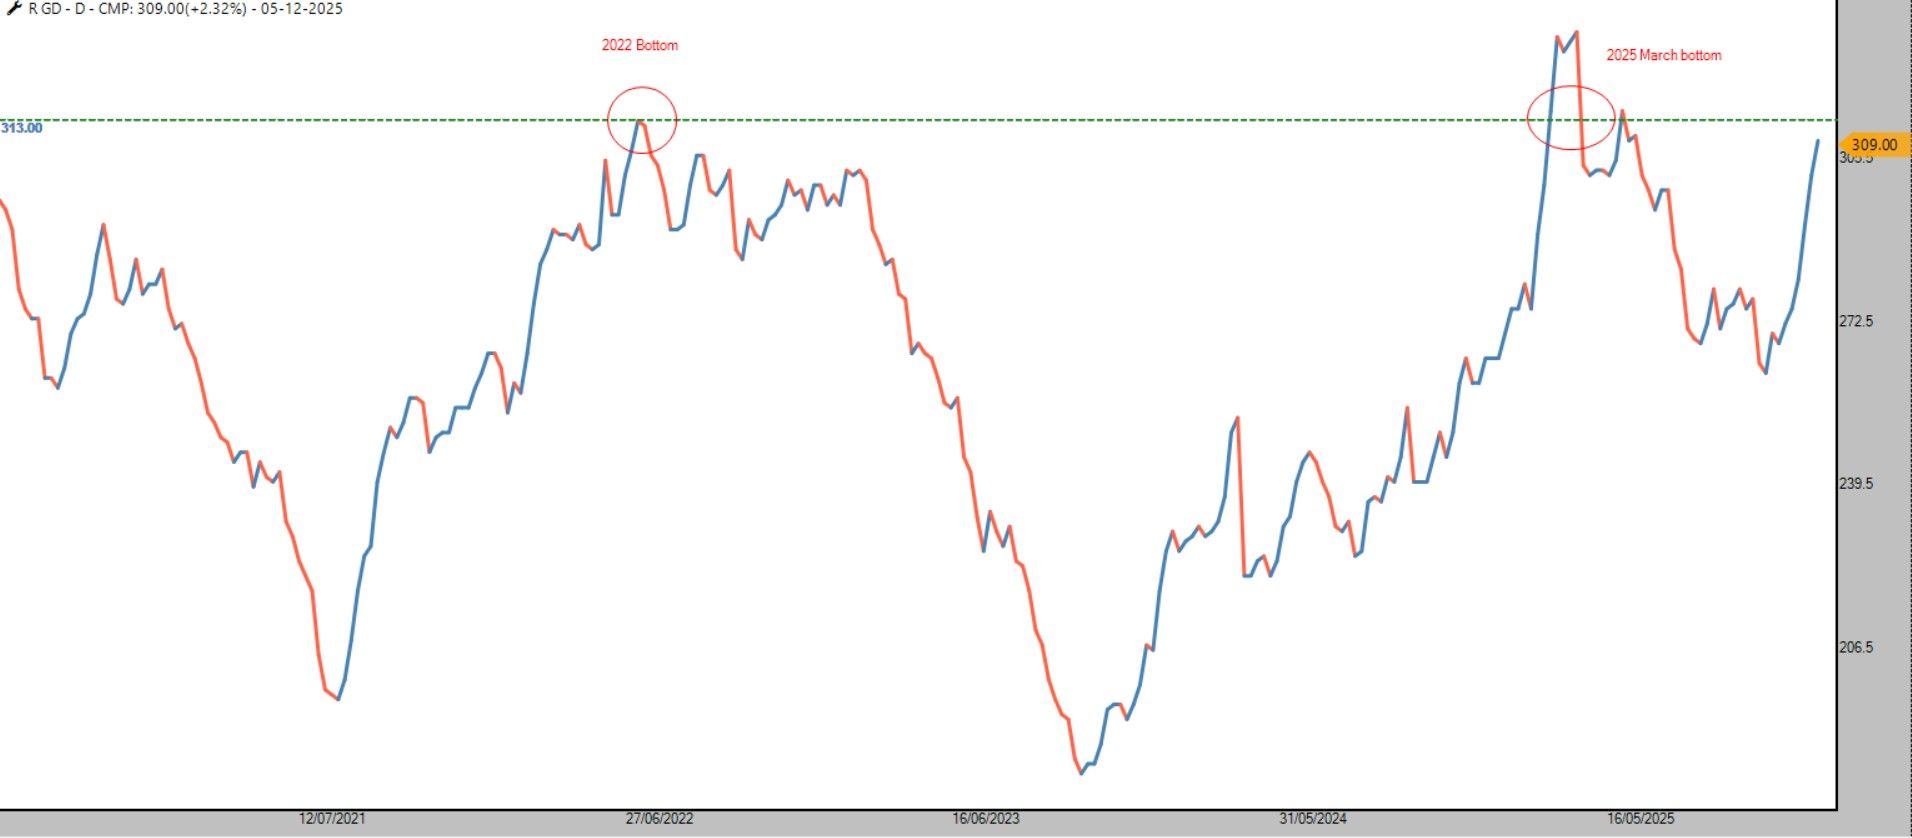
eClerx: Fresh DTB on RS + Multiple Vertical Counts Open A Strong Leadership Trend Getting Stronger
eClerx: Fresh DTB on RS + Multiple Vertical Counts Open
A Strong Leadership Trend Getting Stronger
eClerx continues to display exceptional market leadership.
After running in a Double Top Breakout (DTB) on Relative Strength, the stock has now delivered one more DTB, confirming:
Strength on strength → consistent outperformance
Institutional-style momentum with shallow corrections
Continuation of an already strong trend
RS staying above key MA zones, showing strong demand on dips
On the price chart, multiple vertical counts are open towards ₹6,300 / ₹8,000+, keeping the upside potential wide open as long as the trend structure holds.
This combination of Repeated RS DTBs + Strong Price Structure + Open Vertical Targets makes eClerx a high-quality trend-following opportunity for disciplined investors and traders.
Nishesh Jani,CFTe
#eClerx #MomentumInvesting #RelativeStrength #PointAndFigure #TechnicalAnalysis #TrendFollowing #MarketLeadership #VGM #nsiheshjani #AhmedabadNest 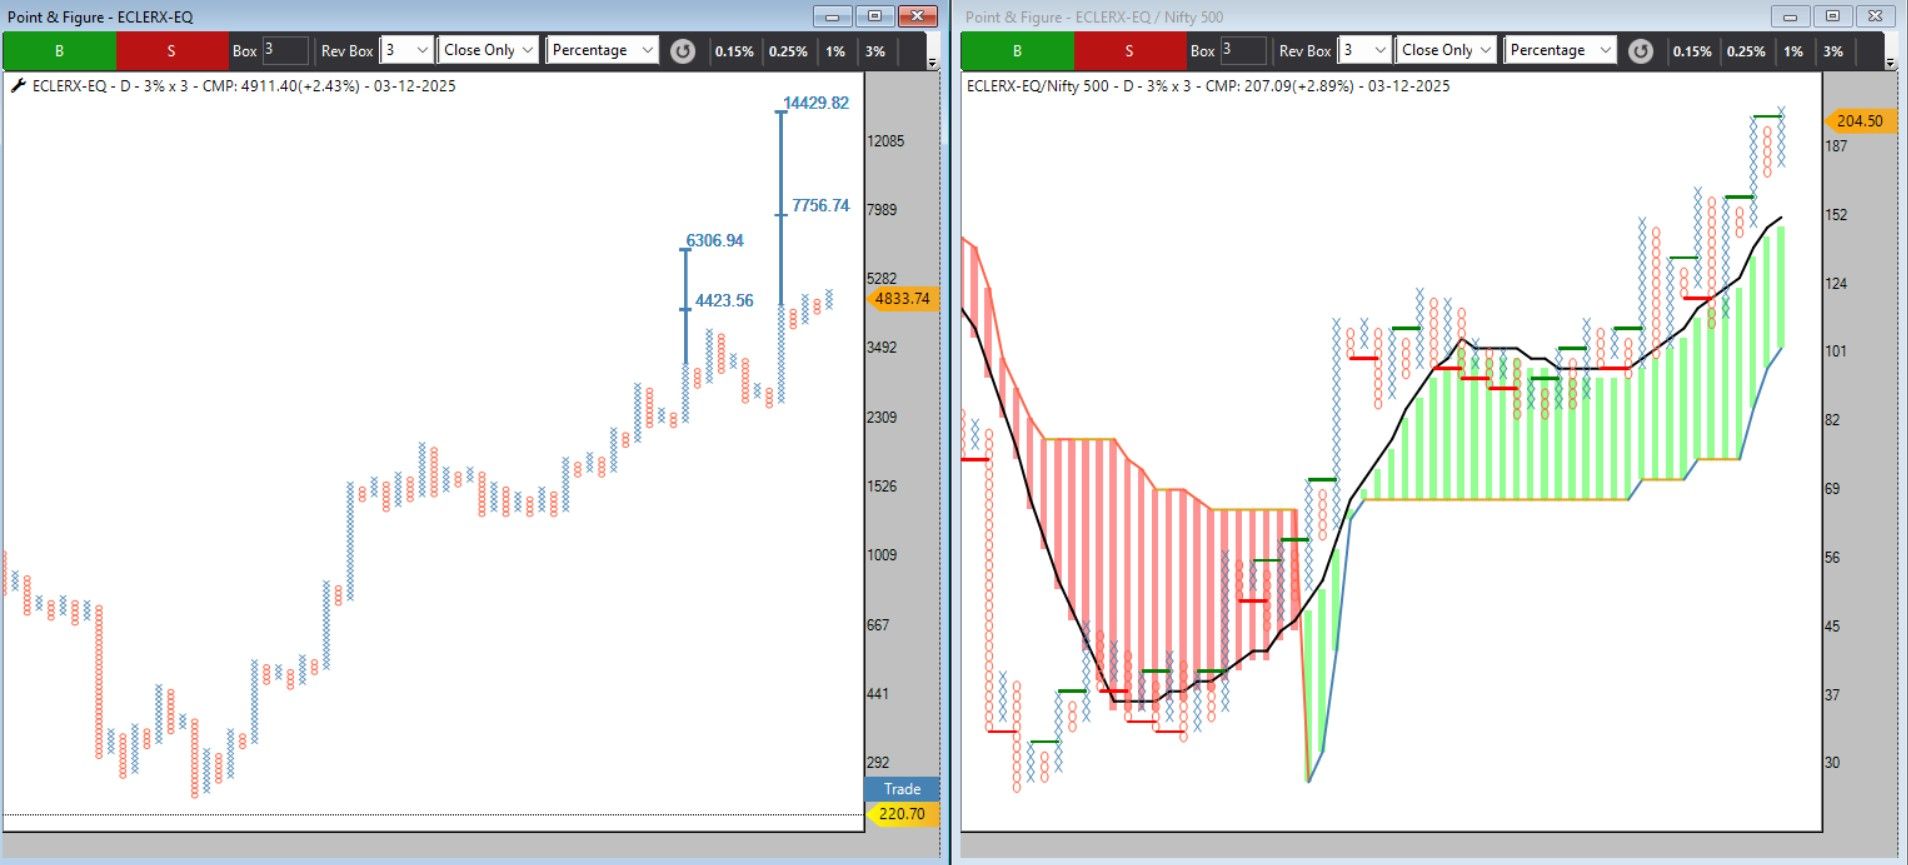
any update on this ?
any update on this ?
any update on this ?
any update on this ?
any update on this ?
any update on this ?
any update on it ?
any update on this ?
any update on this ?
Market Leadership Watch: Large, Mid, Small & Microcaps — My Current Radar
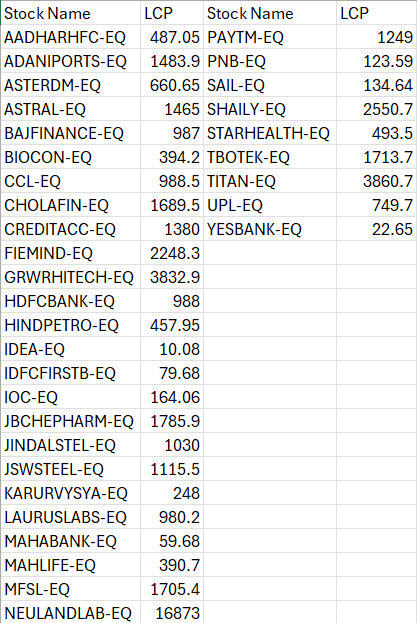
Market Leadership Watch: Large, Mid, Small & Microcaps — My Current Radar
In every bull phase, new leaders emerge — not yesterday’s heroes.
 YOUR TURN
Which stocks do you see as emerging leaders across Large, Mid, Small & Microcaps?
Share your charts, trades, or views with me — let’s identify leadership together with logic, structure & risk-first execution.
One can use list as watchlist and trade from intraday-swing -positional setup with proper Risk mangemnet
Nishesh Jani,CFTe
#MarketLeaders #MomentumTrading #SwingTrading #PositionalTrading #IntradaySetups #RiskManagement #TechnicalAnalysis #SmartInvesting #nisheshjani #AhmedabadNest
 Bank Nifty Bear Trap → Bullish Breakout in the Offing!
Bank Nifty Bear Trap → Bullish Breakout in the Offing!
Bank Nifty has carved out a Bullish Broadening formation and trapped the bears with a classic Bear Trap pattern.
As long as the index stays above 57,500 on a closing basis, the path opens to the target zone towards ~62,000.
Key Levels to note:
• Mini-bottom support (closing basis) → 57,500
• Target zone → 62,000
• Pattern triggers the up-move by invalidating the bearish structure and inviting fresh bullish counts.
The formation signals a shift in control back to the bulls — this is a structural bounce opportunity, not just a short-term spike.
Nishesh Jani,CFTe
#BankNifty #BearTrap #BroadeningFormation #IndianMarkets #StockMarketIndia #TradingStrategy #TechnicalAnalysis #MomentumTrade #NSE #nisheshjani #AhmedabadNest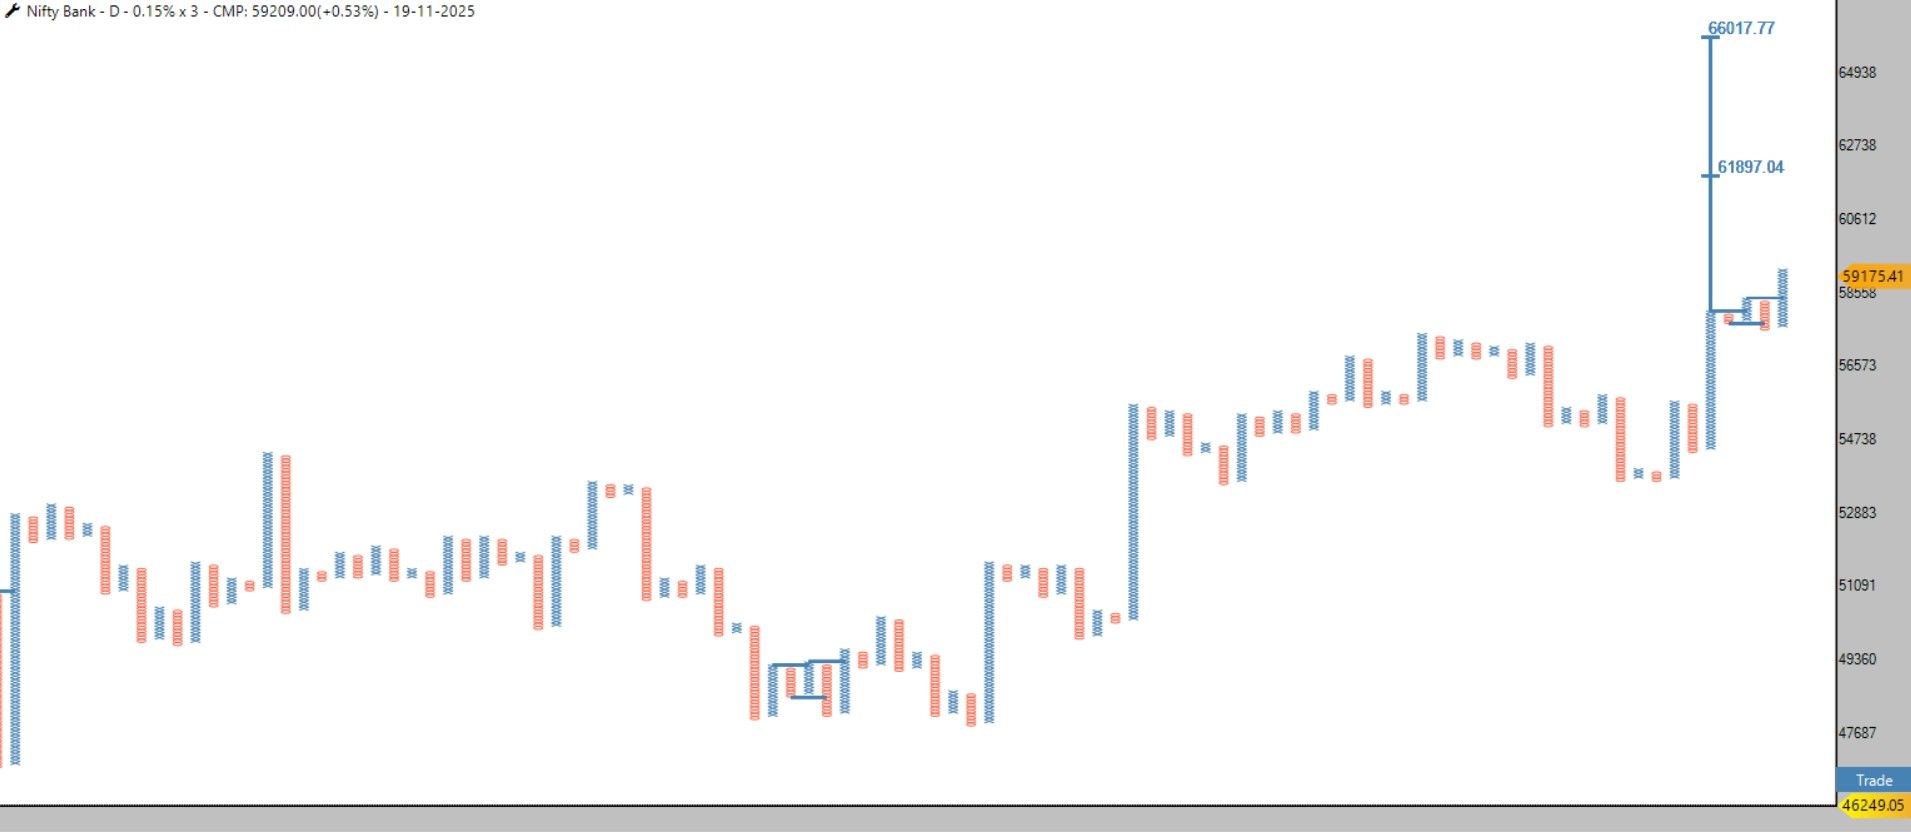
 Nifty Probable Bullish ABC Breakout Setup: Short-Term Trend Turning Constructive
Nifty Probable Bullish ABC Breakout Setup: Short-Term Trend Turning Constructive
Nifty is entering a favourable structure, with a close above 26,080 set to activate a Bullish ABC breakout.
Stop-loss: 25,897 (closing basis)
Multiple open vertical counts are active, projecting upside zones toward:
• 26,420
• 26,766
• 26,981
…with several additional bullish counts building in the background.
The continuous emergence of new vertical counts signals strong underlying momentum and improves the probability of achieving these upside targets.
Trend stays positive as long as Nifty holds key supports.
Nishesh Jani,CFTe
#NiftyOutlook #BullishABC #PointAndFigure #MarketInsights #TrendFollowing #TechnicalAnalysis #nisheshjani #AhmedabadNest 
#VGM Bharti Airtel – Strength Continues
Bharti Airtel has now given a Double Top Buy on the VGM RS Framework, confirming continued strength with all criteria aligned:
Trading above the MAST cloud
Last two columns not touching the MA
Rally → Shallow Correction → Breakout sequence
Strong RS momentum supporting trend continuation
On the price chart, the structure is an affordable breakout, opening the way for a 4000+ conservative target.
For Execution:
Investors & traders can decide entry–exit using either the RS structure or Price structure, based on their affordable box size & system rules.
For simplicity, follow VGM RS rules with predefined price levels to stay disciplined.
Nishesh Jani,CFTe
#BhartiAirtel #VGMStrategy #MomentumInvesting #BreakoutStocks #DisciplinedTrading #MarketLeadership #nisheshjani #AhmedabadNest
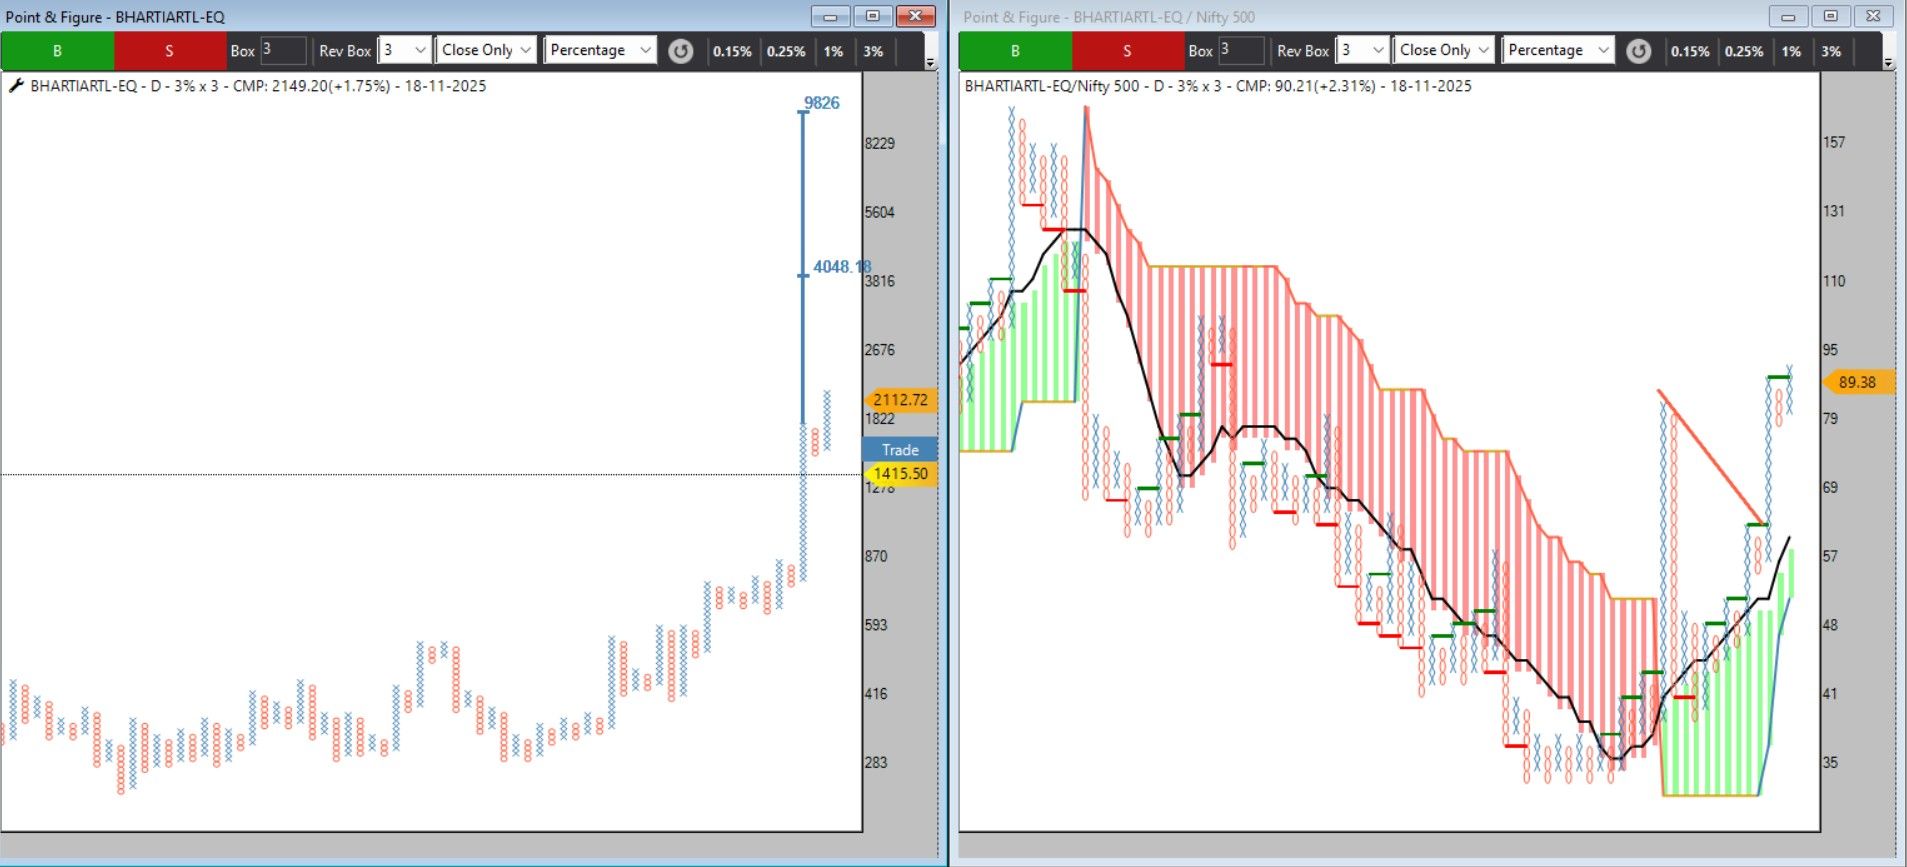
Nifty – A Very Interesting Pattern is Unfolding…
Nifty – A Very Interesting Pattern is Unfolding…
On the 75-min chart, Nifty is forming a strong bullish structure inside a rising channel.
The broader directional view is clear:
Breakout above 26,200 → Opens the gate for 27,200
25,300 remains the key bullish validation zone
Above 26,200, the momentum traders, swing traders, and positional traders will all get aligned on the long side.
Trade with levels. Trade with structure.
Let the market confirm, and then ride the trend.
Nishesh Jani,CFTe
#NiftyOutlook #PriceAction #TrendTrading #BreakoutTrading #ChartAnalysis #Nifty75min #TradingSetup #TechnicalAnalysis #SwingTrading #nisheshjani #AhmedabadNest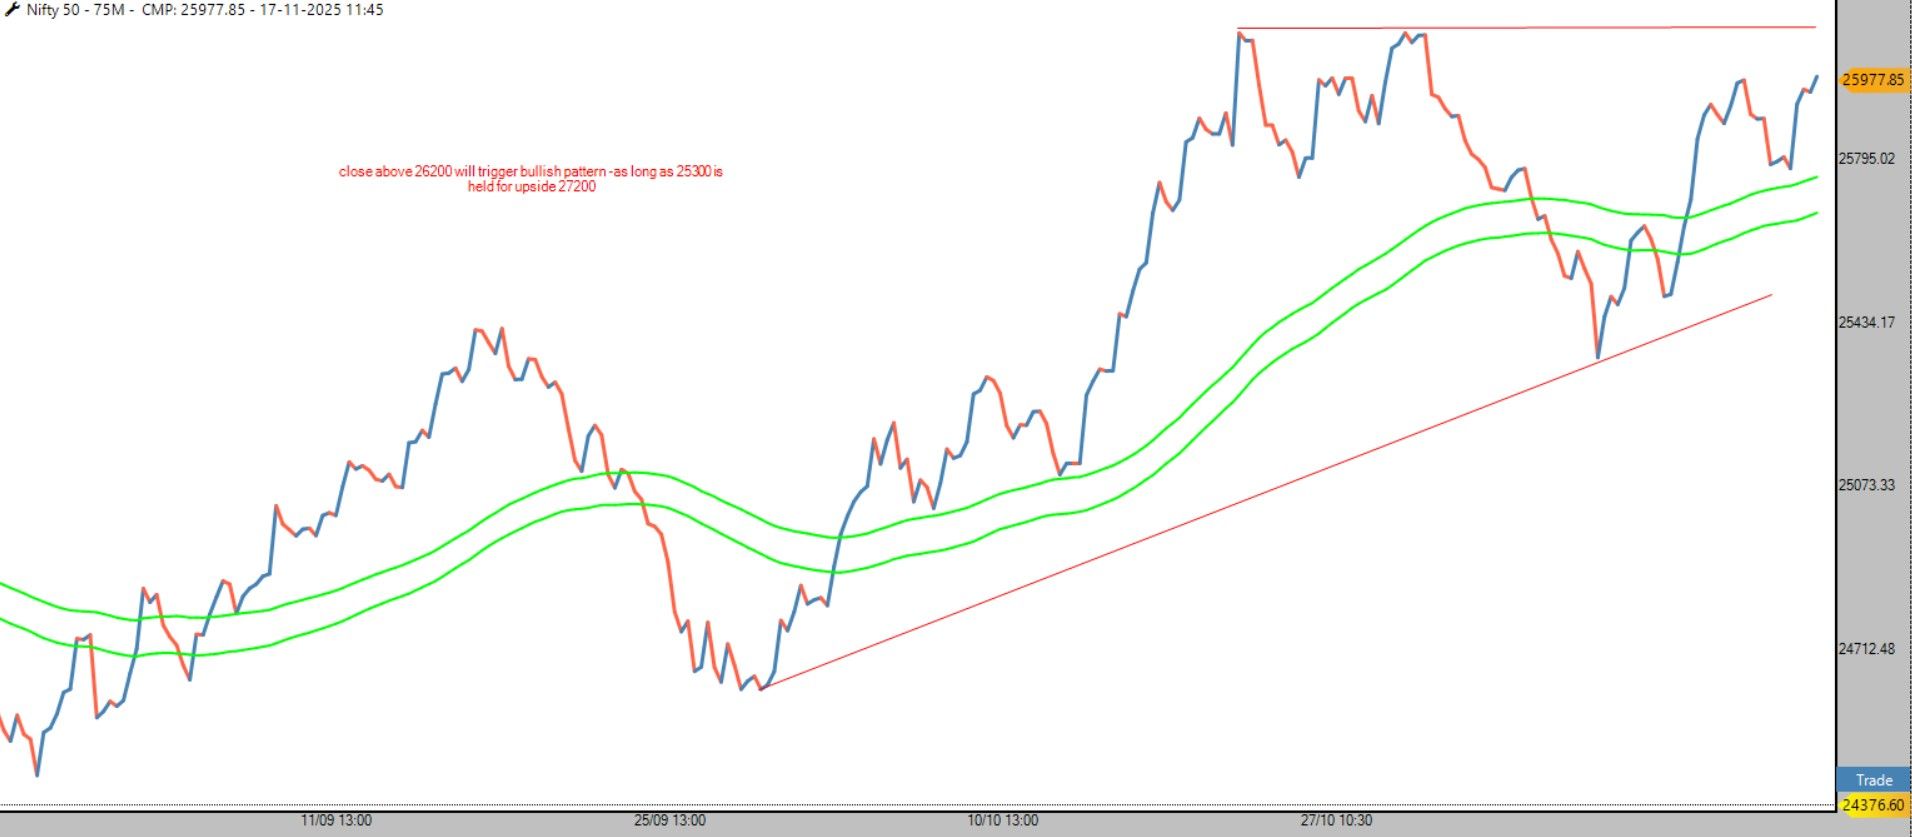
#VGM Setup Confirmed in SHAILY
SHAILY has activated a fresh VGM bullish setup — a strong continuation signal for disciplined trend followers.
RS Chart: Clear DTB breakout; last two columns holding above the moving average, reinforcing strength.
Price Structure: Open vertical counts at 3100 and 3800, offering an attractive risk–reward from current levels around 2610.
How to Follow:
️ VGM practitioners can simply follow RS-based signals as explained in the system guidelines/video.
️ Others may track price action on their preferred timeframe and box size.
A clean, rule-driven setup for those who believe in structured momentum trading.
Nishesh Jani,CFTe
#VGM #PointAndFigure #MomentumTrading #TrendFollowing #RSCharts #SmartInvesting #TechnicalAnalysis #nisheshjani #AhmedabadNest 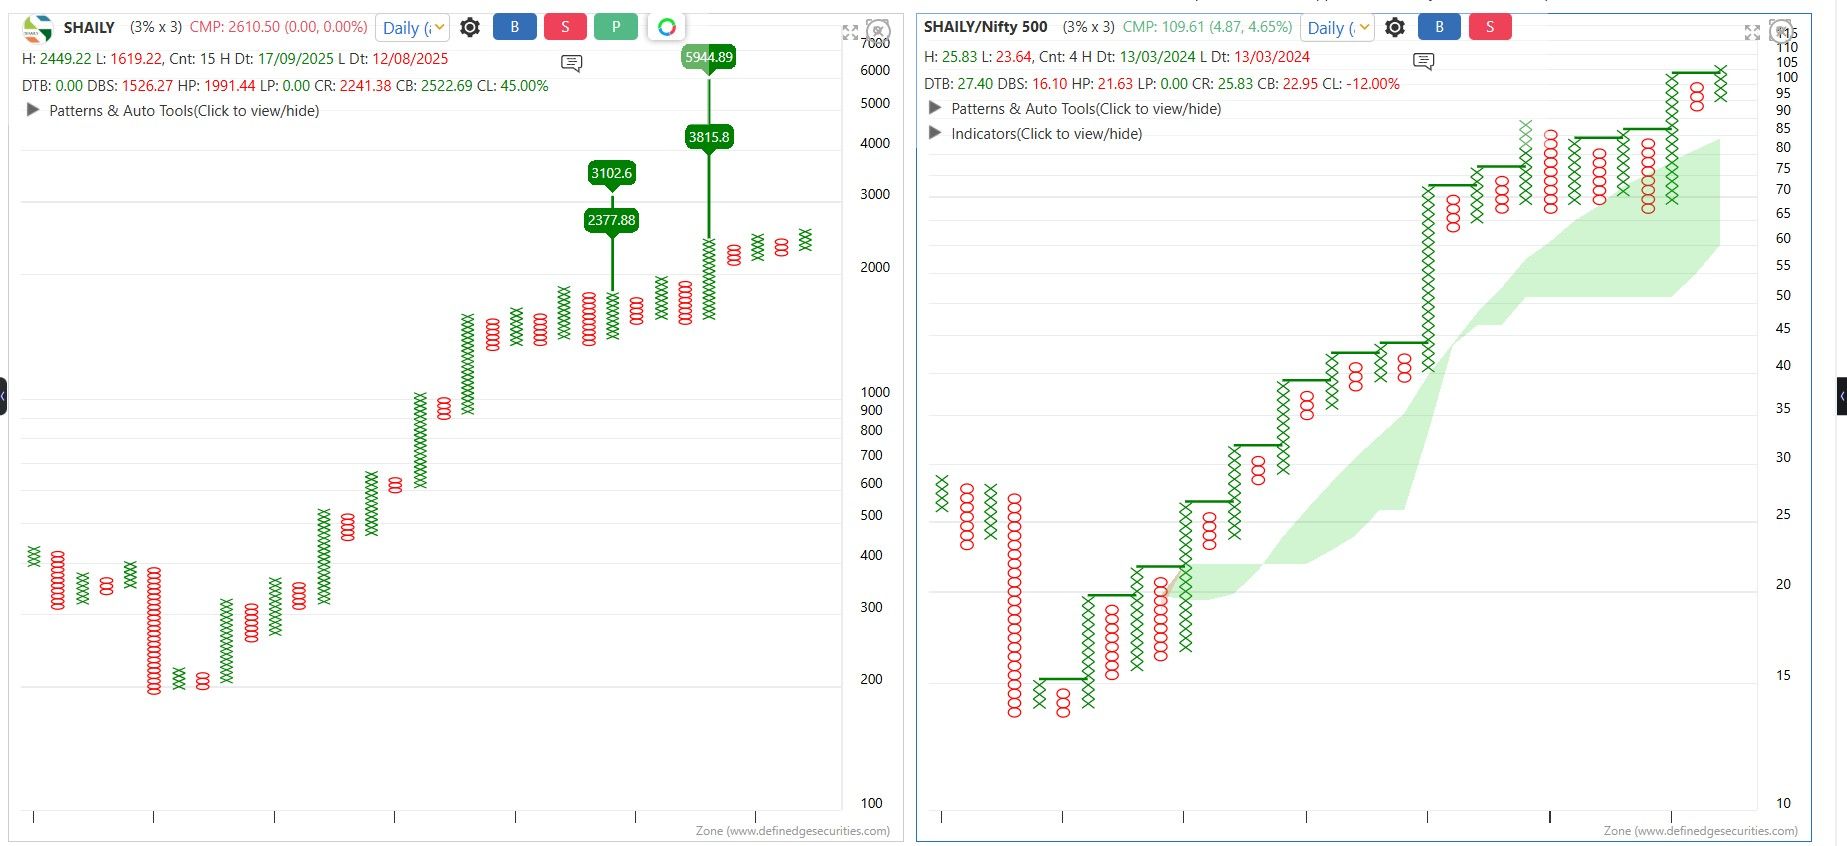
#VGM Capital Deployment Strategy – Stay Invested, Stay Smart
#VGM Capital Deployment Strategy – Stay Invested, Stay Smart
When you start practising #VGM, it takes time to build a full basket of 25 stocks. But your money shouldn’t stay idle — it should work for you every day.
Here’s how we ensure your capital is always productive
When Nifty 500 (our denominator) is above the D-SMART indicator (0.25% box) → we invest unallocated funds into Motilal Oswal Nifty 500 ETF-MONIFTY500, protected with a trailing SL as per indicator.
When Nifty 500 drops below D-SMART, we shift to LiquidBees, keeping your capital safe yet ready.
As new stocks qualify under #VGM, we redeem ETF units and move into outperforming opportunities — seamlessly and systematically.
Your money remains continuously deployed, balancing growth and safety, ensuring you never miss market participation while maintaining risk control and liquidity.
#VGM #SmartInvesting #SystemTrading #ClientFirst #DisciplinedApproach #EfficientCapitalUse
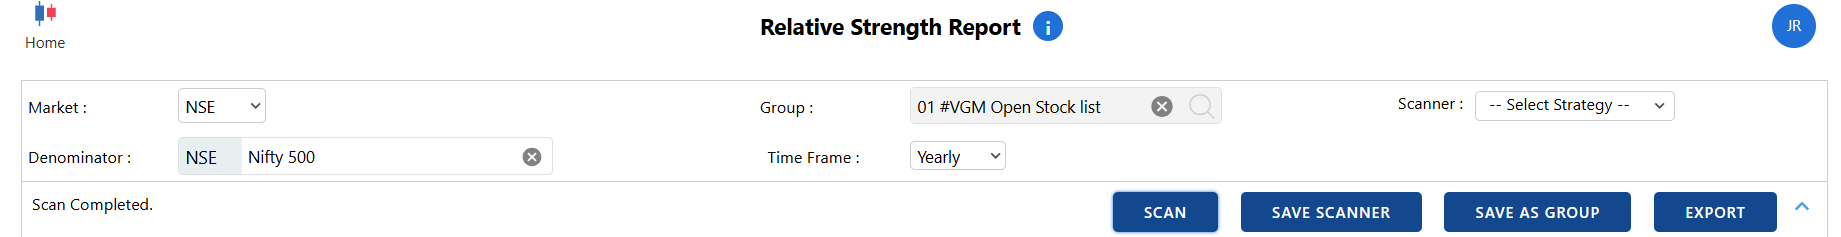
please add user defined days/week/months like 252/days 52 week etc so every week can scan and find our critera defined stock list
Motilal Oswal Large and Midcap Fund
Motilal Oswal Midcap Fund (Formerly known as Motilal Oswal Midcap 30 Fund)
Motilal Oswal Small Cap Fund
Motilal Oswal Focused Fund (Formerly known as Motilal Oswal Focused 25 Fund)
Motilal Oswal Flexi Cap Fund
Motilal Oswal Large Cap Fund
Motilal Oswal ELSS Tax Saver Fund (Formerly Known as Motilal Oswal Long Term Equity Fund)
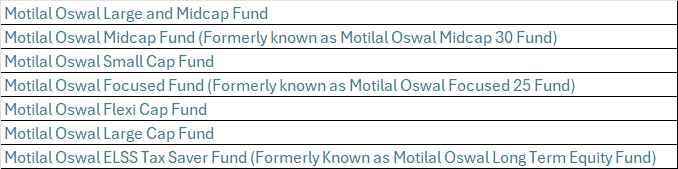
Parag Parikh Flexi Cap Fund
Parag Parikh ELSS Tax Saver Fund
Parag Parikh Conservative Hybrid Fund
Parag Parikh Dynamic Asset Allocation Fund
select only equity stocks and avoid arbitrage positions
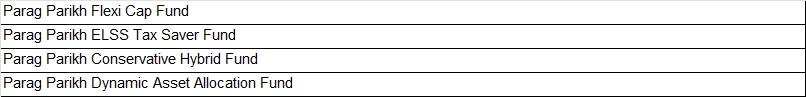
#VGM System Update for Practitioners
As we continue refining our approach for long-term consistency and capital protection, here are two important updates in our #VGM portfolio framework:
We will now maintain a minimum of 25 stocks in the portfolio (up from 20), with equal weight allocation.
️ This ensures diversified exposure across strong RS names and reduces portfolio-level volatility.
️ Max allocation per stock = 4% of total capital.
Maximum stop-loss from entry has been standardized:
• Exit if DBS triggers OR
• Maximum 20% stop-loss, whichever comes first.
In the rare case a stock hits the full 20% stop-loss, the capital impact is just 0.80% (4% × 20%).
️ This keeps our emotional comfort and portfolio stability intact while letting winners run.
Why This Matters:
We are not here to avoid losses—we are here to control them sharply and let trend & strength create outsized winners over time.
Small controlled losses + Strong trend-followers = Sustainable performance
#VGM #RiskManagement #TrendFollowing #RSbasedInvesting #ProcessOverEmotion
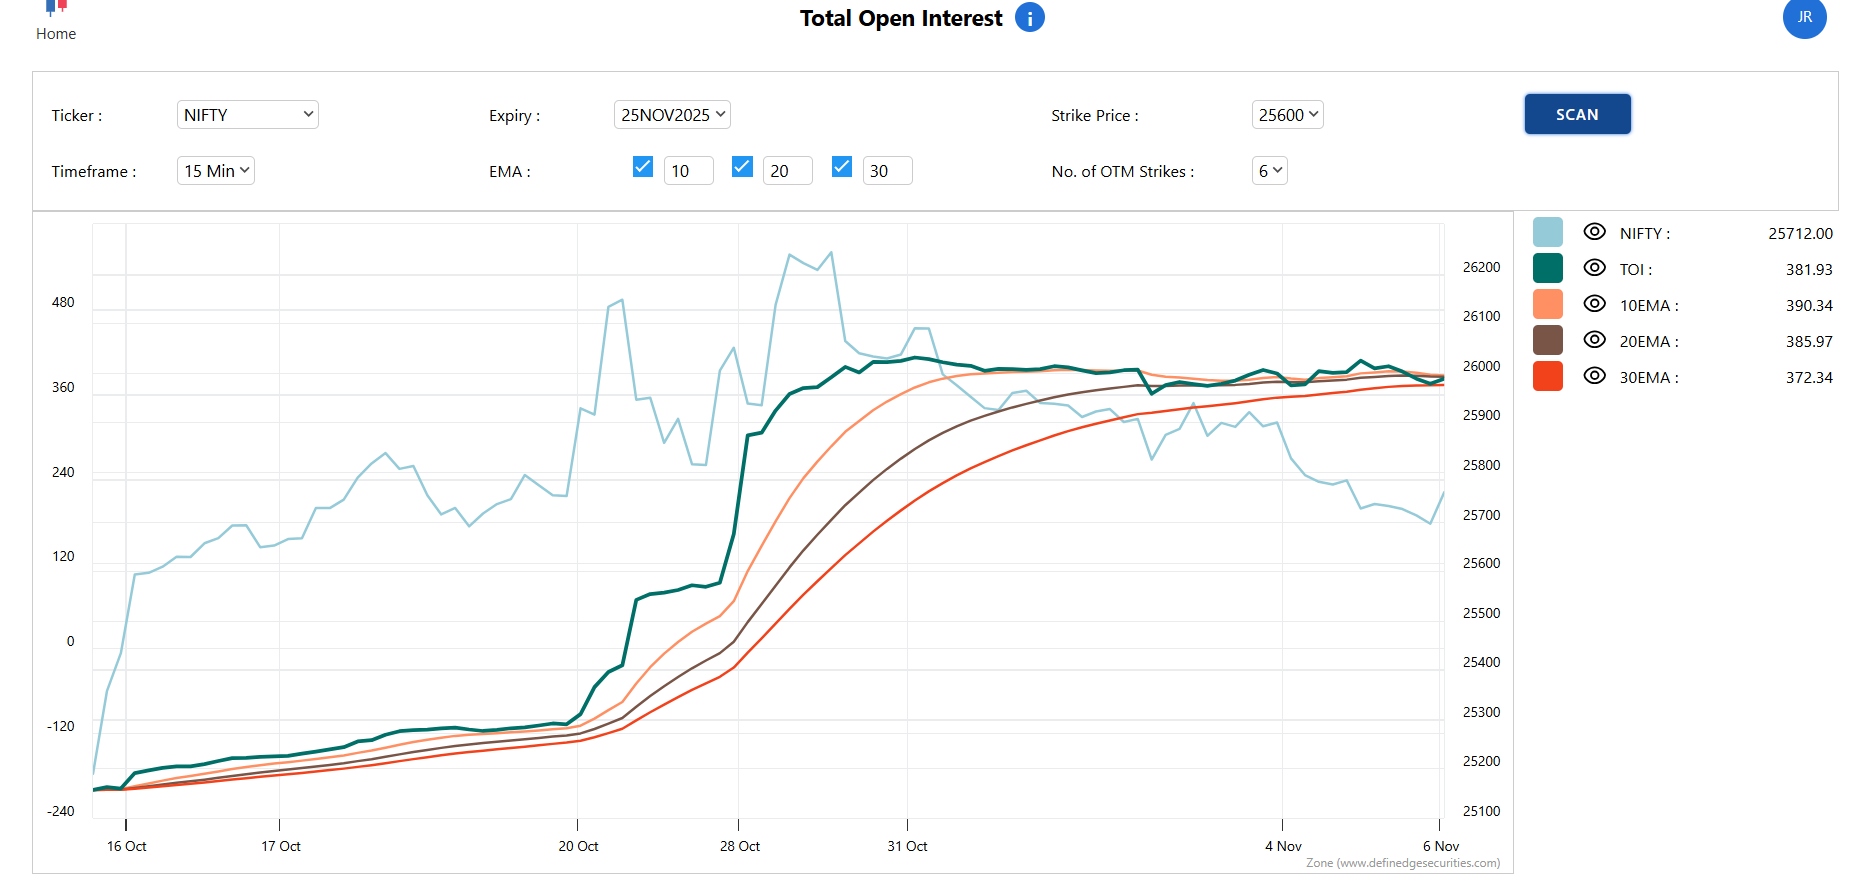
#VGM Case Study – Alkyl Amines
Observe how the #VGM Bullish phase aligned with strong price expansion — RS held firm, MAST bullish, and price consistently made higher levels. Momentum + Structure = Clean upside follow-through.
Then came the #VGM Bearish phase, where both RS and Price structure weakened. Breaks below MAST and lower column formations clearly indicated the shift of control to sellers.
Price moved into a distribution → correction cycle, reminding us that every strong stock experiences phases.
System Follower Lesson:
We don’t predict phases.
We identify them and respond.
Bullish VGM → Participate and ride trends
Bearish VGM → De-risk / Stay light / Avoid forcing trades
Discipline > Narratives.
Always follow the phase, not our personal attachment to the stock.
Nishesh Jani,CFTe
#VGM #PriceAction #RSStrength #TrendFollowing #MomentumRotation #SystemTrader #nisheshjani #AhmedabadNest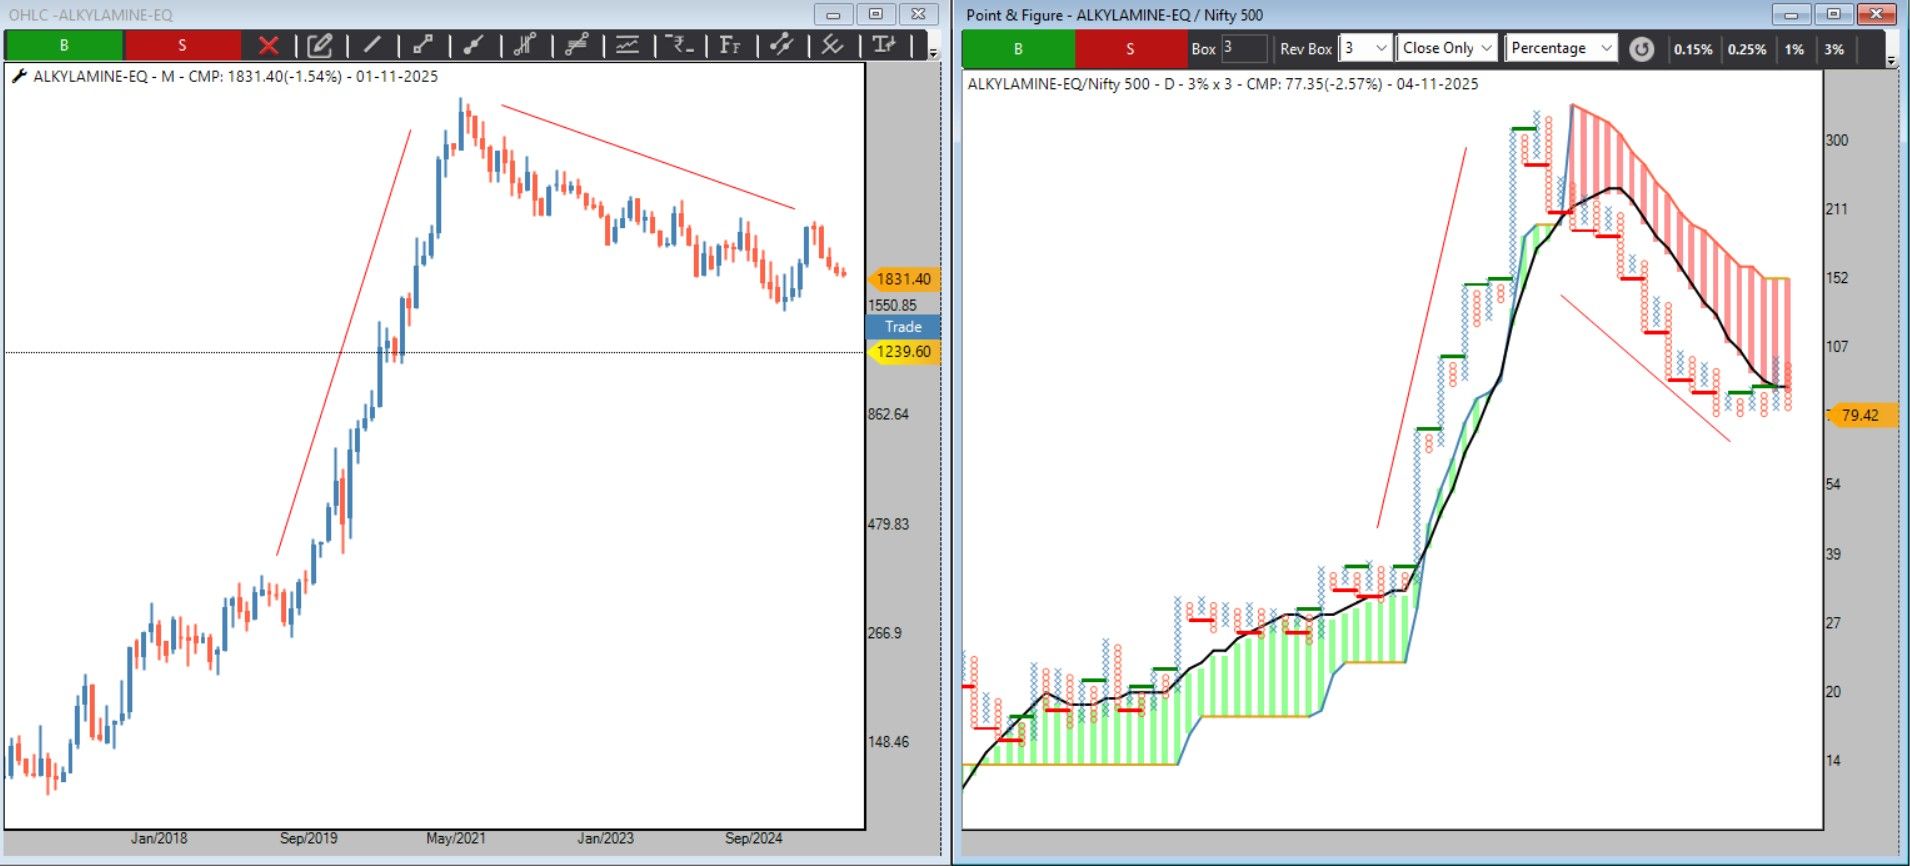
#VGM Case Study – Bharti Airtel
Look at the clearly marked Bullish vs Bearish phases based on the #VGM framework.
During the Bullish VGM phase, the stock delivered strong directional rallies.
But once the structure turned Bearish, the stock went into a long corrective cycle — especially the 2009 to 2021 period where the price moved sideways and kept frustrating positional traders.
System User Perspective:
Your job is not to predict phases, but to identify them and act accordingly.
In Bullish Phase → Trade with conviction, trend follow, scale with rules.
In Bearish/Corrective Phase → Reduce exposure or stay light, avoid “hope-based” holding.
Key Takeaway:
Rotation and regime-awareness are more important than opinions.
Trade the phase that exists, not the one we emotionally wish for.
Nishesh Jani,CFTe
#VGM #MarketRegime #TrendFollowing #SmartTrading #MomentumRotation #SystemTrader #nisheshjani #AhmedabadNest 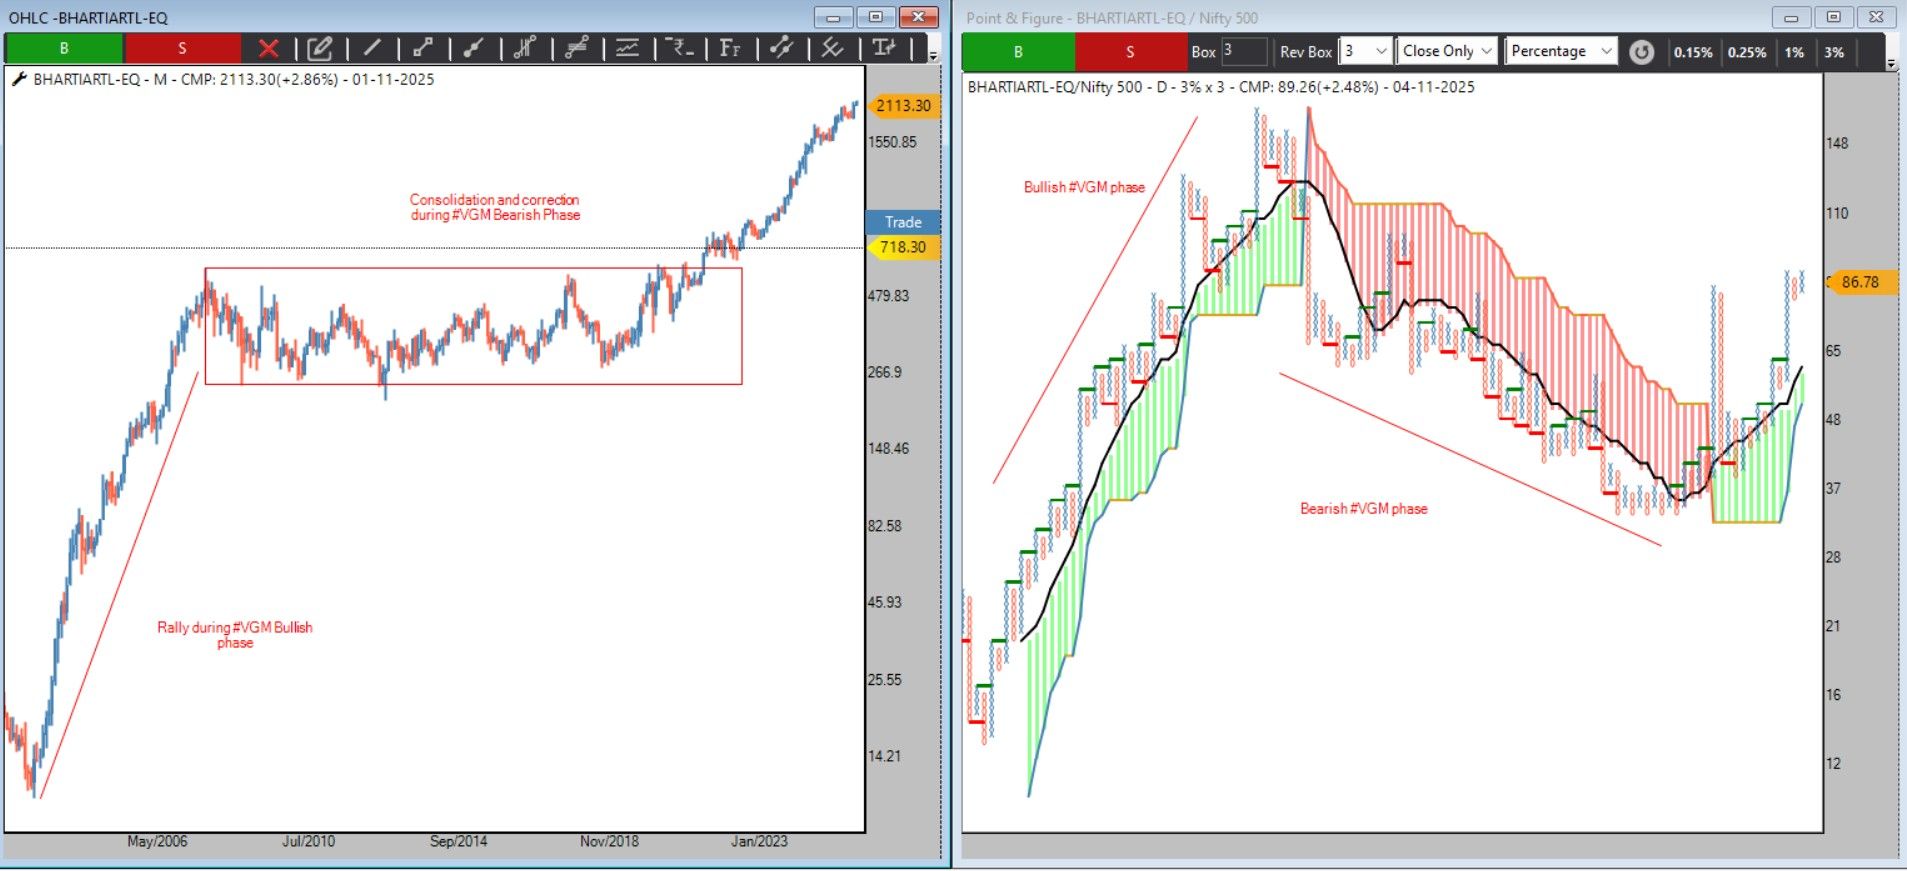
Strengthening Our #VGM Learning Community
I am pleased to see an increasing number of serious #VGM followers reaching out to discuss setups, clarify queries, and deepen their understanding of the methodology. The willingness to learn and the appreciation for simplicity in the concept reflect a mature and disciplined approach.
Our collective progress is built upon clear rules, structured thinking, and continuous learning. I sincerely value your trust, your engagement, and the thoughtful conversations we are consistently having.
Let us continue to uphold the principles, practice patience, and grow together with confidence and clarity.
Nishesh Jani, CFTe
https://t.me/+HOuDnn1VTdJjYzdl-Telegram Link to join
#VGM #MomentumInvesting #TechnicalAnalysis #CommunityLearning #nisheshjani #AhmedabadNest
#VGM Case Study & Home Work – Tata Elxsi
A clear example of why Rotation & Trend Alignment matter.
In the past, Tata Elxsi was a running DTB stock on the RS (Relative Strength) + VGM setup.
With RS above MAST and price above DBS, the stock continued its trend and rallied towards ₹10,000 with remarkable simplicity.
But once the #VGM structure turned bearish
• RS slipped below MAST
• DBS triggered on price
• Momentum & strength shifted away
The same “hot” stock gradually became a forgotten one — almost halving from its peak.
Key Lesson
It’s not about falling in love with a stock.
It’s about staying aligned with the trend and strength.
Even great businesses go through phases.
Your edge comes from:
Staying with Rising RS + Bullish VGM setups
Exiting when the trend structure reverses
Homework for you
Pick your:
• Favourite stocks
• Mutual fund holdings
• HNI portfolio names
And check: How historically they have done on VGM and Price
You will gain clarity on rotation and understand where to stay invested.
Nishesh Jani,CFTe
#VGM #RelativeStrength #MomentumInvesting #TrendFollowing #SmartRotation #nisheshjani #AhmedabadNest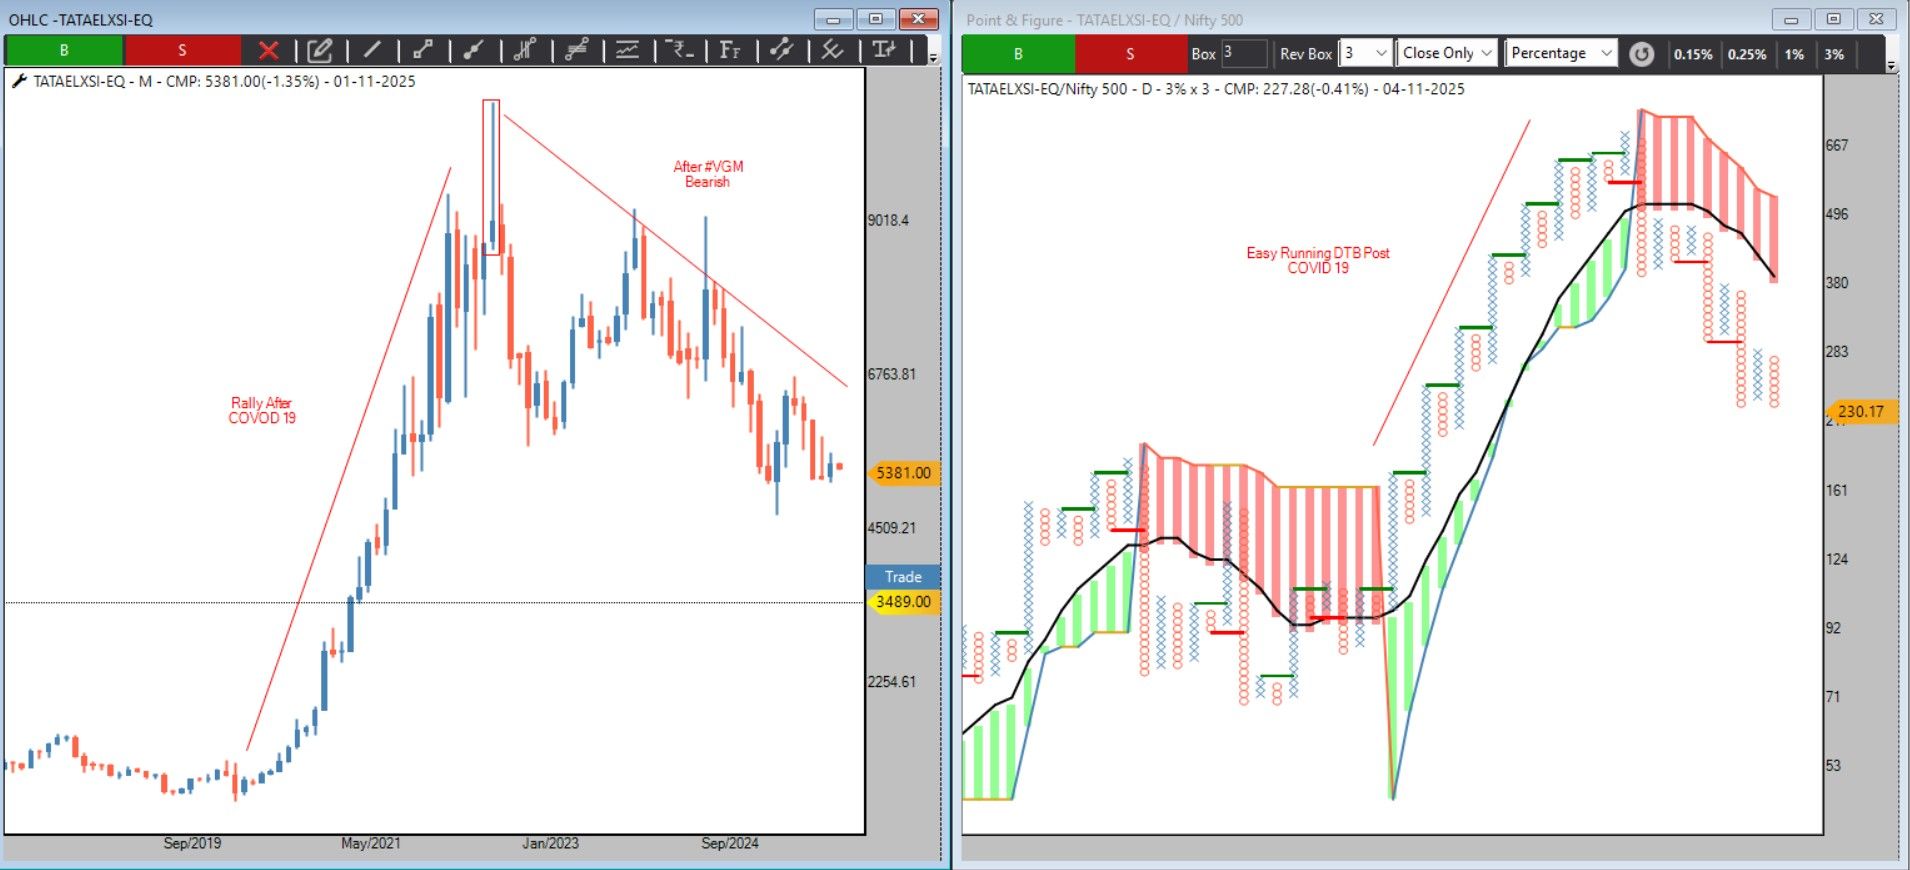
#VGM Pick – GVT&D
The stock has shown a strong bear trap → Bullish Anchor Column → Probable Super Pattern progression on both Price Chart and Relative Strength (RS) Chart.
This structure indicates that bulls are currently in control of the directional momentum.
Key Technical Highlights:
On Price Chart → OOPS Bullish, followed by Anchor Column, and now a Probable Bullish Super Pattern forming.
On RS Chart → Bullish Anchor Column + Super Pattern Setup confirms strength relative to the market.
MAST Indicator is bullish on both Price and RS.
Entry & Risk Management Plan For RS Or Price based Trade
Enter 50% position when PCR signal triggers.
Enter remaining 50% on DTB (Double Top Buy) confirmation.
Primary Stop-Loss: DBS (Double Bottom Sell) level.
→ This ensures rule-based risk control with momentum confirmation.
This is a clean, rule-based setup backed by both price action and relative strength momentum.
Nishesh Jani,CFTe
#VGM #MomentumTrading #RelativeStrength #PointAndFigure #TechnicalAnalysis #AnchorColumn #SuperPattern #StocksWithStrength #nisheshjani #AhmedabadNest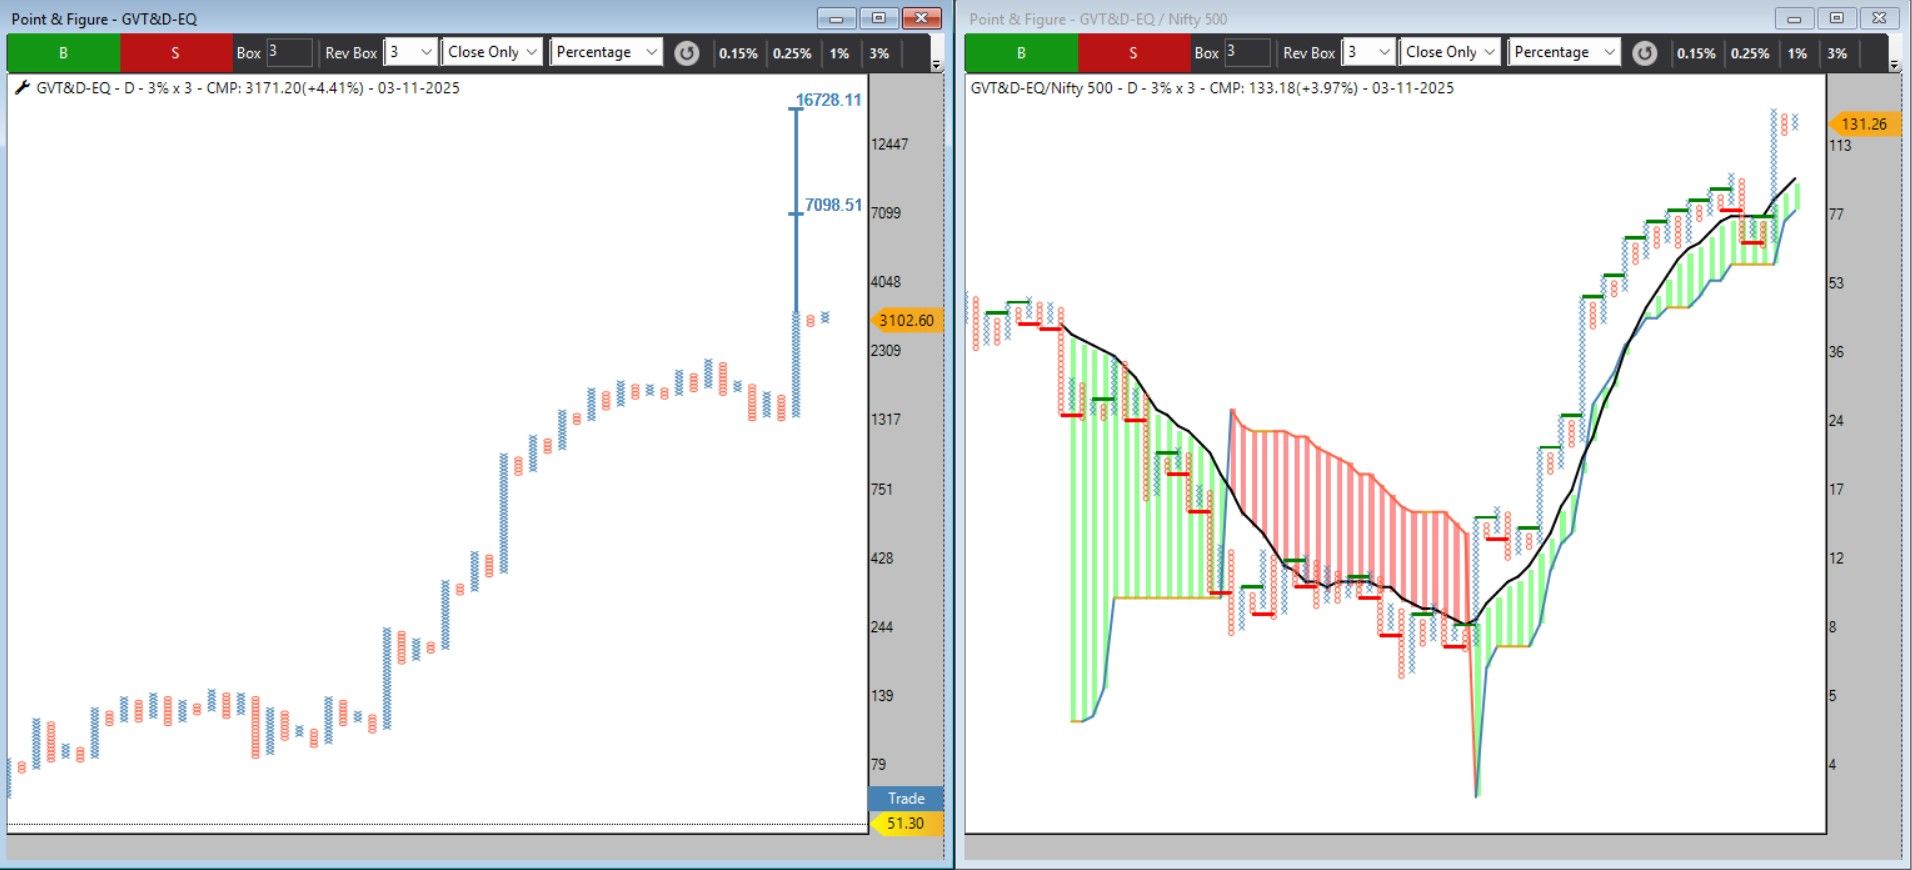
#VGM Pick — V2 Retail
A strong momentum setup backed by both Price and Relative Strength (RS).
On the RS chart, the last two column-lows are well above the Moving Average with a Bullish MAST in place — indicating underlying strength and leadership within its space.
On the Price chart, multiple regular and one rare Bullish Broadening Pattern breakout is active — signaling a powerful continuation phase.
Execution (Rule-Based & Simple):
50% entry on PCR trigger
50% entry on DTB trigger
Exit based on DBS as per your preferred style
Trade your style, follow your rules — the structure is already in your favour.
Nishesh Jani,CFTe
#VGM #MomentumInvesting #RelativeStrength #BreakoutStocks #RuleBasedTrading #PriceAction #MarketLeadership #v2retail #nisheshjani #AhmedabadNest
Nifty Outlook — Trend Intact. Retest Normal. Opportunity Alive.
Nifty Outlook — Trend Intact. Retest Normal. Opportunity Alive.
Nifty remains in a clear bullish structure, backed by the 50 & 200 EMA Golden Cross — a strong medium-term trend confirmation.
The recent pullback is not weakness.
It’s a healthy retest of the breakout trendline and the 50 EMA zone — exactly how strong uptrends behave.
Inverse Head & Shoulders breakout remains valid
Demand zone support: 25300–25000
Market structure continues to favor the bulls
And the timing couldn’t be better:
Seasonality favors November & December — historically high positive return months.
This is where portfolios get positioned before the momentum accelerates.
Simply put:
The market is not reversing.
It is preparing for its next leg up.
Those who wait will watch others profit.
Those who act with conviction participate in the trend.
Stay aligned. Stay strategic. Stay ahead.
Nishesh Jani, CFTe
#Nifty50 #GoldenCross #BullishTrend #MarketOutlook #MomentumInvesting #SeasonalityEdge #InvestWithDiscipline #RideTheBull #SmartMoneyMoves #nisheshjani #AhmedabadNest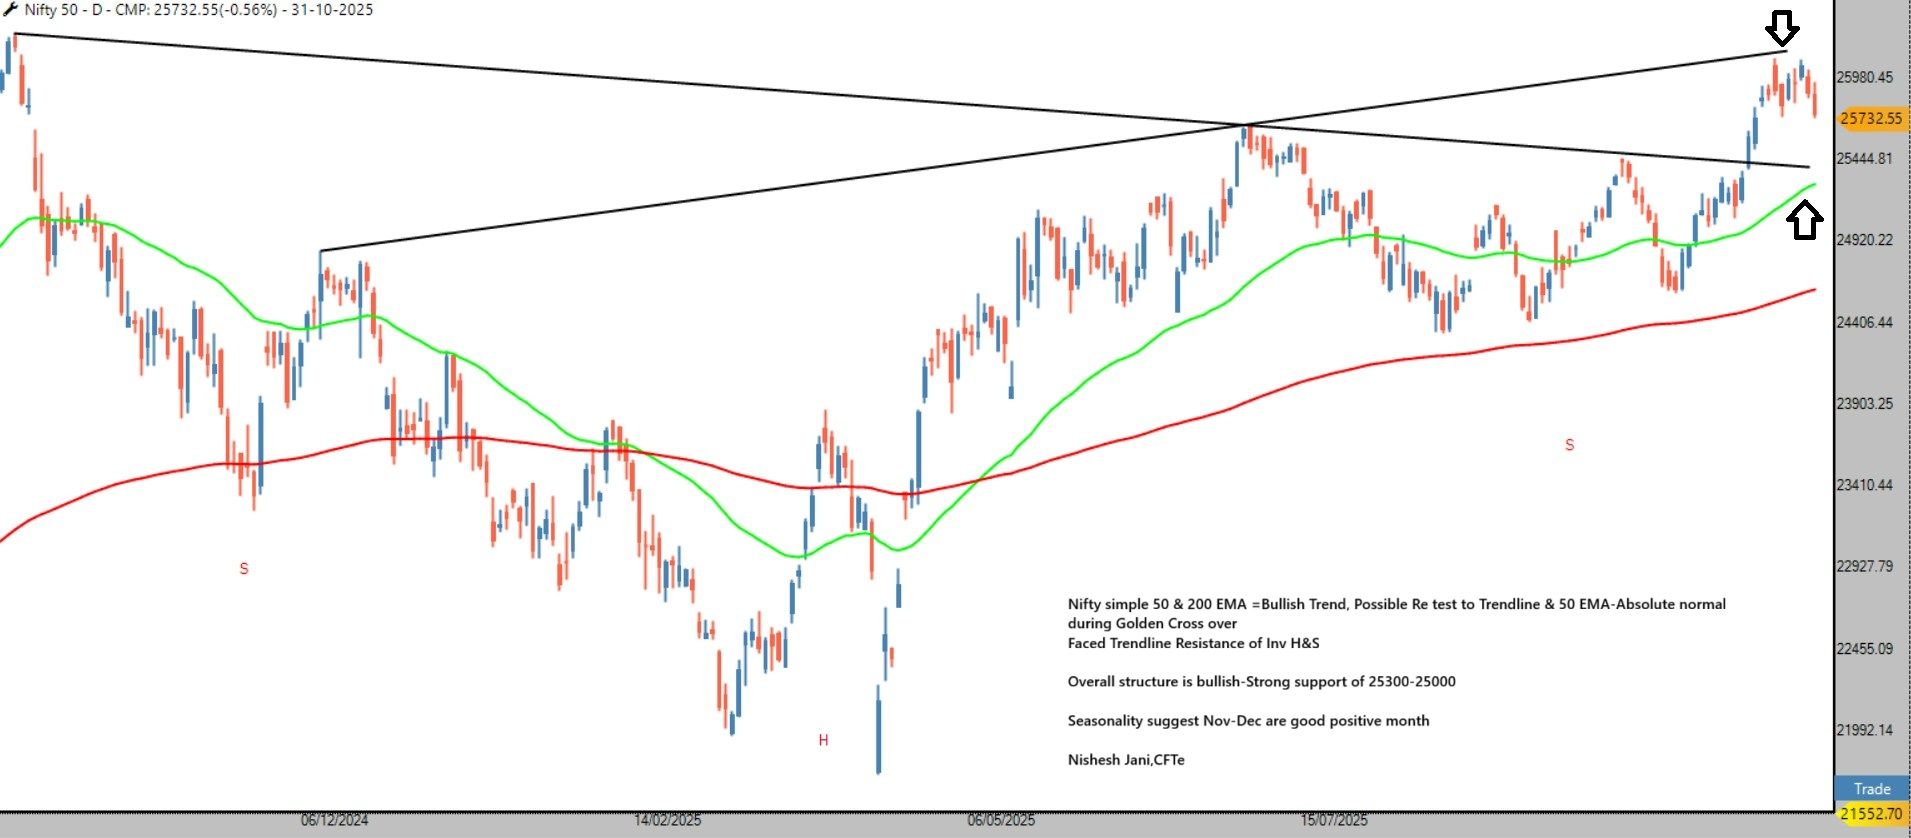
Hello team definedge from long time pending request to add
Renko -RS matrix
Renko -Fusion matrix
Thanks
VGM Pick – Bharti Hexacom
Since listing (April 2024), Bharti Hexacom has consistently shown strength on the Relative Strength (RS) chart, moving in a sustained DTB (Double Top Breakout) performance formation.
After a brief phase of relative consolidation / underperformance, the RS has turned up again and the Price chart has recently formed a strong Anchor Column, indicating renewed directional momentum.
The recent shallow correction appears to be healthy absorption, and the stock is now well-positioned for the next leg of outperformance.
Upside potential opens towards ₹3000 in the medium term.
Clients can follow either Price-based entries/exits or RS-based entries /exits, as we practice in our EDECNOCH approach (Definedge Presentation – 2021).
One can trades on small time frame as well based on their own style
Trend remains constructive.
🟢 Momentum improving.
Suitable for systematic investors & disciplined traders.
Nishesh Jani,CFTe
#VGM #MomentumInvesting #RelativeStrength #SmartInvesting #BhartiHexacom #Definedge #EDECNOCH #WealthWithDiscipline #MarketLeadership #PortfolioGrowth #nisheshjani #AhmedabadNest 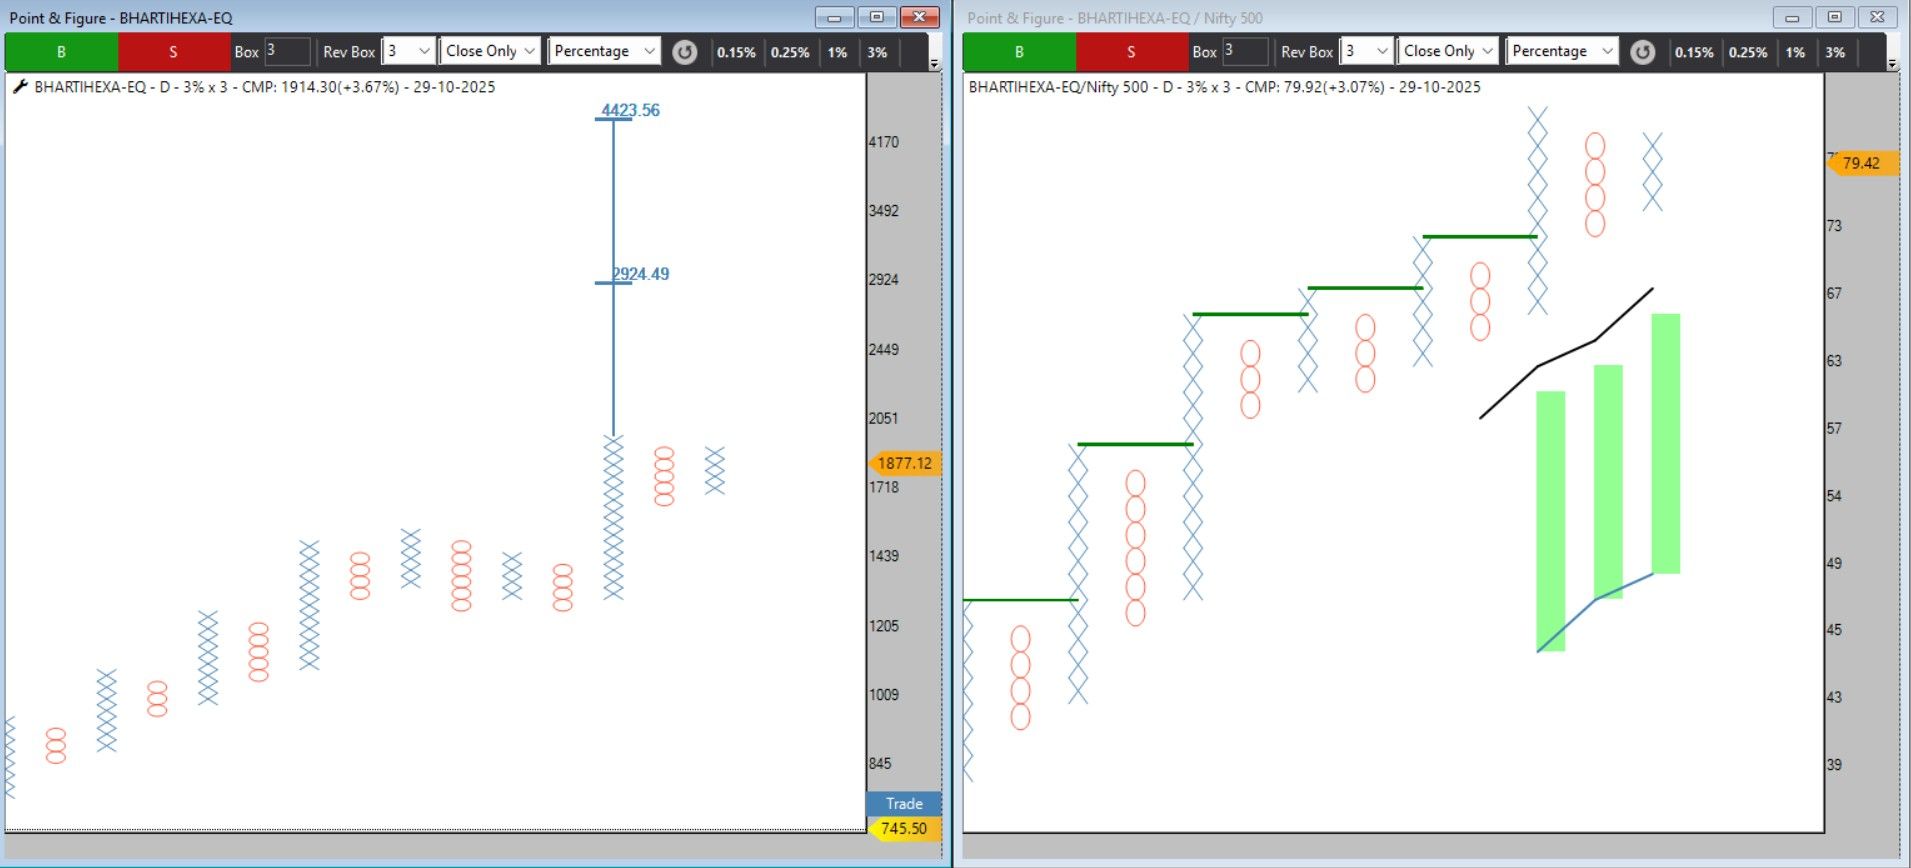
please look into this @Definedge
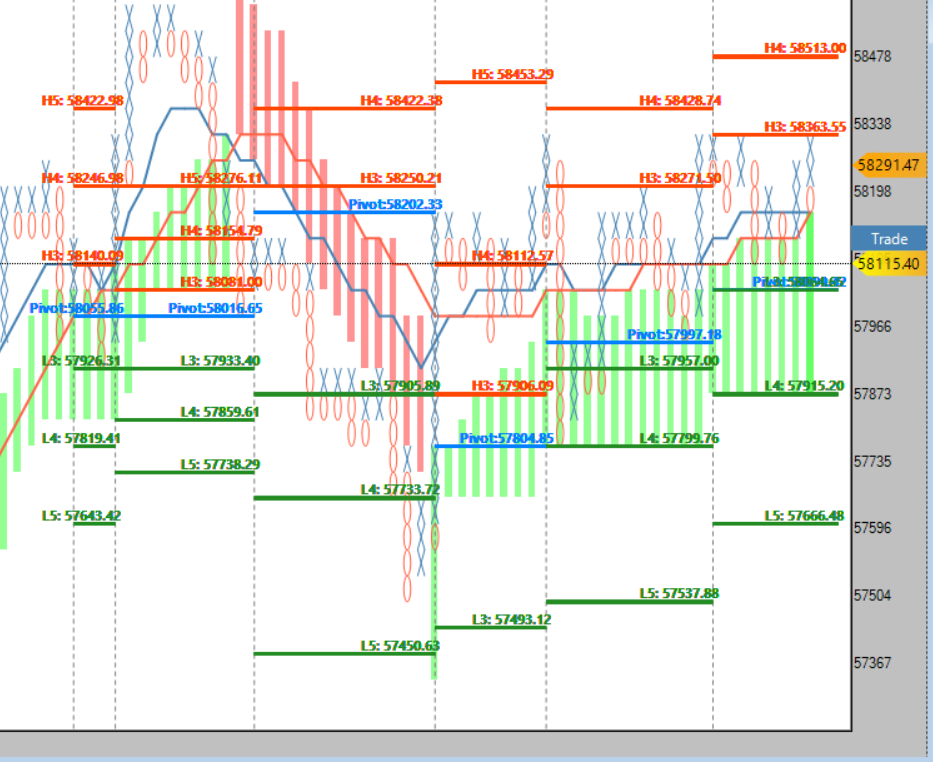
hello team please look in to the image where too much days camrilla levels get ploted and it becomes difficult to read older one very easily-my request is to give option to user that for how many days you wants to plot-like me who saves everydays chart setup i need that days only rest it looks cluter
Thanks
Seasonal Tailwinds Are Back! 
Seasonal Tailwinds Are Back!
Historically, November and December have been among the most rewarding months for Indian markets — with 67% and 74% positive ratios respectively.
Even more interesting, in years when January and February were negative, markets have often ended the year on a strong positive note — except 2011. With 2025 showing a similar pattern, the odds favor a robust year-end rally ahead.
Now is the time to stay invested or increase exposure to quality opportunities — and let seasonality work in your favor.
Participate with confidence. The trend may be your best ally this year-end!
We are constatly accumaling our Favourite ETFs
ALPHA->MOMENTUM50->MIDSMALL->MID150BEES
Nishesh Jani,CFTe
#MarketInsights #YearEndRally #InvestSmart #StockMarketIndia #SeasonalityEdge #WealthGrowth #EquityInvesting #StayInvested #nisheshjani #AhmedabadNest
Midcaps Ready for Their Next Big Move
Midcaps Ready for Their Next Big Move
The Nifty Midcap 150 Index has recently broken out from two major consolidation-cum-resistance formations — Turtle Pattern & Bearish Multiple OPPs.
This comes after a strong Anchor Column, indicating a powerful structural shift in momentum.
Key Level to Watch:
20500 closing level is crucial support.
As long as the index holds above this, the upside remains open.
Potential Upside Targets (Vertical Counts):
26350 → around +17% potential
29400 → around +33% potential
This phase is often where strong quality midcap companies start leading and compounding portfolios.
To participate in this trend in a simple, diversified & cost-efficient manner, investors may consider:
Nippon India ETF Nifty Midcap 150 NSE Symbol: MID150BEES
we are accumalting now
Our View:
This is a high-probability structural opportunity, not just a short-term move.
Nishesh Jani,CFTe
#MidcapMomentum #WealthWithDiscipline #MID150BEES #NipponIndiaETF #MomentumInvesting #SmartInvesting #EquityWealth #MarketInsights #PortfolioGrowth #StayInvested #nisheshjani #AhmedabadNest 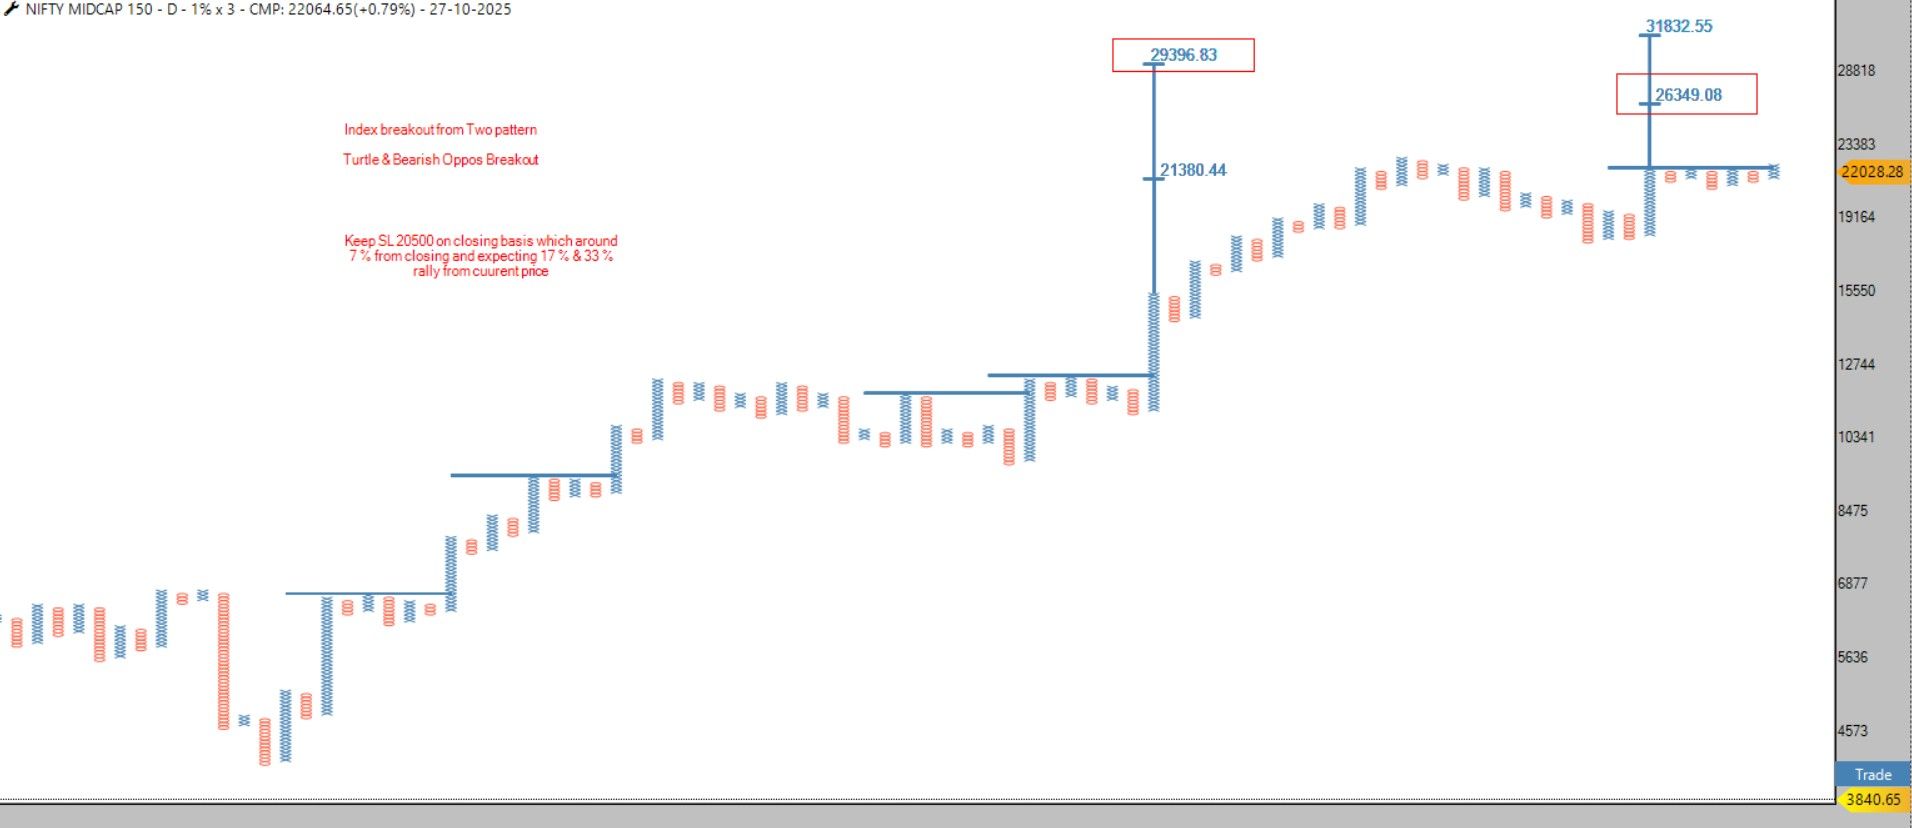
VGM Pick: Bharti Airtel
Bharti Airtel continues to show strong momentum on our VGM Relative Strength (RS) framework.
On the RS chart, the stock has given a PCR signal while continuing its Double Top Buy (DTB) formation, along with a Bullish Mast structure – a clear indication of strong trend continuation.
On the price chart, the pattern is an affordable breakout, opening up a conservative vertical target near ~₹4000 – which is almost 2x from current levels.
For Execution:
Investors and traders may choose their entry & exit based on the RS or Price structure, aligned to their affordable box size and trading system.
For simplicity, one may follow VGM RS rules with predefined price levels to maintain discipline.
Sometimes, clarity is more powerful than speed.
Stay systematic, stay consistent.
Nishesh Jani,CFTe
#VGMStrategy #MomentumInvesting #BhartiAirtel #SmartInvesting #DisciplinedTrading #WealthWithWisdom #MarketLeadership #nisheshjani #AhmedabadNest
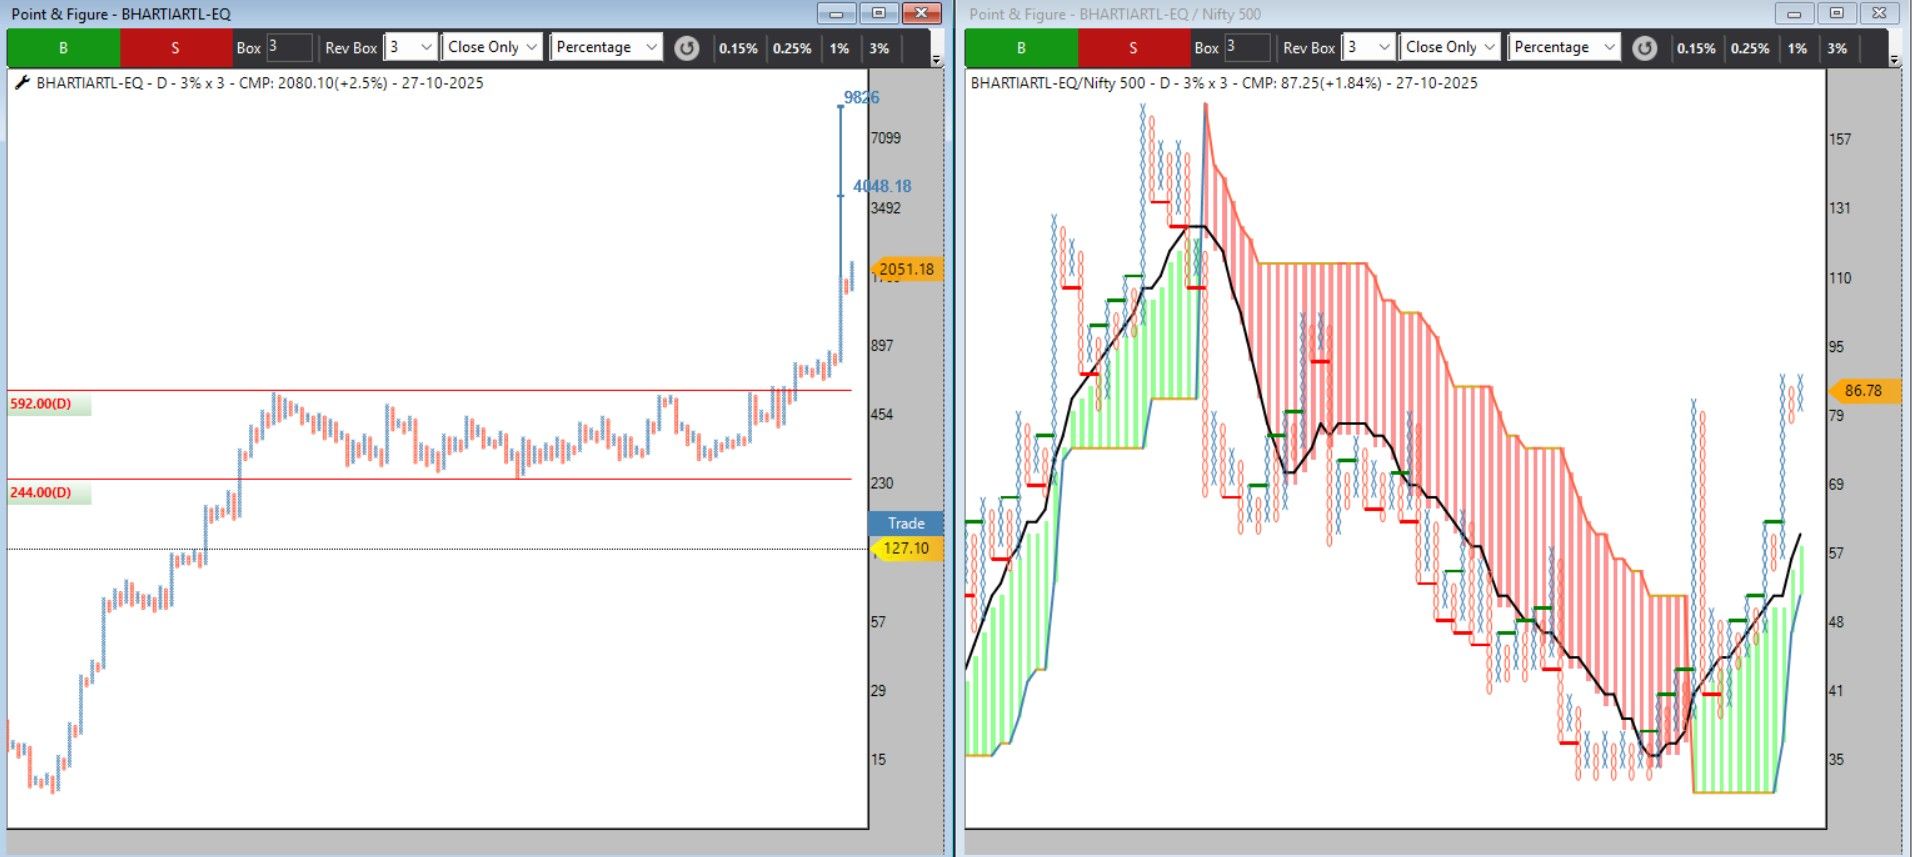
VGM Pick: eClerx Services
VGM Pick: eClerx Services
Price Structure Turning Strong – Momentum Setup Building
eClerx is showing a very healthy technical structure on both Relative Strength (RS) and Price Charts:
RS Chart: Running Double Top Breakout (DTB)
PCR: Last 4 columns holding above Moving Average – confirms strength on dips
On Price Chart – a Mini Bottom / Trap Formation
Followed by a Powerful Momentum Anchor Column
Subsequent Shallow Retracements (only 4-box pullbacks) indicating strong buyers
Multiple Vertical Count targets are now open towards ₹6300 / ₹8000+ from the current region of ₹4450
This structure suggests Accumulation → Breakout → Trend Continuation.
Execution Approach
Long-Term / Positional:
Use DBS (Demand Break Sell) as exit on the RS Chart
Price Chart Exit:
Also follow DBS as per your timeframe
Short-Term / Swing Trades:
Monitor smaller time-frame charts for cleaner entry zones on pullbacks
This is a high-quality trend setup where risk is defined and reward is open-ended.
Nishesh Jani,CFTe
#eClerx #MomentumInvesting #VGM #RelativeStrength #PointAndFigure #DTB #PriceActionTrading #PortfolioInsights #MarketLearning #TechnicalInvesting #TrendFollowing #SmartMoneyMoves #WealthWithDiscipline #nisheshjani #AhmedabadNest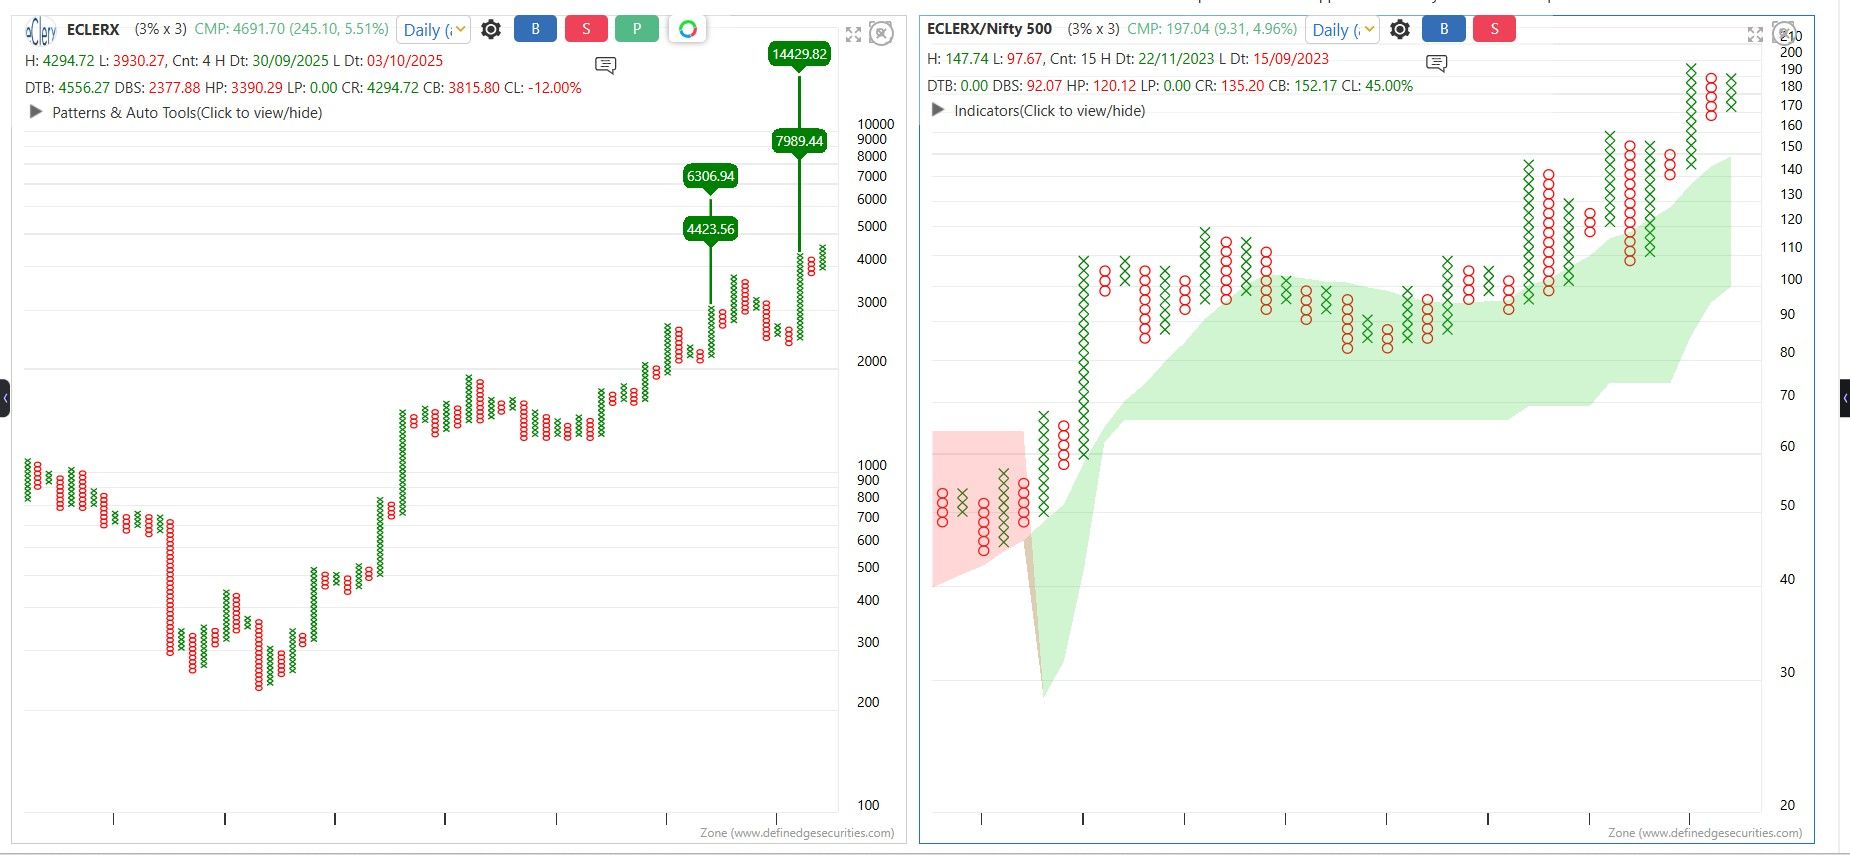
Need scanner condition for P&F Bullish Percent -There is breadth of this and i need to scan the stock name so give me condition of this
#VGM Pick – ACUTAAS
@Prof. Dr. KAMLESH PUROHIT Thanks
#VGM Pick – ACUTAAS
PCR=Positive Column Reversal
Nifty Watch – Key Levels Alert!
Nifty Watch – Post Breakout Levels
Nifty first formed an active mini bottom, followed by a consolidation phase that has now turned into a bullish triangle breakout pattern.
This 4-column breakout opens vertical counts towards 26,420 / 26,766, keeping the bullish momentum intact as long as Nifty holds above 25,132 and no new bearish pattern emerges.
Nishesh Jani,CFTe
#Nifty #MarketUpdate #TechnicalAnalysis #TriangleBreakout #MiniBottom #BullishMomentum #TradingSignals #InvestSmart #StockMarketIndia #TrendFollowing #ClientAlert #ChartAnalysis #nisheshjani #AhmedabadNest
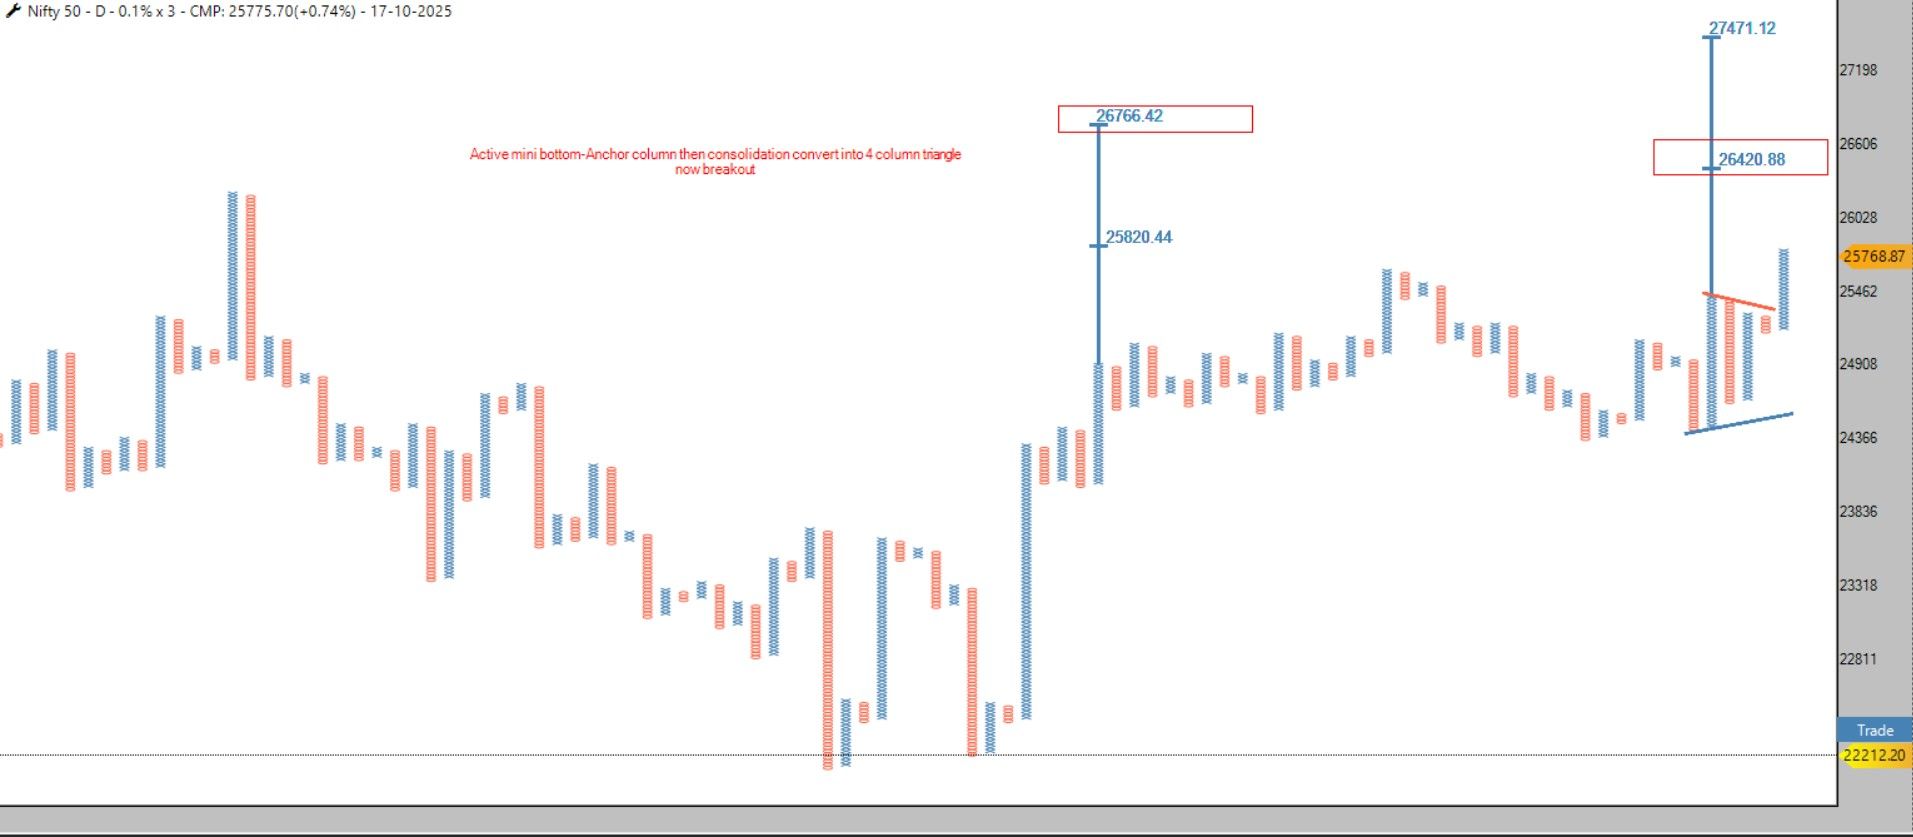
Nifty Watch – Key Levels Alert!
Nifty Watch – Key Levels Alert!
Based on two different charting methods, the crux is clear: a close above 25,450 will negate the H&S top and confirm a breakout from the triangle pattern.
This could signal the start of a strong bullish phase.
Stay tuned – if this level is taken out, will share the detailed chart analysis over the weekend for actionable insights!
Nishesh Jani,CFTe
#Nifty #StockMarketUpdate #TechnicalAnalysis #HSTop #TriangleBreakout #MarketTrends #InvestSmart #TradingSignals #BullishMomentum #ClientAlert #nisheshjani #AhmedabadNest
#VGM Pick – ACUTAAS
#VGM Pick – ACUTAAS
ACUTAAS has turned technically strong on both RS and Price Charts
RS Chart View:
PCR Reversal confirms renewed relative strength.
Last two column lows are holding above the Moving Average, indicating strong momentum.
Bullish MAST Indicator adds further confirmation of trend continuation.
Price Chart View:
DTB Signal Triggered with open vertical counts pointing towards ₹1,991 and ₹2,839,
i.e., +28% and +83% potential from CMP ₹1,548.
Strategy:
50% entry on PCR confirmation.
50% entry on DTB breakout in RS chart.
DBS as Stop Loss for RS-based traders.
Price-based traders can follow Price chart setup.
Momentum + Structure + Confirmation = High Conviction Setup
Nishesh Jani,CFTe
#VGM #ACUTAAS #MomentumStocks #TechnicalAnalysis #RSChart #BreakoutStocks #WealthWithDiscipline #TradingStrategy #MarketLeadership #ProfitWithConfidence #nisheshjani #AhmedabadNest
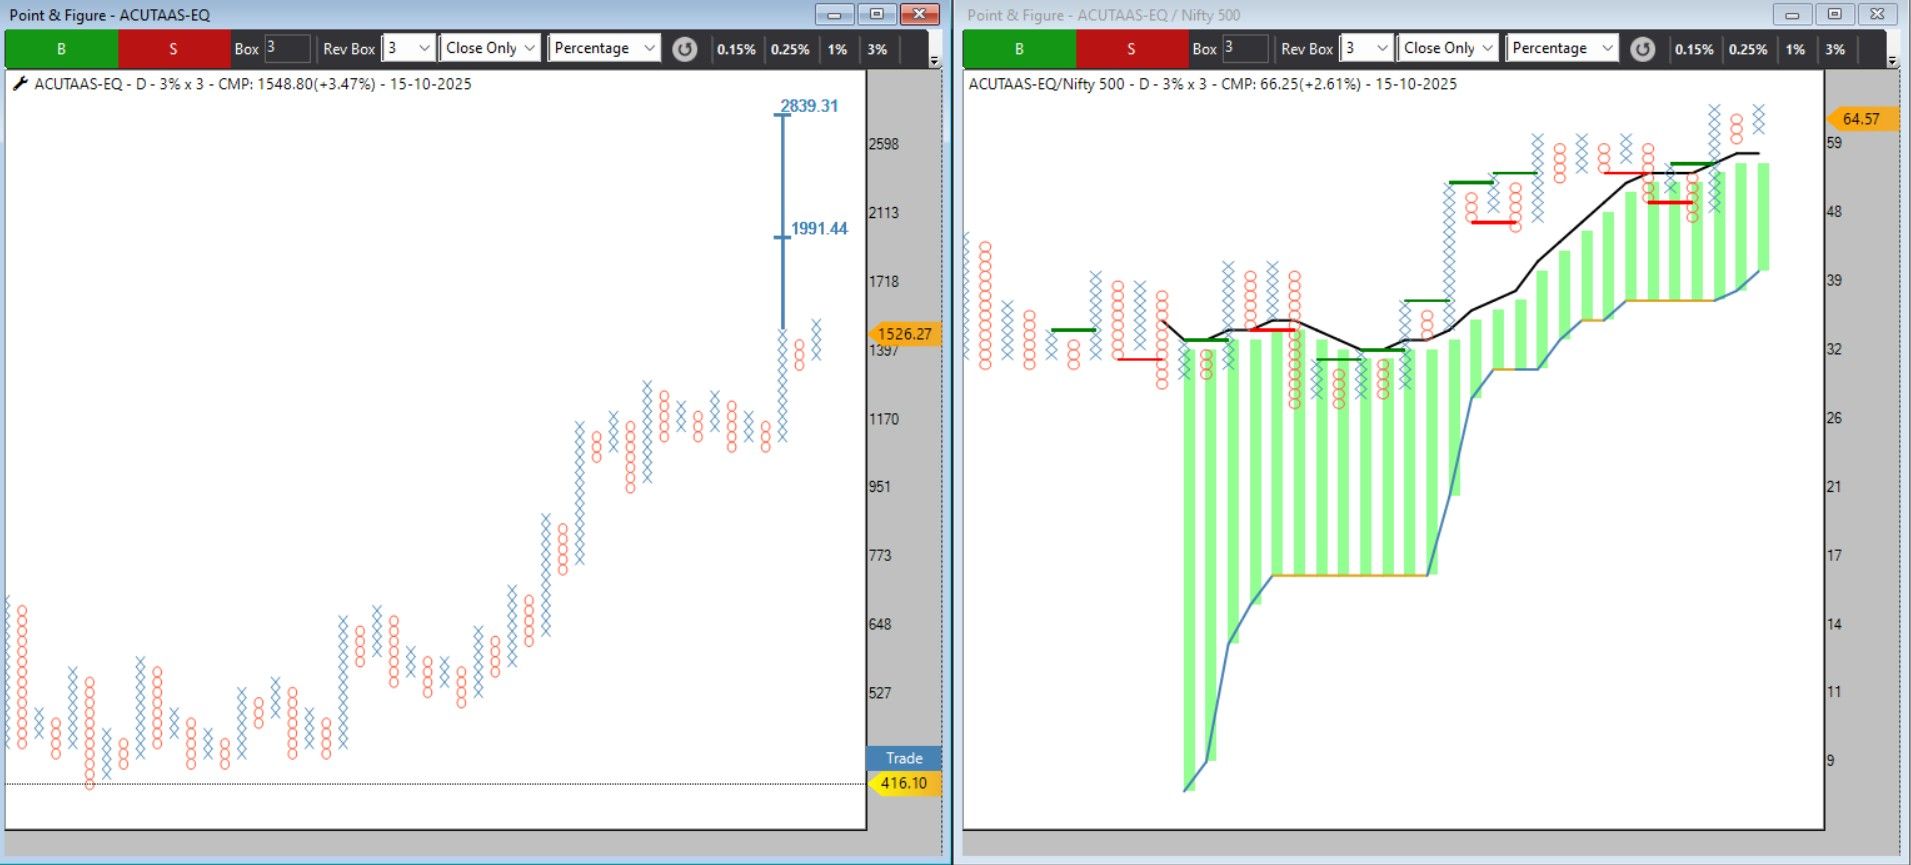
#VGM Pick – PAYTM
#VGM Pick – PAYTM
PAYTM has once again shown strength on both Relative Strength (RS) and Price Charts!
RS chart has given a PCR reversal with a Bullish MAST setup, and the last two column lows are holding above the moving average, confirming underlying strength.
 Price-wise:
Bullish open vertical counts are visible.
Short-term cluster count: 1619
Long-term projection: 3704
This setup aligns perfectly with our #VGM concept (Value • Growth • Momentum) — blending strength, structure, and sustainability.
Strategy:
50% entry on PCR signal
50% entry on DTB confirmation
Use DBS as a trailing stop-loss or follow a price-based approach for dynamic risk management whatever suits you.
Nishesh jani,CFTe
#VGM #PAYTM #MomentumInvesting #TechnicalAnalysis #RSAnalysis #PriceAction #StockMarketIndia #InvestSmart #WealthCreation #TradingSetup #DefinedEdge #BullishMomentum #TrendFollowing #nsiheshjani #AhmedabadNest
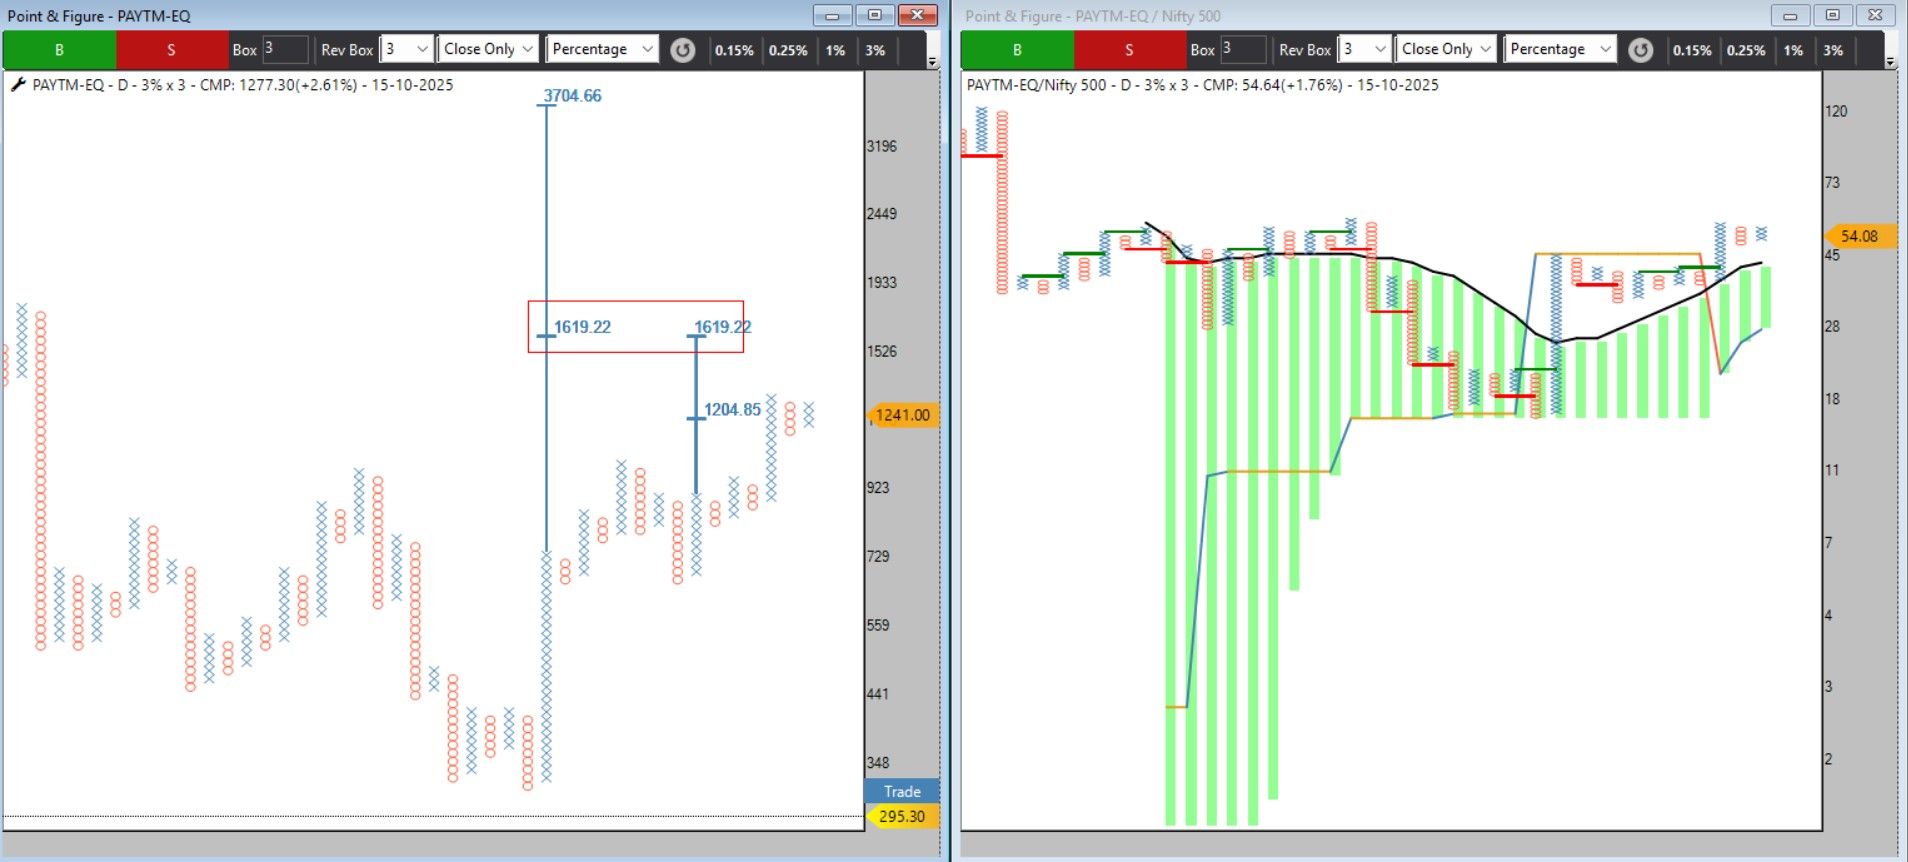
Gold vs Equity — The Signal Has Turned!
Gold vs Equity — The Signal Has Turned!
History has a way of repeating itself.
Every time our Smooth RSI indicator on the NIFTY500 vs GoldBees ratio fell below 30 — in 2009, 2011, 2013, 2020, and now in 2025 — it marked a major shift in favor of Equity over Gold.
Each of those moments turned out to be the best time to move from Gold to Equity — and history seems to be whispering the same message again.
When data, trend & time align — it’s not just a signal, it’s an opportunity.
This is the time to increase allocation to Equity and participate in the next growth cycle.
Let your money work where momentum is shifting — towards Indian Equities.
Homework for you -> On Gold Bees monthly chart add 14 Period ROC % , Spped of Price strength is even the highest of 2008 sub prime crisis and 2020 COVID
Smooth RSI approaching 100
what could be my strategy if i hold GOLD & SILVER Bees?
everyday sell 1% Bees and allocate in my favourite
ALPHA-MOMENTUM50 -MIDSMALL ETF/Bees
Nishesh Jani,CFTe
#EquityOpportunity #GoldVsEquity #InvestmentInsights #Nifty500 #WealthCreation #MarketCycle #SmartInvesting #DataDrivenDecisions #RenkoAnalysis #InvestWithConfidence #nsiheshjani #AhmedabadNest 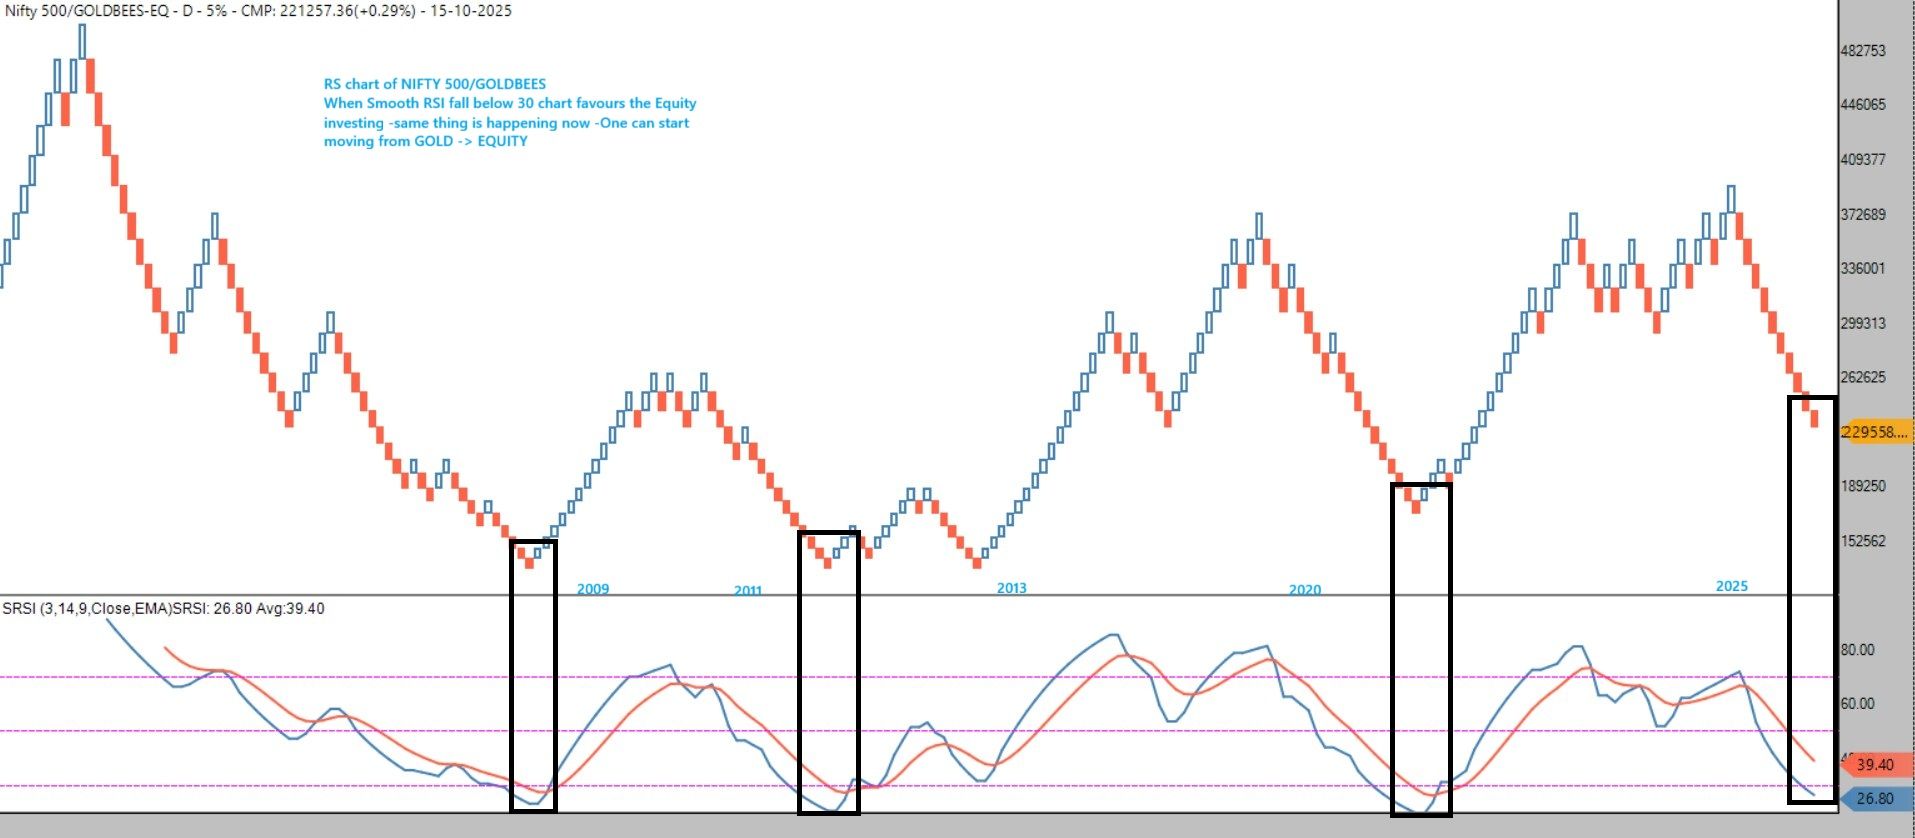
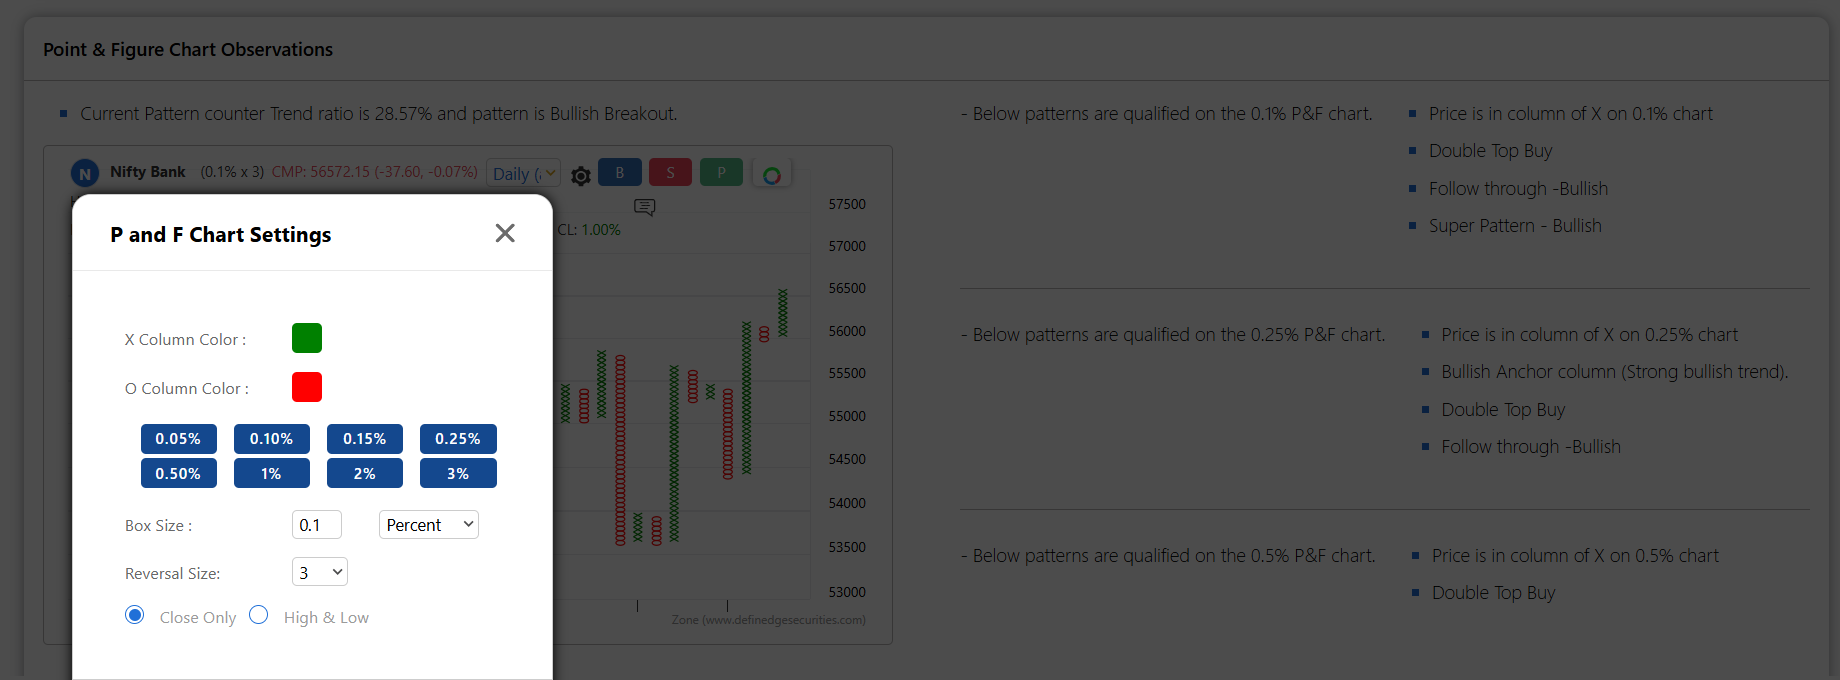
kindly add such system that as and when we change the box size commentry changes as per it -that will help to get idea very fast in few seconds what is happening as per my choosen box size
Thanks
#VGMPick – MCX
#VGMPick – MCX
MCX has been a strong VGM outperformer since April 2024 when it gave a Double Top Buy (DTB) in RS above MAST at 3000. Since then, the stock has appreciated 125%, significantly outperforming the Nifty500.
Current Structure:
Running DTB in RS
Price & RS both strong with bullish continuation patterns
On a close above 9262, vertical counts project 17746
No guessing on “aur kitna jayega” – we let charts guide us instead of emotions
Allocation Strategy:
50% on PCR confirmation
50% on DTB with DBS as Risk Management
We don’t predict where the stock will top out. Instead, we follow the structure and let the charts decide the journey.
Nishesh Jani,CFTe
#VGM #TechnicalAnalysis #RSCharts #MCX #SmartInvesting #ChartsOverNoise #BullishBreakout #TrendFollowing #nisheshjani #AhmedabadNest
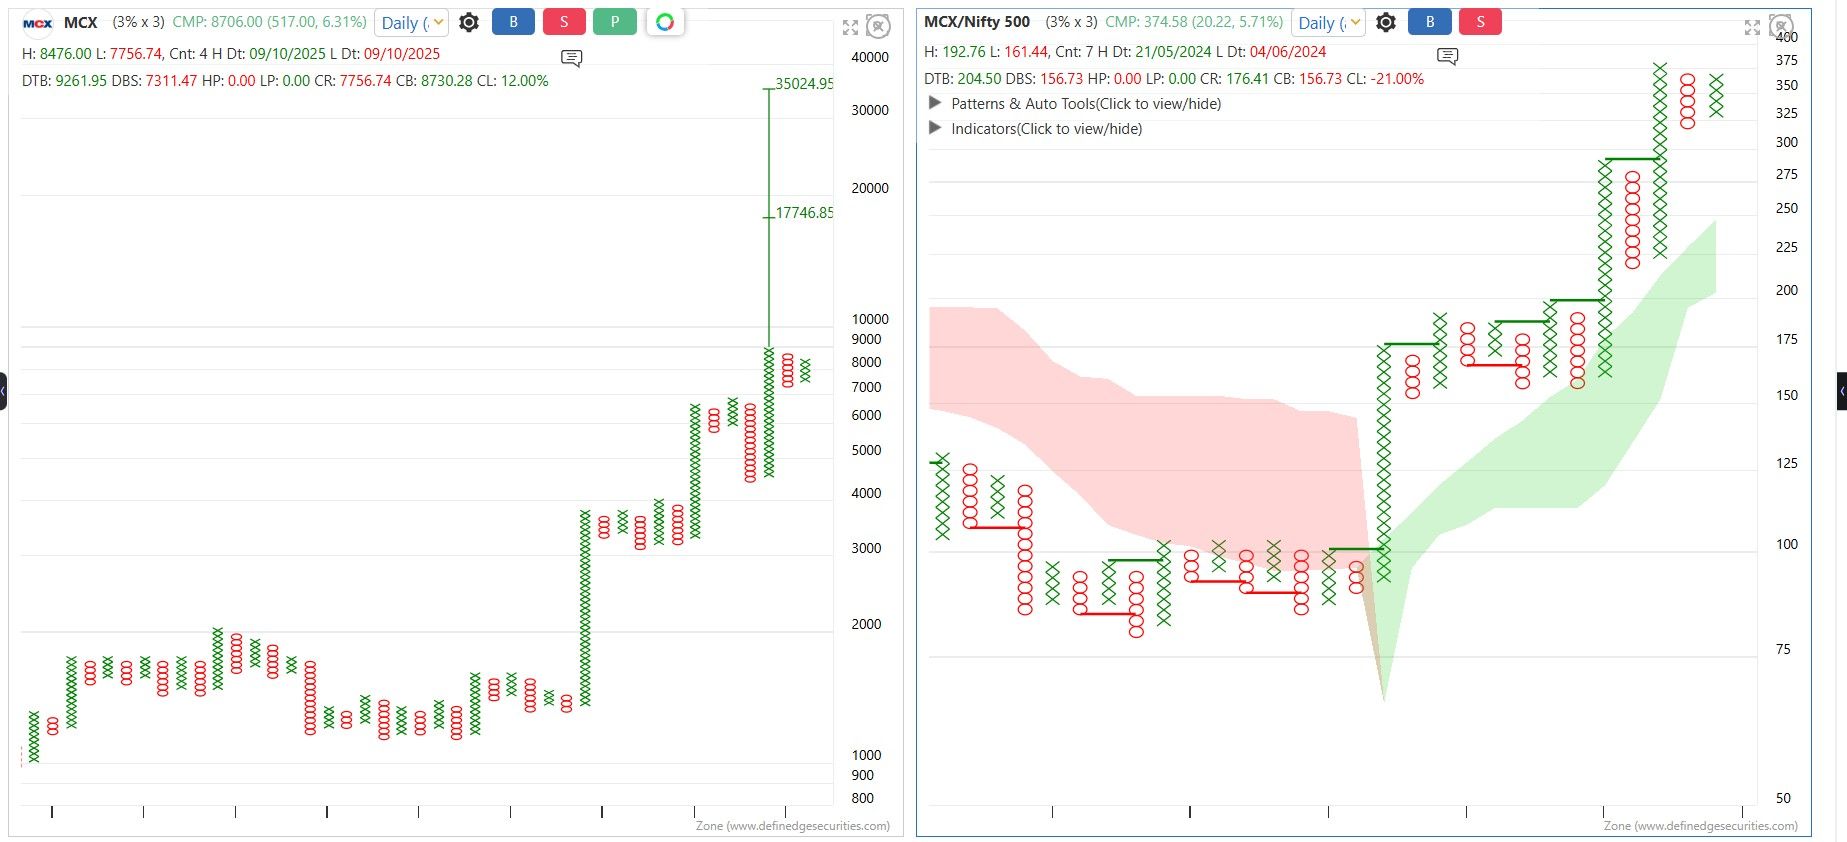
VGM Case Study | MCX
VGM Case Study | MCX
On 24th April 2024, our VGM Approach generated a BUY in MCX with DTB above MAST.
Since then, the stock has only given DTB continuation signals – no DBS exit.
From those levels, MCX delivered an impressive +125% return, while Nifty 500 managed just +12% in the same period.
The journey was never linear:
Faced 40% correction & later 14% correction.
Yet, MCX showed remarkable strength within VGM setup and continues to stay structurally bullish.
Lesson: A robust system like VGM helps filter out noise, stick with strength, and ride long-term trends.
Nishesh Jani,CFTe
#VGM #SystemBasedTrading #MCX #MarketOutperformance #DisciplinePays #TradeWithConfidence #TechnicalAnalysis #SmartInvesting #nisheshjani #AhmedabadNest 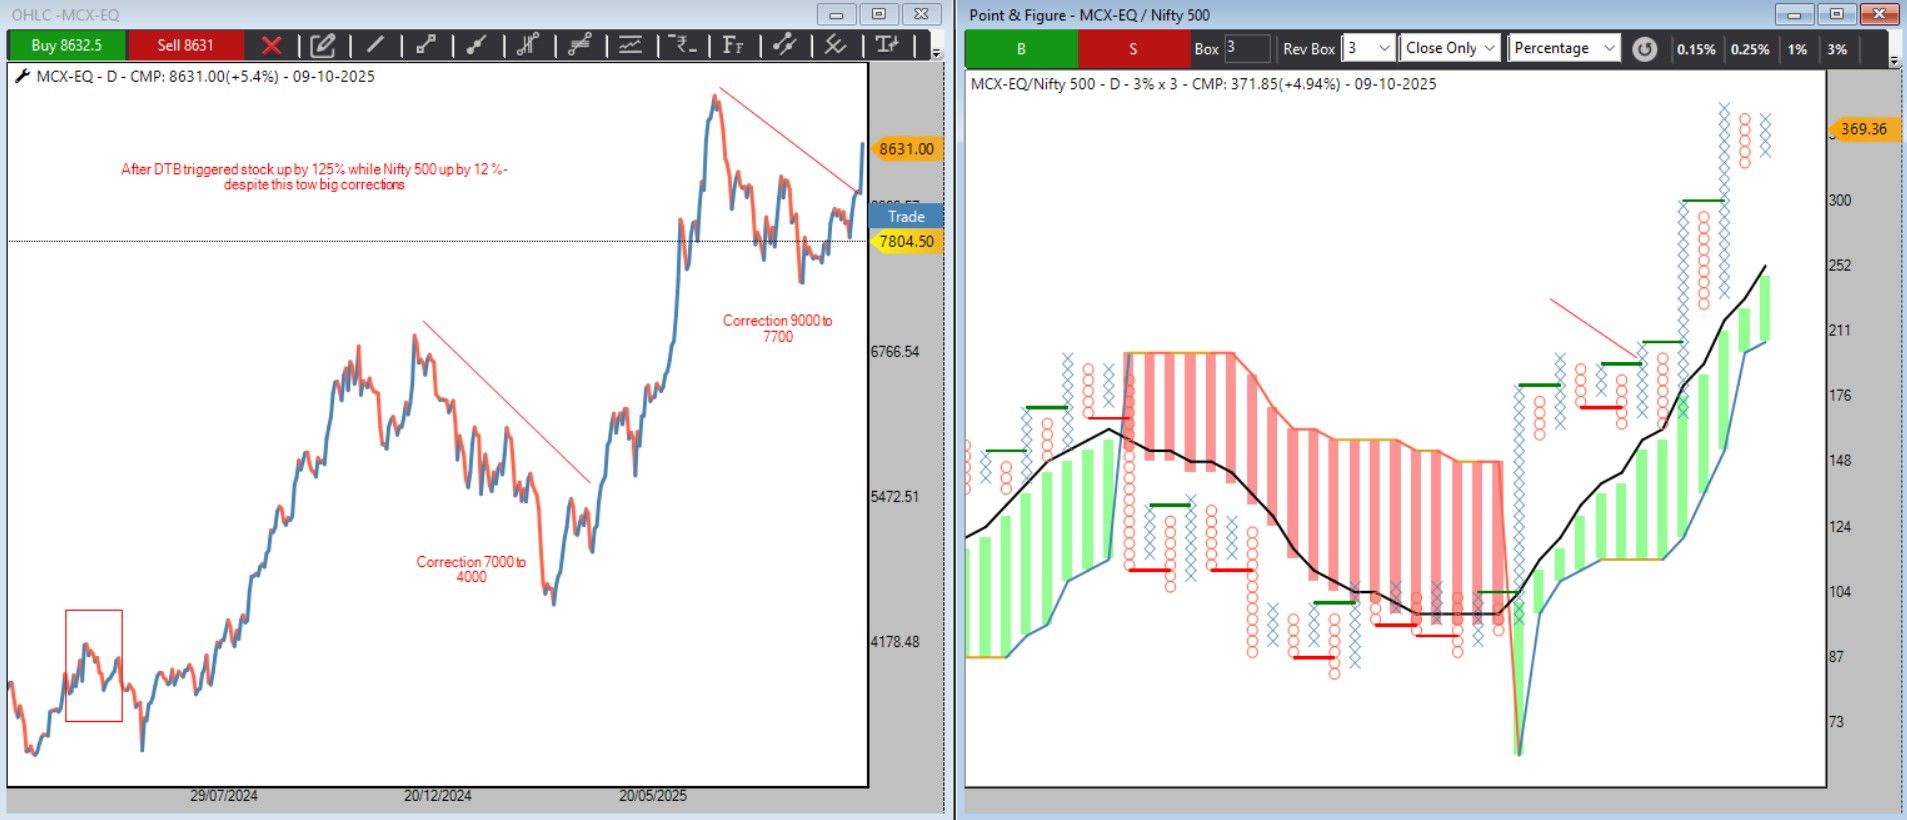
#VGM Pick – Karur Vysya Bank
#VGM Pick – Karur Vysya Bank
RS chart shows PCR above MAST with a running DTB bullish structure.
Risk Management: Trail positions with DBS as Stop Loss.
Price Action: A close above 231 will unlock multiple vertical counts projecting towards 318 and 455.
Allocation Strategy: Deploy 50% now and the remaining 50% on DTB confirmation.
A structured approach combining RS strength, pattern validation, and disciplined allocation helps balance risk & reward effectively.
Nishesh Jani,CFTe
#VGM #KarurVysyaBank #StockMarket #InvestmentStrategy #TechnicalAnalysis #SmartInvesting #RSChart #DTB #PCR #WealthCreation #nisheshjani #AhmedabadNest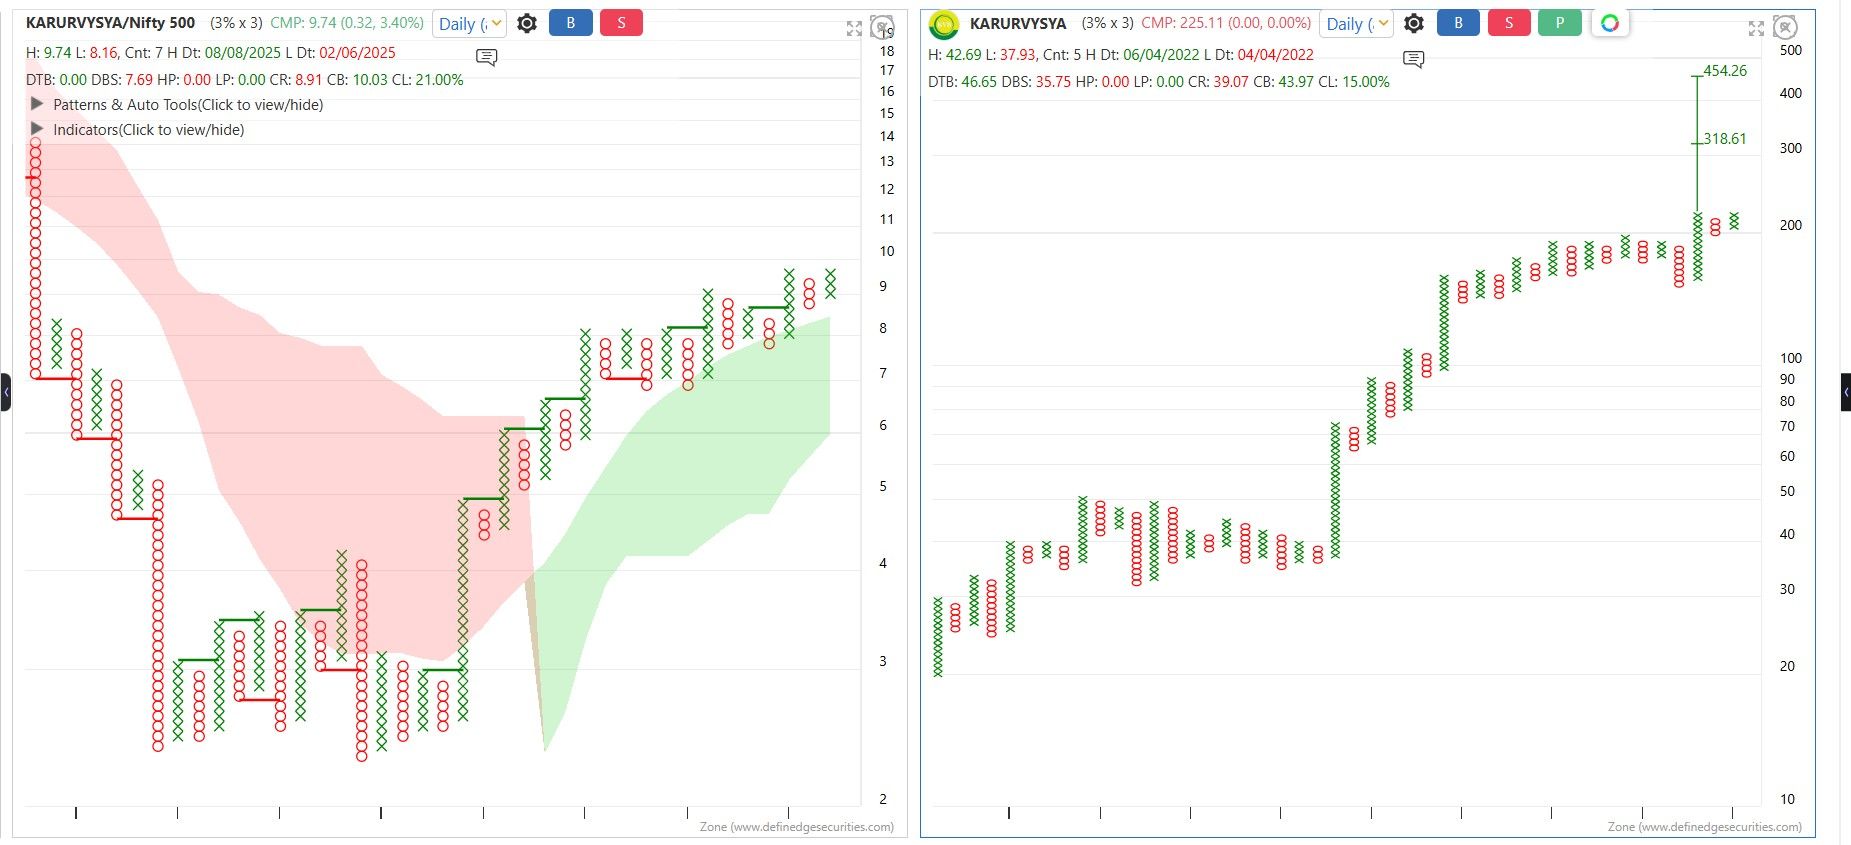
VGM Pick – JM Financial
VGM Pick – JM Financial
Technical Snapshot
RS Chart: PCR above MAST with running DTB (bullish strength).
Price Action: Stock has broken out above a 9-year consolidation period.
Pattern: Active Super Pattern with price counts projecting 259 and 400+ levels.
Strategy
Allocate 50% on PCR confirmation.
Allocate 50% on DTB breakout.
Use trailing DBS as a strict risk management tool.
This structured allocation ensures participation while keeping risk under control.
Nishesh Jani.CFTe
#VGM #StockMarket #TechnicalAnalysis #JMFinancial #BreakoutStocks #SmartInvesting #RiskManagement #ConsolidationBreakout #BullishSetup #nisheshjani #AhmedabadNest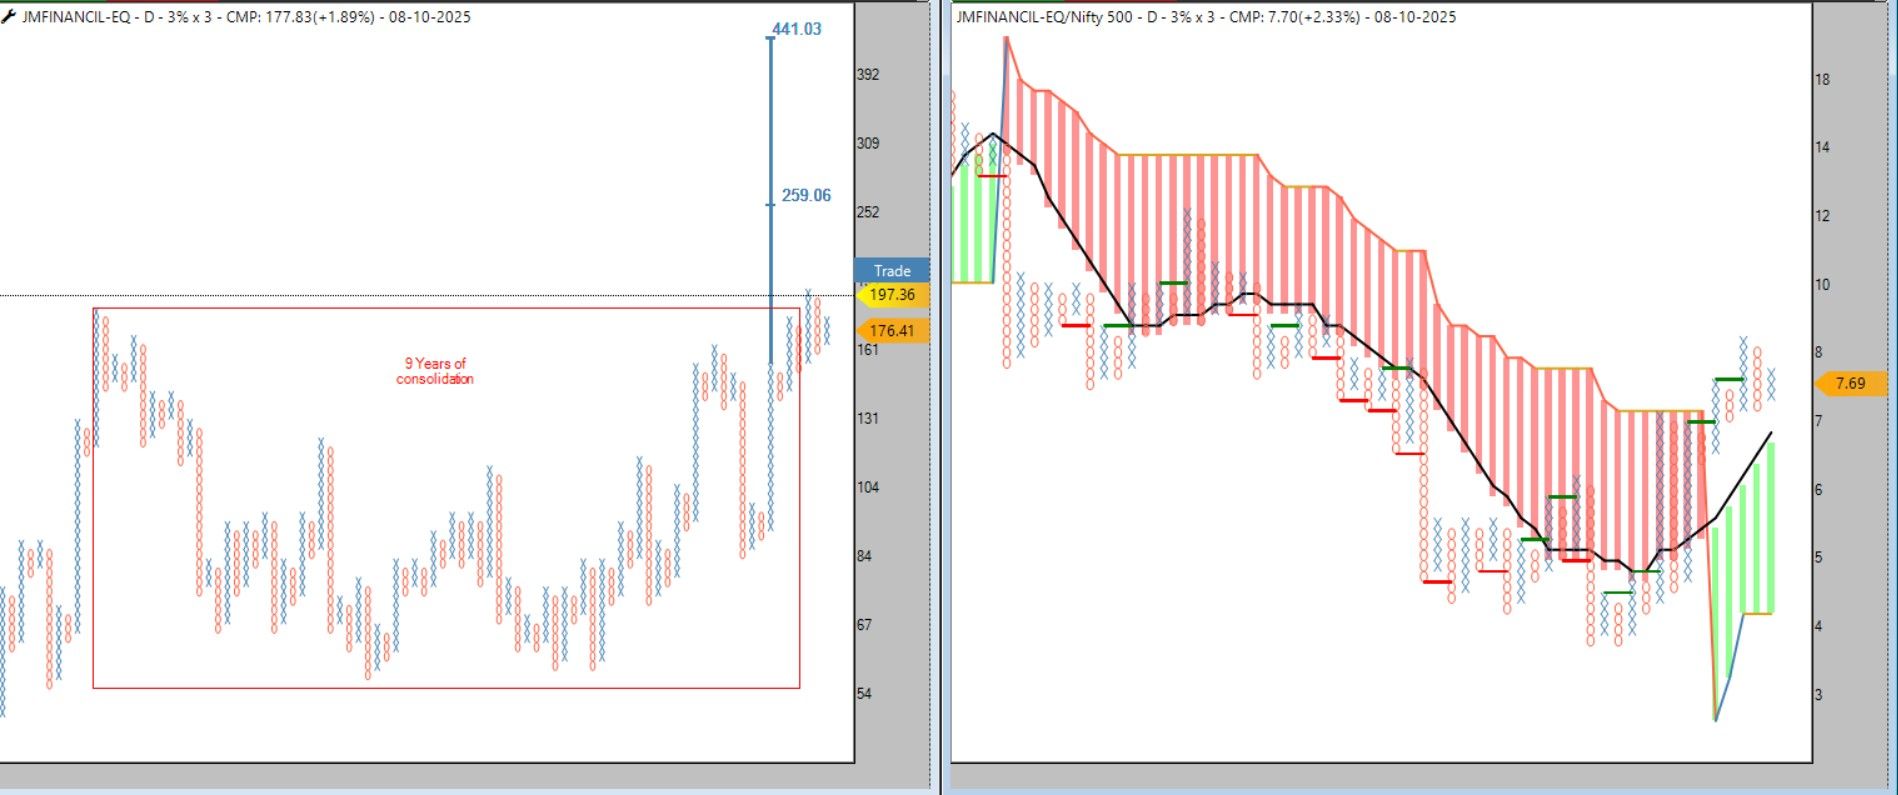
#VGM Pick – Shaily Engineering
#VGM Pick – Shaily Engineering
Shaily Engineering has triggered a Positive Column Reversal with bullish confirmations
RS Chart: Above MAST, last two column lows above MA
No immediate Double Bottom Sell → Continuation of DTB (bullish structure)
Price-wise Setup: Probable T-20 pattern with an active mini bottom
Vertical Counts: Target at 3815 (≈58% higher than current price of 2411)
Strategy :
Deploy 50% allocation now
Deploy remaining 50% on DTB confirmation with RS breakout (DBS as SL)
A structured, risk-managed way to participate in a promising bullish setup.
Nishesh Jani,CFTe
#VGM #StockMarket #ShailyEngineering #BullishBreakout #SmartInvesting #TechnicalAnalysis #PortfolioStrategy #nisheshjani #AhmedabadNest
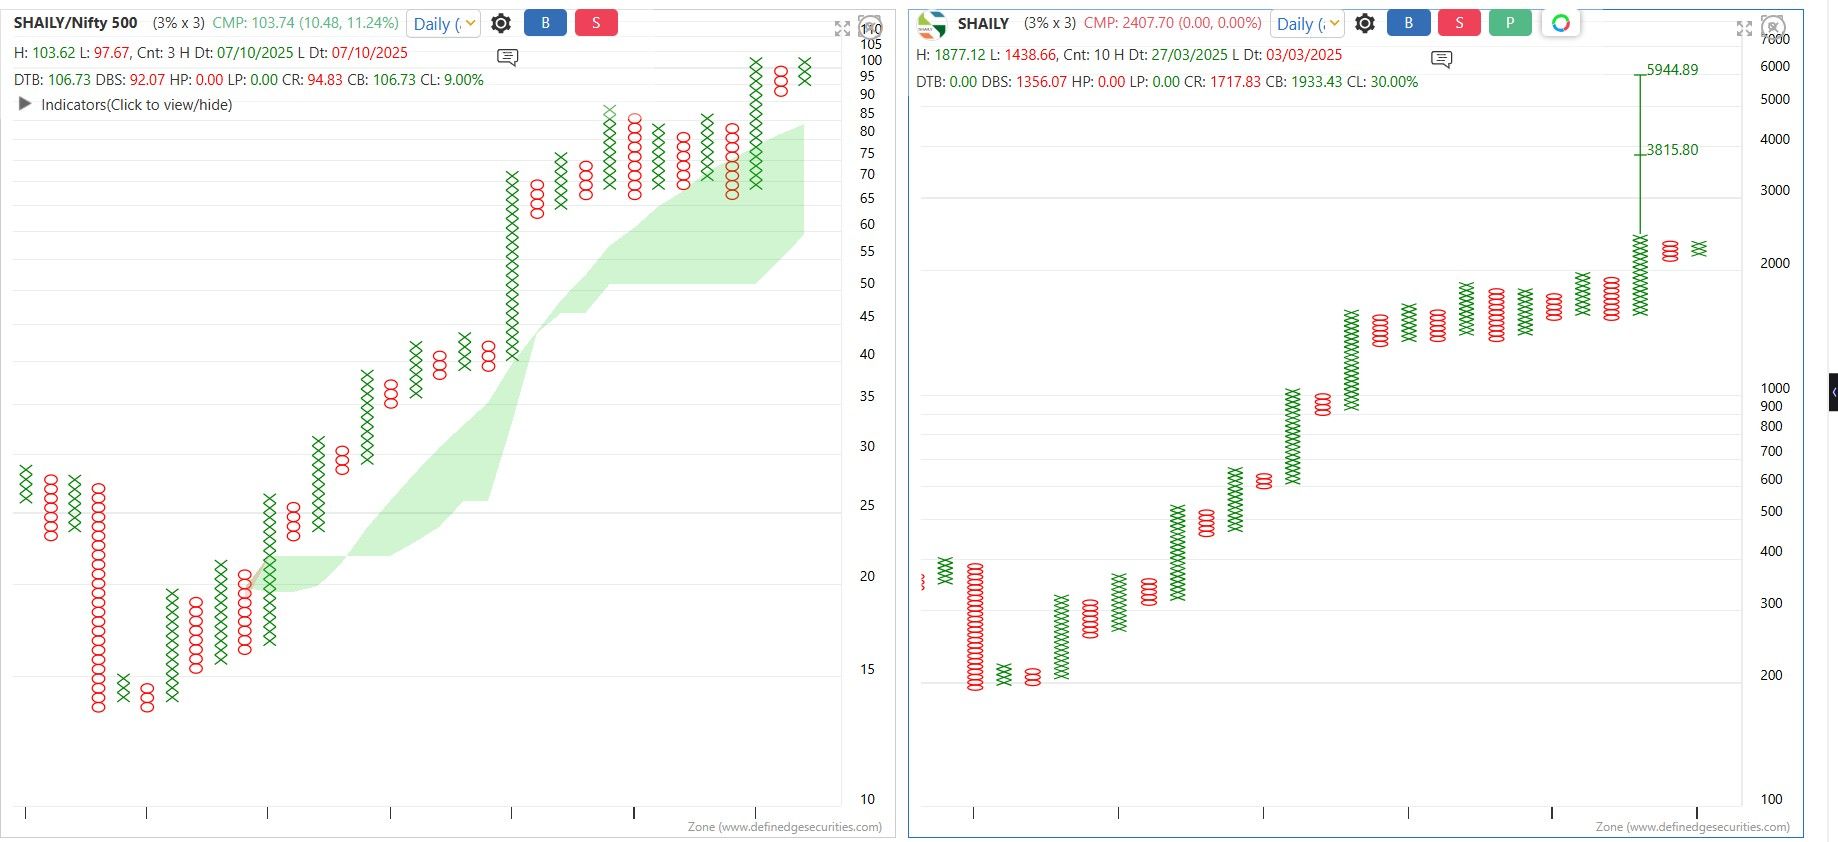
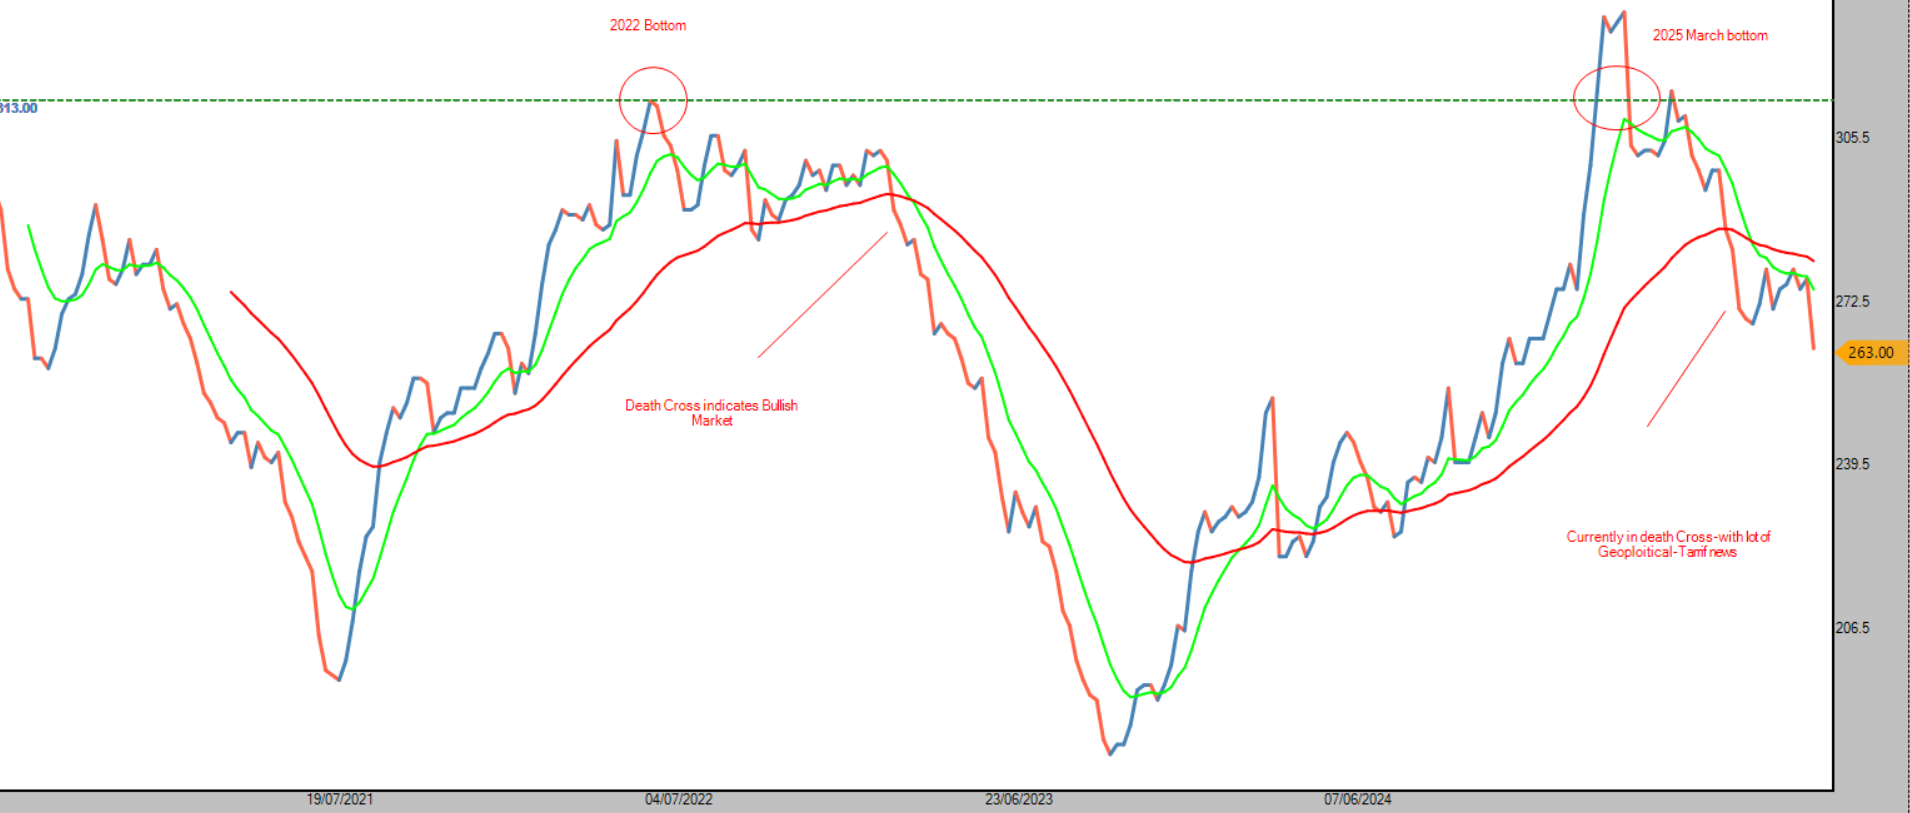
Now this conterian indicator has given death cross signal this indicates bullish market-First in march market find bottom now after 6 month this has given death cross signal with lot of uncertainity news like geoplotical front-tarrif etc
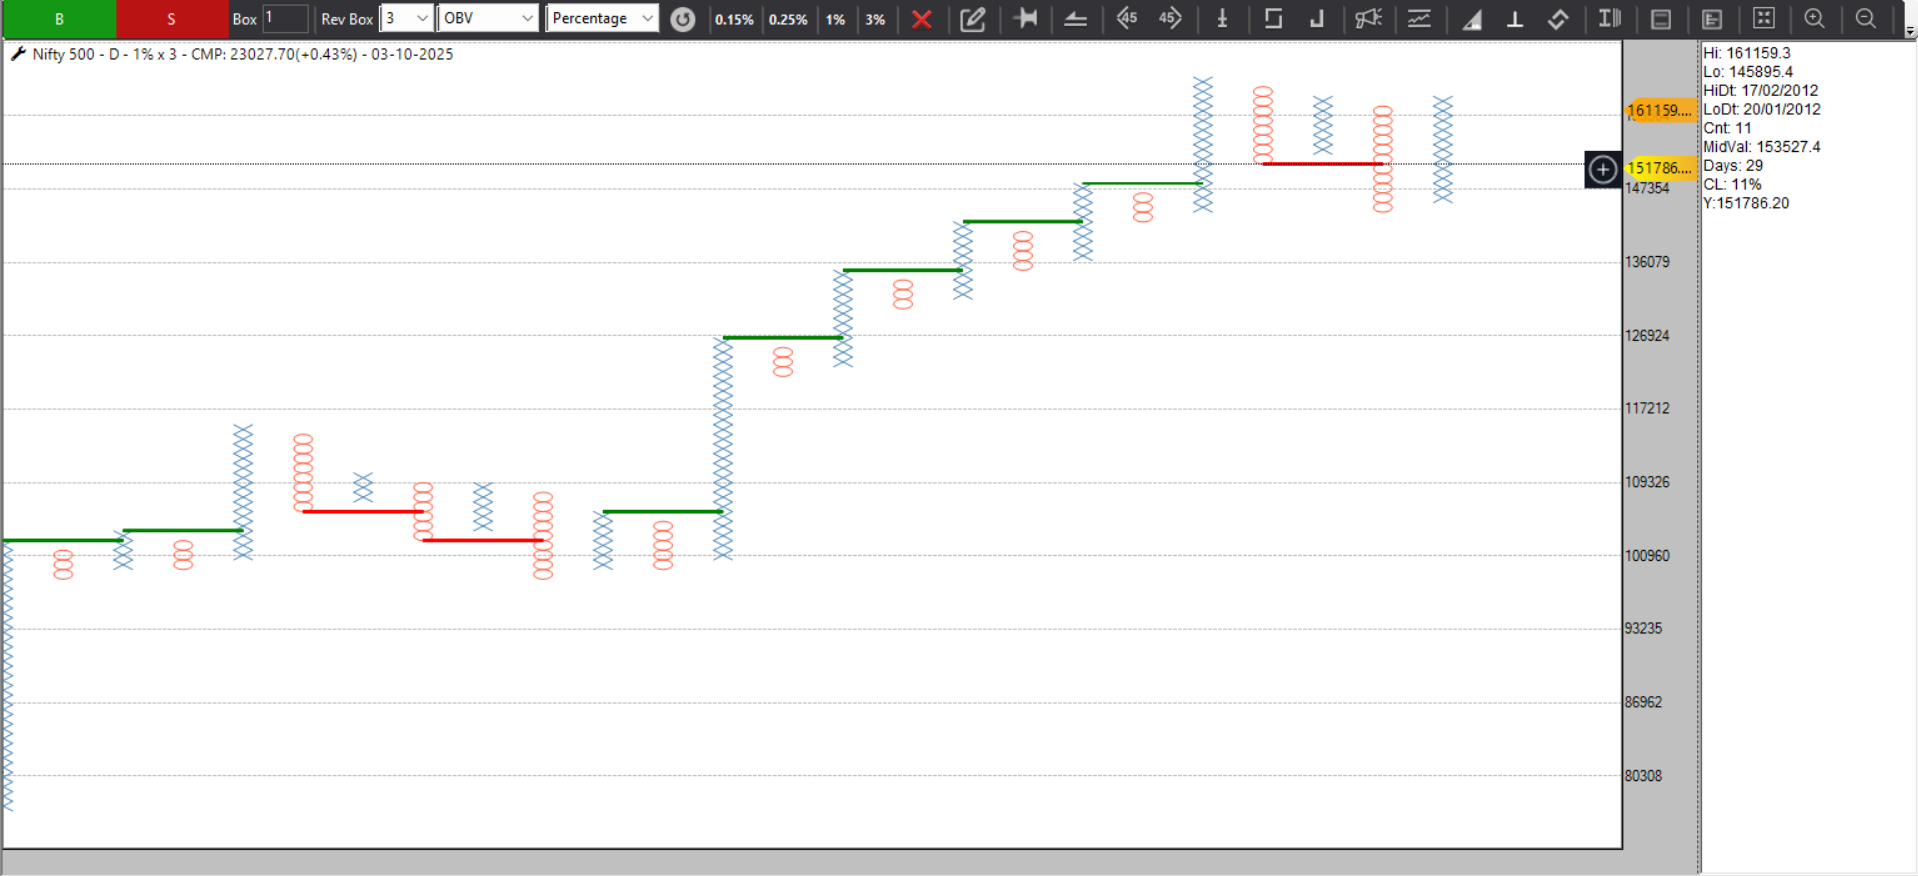
i just opend chart of Nifty 500 indicator OBV on P&F but data is missing from 2012 kindly do needful ,for nifty 50 it is upto date
prashant sir can we have backtesting for this ?
Battle of Bulls vs Bears on the Charts!
Battle of Bulls vs Bears on the Charts!
Market at a make-or-break stage:
Bulls are ready with 2 strong patterns:
 Cup & Handle
 Inverse Head & Shoulder
Bears are armed with 1 classic pattern:
 ️ Head & Shoulder
Trendlines are drawn, labels are clear – the breakout can go either side.
Traders, this is not a time to predict – it’s a time to PREPARE!
Because whichever side wins, the move will be explosive.
Stay sharp. Stay ready. This chart could become the talk of the town in the stock market community.
Nishesh Jani,CFTe
#StockMarket #Nifty #Sensex #TechnicalAnalysis #ChartPatterns #CupAndHandle #HeadAndShoulders #BullVsBear #BreakoutTrading #TrendIsFriend #nisheshjani #AhmedabadNest 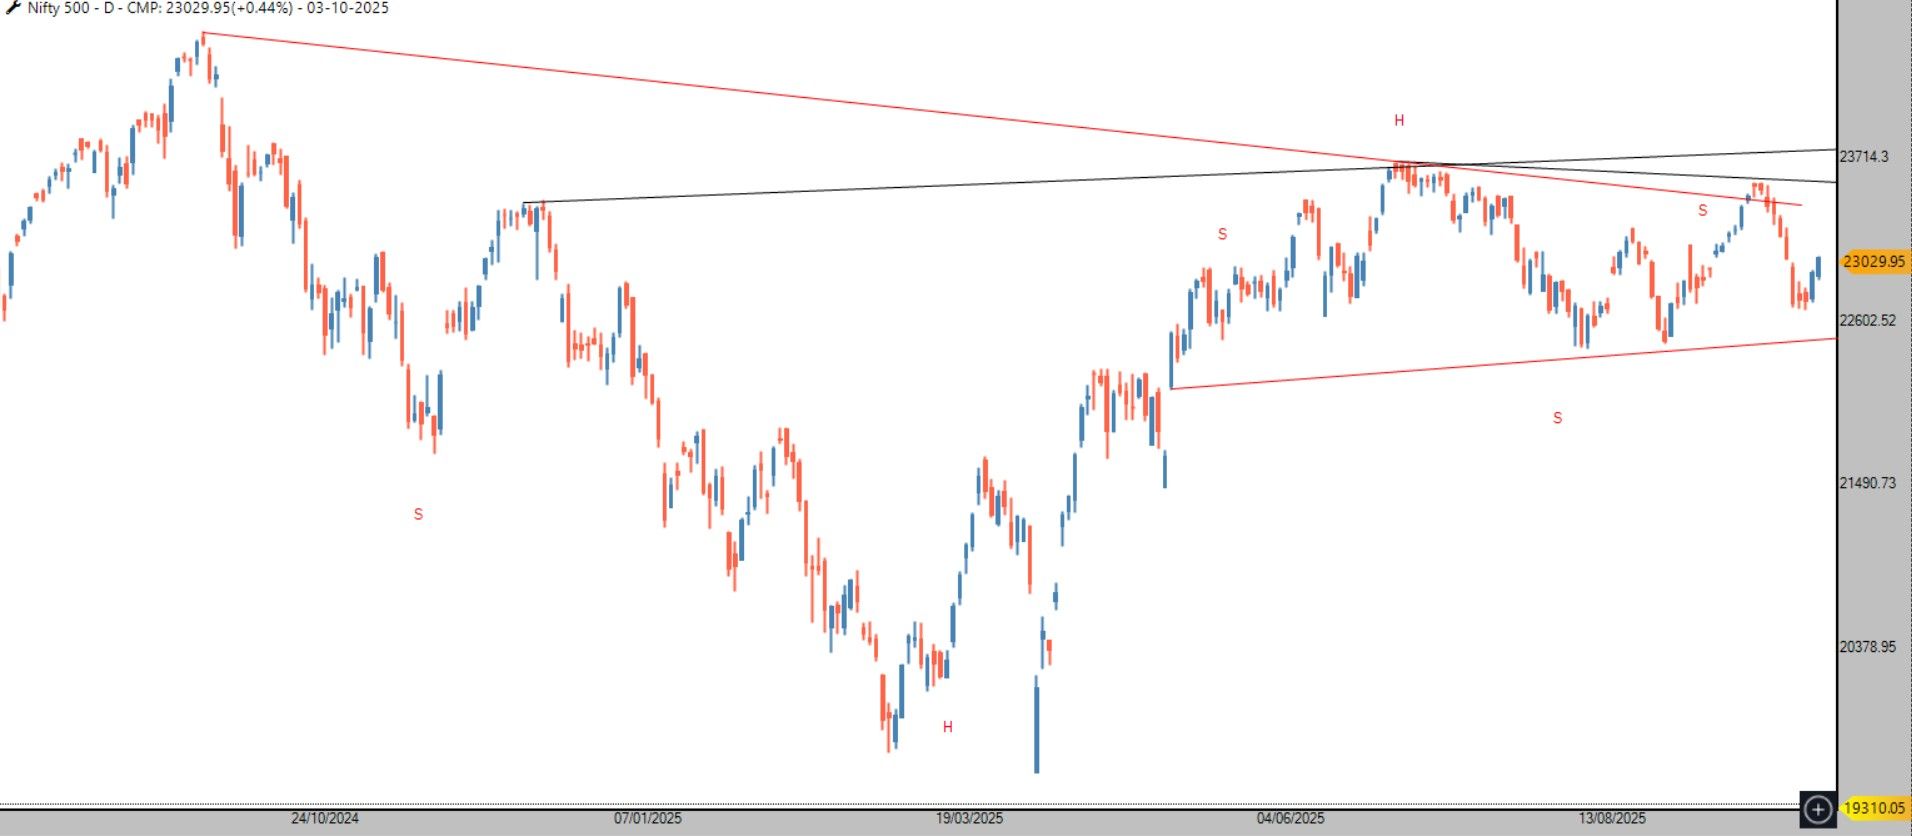
Nifty 500 Broader Market Outlook Monthly weekly Prospective
Nifty 500 Broader Market Outlook
On the Monthly Chart, Nifty 500 is in progress of a Cup & Handle formation.
A monthly close above 24,000 will activate this pattern with a potential target of 29,000.
On the Weekly Chart, an Inverse Head & Shoulder pattern is forming.
A weekly close above 24,000 confirms the breakout with the same 29,000 target.
Post breakout, we expect an impressive 20% rally in the broader market!
We are constantly adding our favorite ETFs:
ALPHA
MOMENTUM50
MIDSMALL
This is the time to stay invested & build for better future returns.
Nishesh Jani,CFTe
#Nifty500 #BroaderMarket #TechnicalAnalysis #CupAndHandle #InverseHeadAndShoulders #ETFInvestment #MomentumInvesting #SmartInvesting #StockMarketIndia #WealthCreation #FutureReturns #nisheshjani #AhmedabadNest 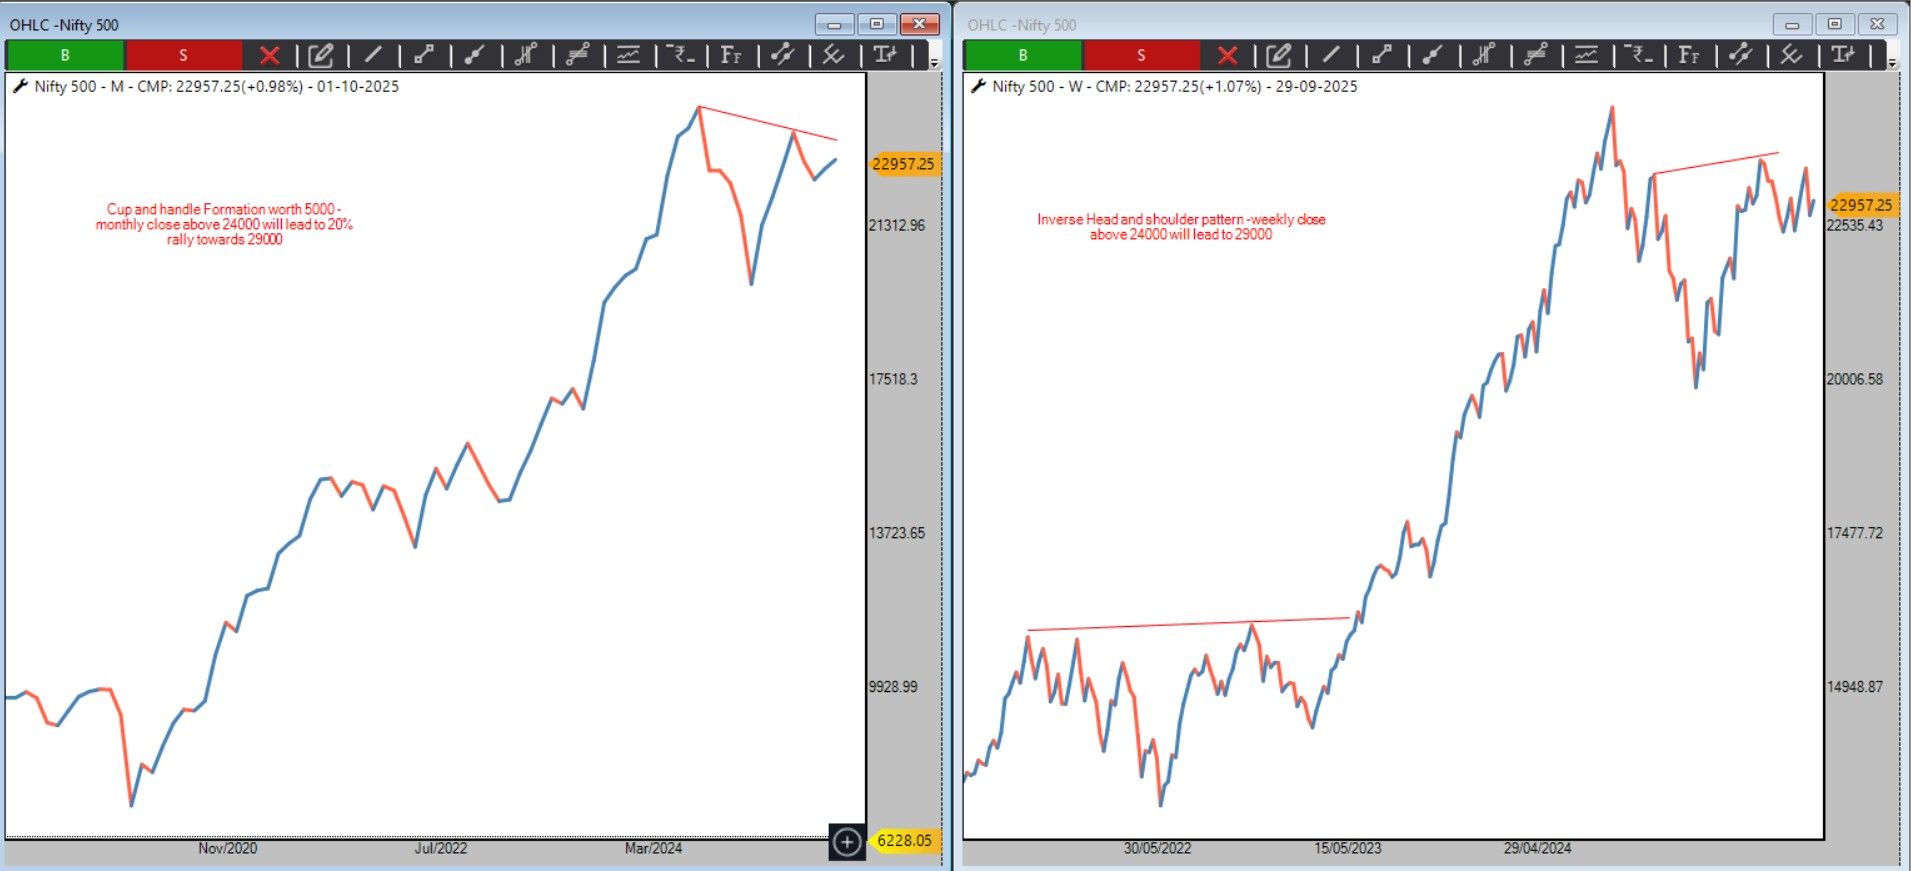
Team definedge
suggestion for backtesting related
we scan many strategy on many universe on many different periods to see the results,the problem we face is to save and write all conditioon and everything in xl sheet and save in different folders so my suggestion is to have either
when download the backtested report add all momentum engine selection-conditions so every time we dont need to write them in xl sheet
or
give an option to save every backtested results with all the conditions we have used so any time we can refer
one incidence i would like to share that i have back tested one strategy with very good results but i forget to downmload and notw down the conditions and till date i am not able to find it out so in above case if we can save everything online or download all backtest + condition used will be easy for future reference
Thanks
“Momentum may rest, but it never retires – dips are opportunities, not threats.”
we continue to accumulate our three momentum-driven ETFs – ALPHA, MOMENTUM50, and MIDSMALL – during this correction and consolidation phase.
Why? Because history shows that adding in weak phases builds the strongest foundation for long-term outperformance. When the market turns bullish, those who stayed disciplined and invested are the ones who reap the maximum fruits.
Stay calm, stay invested – this is the time to build, not to exit.
Nishesh Jani,CFTe
 #MomentumInvesting #ETFStrategy #SmartBeta #FactorInvesting #AlphaGeneration #MarketCorrection #BuyTheDip #StayInvested #LongTermWealth #PatiencePays #nisheshjani #AhmedabadNest
#VGM Pick: BEL
#VGM Pick: BEL
BEL has shown Column Reversal on our setup
Last 2 columns not touching MA
Shallow retracements with immediate CR 
Strong technical structure intact
Strategy:
 Deploy 50% now
Add rest on DTB with DBS as Risk Management
Disciplined entries + Smart risk control = Long-term success!
Nishesh Jani,CFTe
#StockMarket #BEL #VGM #TechnicalAnalysis #TradingStrategy #SmartInvesting #ChartPatterns #RiskManagement #MomentumTrading #NSE #IndianStocks #nisheshjani #AhmedabadNest 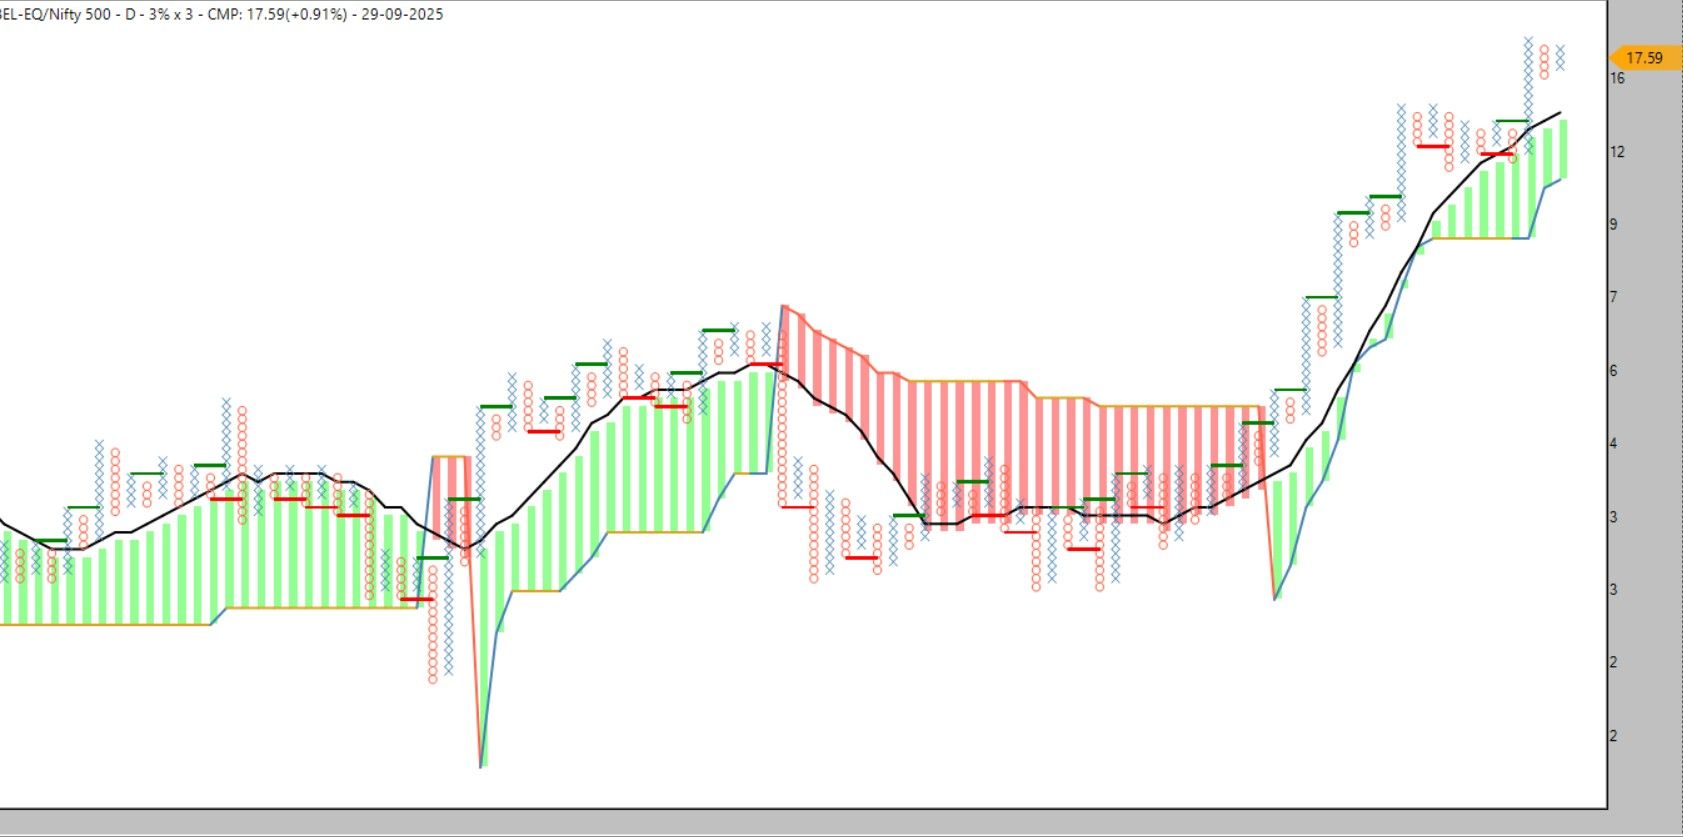

 Shubh Navratri to all my Stock Market Warriors!
Shubh Navratri to all my Stock Market Warriors!
Just like Navratri teaches us discipline, patience, and devotion, successful investing & trading also require faith in your process, discipline in execution, and patience in results.
 May Maa Durga bless you with the strength to hold your conviction, the wisdom to manage risks, and the courage to overcome market volatility.
This Navratri, let’s celebrate not just the festival, but also the journey of building wealth with positivity and balance. 
 Wishing you Profitable Trades & Peaceful Investments!
Nishesh Jani,CFTe
#HappyNavratri #StockMarketWisdom #DisciplineAndPatience #ProfitableJourney #ShubhNavratri #StockMarketIndia #InvestingWithFaith #TradingWithDiscipline #nisheshjani #AhmedabadNest
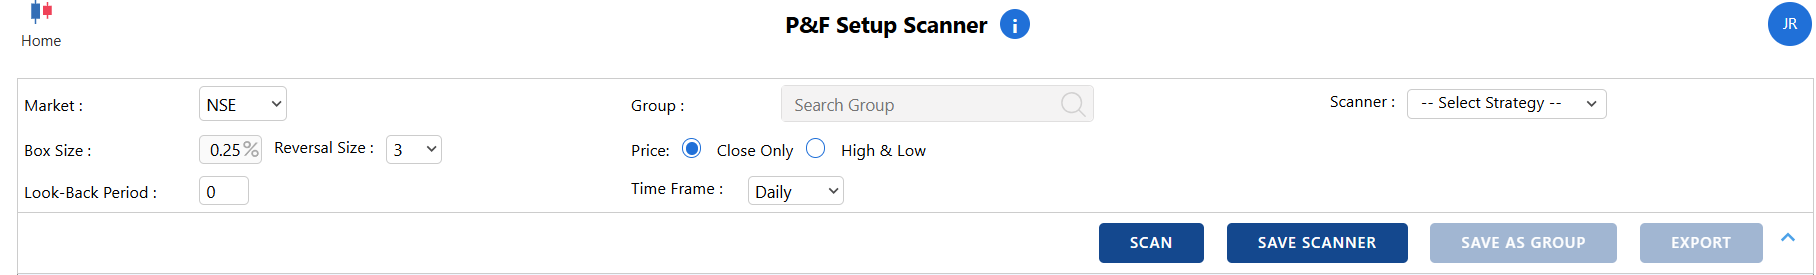
kindly att fresh condition in scaning of pattern finder
#VGM Stock Pick – BDL
#VGM Stock Pick – BDL
Corrected from 2100 → 1400, now showing Relative & Absolute Strength with a strong comeback!
Column Reversal Entry triggered today with Double Top continuation above MAST indicator.
️ High pole on long-term chart = gradual recovery expected as trapped traders unwind.
️ Risk Management: DBS = Exit Point
Allocation Strategy → 50% on CR & 50% on DTB
What’s your view – Will BDL march back to new highs? Drop your thoughts below
Nishesh Jani,CFTe
#StockMarket #BDL #VGMSetup #TechnicalAnalysis #Investing #TradingStrategy #MarketOutlook #StocksToWatch #MomentumInvesting #nisheshjani #AhmedabadNest 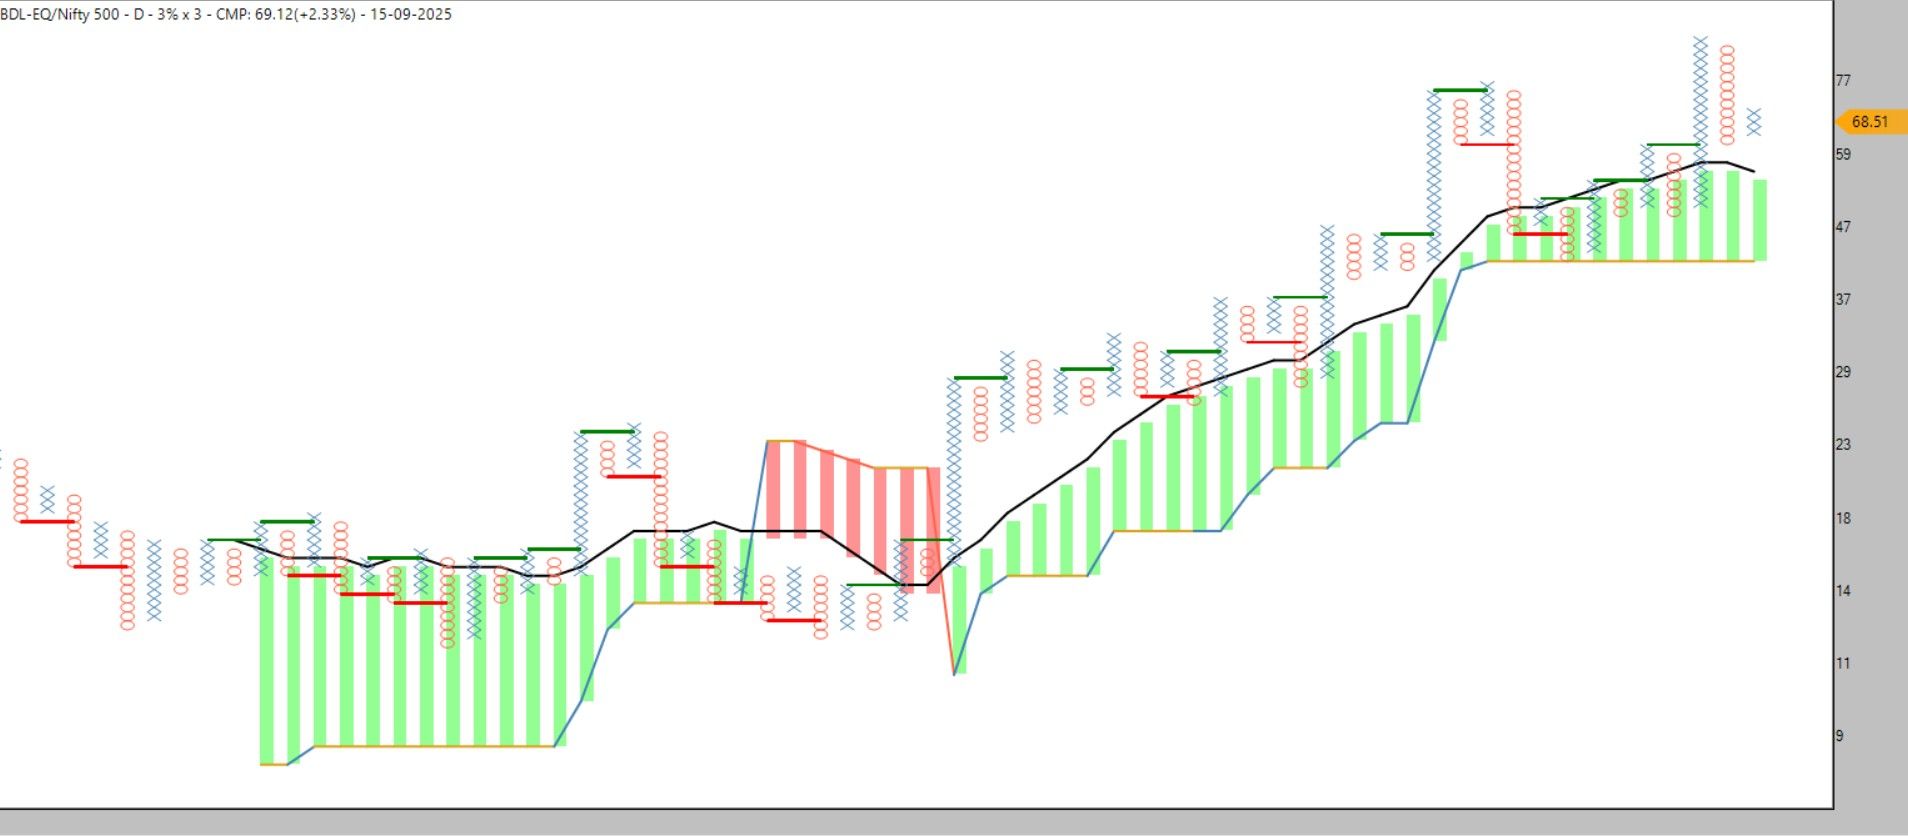
“Market rewards patience – accumulate momentum ETFs in downturns for long-term outperformance.”
ALPHA | MOMENTUM50 | MIDSMALL
Nishesh Jani, CFTe
#MomentumInvesting #FactorInvesting #ETFStrategy #SmartBeta #AlphaGeneration #LongTermWealth #StayInvested #MarketWisdom #PatiencePays #VolatilityToOpportunity #nisheshjani #AhmedabadNest
Nifty 500 – Broader Market Outlook
Nifty 500 – Broader Market Outlook
I’ve been tracking the 1×3 Box Value chart with the MAST indicator, and here’s what’s exciting:
When the index trades above the MAST indicator
Columns don’t touch the MA
We get a Positive Column Reversal + Double Top Buy
That’s where excellent opportunities to ride bullishness emerge, with a simple Double Bottom Sell as risk management.
Key Level to Watch:
If Nifty 500 closes above 22,152, a CR (Column Reversal) will be locked, opening the door for a fresh upside opportunity.
Question to you:
Do you believe the broader market is gearing up for a new leg of the rally, or do you expect a pause before the breakout? Drop your views
Nishesh Jani,CFTe
#Nifty500 #StockMarketIndia #BroaderMarket #TechnicalAnalysis #MAST #PointAndFigure #TradingStrategy #Investing #MarketOutlook #nisheshjani #AhmedabadNest #charchika 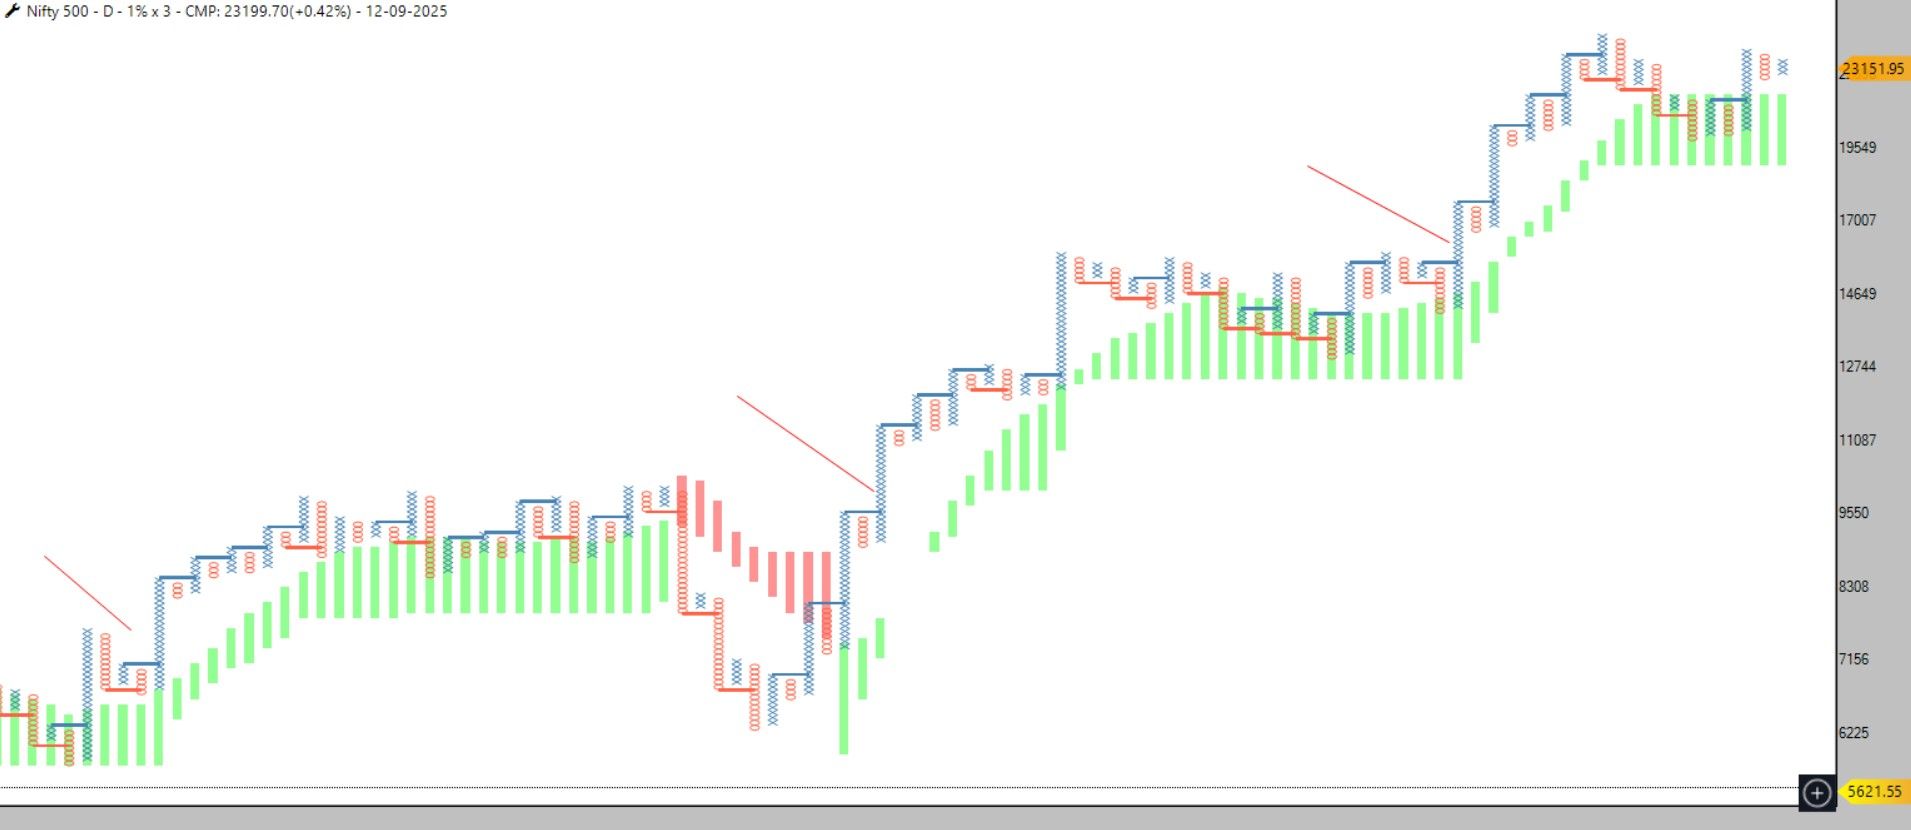
hello team please add P&F and Renko ultimate matrix in Momemntify Rank critera
“Is Bajaj Finance Entering a New 2011–2020 Style Rally?”
Bajaj Finance is showing signs of completing retracements above the MAST indicator with PCR confirmation on the #VGM setup.
After nearly 5 years of a relative flat period, the stock looks ready to take off again—similar to the 2011–2020 high-fly phase.
Price-based established counts project targets of 1070 and 1316, well above the CMP of 968.
Strategy: Deploy 50% on CR and 50% on DTB, with DBS as SL for risk management.
Business Insight: Bajaj Finance continues to strengthen its dominance in consumer and SME lending, while scaling up its digital ecosystem through the Bajaj Finserv app. With diversification across personal loans, EMI financing, and co-branded credit cards, the company is well-positioned to benefit from India’s expanding credit cycle and rising consumption demand.
Nishesh Jani,CFTe
#BajajFinance #TechnicalAnalysis #VGMSetup #WealthCreation #IndianMarkets #MomentumInvesting #LongTermGrowth #CreditBoom #Financials #StockMarketIndia #nisheshjani #AhmedabadNest 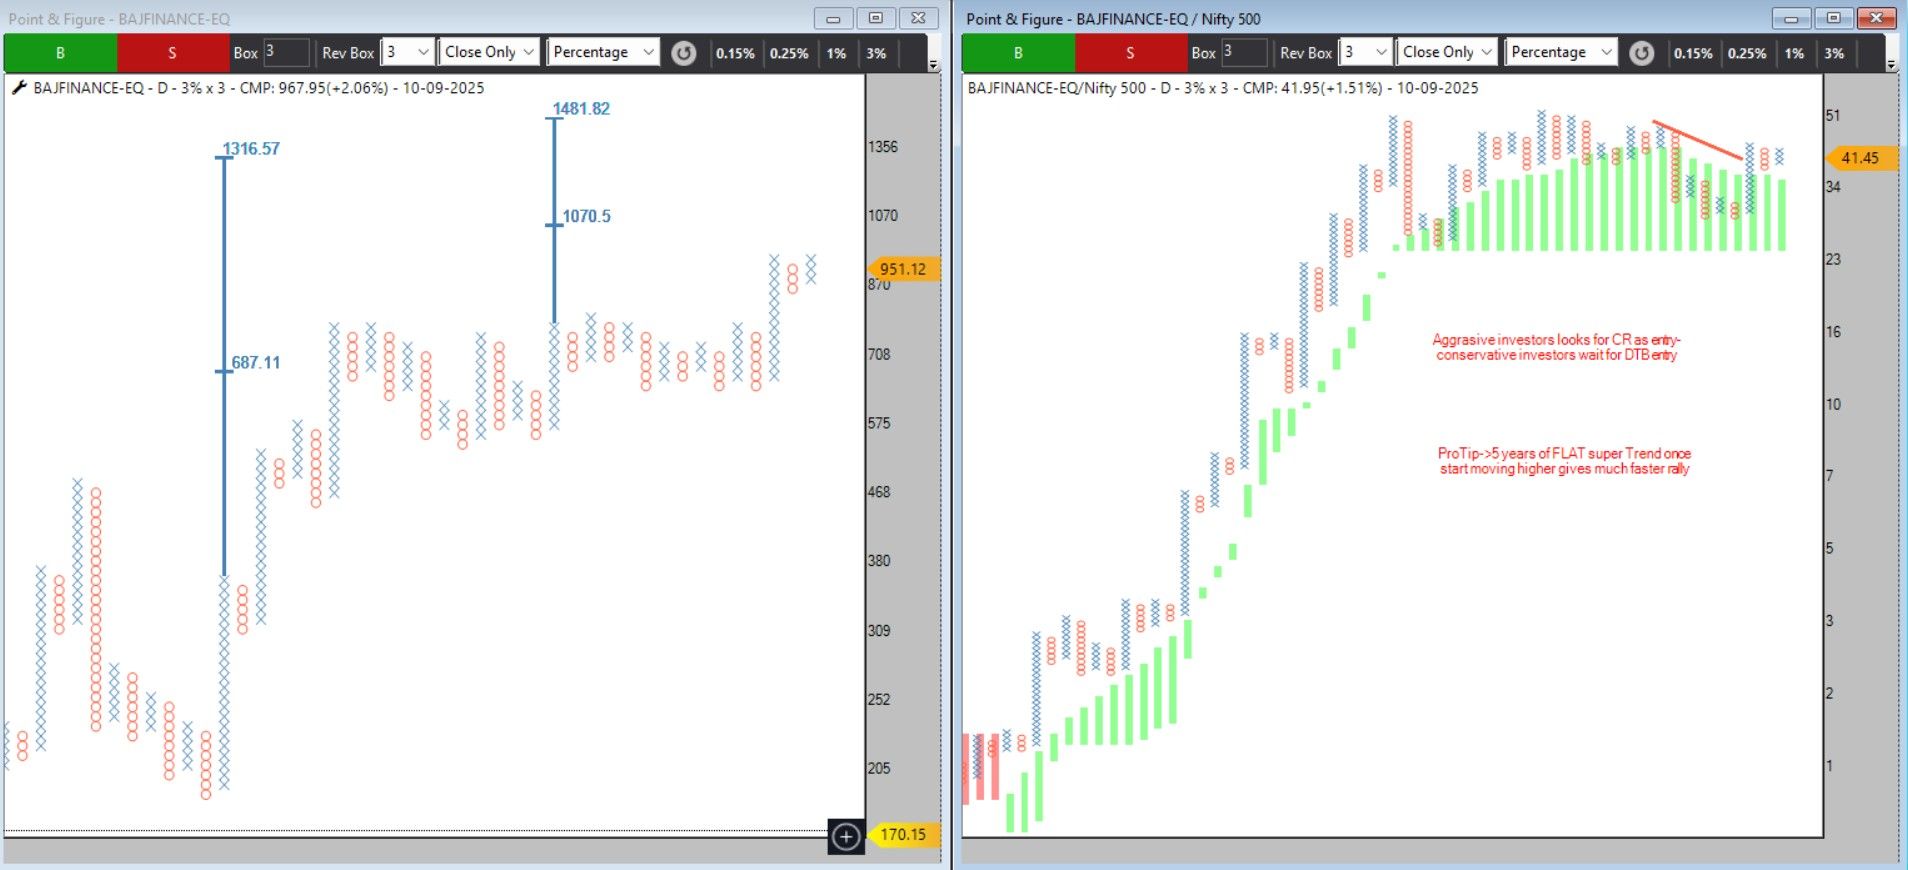
Hello
kindly add swing running bullish/bearish bricks currently we have two options
Fresh and at last brick-as long as next brick dosent appear it will show in the scanner in swing breakout the momentum it plots next brick in the same direction will not show
so kindly add one more seelction of Running as we have in P&F please add in both price and RS scanner
hello team
why we have data since 2005 only in RZONE many company are listed from 1990 but have since 2005 only kindly look into this and update with all the data
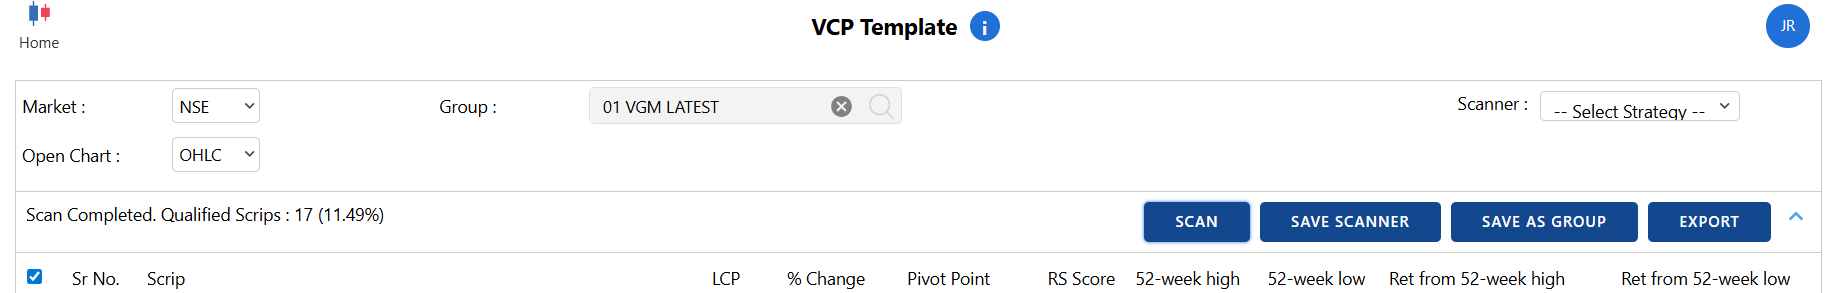
#Nifty Outlook Update
#Nifty Outlook Update
Currently, #Nifty is trading above the 200 EMA – long-term structure remains bullish.
Two probable scenarios on charts:
1️⃣ Head & Shoulders Top
Support zone: 24300–23900 (gap area)
Breakdown below 23900 → 23300 levels possible
Aggressive traders can look for weakness below 24300
2️⃣ Triangle Formation
Breakout above falling trendline gets confirmed and above 25200
Target: 26500+ / New ATH
Stay alert around 24300 & 25200 for next big move!
Nishesh Jani,CFTe
#StockMarket #Trading #TechnicalAnalysis #NSE #MarketsToday #PriceAction #Nifty50 #nisheshjani #AhmedabadNest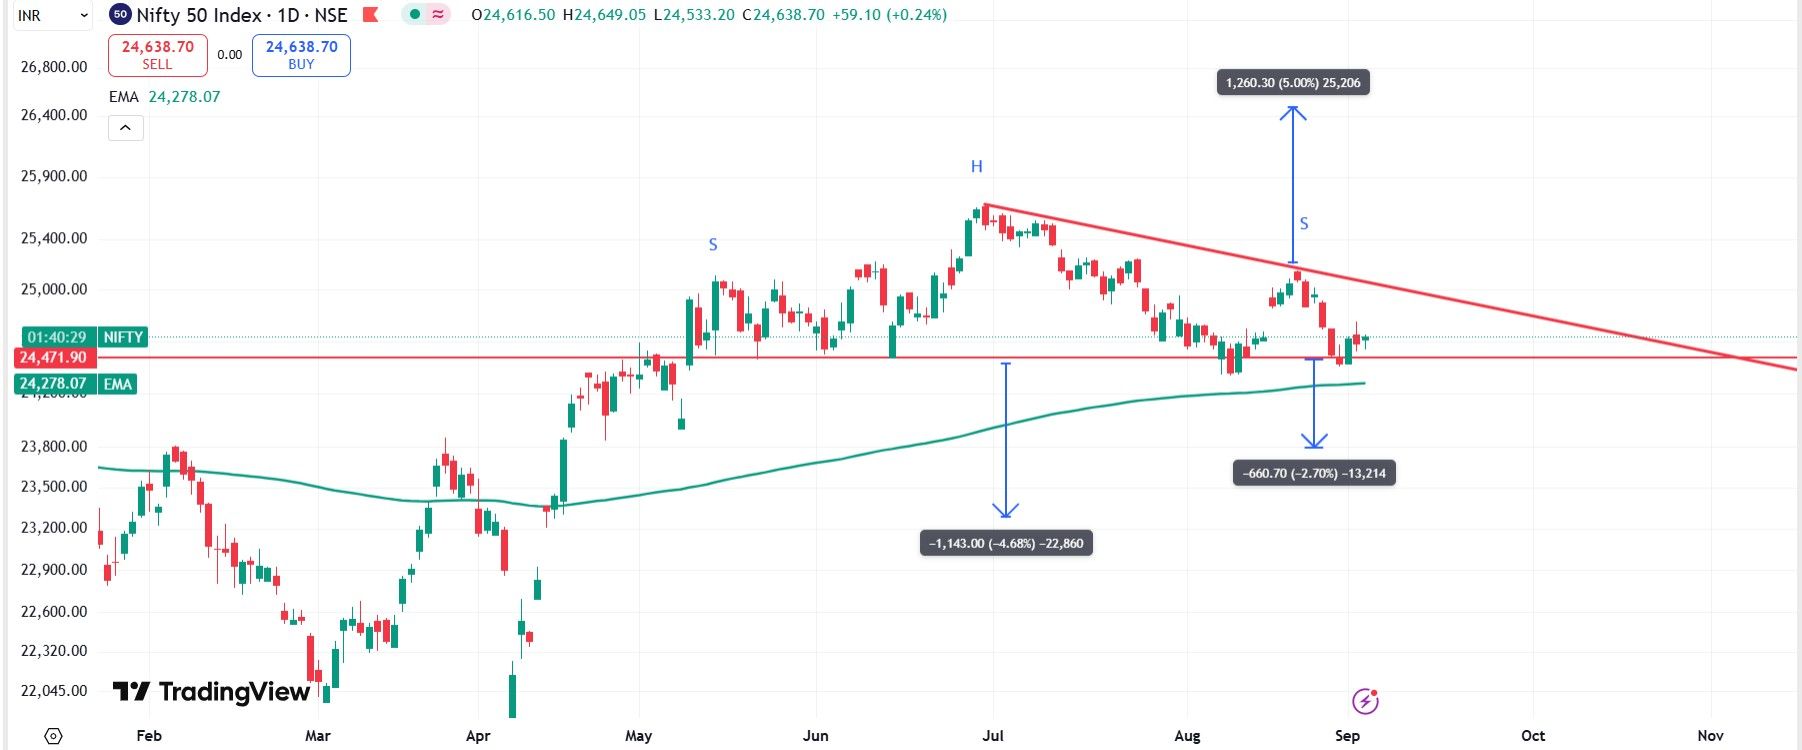
Prashant sir and team definedge kindly give % diff between EMA & Super Trend in MAST indicator that will help to find out good momentum stocks-as narrower the MAST faster & smoother the Trednd to Ride
also add this % diff in indicator value scanner so we can sortlist based on % diff to our watch list
specially add in RS charts
current diff is absolute diff which is differenet stock to stocks and difficult to sort out
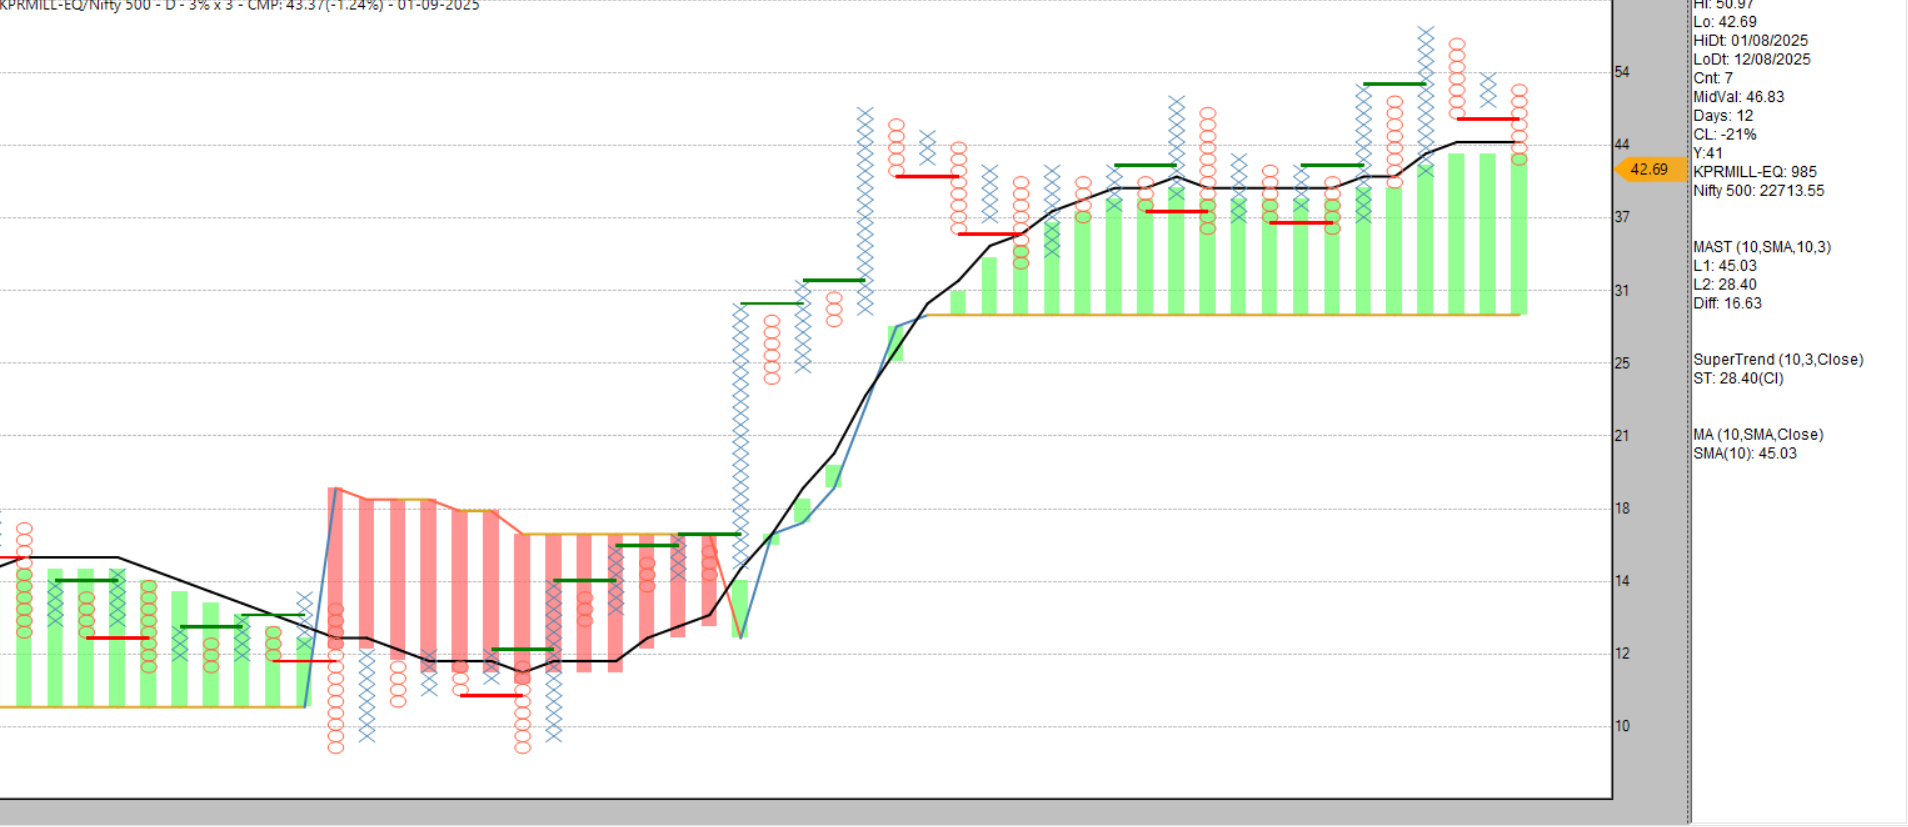
can we have ranking critera as well there also ?

HDFC Life Case Study for #VGM Practitioners
HDFC Life Case Study for #VGM Practitioners
On 7/11/2022, #VGM setup gave a Sell/Exit on HDFC Life at ₹542.
Since then, the stock rallied to ₹800+, matching Nifty 500 returns.
Key Observations:
Below MAST on #VGM → stock can still deliver positive returns but with higher volatility (retraced twice by 61.8%).
Above MAST on #VGM → stock delivers outstanding returns with lower volatility.
That’s why I prefer stocks bullish on VGM RS setup → lower drawdowns & smoother compounding journey.
Nishesh Jani,CFTe
#VGM #TechnicalAnalysis #StockMarket #Investing #HDFCLife #RiskManagement #SmartInvesting #nisheshjani #AhmedabadNest 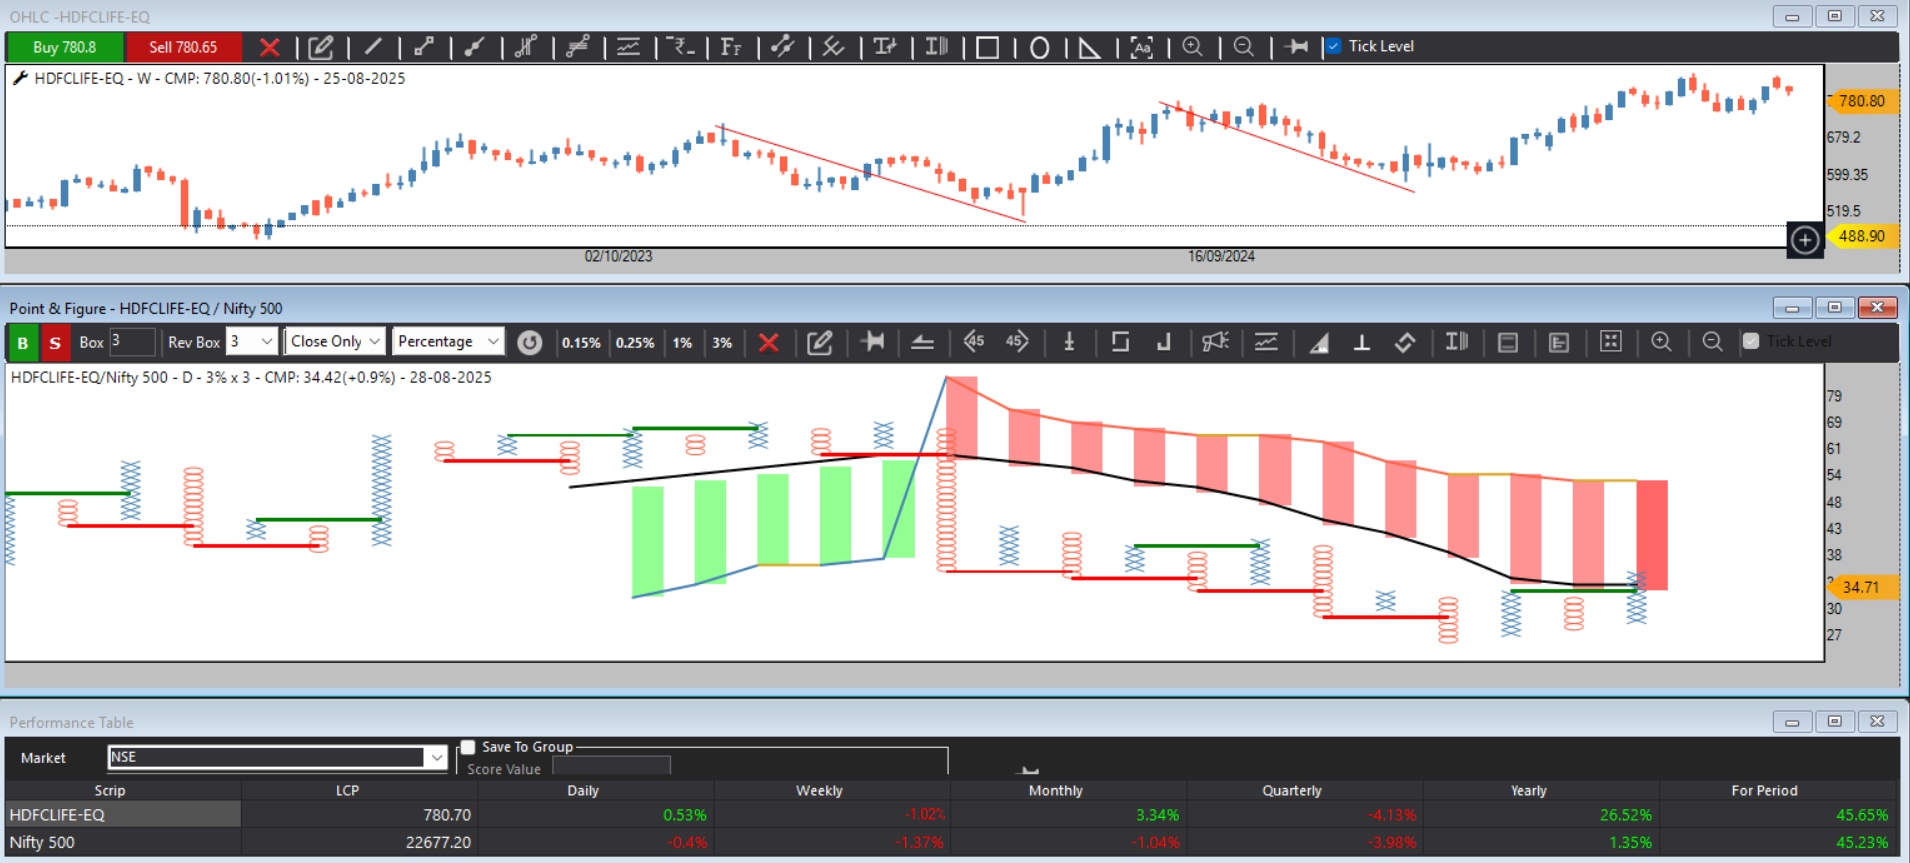
Hello team kindly add pattern finder in RS charts across all charting methods,people like me who has presented #VGM on EDECNOCH 2021 and many follower will find the active pattern easily along with Price that will help a lot
Thanks
Glenmark a stock to watch!
Glenmark a stock to watch!
Based on #VGM & price structure, strong cluster count @ 3704.66 supports the setup CMP 1940
As long as no bearish structure emerges → look for bullish reversal opportunities with favorable R:R.
Fundamentals: revenue/profit recovery, operational efficiency, innovative pipeline & global diversification.
Nishesh Jani,CFTe
#Glenmark #Pharma #StocksToWatch #TechnicalAnalysis #Investing #VGM #nisheshjani #AhmedabadNest
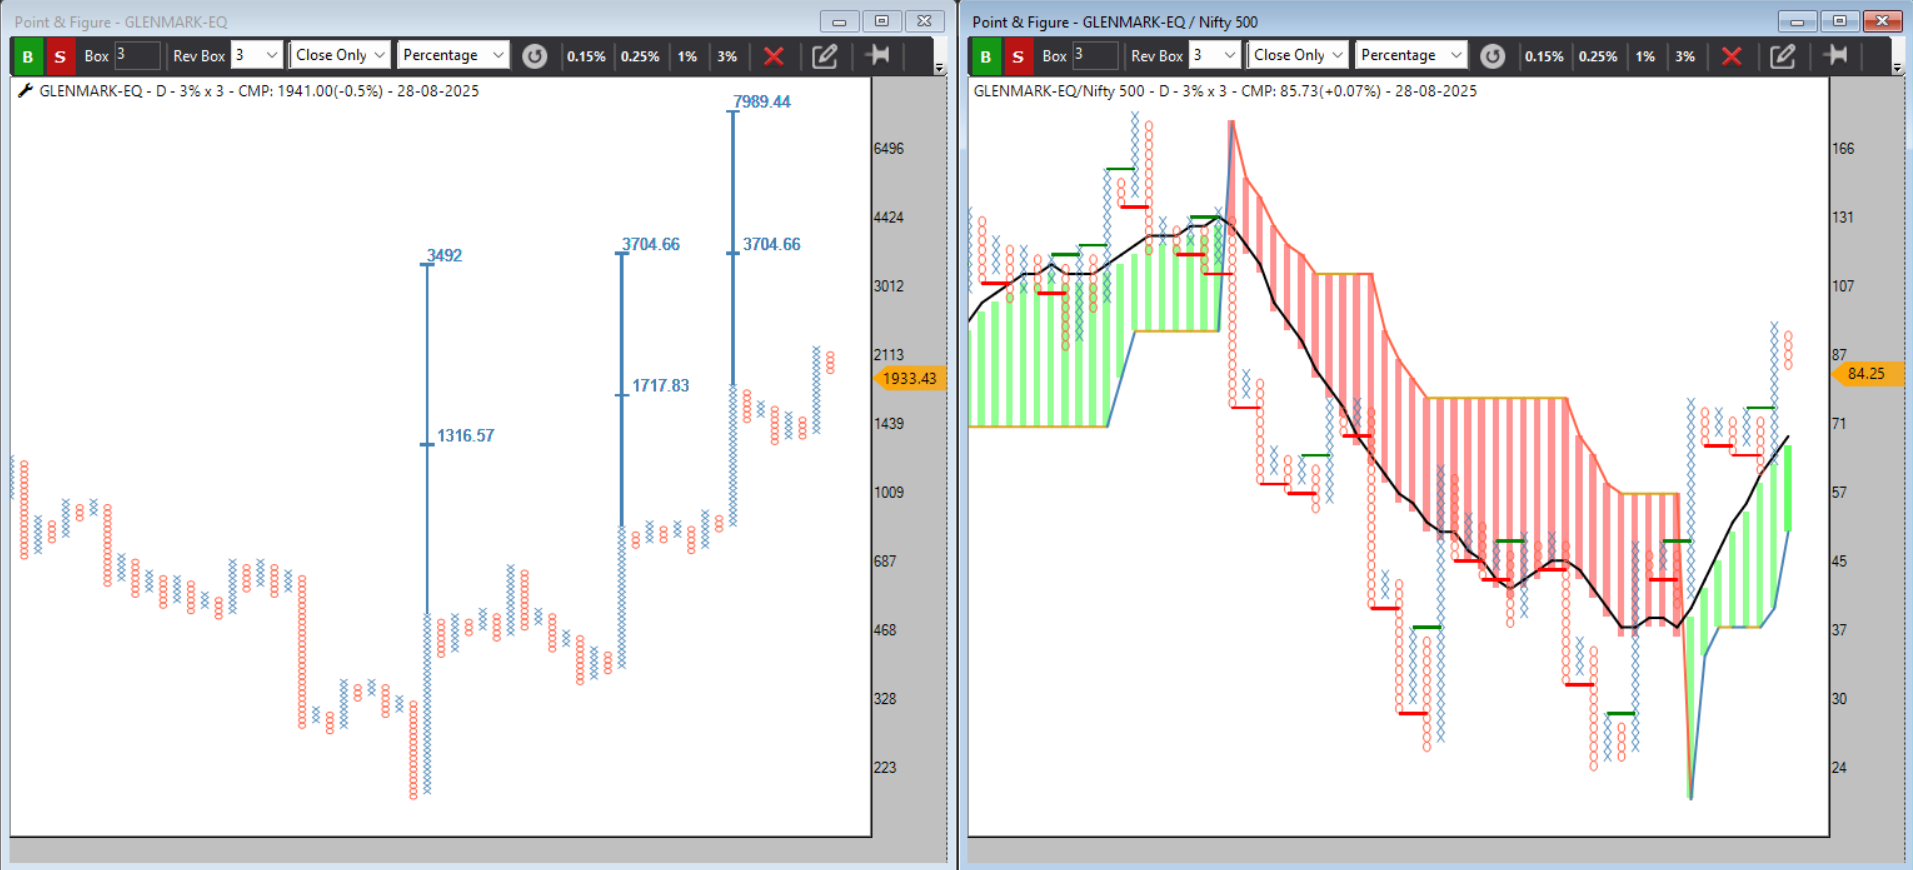
️ Praj Industries at fresh 52W Low with active bearish setups
️ Praj Industries at fresh 52W Low with active bearish setups
– 123 Pullback, Diagonal Triple Bottom Sell ,
Bearish Anchor column below MAST on #VGM points to weak RS & bearish price structure.
Challenges: slow profit growth, rich valuations, sector headwinds, low promoter holding & negative sentiment.
Doesn’t deserve portfolio spot.
Nishesh Jani,CFTe
#PrajIndustries #Bearish #TechnicalAnalysis #VGM #StockMarket #Trading #vgm #nisheshjani #AhmedabadNest 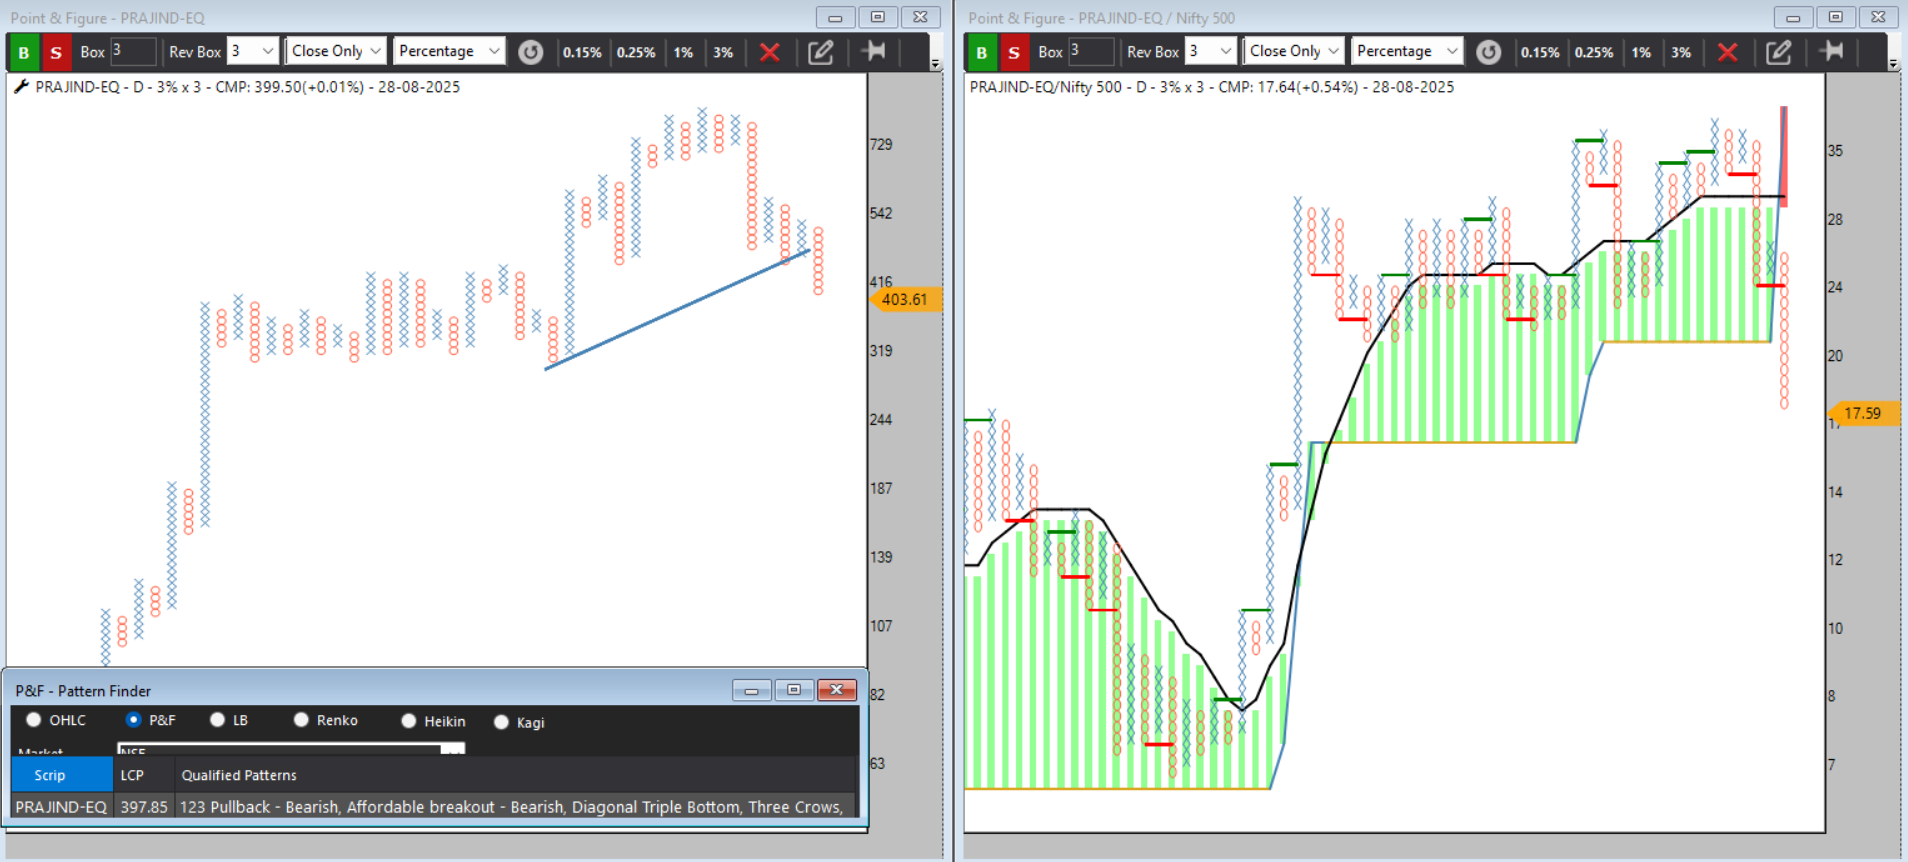
Route Mobile hitting fresh 52W Low with a bearish #VGM breakdown.
Route Mobile hitting fresh 52W Low with a bearish #VGM breakdown.
Multiple bearish setups active – OOPS Bearish, Triple Bottom Sell, Turtle Bearish & Bull Trap.
Fundamental risks: competition, regulatory costs, FX volatility & client concentration.
Not portfolio-worthy on TA.
Nishesh Jani,CFTe
#TechnicalAnalysis #StockMarket #RouteMobile #Bearish #Trading #vgm #nisheshjani #AhmedabadNest 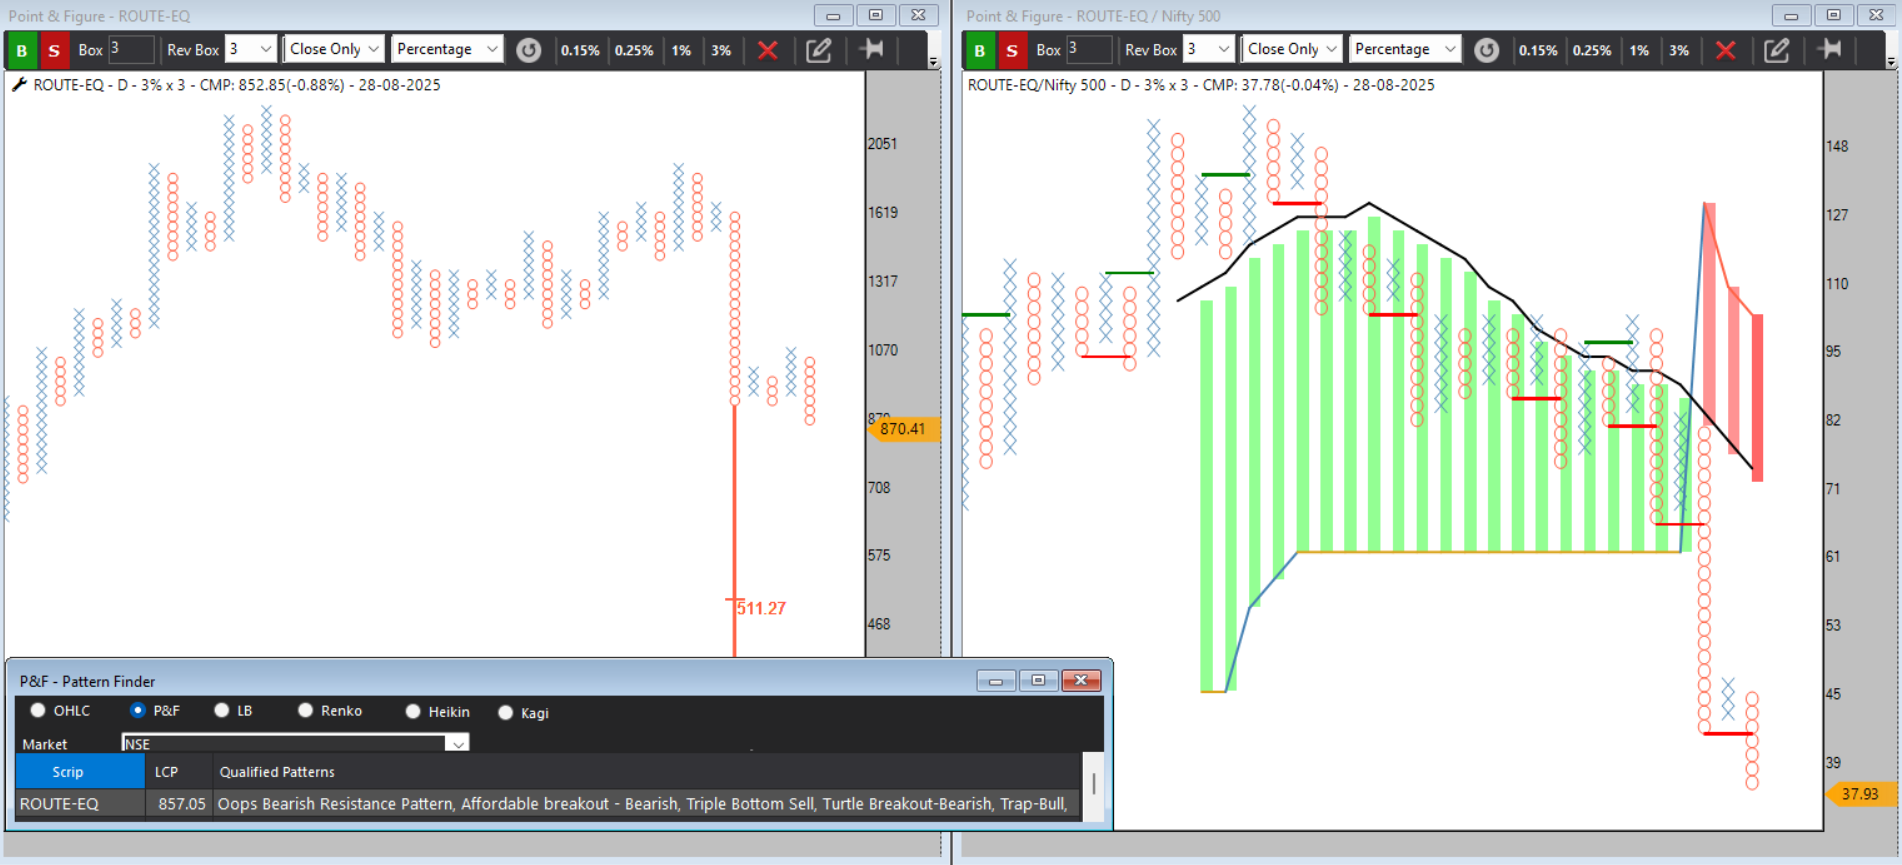
#Eclerx bullish on Price & #VGM setup!
#Eclerx bullish on Price & #VGM setup!
Watch for T-20 / Super Pattern / Bullish ABC / 123 Pullback – short retracements = strong R/R setups.
Stock making new highs on fundamentals:
Revenue Growth
Margin Resilience
Strategic Deal Flow
AI + Automation Demand
Nishesh Jani,CFTe
#StocksToWatch #Breakout #Momentum #AI #Automation #Investing #VGM #nisheshjani #AhmedabadNest 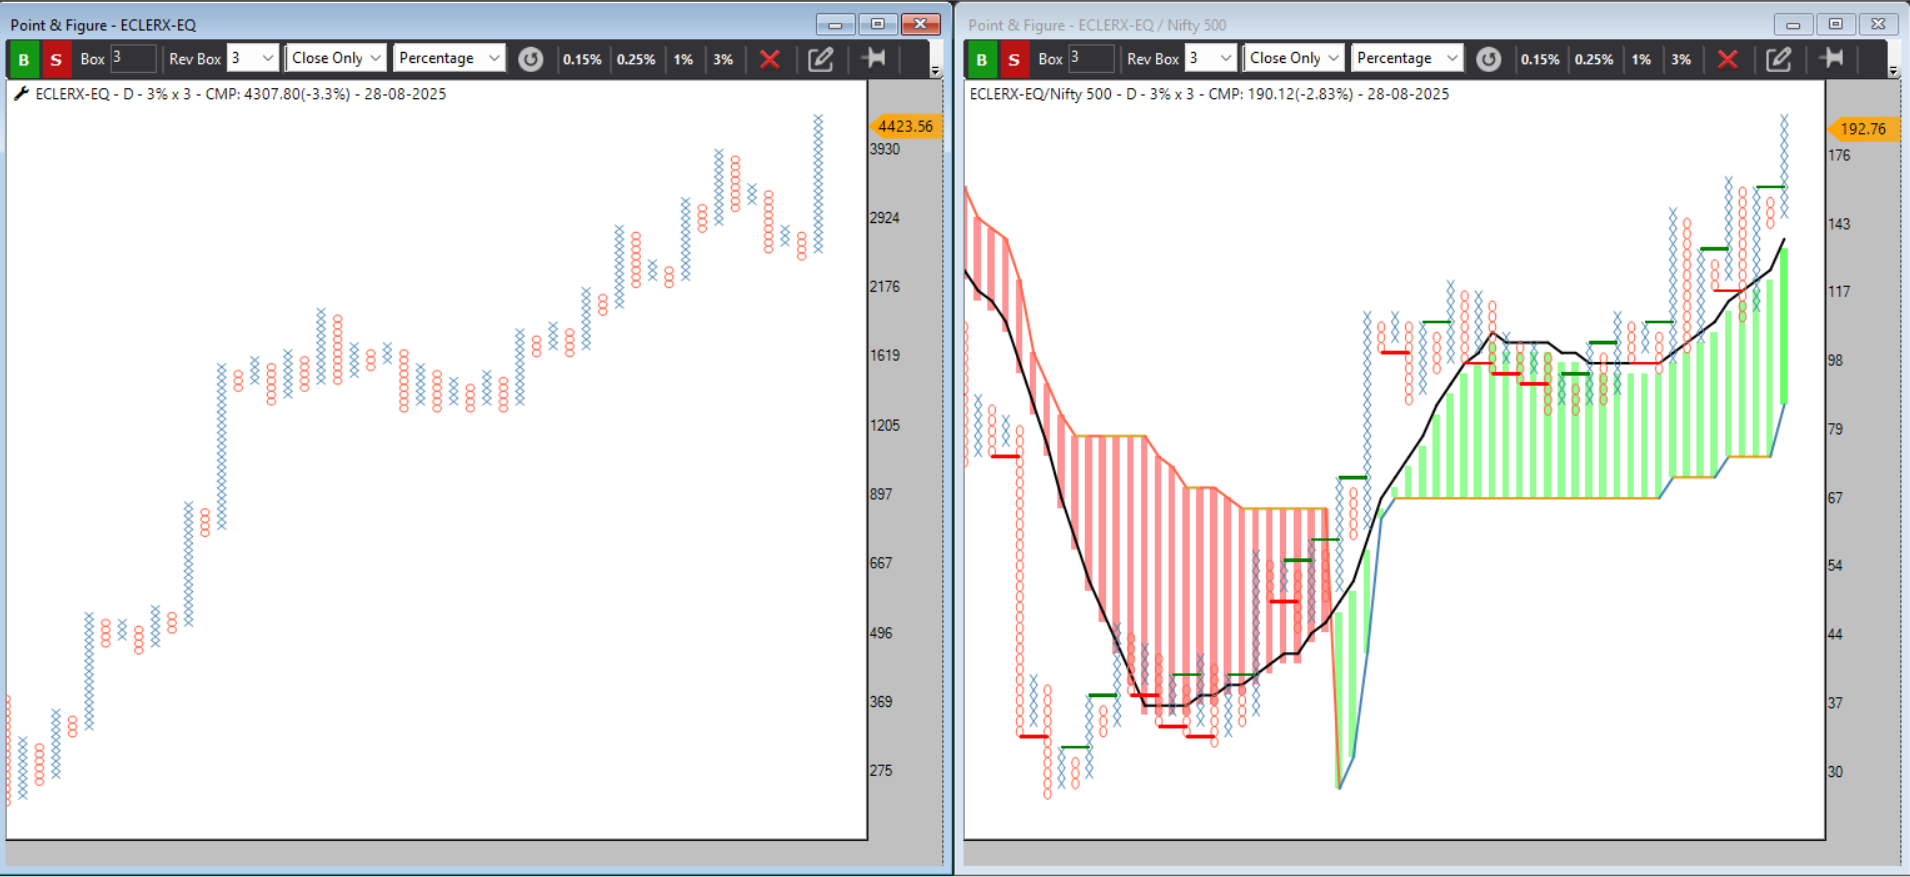
#NAZARA has no direct exposure to real money gaming.
#VGM setup stays bullish above MAST
Fresh opportunity on Positive Column Reversal + Double Top Buy
Trading above the longest bearish 45° trendline – momentum intact.
Nishesh Jani,CFTe
#StockMarket #NazaraTech #VGMMethod #TradingSetup #ChartAnalysis #BullishSetup #TechnicalAnalysis #nisheshjani #AhmedabadNest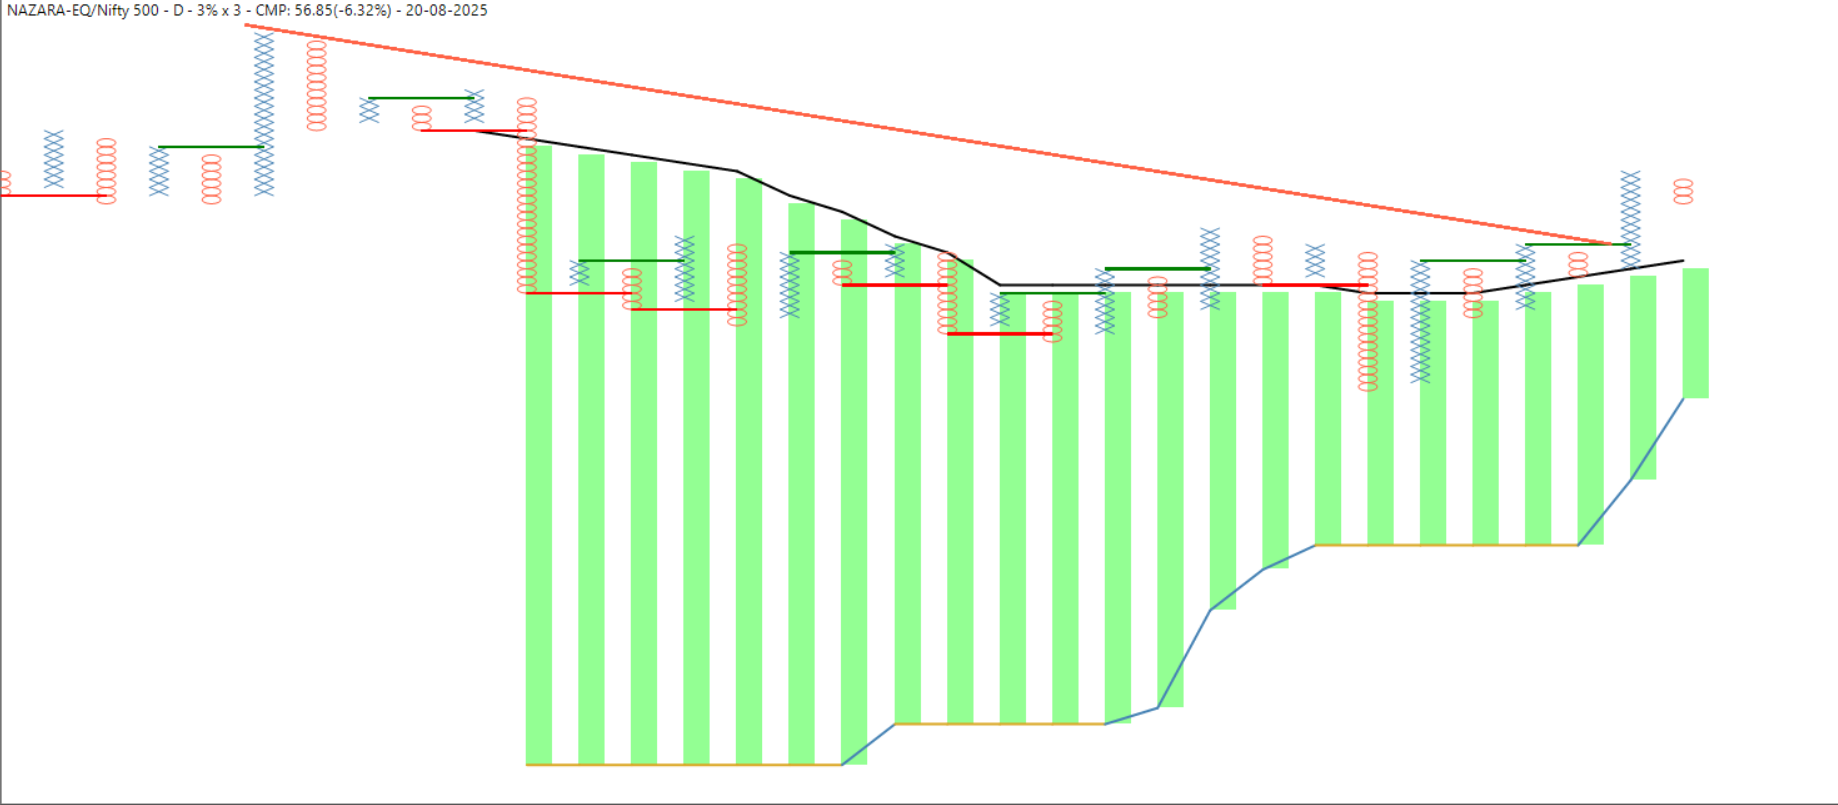
Momentum Factor – Riding the Winners
Momentum is one of the most powerful drivers of stock performance. History shows that stocks which have been performing well tend to continue their winning streak in the near term.
This index captures momentum using both:
6-month performance (short-term momentum)
12-month performance (long-term momentum)
By applying risk-adjusted Z-scores and equally weighting both periods, the index ensures that only stocks with consistent strength– not just short-lived rallies – make it to the portfolio.
Quality Factor – Strength Behind the Growth
Momentum alone is not enough. A stock must also represent a fundamentally strong company with a durable business model. The quality screen ensures this by measuring:
Return on Equity (ROE) – higher efficiency in generating returns.
Debt-to-Equity (D/E) Ratio – preference for financially stable companies.
Earnings Growth Stability (EPS) – lower volatility in profits over the last 5 years.
This way, only businesses with sustainable competitive advantages and reliable financial health qualify.
By combining momentum with quality, the portfolio reflects:
Growth + Stability
Performance + Reliability
Opportunities + Risk Management
The Investor Advantage
For investors, this strategy means:
Exposure to high-potential mid and small-cap leaders.
A balance between short-term performance momentum and long-term fundamental strength.
A disciplined, rules-based approach that avoids emotional investing.
We start buying ETF of this potential opportunity -NSE ETF CODE=>MIDSMALL CMP 48.21
Nishesh Jani,CFTe
#MomentumQuality #InvestorAdvantage #MidSmallCap #GrowthWithStability #WealthWithWisdom #SmartInvesting #ETFInvesting #NSEIndia #MIDSMALL #DisciplinedInvesting #QualityMatters #RidingTheWinners #nisheshjani #AhmedabadNest
#MarketMoodUpdate | MMI in Extreme Fear Zone (<30)
#MarketMoodUpdate | MMI in Extreme Fear Zone (<30)
 Fear is peaking... Opportunity is knocking!
According to Ticker Tape's Market Mood Index (MMI), the market is currently gripped by Extreme Fear — a rare sentiment zone that has historically led to positive returns over 3 to 6 months.
MMI is based on 6 key factors:
FII Index Futures Activity
Volatility & Skew
Momentum
Market Breadth
Price Strength
🪙 Demand for Gold
When the MMI drops below 30, markets are often oversold and sentiment is stretched. Historically, this has been a good zone to initiate fresh long positions.
Past data shows strong rebounds from such fear levels — making this a contrarian's sweet spot.
 Poll for You:
How do you respond when fear dominates the market?
🟢 Buy Aggressively
🟡 Start Tracking Good Stocks
Wait on the Sidelines
Comment your strategy below!
Remember: Fear creates opportunity, but only for the prepared.
🧠 Do your analysis. Stick to your risk plan.
Nishesh Jani,CFTe
#ContrarianMindset #TickerTapeMMI #BuyTheFear #MarketInsights #SmartInvesting #nisheshjani #AhmedabadNest 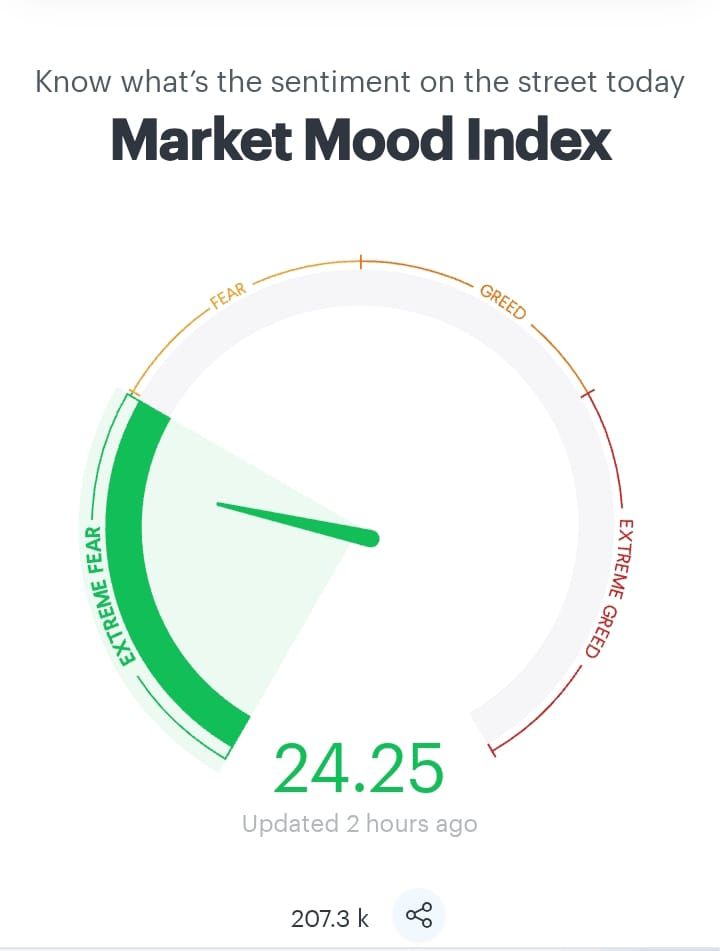
Monthly Charting Ritual for VGM Practitioners
Dear VGM Practitioners,
If you're serious about mastering the system — do this ONE simple exercise every month when I share the VGM stock list:
What to do?
Manually scroll through all VGM setup stocks (MAST indicator + DTB-DBS).
Save the stocks where both columns are above EMA and SuperTrend
This isn’t just for filtering stocks — it’s for building deep conviction in the system.
Why this matters:
You'll start recognizing sector patterns and leading stocks
You’ll see how long underperformers take to turn into outperformers
You’ll understand structure shifts, not just scanner-based snapshots
🧠 You’ll build chart memory — the ultimate edge
 ️ Scanners are just tools for speed.
🧭 Manual charting builds **intuition and confidence
full month, revisit saved charts to study entry/exit points.
You’ll be amazed at how this one habit transforms your understanding.
 Drop a YES in the comments if you’re committing to this practice this month.
Let’s grow together!
Markets Uncertain? Stay Focused.
Markets Uncertain? Stay Focused.
When the stock market and economy face short-term turbulence, emotions run high—but smart investors stick to systems.
Why We're Accumulating ALPHA & MOMENTUM50 ETFs:
Rule-Based Investing:
No emotional bias—pure data-driven exposure to quality, trend, and strength.
Built-In Diversification: These indices filter top-performing stocks across sectors, reducing stock-specific risk.
Momentum Works in Volatility:
In uncertain phases, leaders change fast—Momentum-based ETFs adapt with it.
Alpha in the Making:
While others wait for clarity, we accumulate smartly—riding the next wave before it forms.
Turbulence is temporary. Discipline is timeless.
Nishesh Jani CFTe
#ETFInvesting #MomentumStrategy #ALPHANifty #NiftyMOMENTUM50 #SmartInvesting #MarketUncertainty #IndexStrategy #nisheshjani
#AhmedabadNest
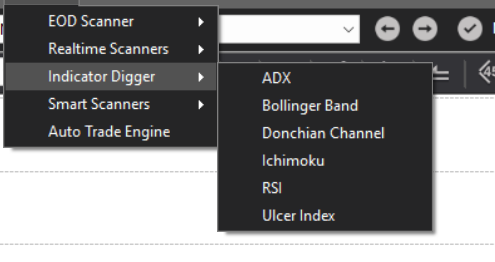 add
add
Time-Based Corrections: The Invisible Test of Patience
Markets don't always correct with sharp falls.
Sometimes, they move sideways, digesting gains with time instead of price.
These phases are mentally tougher than steep declines — because they test your patience, conviction, and discipline.
How smart investors deal with time corrections:
1️⃣ Detach from Noise
Avoid overanalyzing daily moves. Long consolidations often lead to strong breakouts — if your thesis is intact, stay put.
2️⃣ Focus on Fundamentals
Use this time to reassess business quality. If the company is improving operationally, the sideways move is just market digestion.
3️⃣ Track Relative Strength
In such periods, stocks showing strength while others move sideways are preparing for leadership. Spot them early.
4️⃣ Work on Self, Not Portfolio
Instead of tweaking your holdings every week, sharpen your process — backtest, read, or improve your discipline.
5️⃣ Revisit Allocation Strategy
Sometimes it's not what you buy, but how much and when. Fine-tune your position sizing based on conviction and volatility.
6️⃣ Zoom Out
Weekly and monthly charts help you stay objective. Sideways is painful only on a daily chart.
"Those who endure time corrections with clarity and composure often get rewarded when the market resumes its trend."
Share this with someone who needs to hear this today.
Nishesh Jani,CFTe
#InvestingWisdom #StockMarketPatience #MarketPsychology #InvestorMindset #NisheshJaniInsights #nisheshjani #AhmedabadNest
people may find it difficult but sector performing good and portfolio has high allocation the risk rises towards that sector
Prashant sir there is mandate to every mutual funds that they cant invest more then 35 % in single sector and maximum allocation per stock is 10 % allocation of AUM , can we add this feature to momentify portfolios as well ? that will help to divercify broadly
Thanks
24400-24100-23800 watchout these levels for turnaround
Nifty IT Sector – Caught Between Breakout & Breakdown? 

yes contact https://www.definedge.com/traders-nest/ 9825018267
Nifty IT Sector – Caught Between Breakout & Breakdown?
Nifty IT Sector – Caught Between Breakout & Breakdown?
The index has bounced strongly from oversold zones, negating the bearish anchor column and triggering a bullish ABC pattern – targets stretch to 52000, as long as 35000 holds.
But don’t ignore the shadow forming – a potential Head & Shoulder Top which activates only below 32000. ️
🧠 Two Critical Insights:
IT often underperforms when Banking/Finance is strong – watch sector rotation closely.
 Weakening DXY could impact export-heavy IT companies despite the bullish chart.
 Large-cap or mid-cap IT? Stock-specific trends will lead – manage risk, follow the chart, ignore the noise.
As of now – Bias stays Bullish above 35000!
Break below 32000, That’s when we talk about major top-out formations. 🧩
Nishesh Jani, CFTe
#AhmedabadNest #NisheshJani #NiftyIT #TechStocks #SectorAnalysis #BullOrTrap #TradingPsychology #ChartPattern #ITSector #RiskManagement #MarketInsights #HeadAndShoulder #DollarIndex #StockMarketIndia 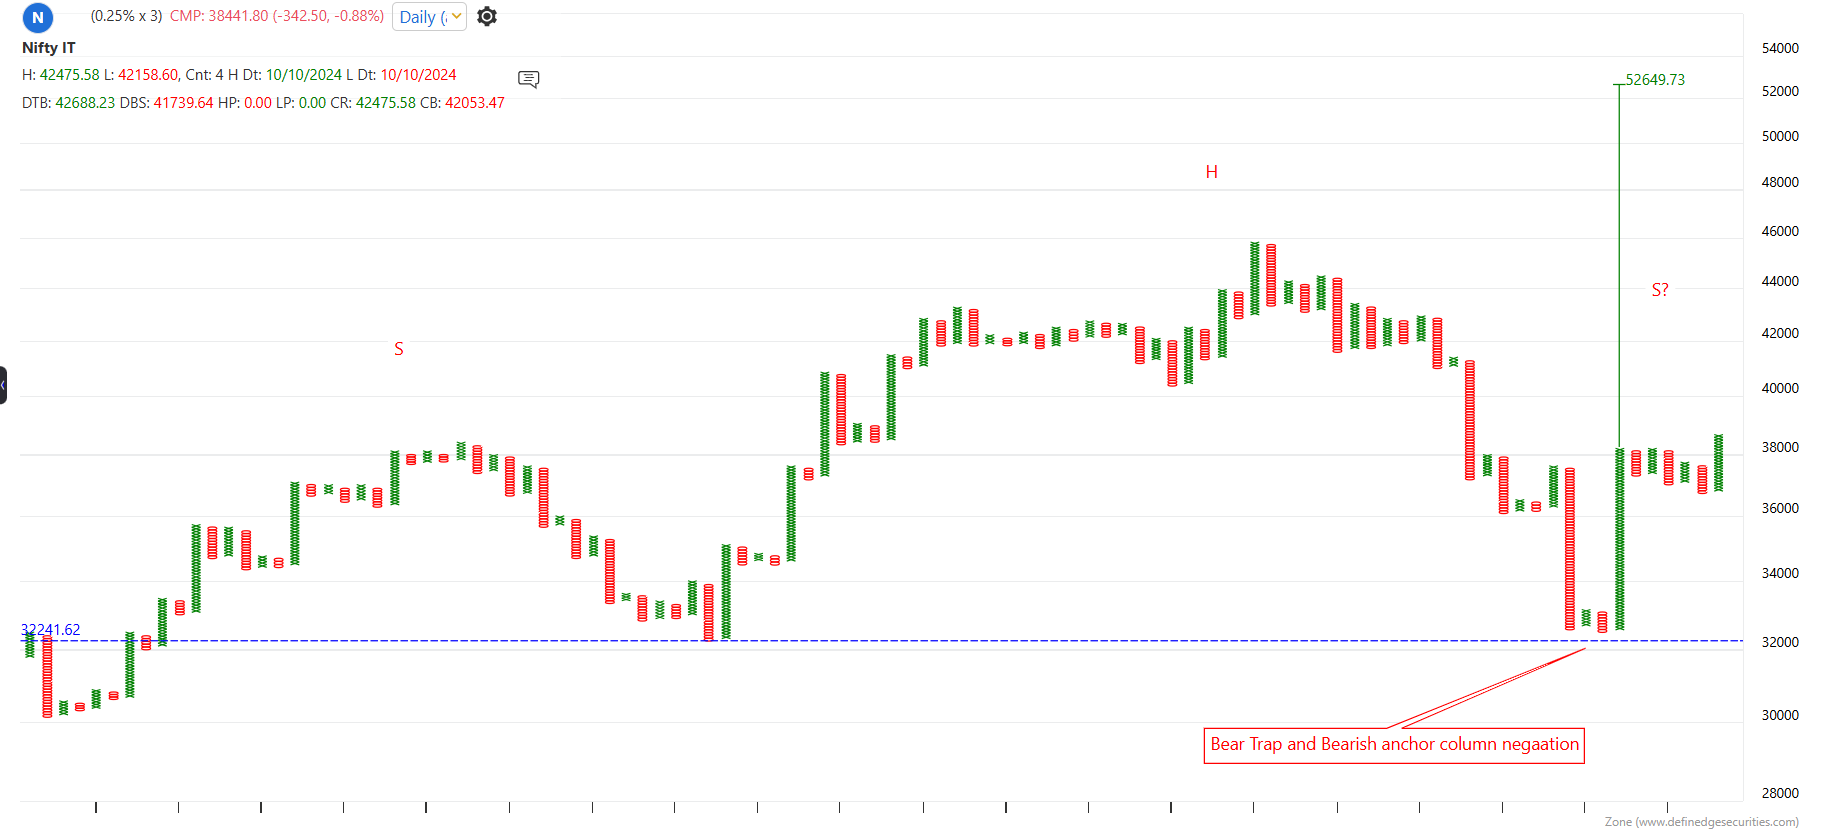
kindly given open to chnage the stock universe at leat at the time of re balance data that will be good if i am scanning on my own stocks based on some criteria or tracking MF/PMS portfolio which chnages it stock list
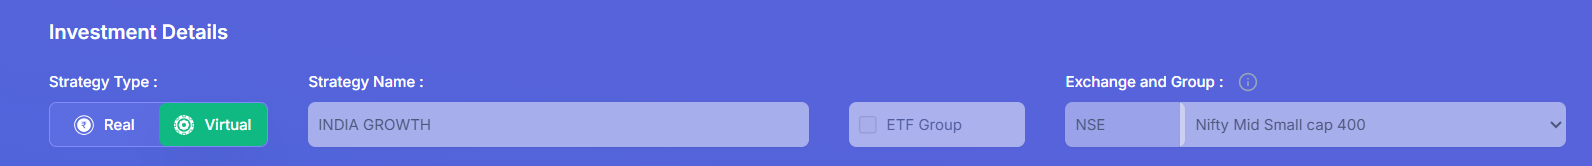
Is the Nifty Midcap 150 Index Gearing Up for a 10-15% Rally?
Above Super Trend – Clear bullish signal
Broken All Bearish 45° Trendlines – Structural breakout confirmed
Vertical Price Counts Active – Momentum building for a potential 10-15% upside
 Caution Zone: A close below Super Trend could reverse the bullish tone.
Keep your eyes on midcaps – The breakout is real, and the next move could be big.
Nishesh Jani,CFTe
#MidcapMomentum #NiftyMidcap150 #TechnicalBreakout #StockMarketIndia #BullishTrends #ChartTalk #SmartMoneyMoves #PriceAction #BreakoutAlert #AhmedabadNest #nisheshjani 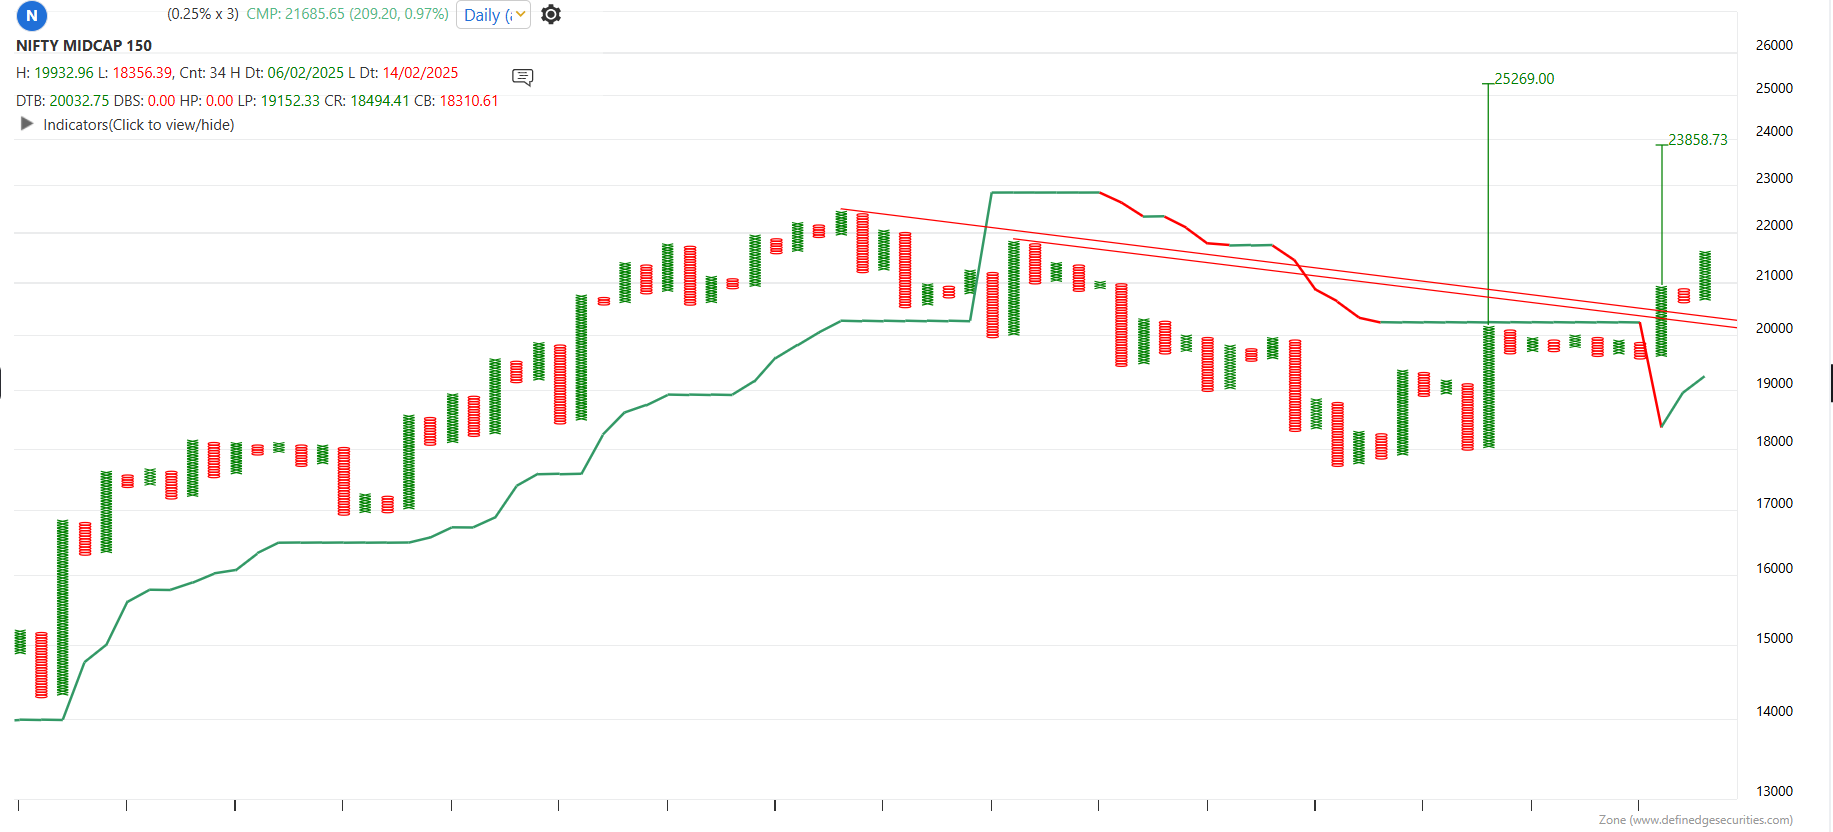
Nifty 500-Broader mkt ready for new ATH
Look at the Point and Figure charting trying to breakout from last bearish 45 degree trendline + open counts and Higher tops and higher bottoms
as long as holds 21600 expecting 25500-26900 ++
you call of action
if active trader and investors -find good momentum opprtunity
if passive in nature can particpate in ETF or Mutual fund of nifty 500
@MotilalOswalAMC
has both ETF and Index fund while
@SBIMF
@AxisMutualFund
@ICICIPruMF
has index fund you can look
Nishesh Jani,CFTe
#AhmedabadNest #nifty500 #Breakout #index #nseindia #stockmarketsindia #analysis #MutualFunds #nisheshjani
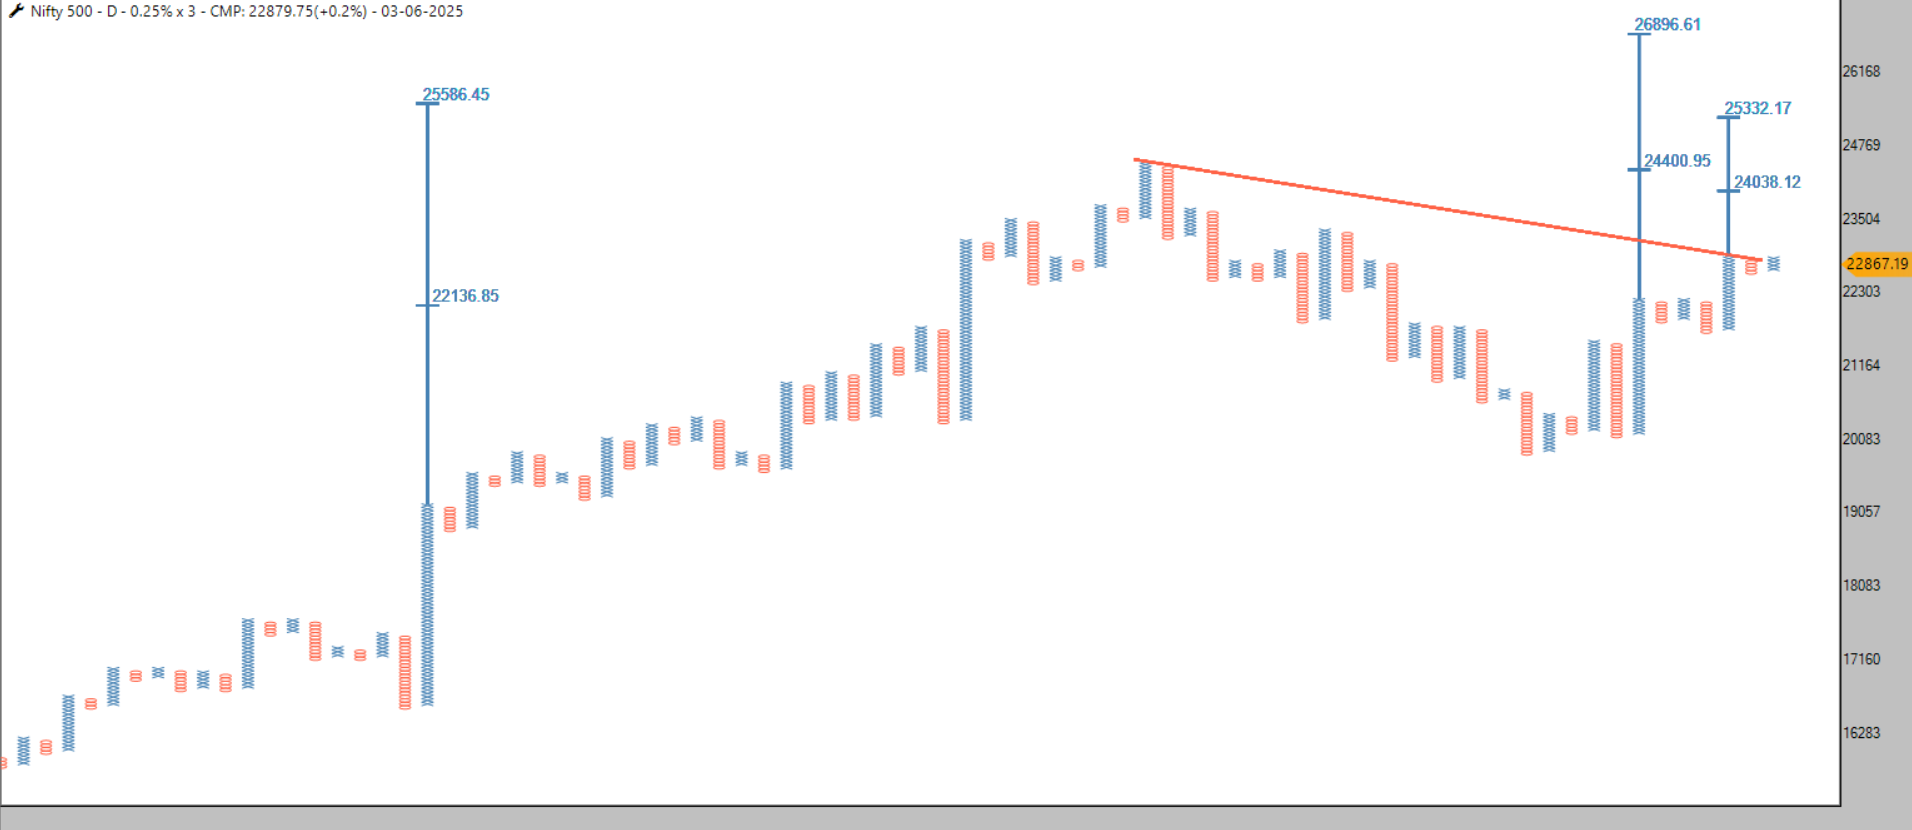
Bank Nifty-Ready for 10 % rally !
few months ago posted sensing bank nifty will hit ATH in rapid fire way-it did it now see consolidating since month
small inv bullish Head and shoulder and VCP is pattern
close above Red line will catch fire again towards 62000
Nishesh Jani,CFTe
#AhmedabadNest #nse #bankniftyindex #vcp #Breakout #pattern #analysis #stockmarketsindia #nisheshjani
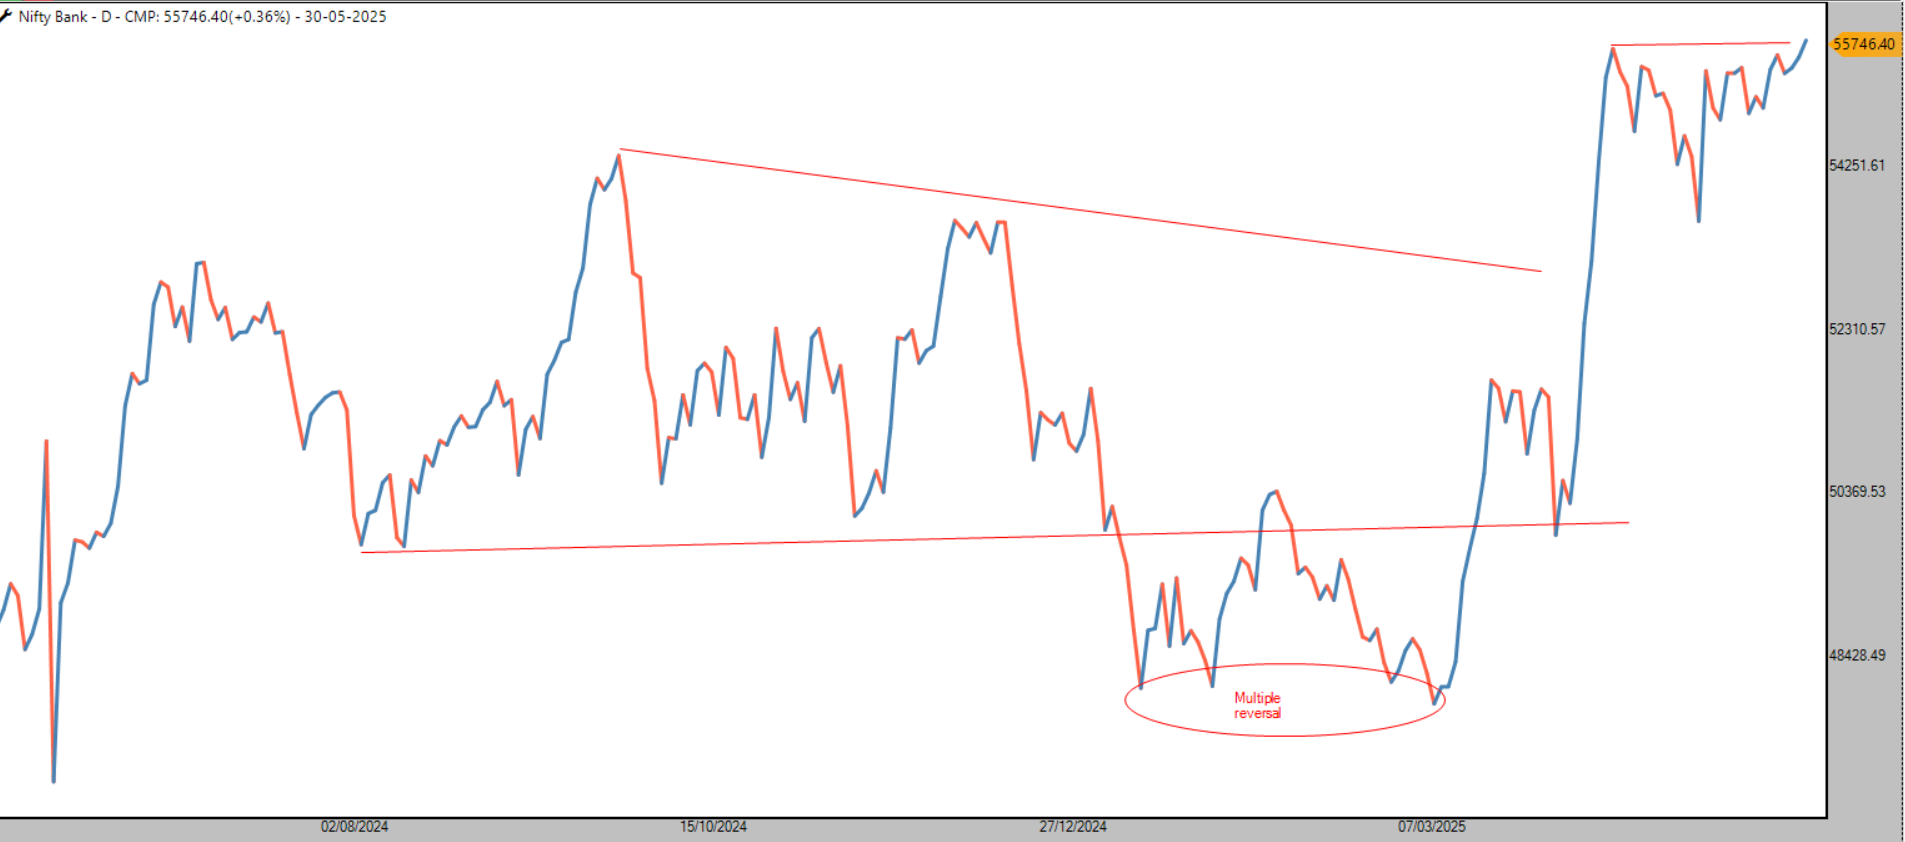
in mometify scanner how many days of volar get calculated ?
and which paremeter to select while adding volar to lower panel in stock?
volar period-ROC and Avg what number is get selected while running momentify scanner ?
Thanks
please add strike diff (50 & 100 ) both in web TOI curently plotting based on 50 strike diff only
SPX -US index Ready to fly high to ATH !
i am anticipating Bullish Inverse Head and shoulder pattern
Good support is 5500 expecting 6800-7000 that translet into 17 to 20 percent upside from current levels
once breakout that will help world indicies to their upward levels
Nishesh Jani,CFTe
#AhmedabadNest #SPX #usa #StockMarket #GlobalMarkets #analysis #nisheshjani
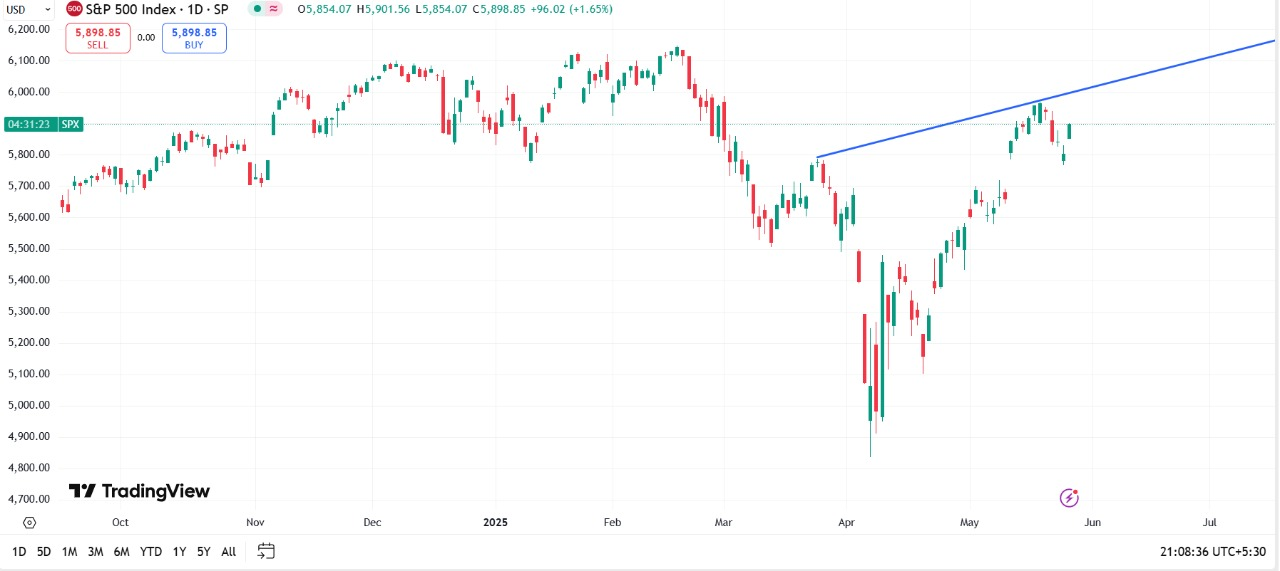
please add VAR-Value at Risk in Holding and Momentify portfolio that will help a lot
please increae the maximum time length so can get idea for long term cycle of various valuation -that will help to spot over and undervalue of the companies on various parameter
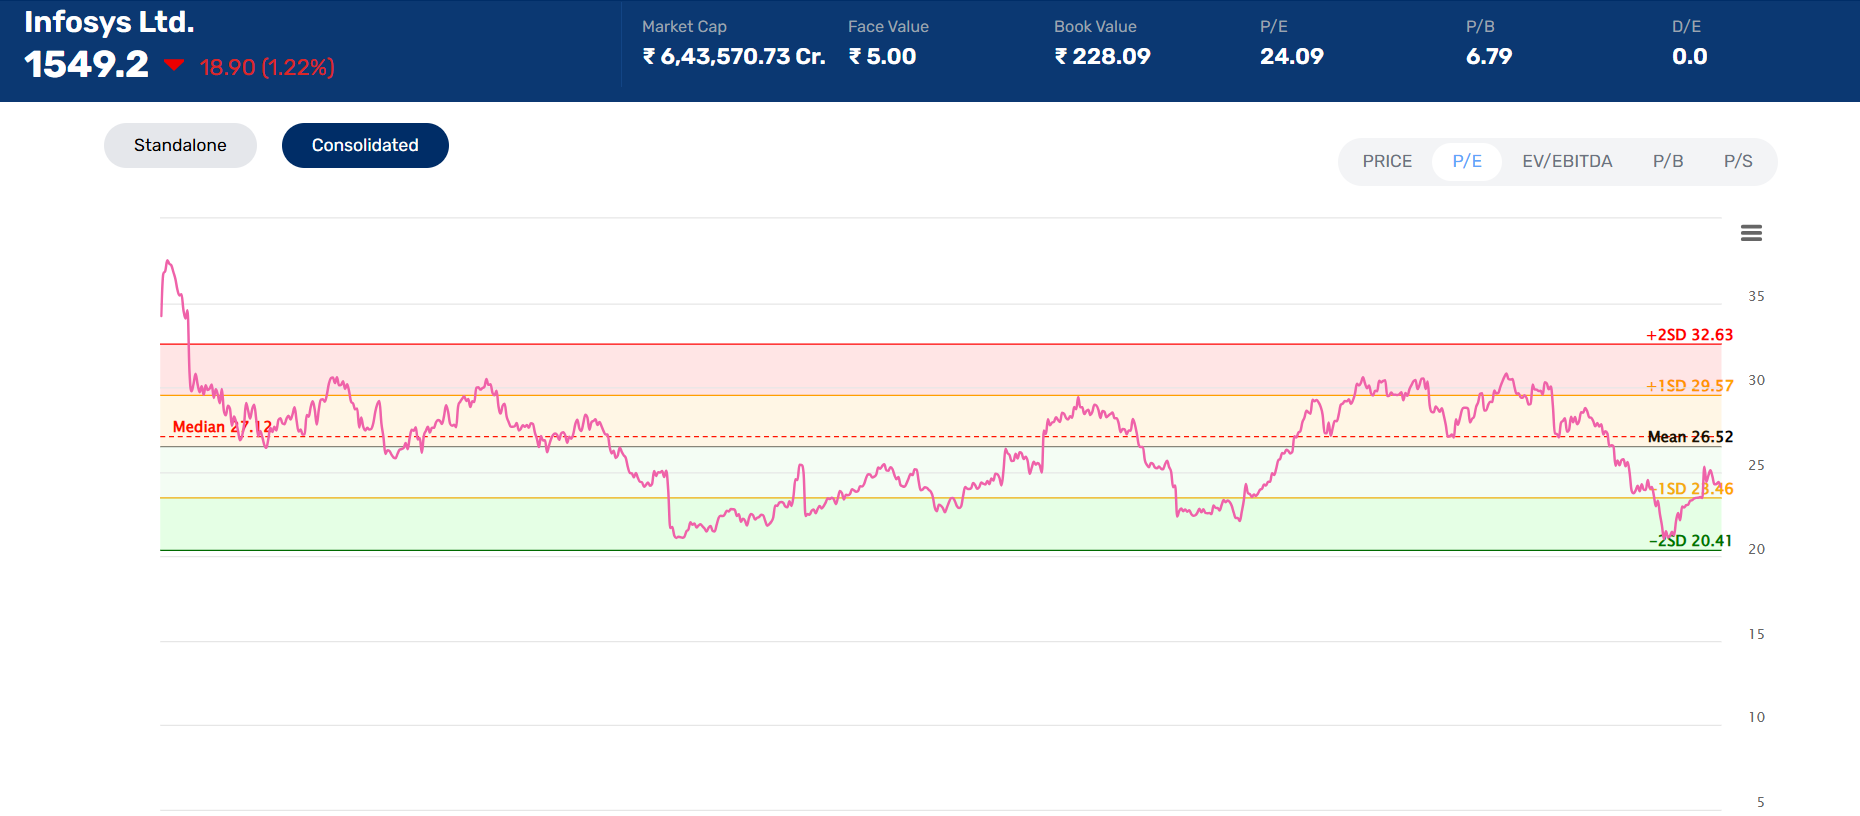
Jun month TOI-Spreads turned Bullish
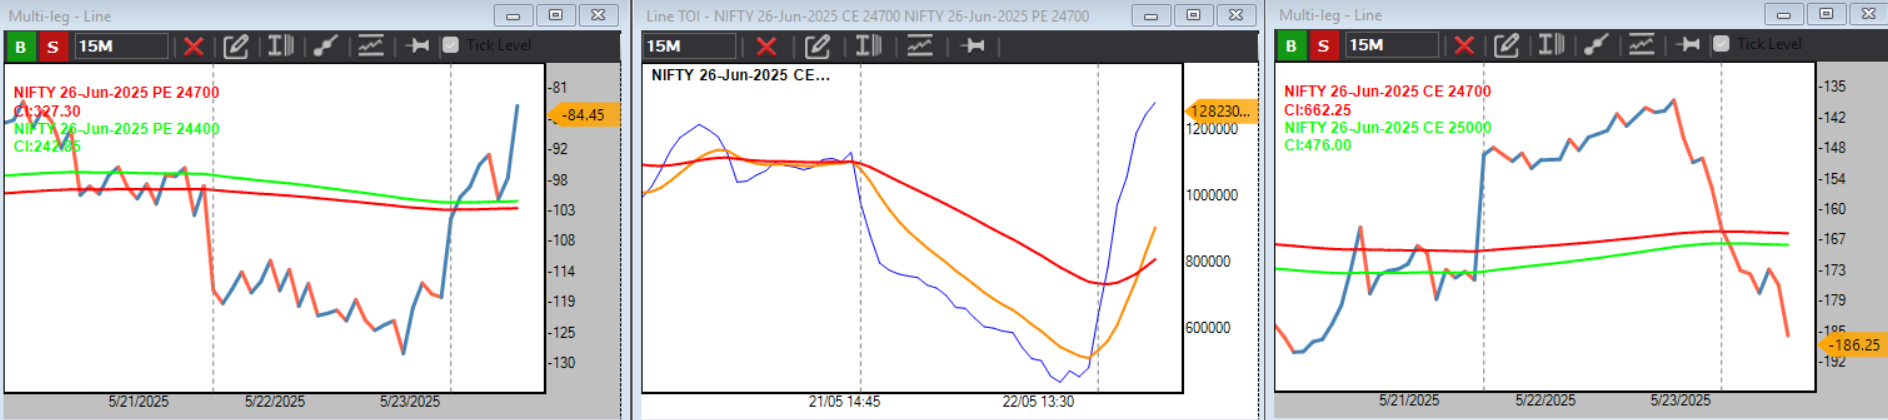
NIFTY => Monthly 24700 TOI & Spreads->Upper panel Jun expity-lower panel may expiry- can plot 5 days of EMA in next month from today onwards one can look to next month TOI & Spreads =>Mkt taking support from 89 EMA Channel High low on 75 min charts
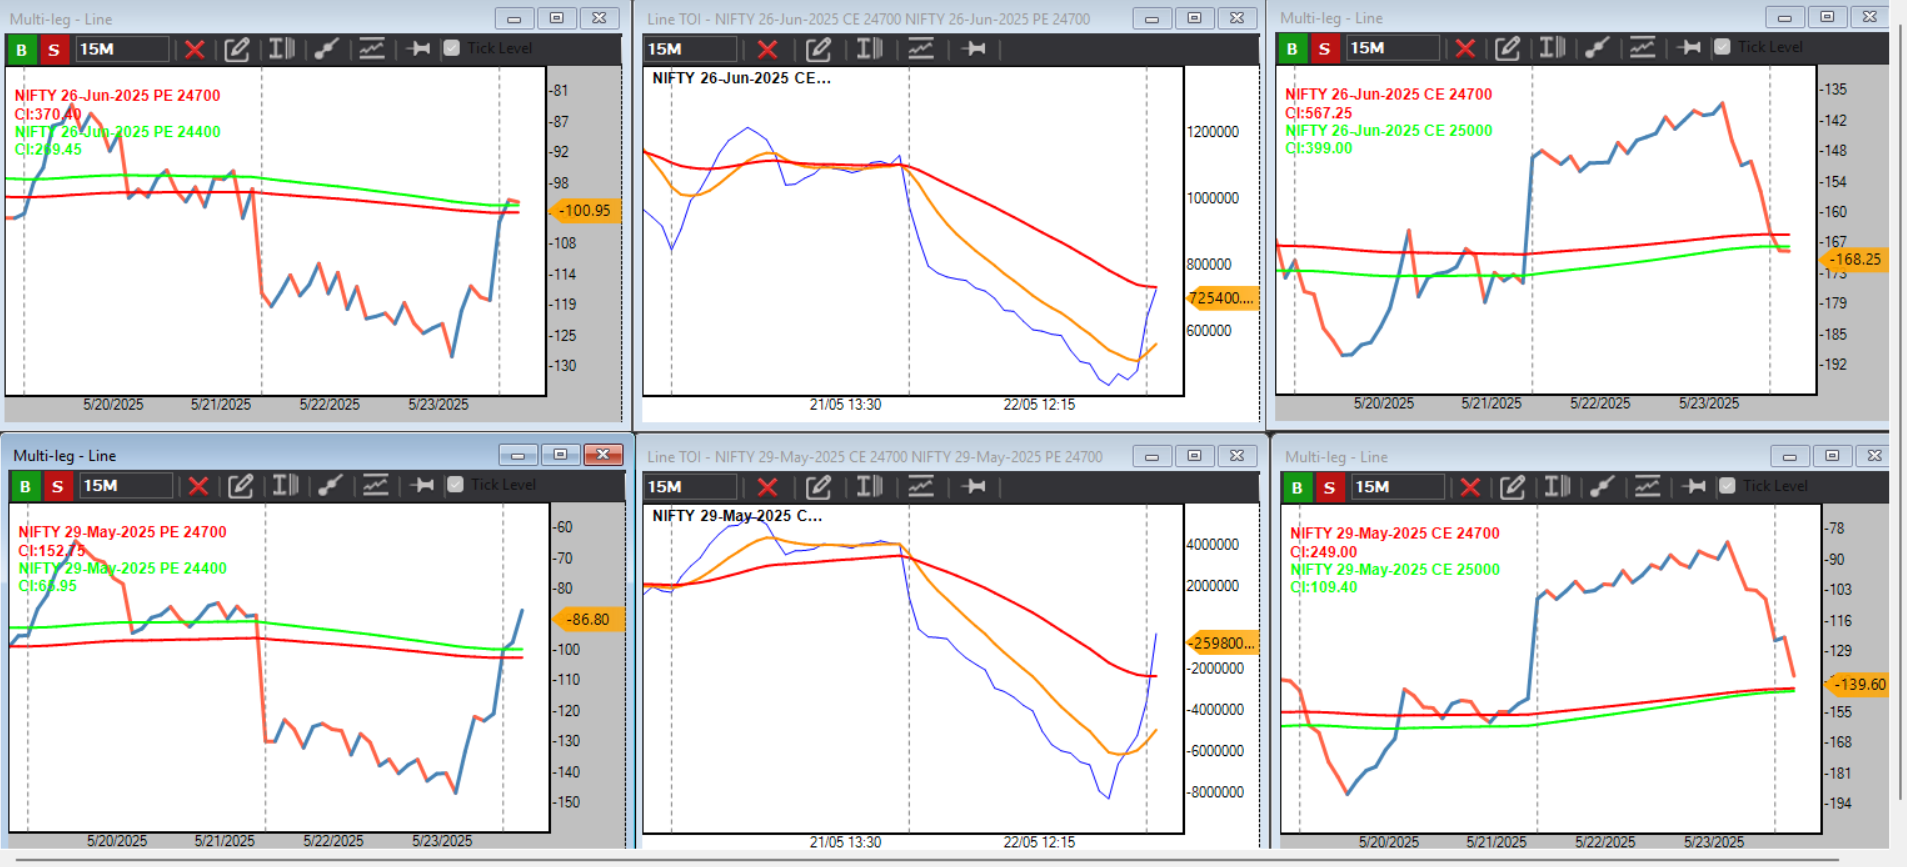
Currently allinged to bearish
underlying index on 89 EMA High-low Channel which can act as Support /Reversal zone
do light quantity
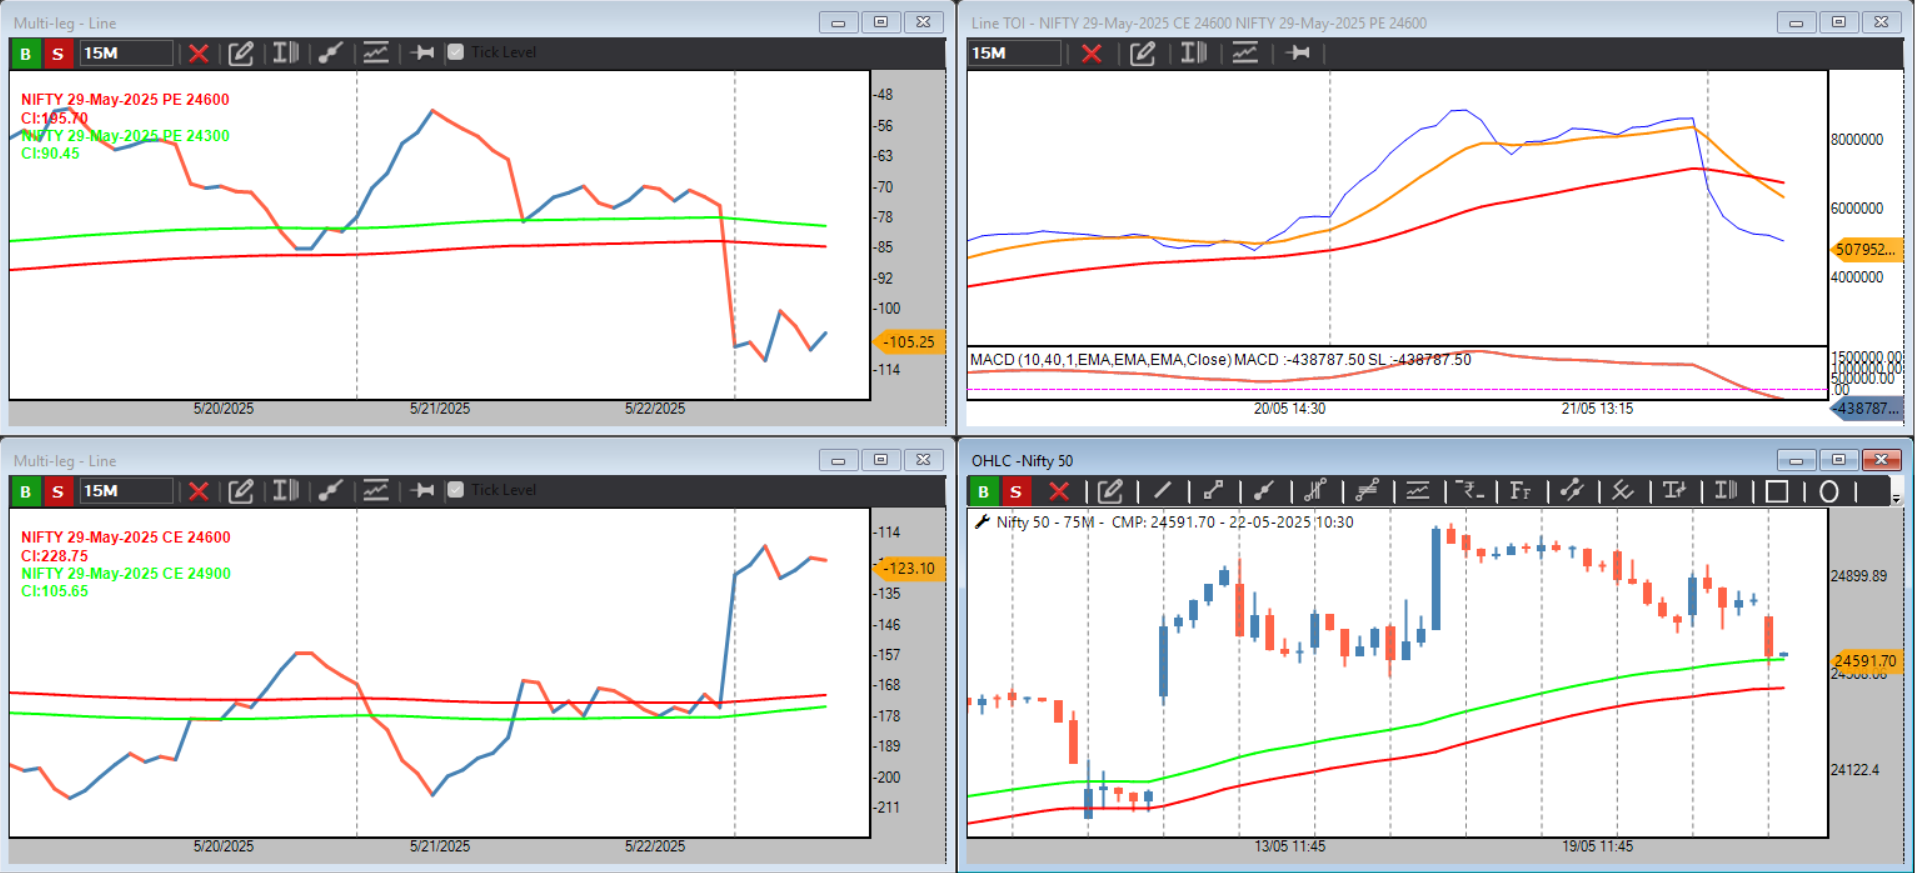
Nifty is currently in Golden Cross over-Bullish ,key levels to watch out that may act as possible reversal/zupport zone on closing basis
24400-24100-23800
we are accumlating two ETF/BEES-ALPHA & MOMENTUM50
Remember the "HORNEY BULL MARKET " is not strated yet -till that no oneway clear rally in market
Nishesh Jani,CFTe
#AhmedabadNest #Nifty #levels #keylevels #ZONE #reversal #stockmarketsindia #analysis #nisheshjani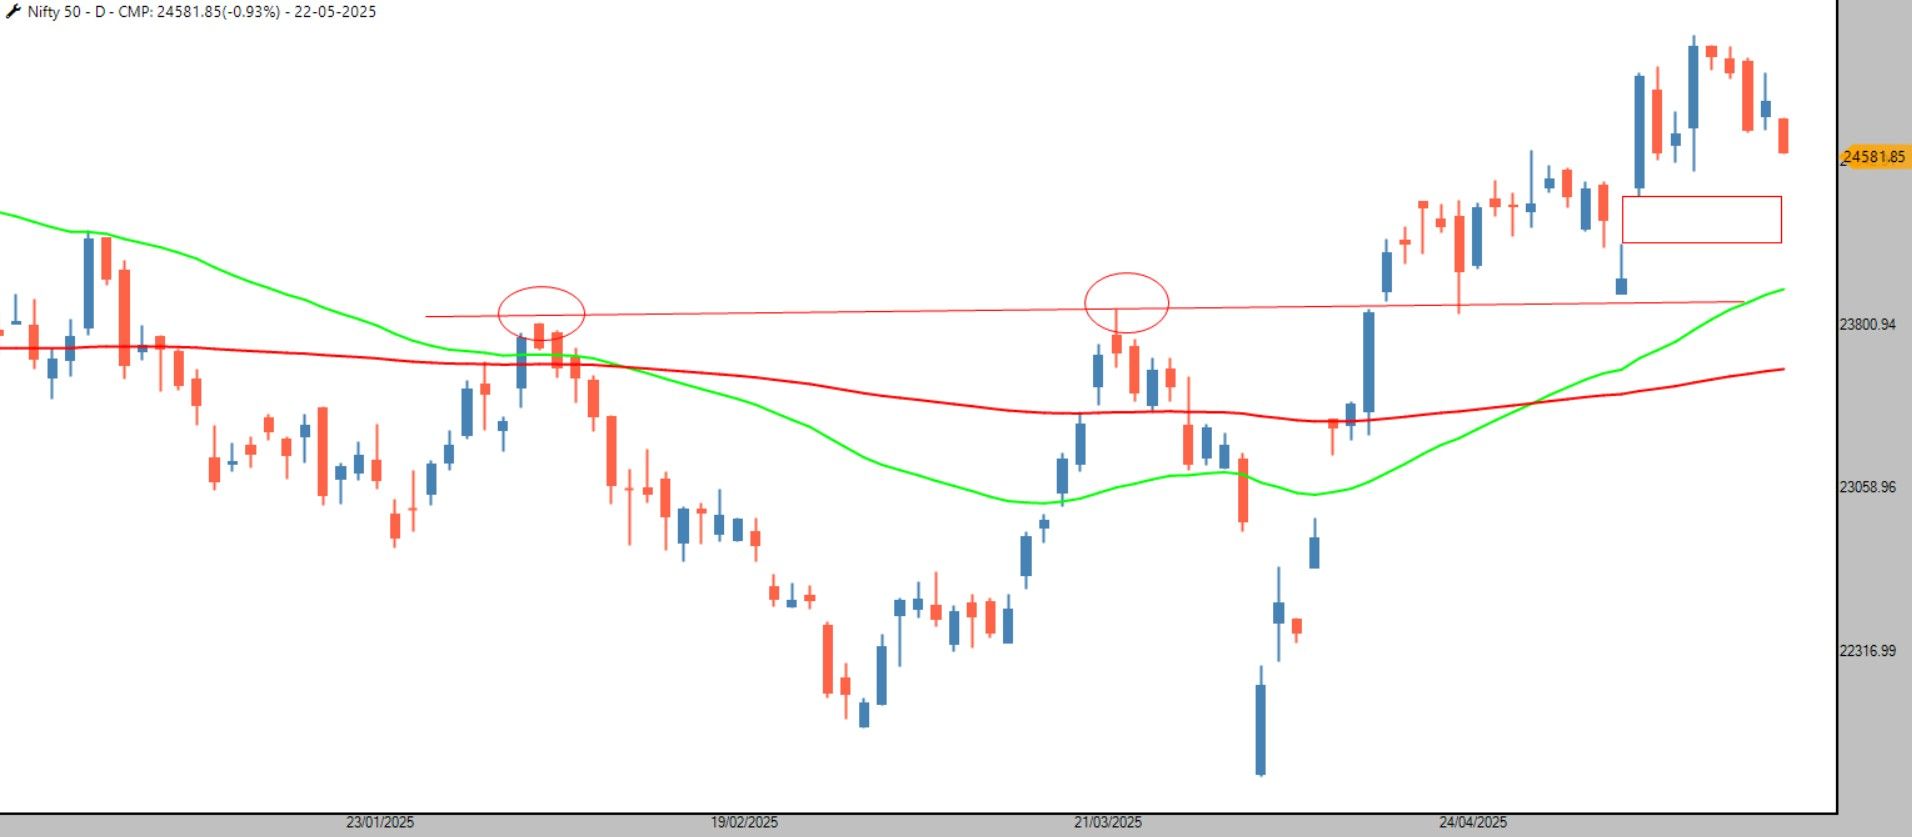
created strategy on quarterly re balance - i saved but it is showing re balance on august actual should be in july-if i add 78 daya from tomorrow it will re balance in august while as per quarterly basis it should do in july
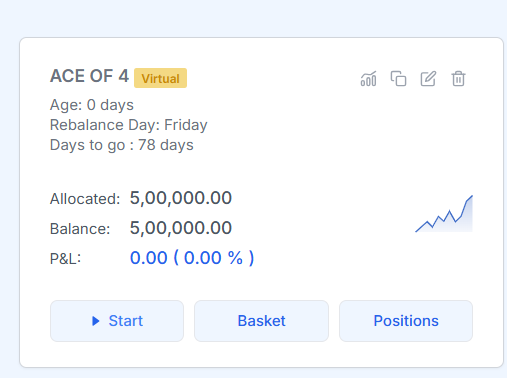
when we scan ultimate matrix with look back period kindly add that date also that will help in future when we are saving the data
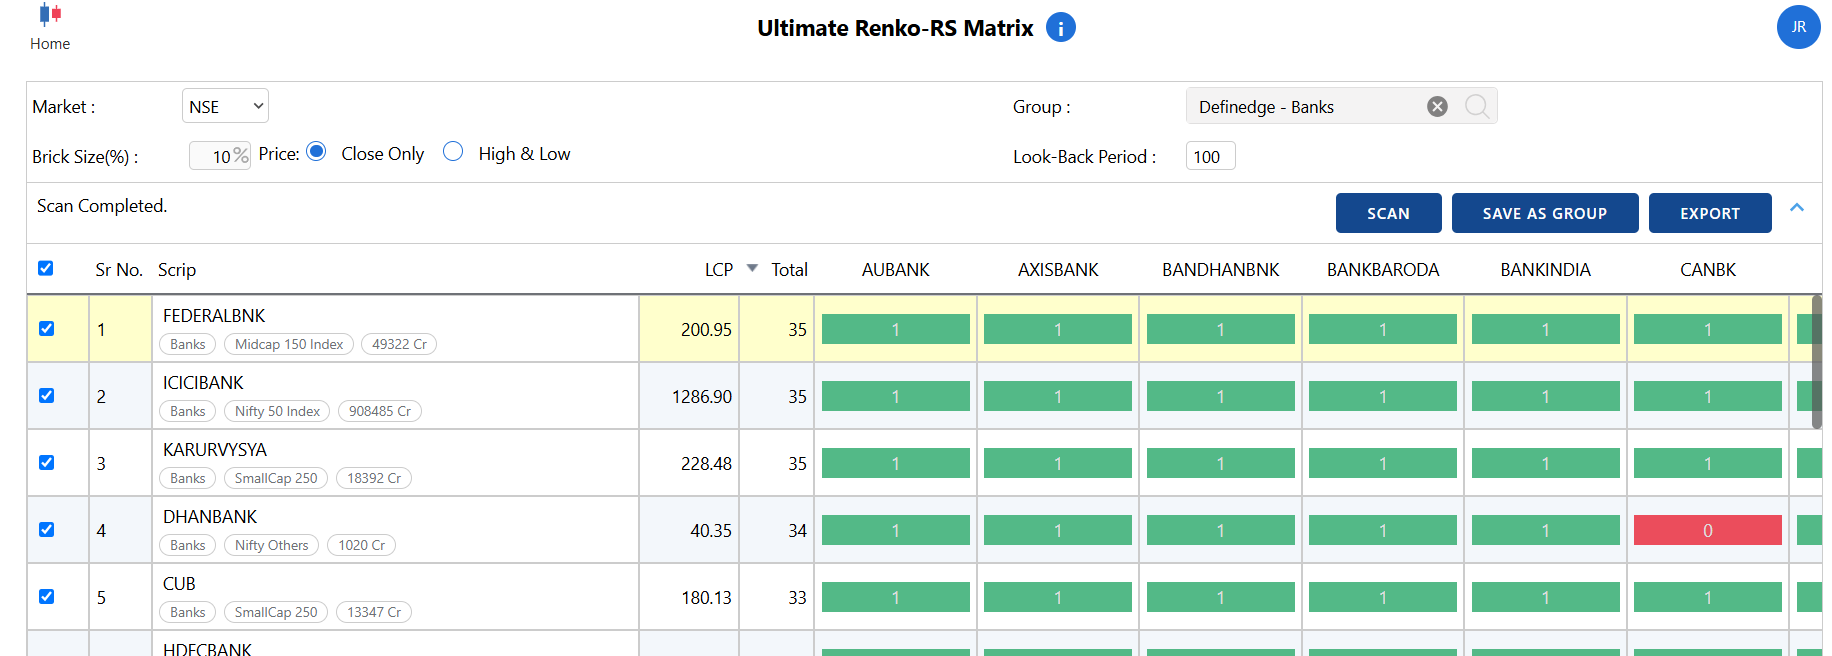
make this table as downloadable
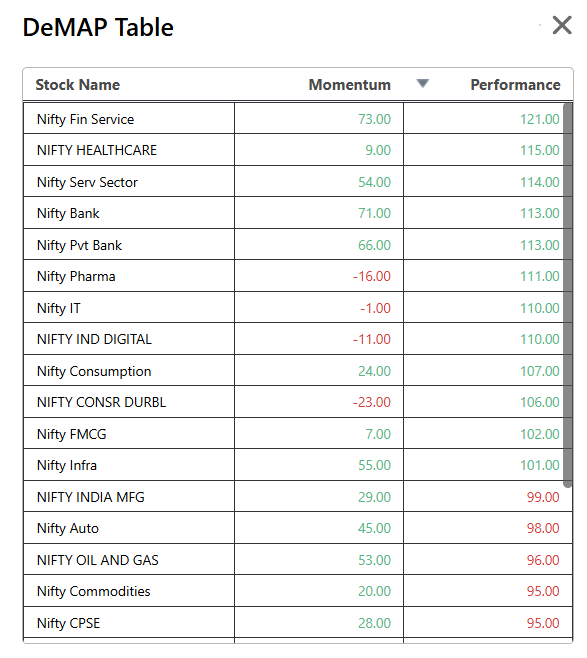
Ready for 20 % Rally ?
Look at the attached chart of #Nifty #banknifty
many open verticle counts of Point & Figure charting method -> suggesting another 20 % ++ Rally
in months to come expect nifty 29000-31000 and bank nifty 66000-68000
Negation levels For nifty 23000 and Bank nifty 50000 close below it Bears will control the market.
This could be Starting / base formation phase of my favourite "HORNEY BULL MARKET "
Find new leaders-> we have accumalted ALPHA & MOMENTUM50 ETF/BeeS
NISHESH JANI,CFTe
#AhmedabadNest #Nifty #banknifty #stockmarketsindia #analysis #opportunity #trading #investing #process #approach #nisheshjani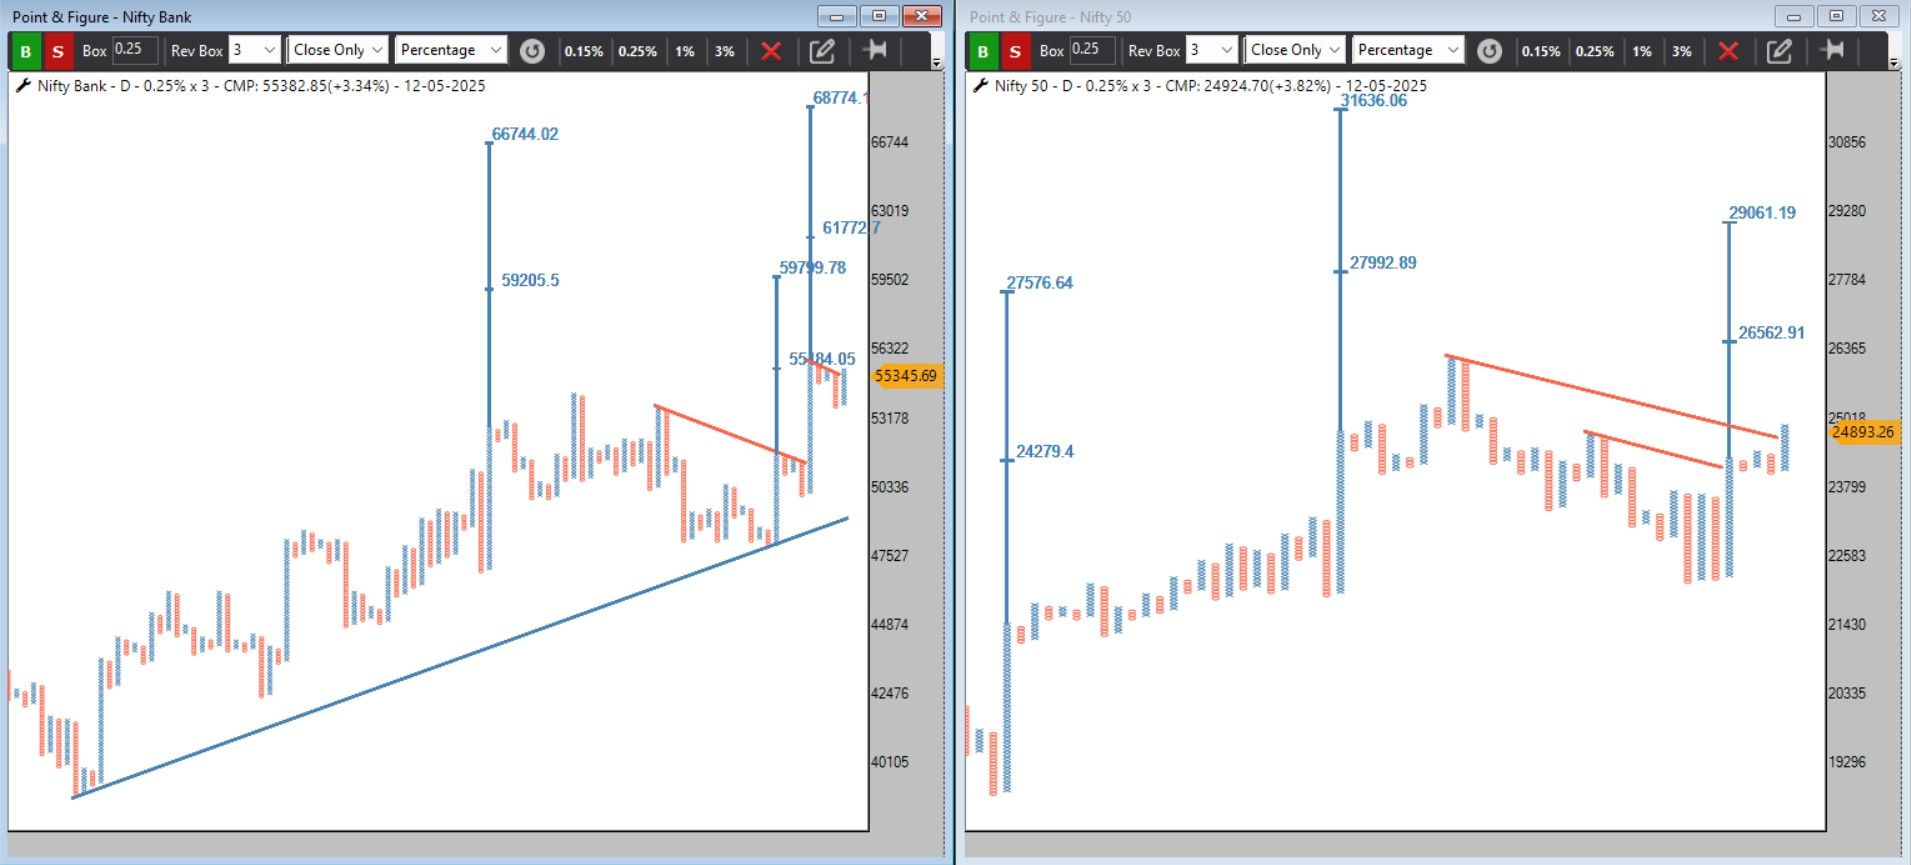
at 52 week high
yes sir
#GOLD
Below $3200 expecting $3000
weekly + monthly close below $3000 will have bearish reversal candlestic
#AhmedabadNest #nisheshjani #GOLD #reversal #bearish #Patterns
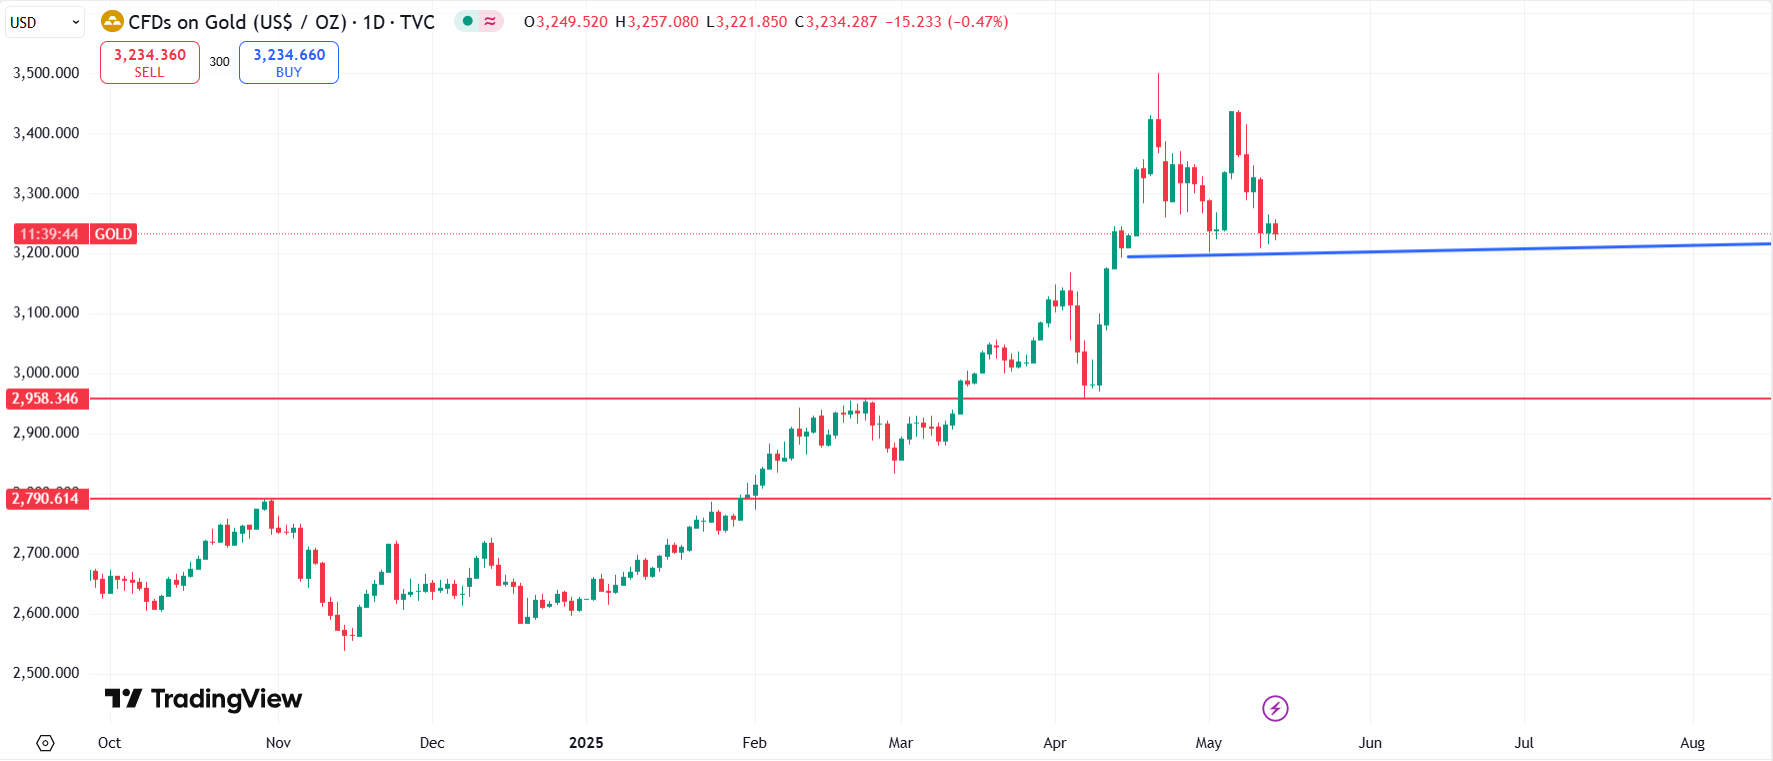
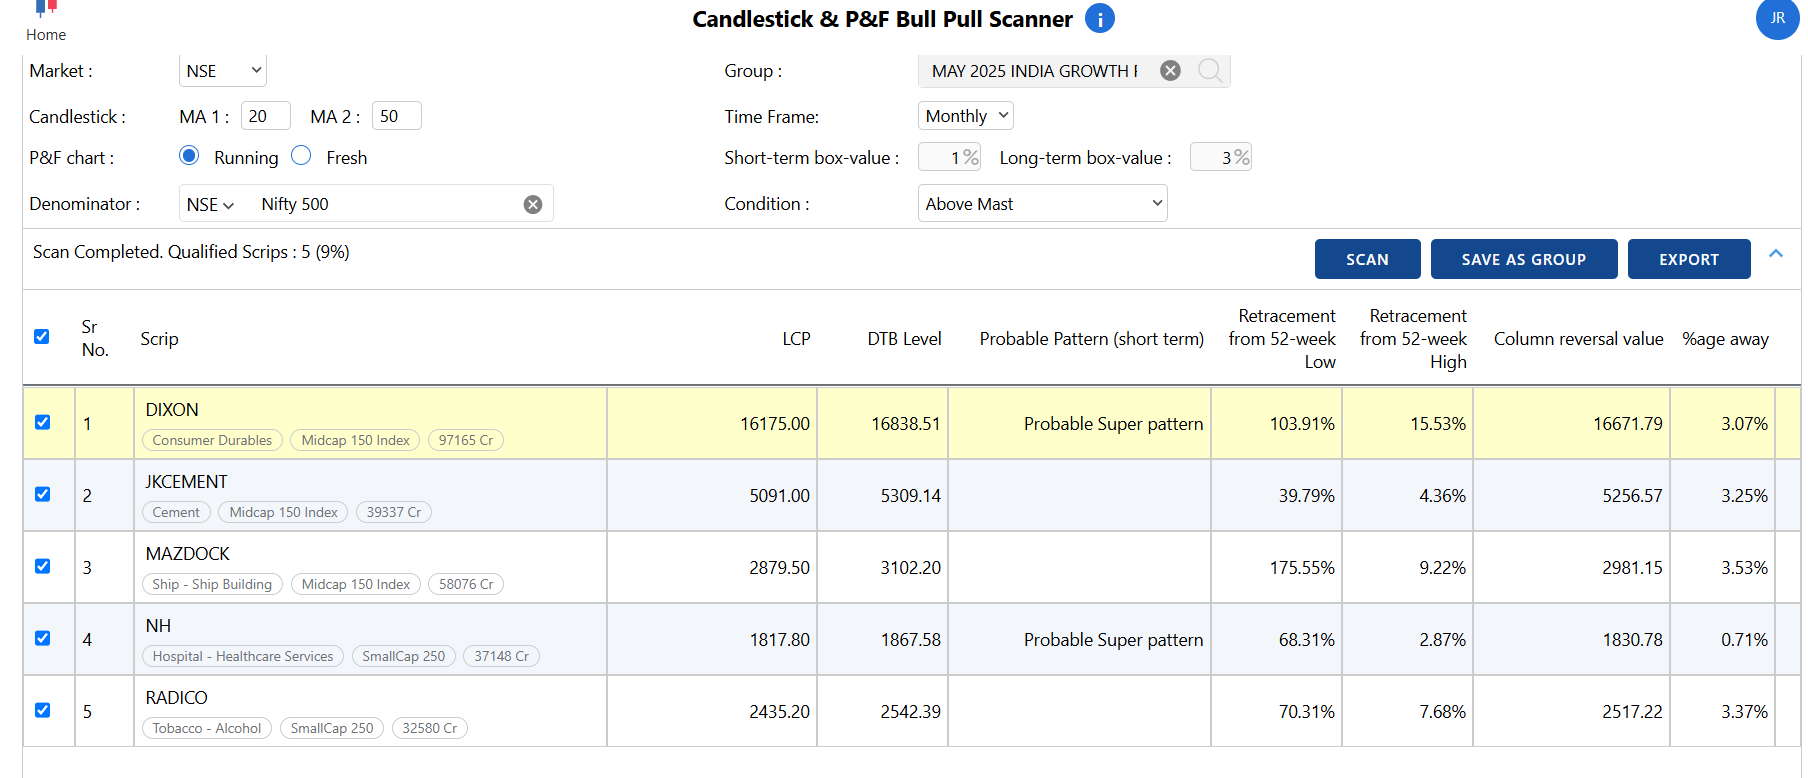
#Bhartiartl
in structural long term up trend->Breakout from consolidation
Trail SL 1812 on closing basis for target 2619
Entry ->1% EOD Bullish Column Reversal
Stop loss-> DBS
will continue to trail the stop loss as and when required
Nishesh Jani,CFTe
#AhmedabadNest #longterm #Breakout #pattern #NSE #StockMarketIndia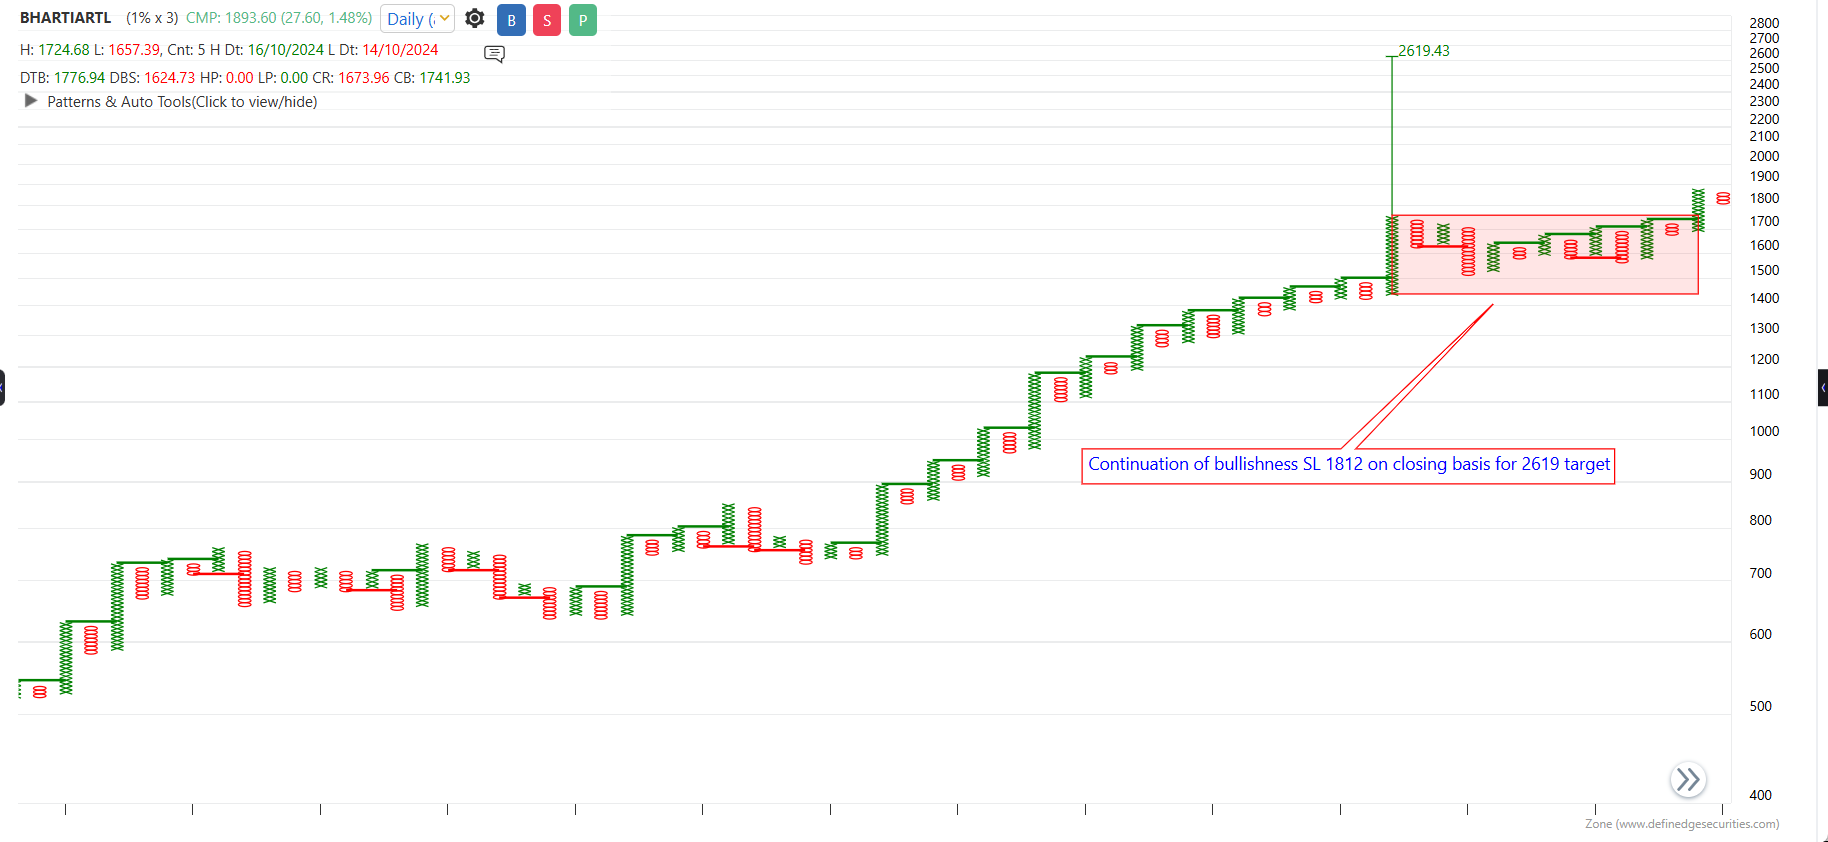
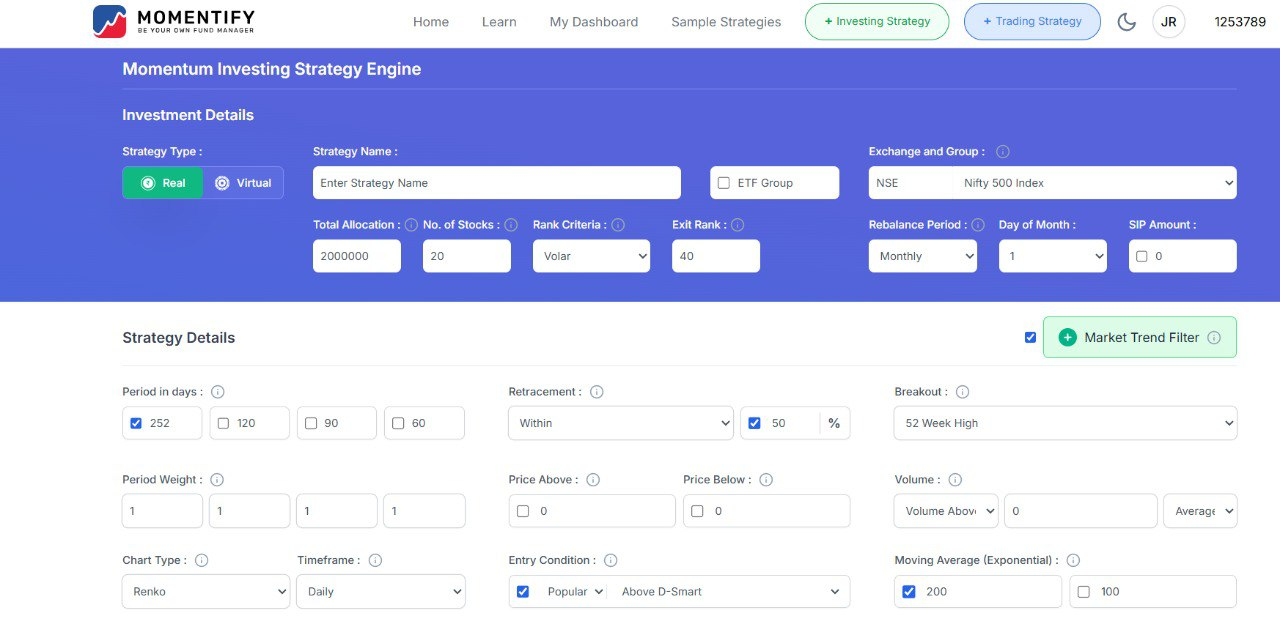
add each strategy in sample and on click button to start back testing by just simply changing the universe
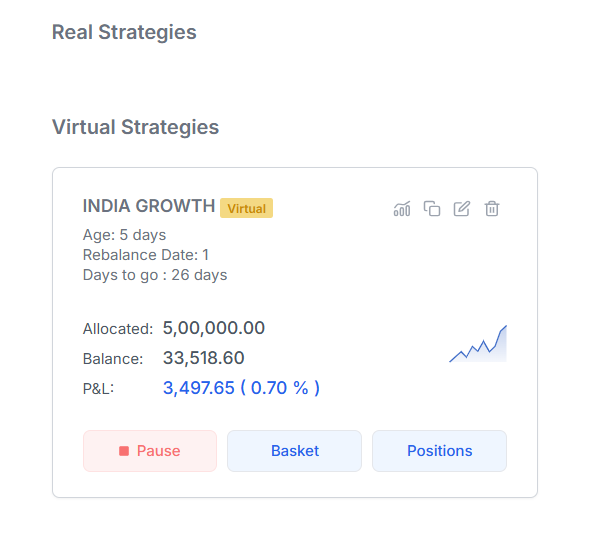
along with portfolio return calculation add Benchmark index return along with virtual and actual strategy on momentify platform
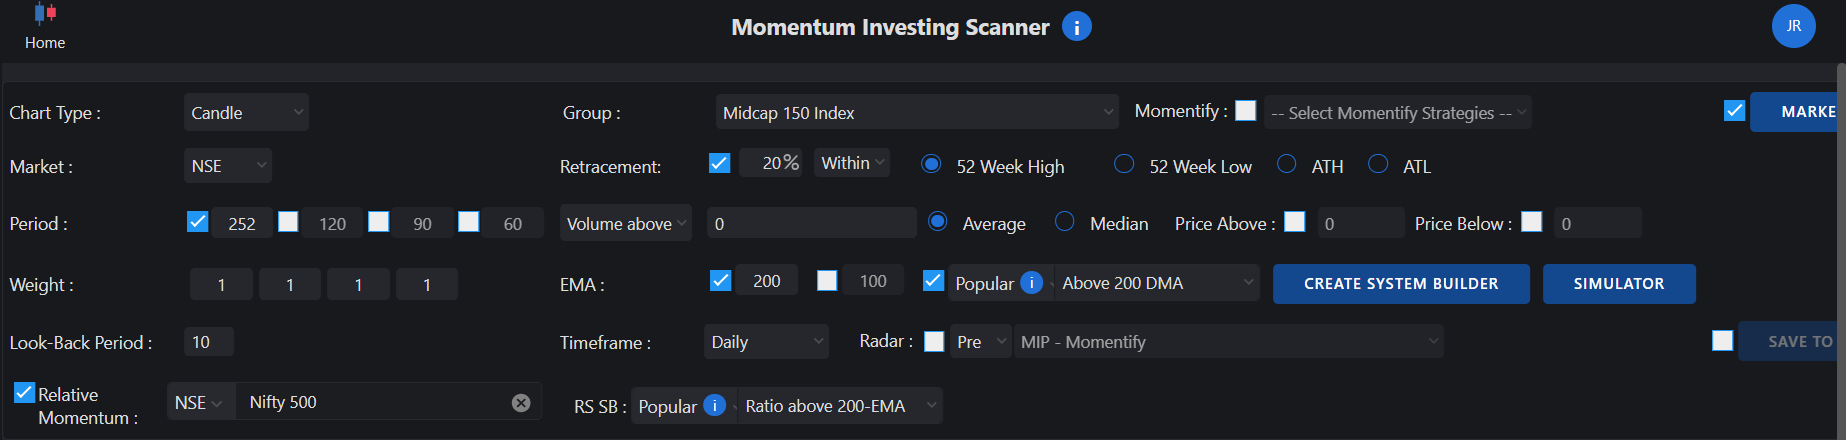
that will be easy to select otherwise need to calculate the trading days were chance of miss calculations
first tgt done
NASDAQ-Case for Pullback for indian IT stocks !
looks at the weekly chart after 3 Red candle which is know as Crows and now formed Hammer-any close above hammer will halt the correction and pullback to IT stocks in US and across the globe
we may witness recovery in indian IT stocks also
#Nasdaq #NASDAQ100 #IT #pullback #analysis #StockMarket #global
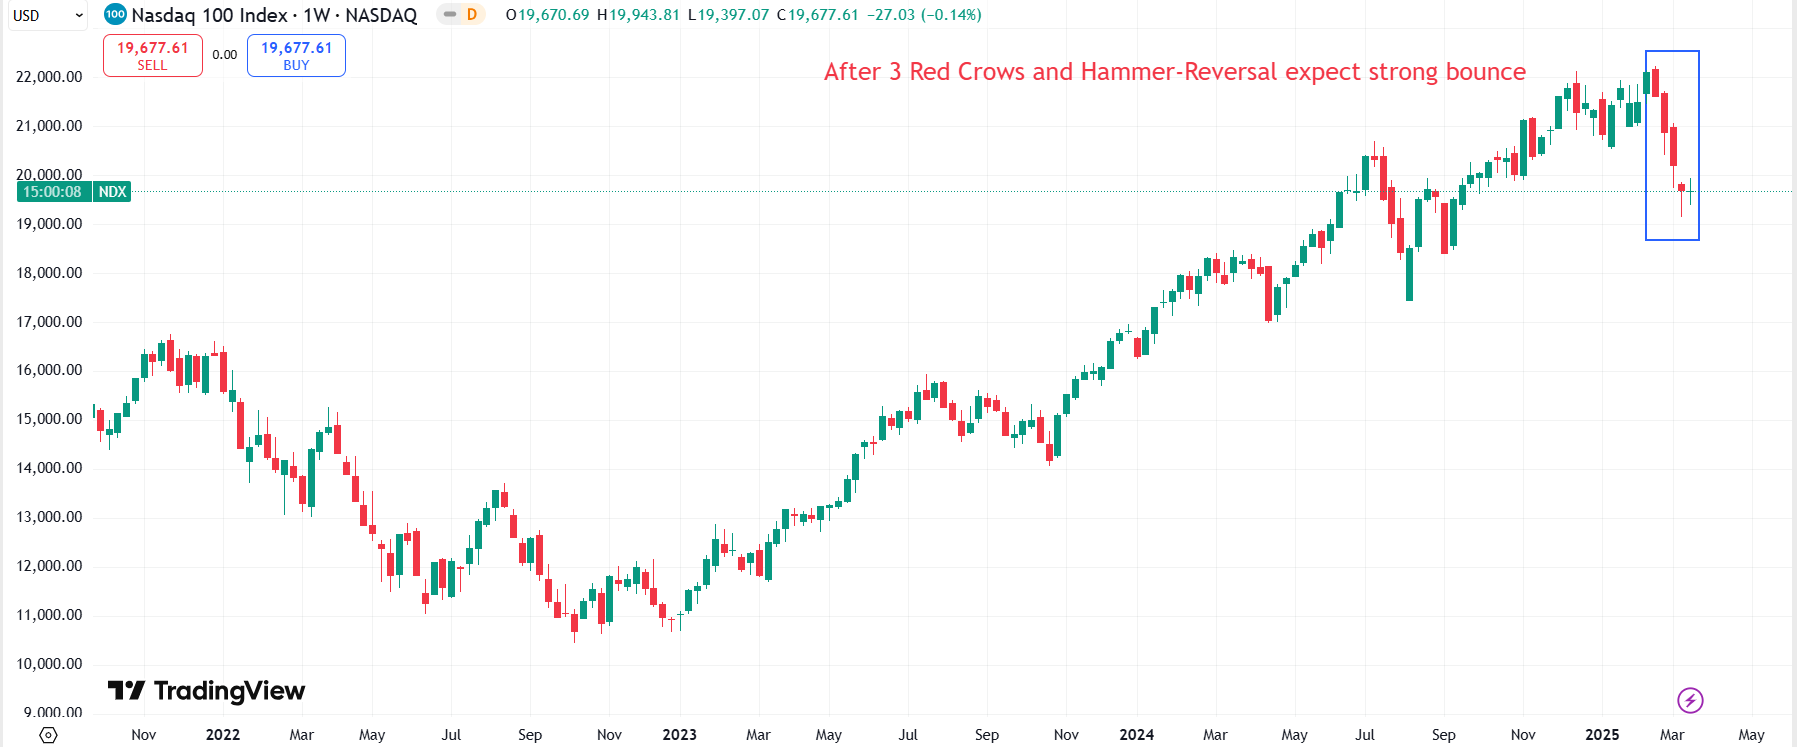
5000 point rally in Nifty ?
Remember the 5th march post with titled Mkt at near Bottom !
Again posted on 13th march with titled Two reversal pattern with one RARE pattern- close above 22720 will have 23300 now heading towards it
looks at the chart today is the third consequtive day clsoe above lower trendline and close above 23100 will trigger close above upper trendline,gone below lower trendline but smartly bounced-> when mkt is oversold and attractive majority of the time false breakdown happens
on 5th march posted chart with custom breadth indicator that bottom is not far away along with this written that we are at covid lows in terms of Breadth-Indicator and valuation wise
now pattern will unfold on close above 23100 with 22000 as strong support levels for 28000
keep accumlating ALPHA & MOMENTUM50 BEES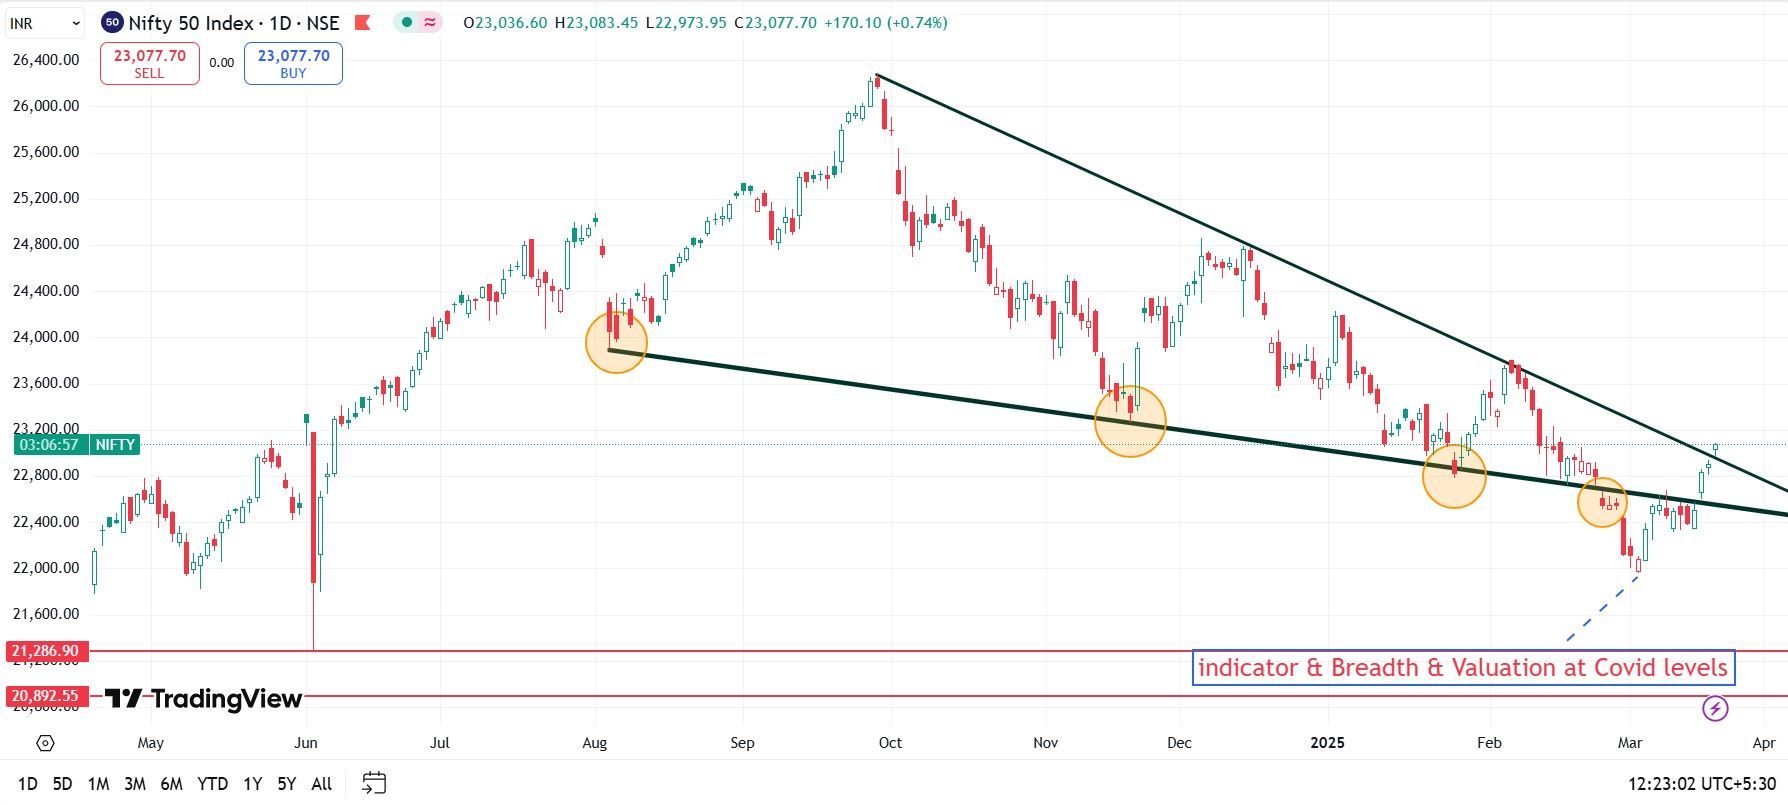
BAJAJ HOLDING
VALUE-GROWTH MOMENTUM Strategy
Find good Value or Growth oriented stocks and time with momentum
#VGM #setup #Breakout #NSE #StockMarketIndia
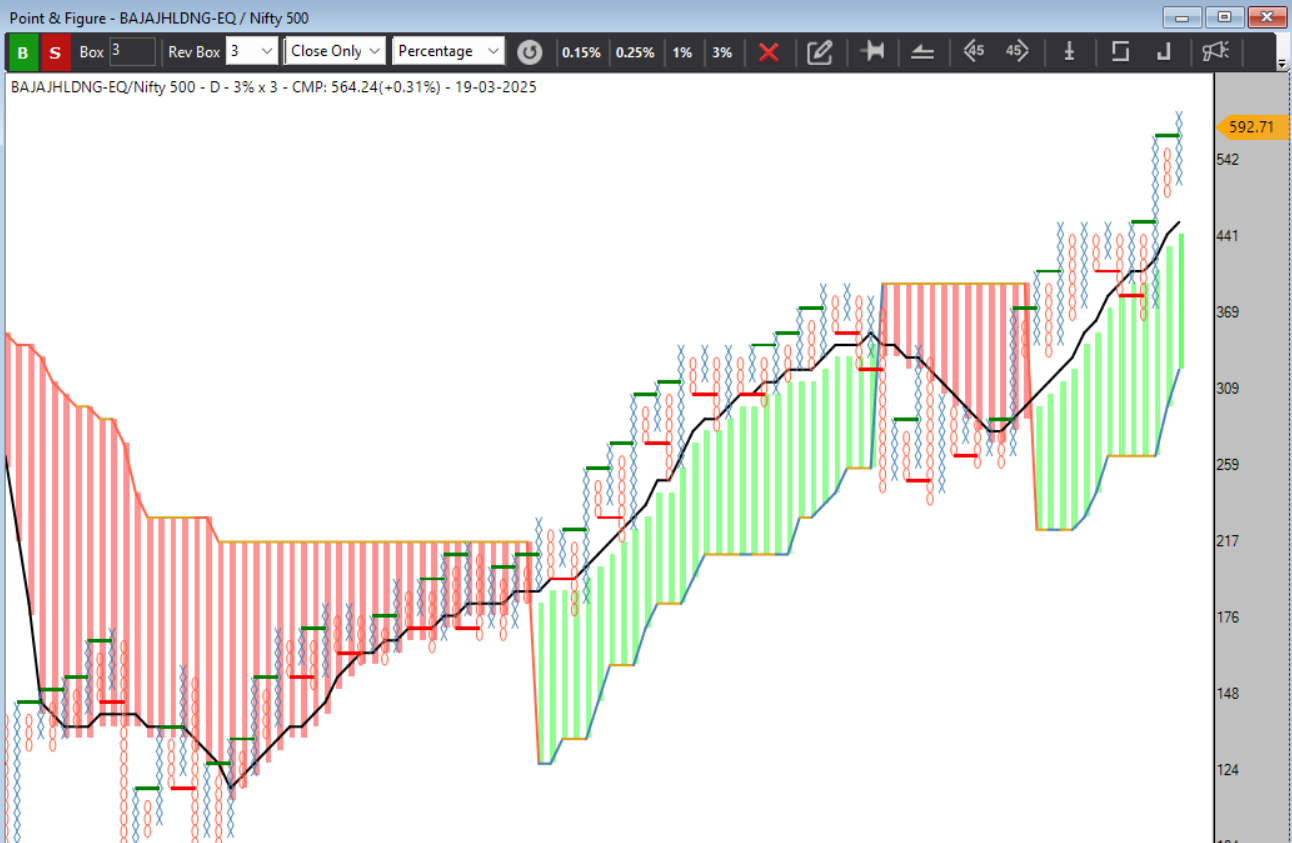
this is breadth data i personally make -can be feed in to my mkt and plot-can contact definedge team for it but you will not get data which is personally made
bullish
NIFTY-Two Reversal pattern with one RARE pattern
1->Probable Cup and Handle pattern breakout above 22720 will confirm the pattern can rally to 23300-23500
2->ISLAND reversal -There is gap down open un filled gap between 22720-22668 if mkt open above both gap and remain unfilled then island reversal and this pattern has high accuracy of forming top and bottom because this is rare reversal pattern
looking at three thing mkt is ready for forming bottom and reversal
Breadth wise at covid levels
Indicator wise near covid levels
Valuation wise near covid levels
Tarrif news is now old that will be sector specific event -if something new panic situation along with weak quarterly results then mkt will further go down
inflation wise only concern is from the deperciation for USDINR that impact on imported food items
my view point for bullishness and mkt bottoming out is 75 % and 25 % for further weakness
accumalting ALPHA & MOMENTUM50 ETF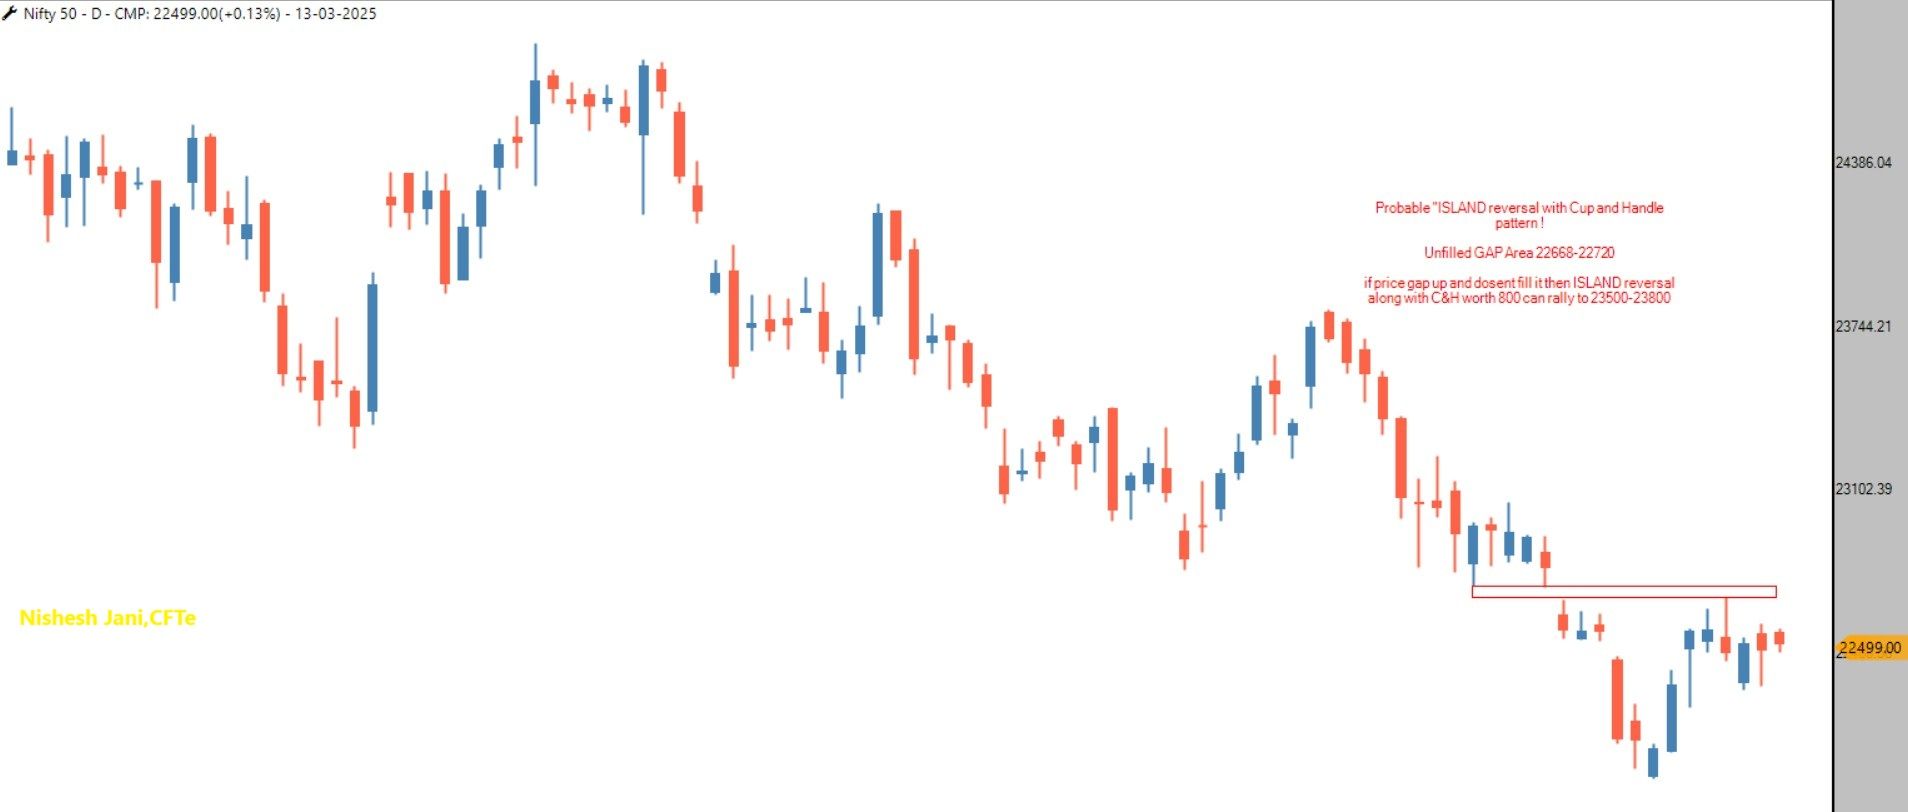
sir add D MOMENTUM score in lower panel of stock that will help how the stock has moved in past and if we get pattern breakout along with momentum score that will provide very good timing tool
candle chart ATR scanner then as per your choice trade in p&f -candle whatever the system you like
scan stocks which has ATR>3 they give good directional move when gives breakouts
Mkt at near bottom !
look at the two conterian signal chart
first chart when cross 300 mkt finds bottom
Second chart when it falls below 70 mkt find bottom
Covid and 2022 both time when this signals reached it has reversed
Bottoms are more orderly than tops
indicator & breadth wise mkt is oversold and tend to find bottoms and valuations are relatively cheaper and this is the reasons why i recommand to accumlate two ETF
ALPHA
MOMENTUM50
when mkt is in down trend i avoid picking stock let mkt to find proper bottom and bullish structure and then find leaders
#nseindia #NSE #stockmarketcrash #stockmarketsindia #breadth #oversold #sentiments #passimistic
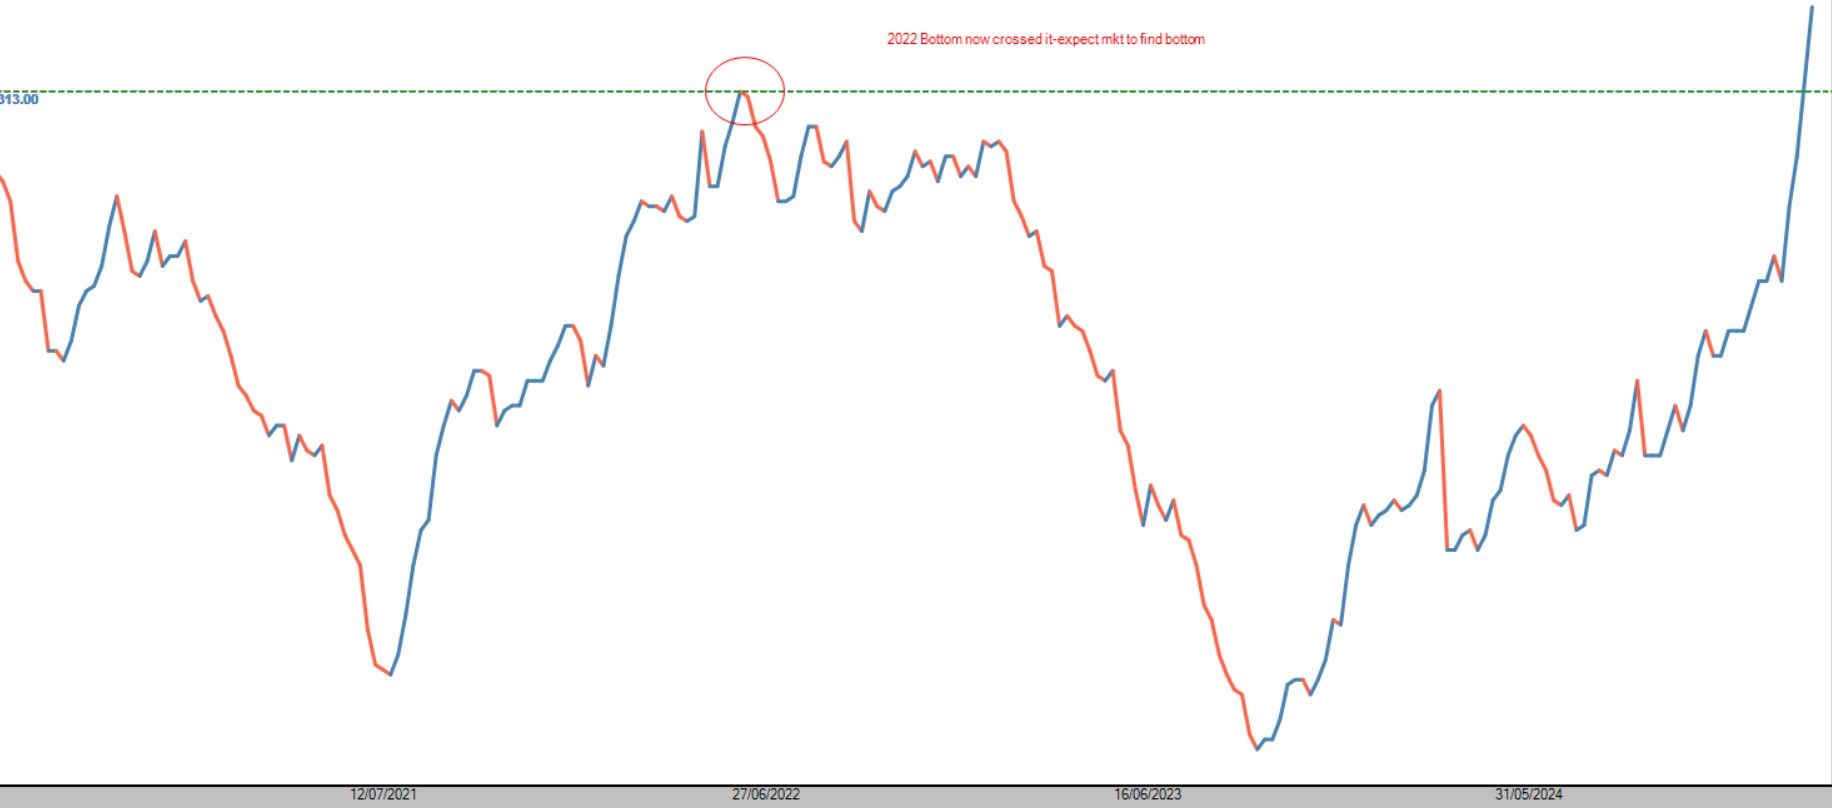
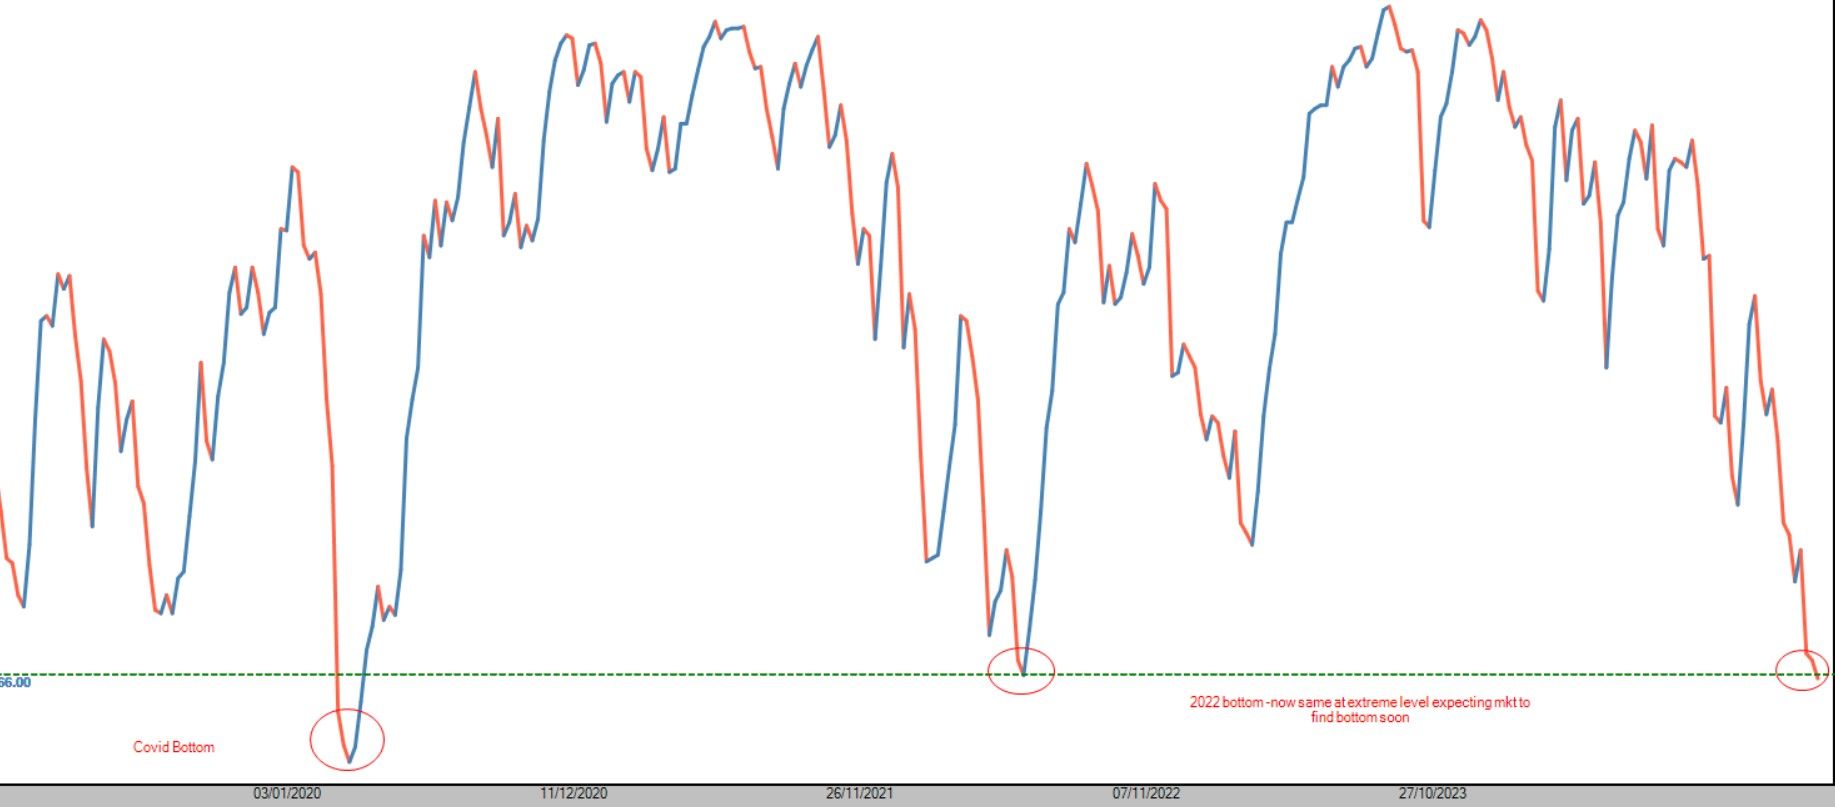
calculate the portfolio correction and all index correction after this post and re read the post is the written things happening or not
No strong positive momentum
Momentum Strategy will not work easily
Buy & Hold will not work
Easy system will not generate returns
Leverage/MTF will not have Favourable Time
High P/E & High leverage stock will be punished
Fundamentally strong/sustainable stock will show positive momentum
traders and investors lower down your expectations
Rate of Change-Speed of momentum will be slowdown
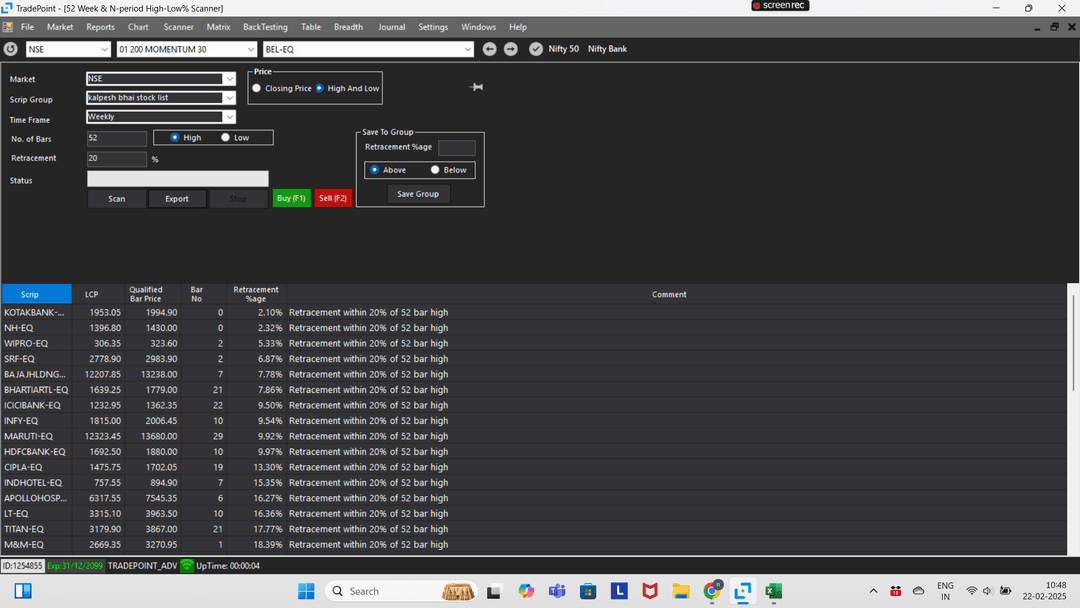
hello team kindly add sector and mcap in scanner-> 52 week and n period high low retracments that will help to easy spot which sector and mcap is leading and lagging in an easy view
EID PARRY-another 25% correction
quality company down from almost 1000 to below 700,very good distribution has been done expecting price toward 500 another 25% correction
my view is purely based on charts and technical analysis
as a momentum traders i need to keep watching where leadership is changing
#eidparry #stockmarketscrash #StockMarketIndia #StockMarket #NSE #analysis #india
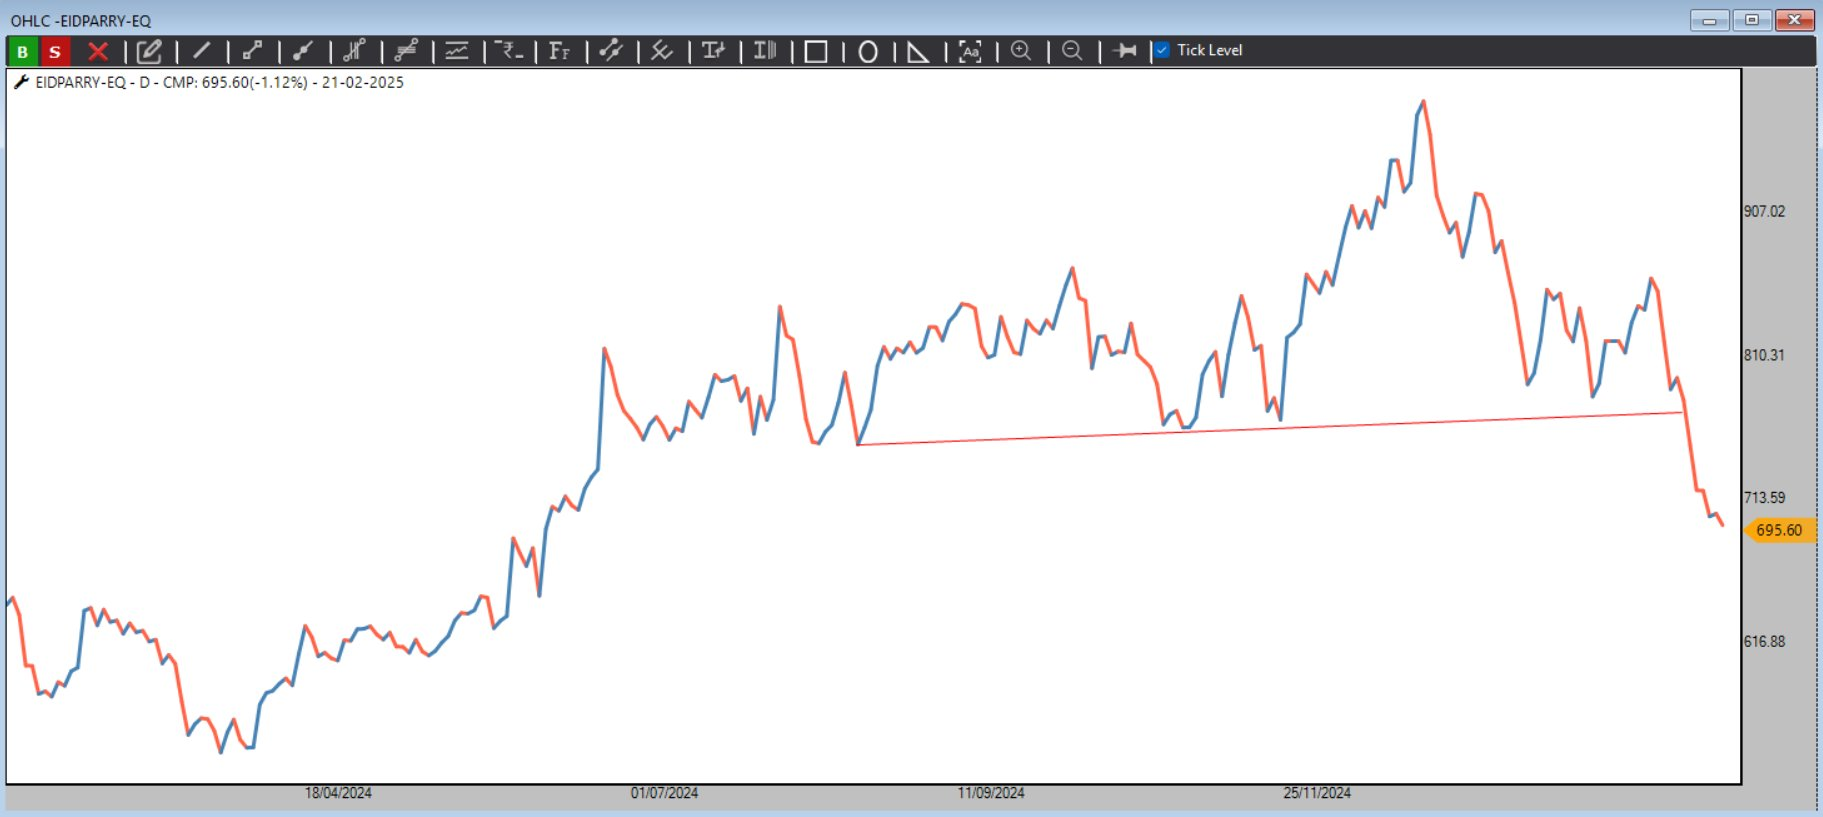
M&M -Box breakdown !
look at 6 month of consolidation getting breakdown possible to test 2200 !
if you are momentum follower focuse on exiting stocks which are loosing strength and focuse on getting stong positive momentum
#mnm #analysis #stockmarketscrash #India #pattern #NSE
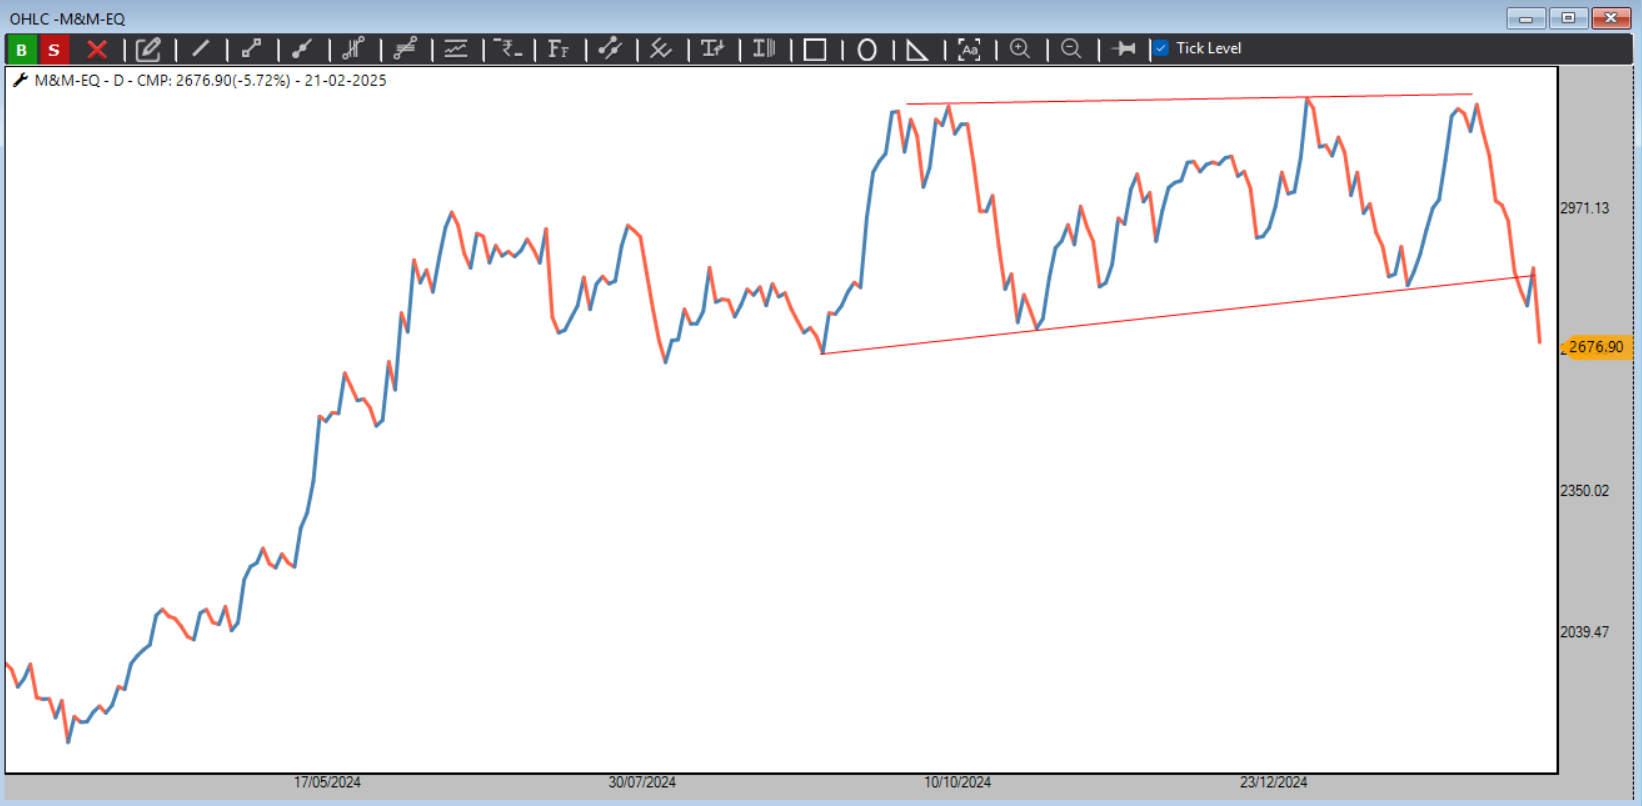
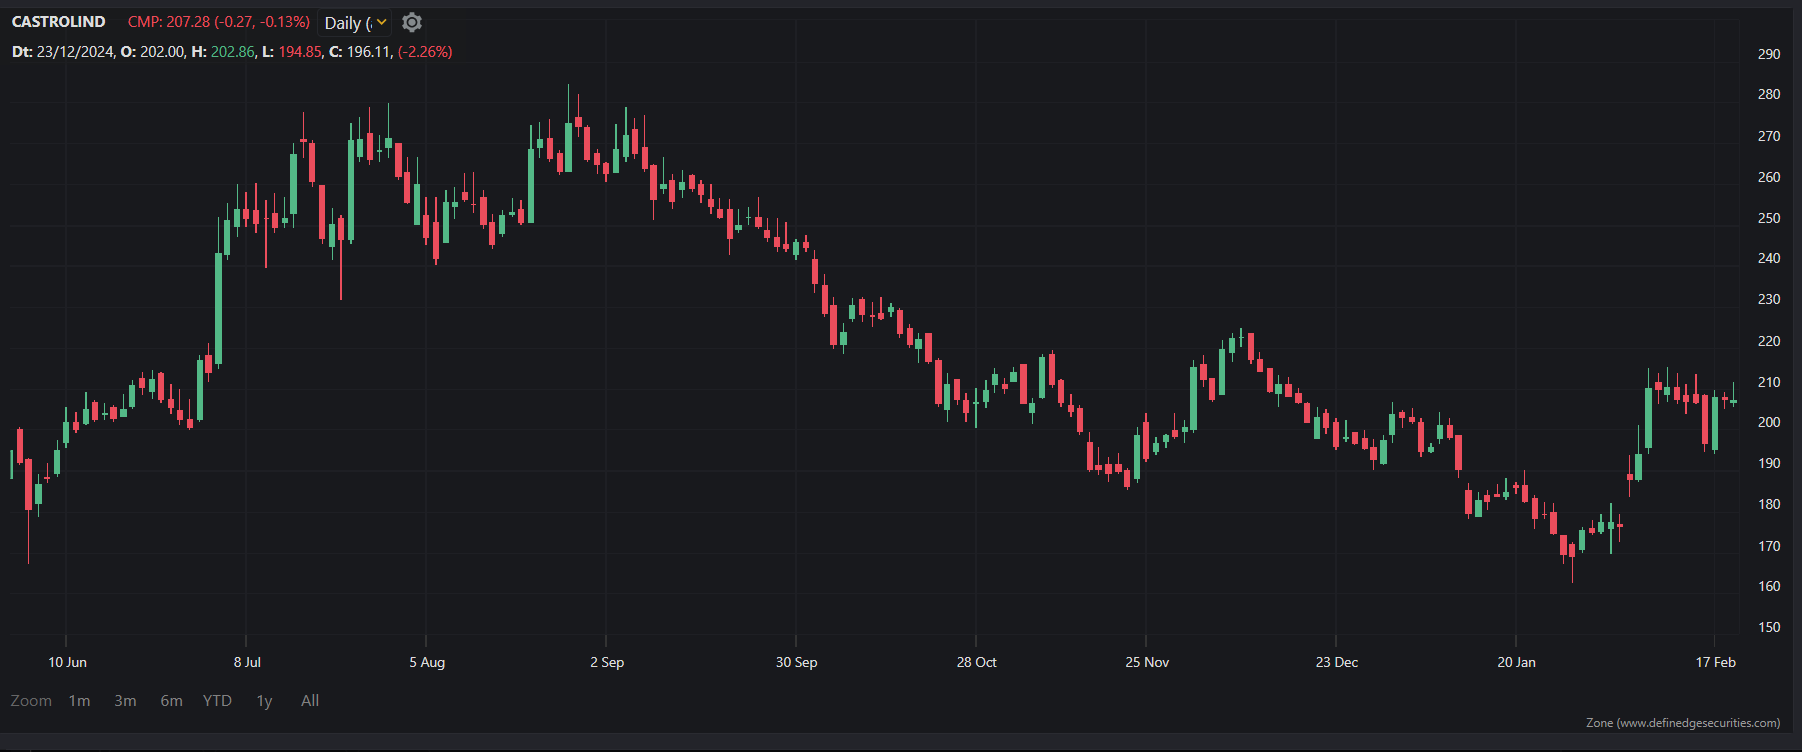
can you add D MOMENTUM score arrow direcly on chart with user defined momentum score as it will be good to see how historical the stock performed above below specific levels
or add in study in lower panel with levels
plus give look back period
please allow to select which camrilla levels we can plot lets say i am intrested in H5 AND L5 only so give this facility
Bearish view
resistance 4000 lower levels 3200
#tcs #pattern #breakout #analysis #stockmarketsindia #itindex #bearish
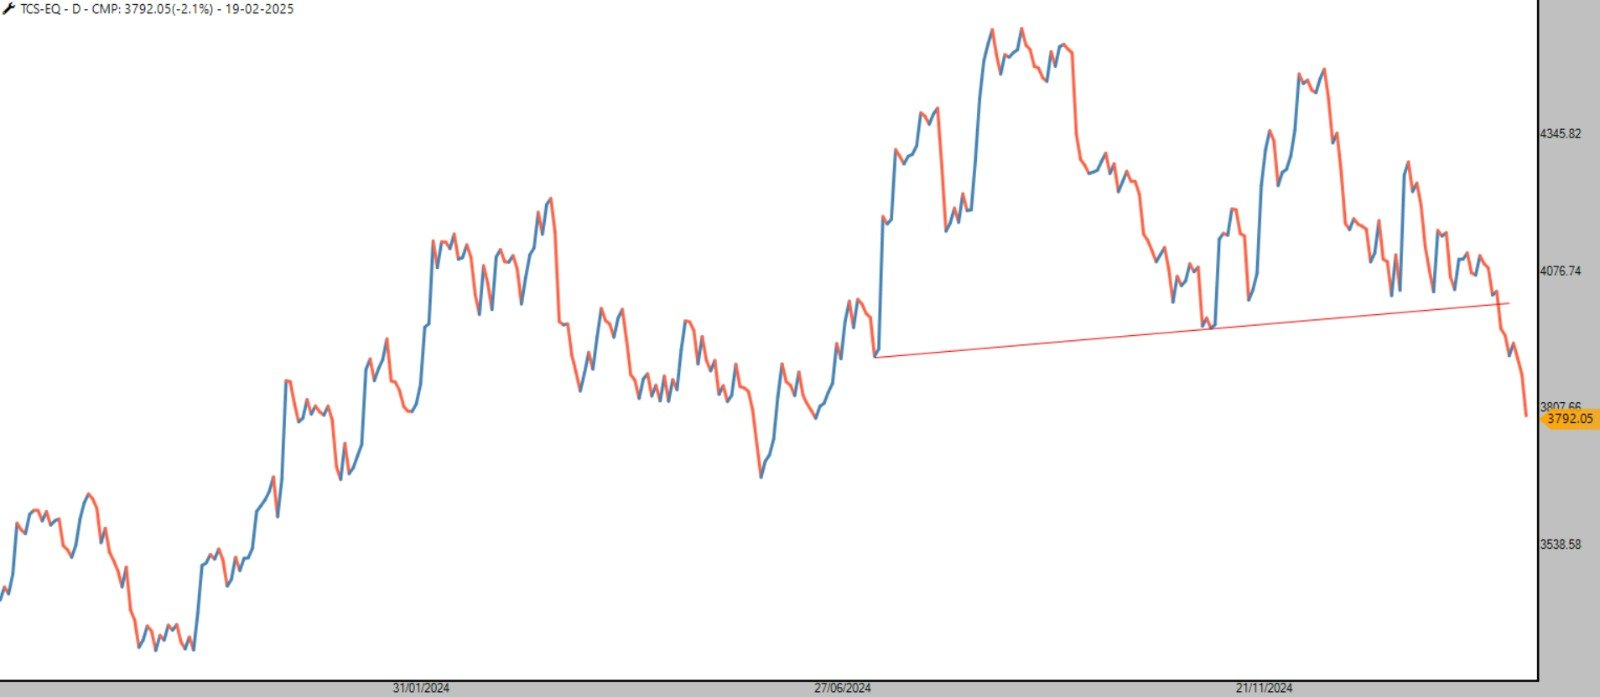
yes need much larger look back period and date specification
Recently released raju sir and ap sir video on anchor support resistance kindly add levels of that anchor support and resistance for easy
sir can we have number of days count above/below specific moving average ?
sir can we have number of days count above/below specific moving average ?
Record more practicle aspect video on D Pivot & give in table formate like other pivot and also give option to plot onlt T line & also connect this T line like Super Trend or any other indicator
if possible give condition Long above T with sl and backtesting of it
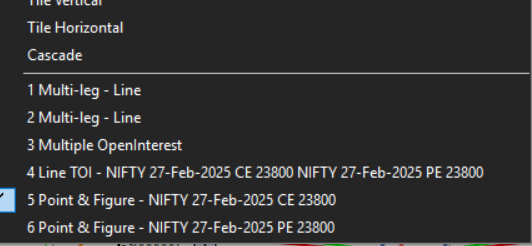
hello team give option to select and display choosen window -every time aall charts are not necessary to have on screen
#NIFTY-will history repeat again ?
in recent times tow times nifty has 4 consequtive negative monthly closing and now 3rd happen
in past first in 2015 when nifty down by 14.2% and rallied#17.7% in next 4 month
second time in 2023 it fell by 8.25% and rallied 13.13% in next 4 month
now again this happen with 7.49% loss with doji finger crossed now will history repeate over next 4 month with good recovery or not
#NIFTY #StockMarketIndia #seasonality #Patterns #analysis
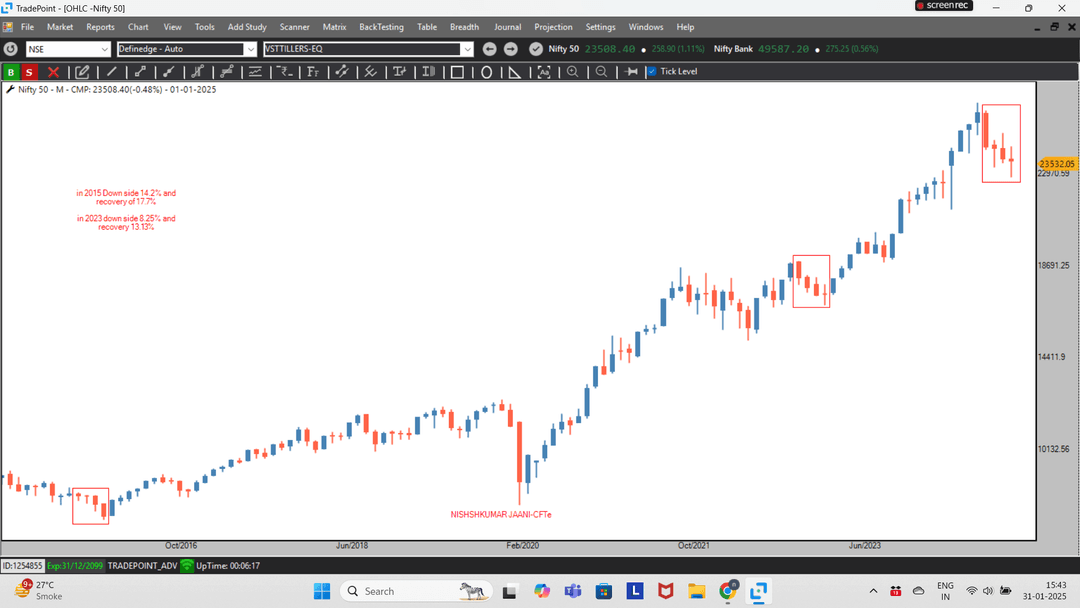
yes much needed even we need to add trendline also
kindly add BETA like ALPHA RS in lowerr panel that will help to understand the volatility pattern of the stock across market cycle and range that will help to select stcoks based on range
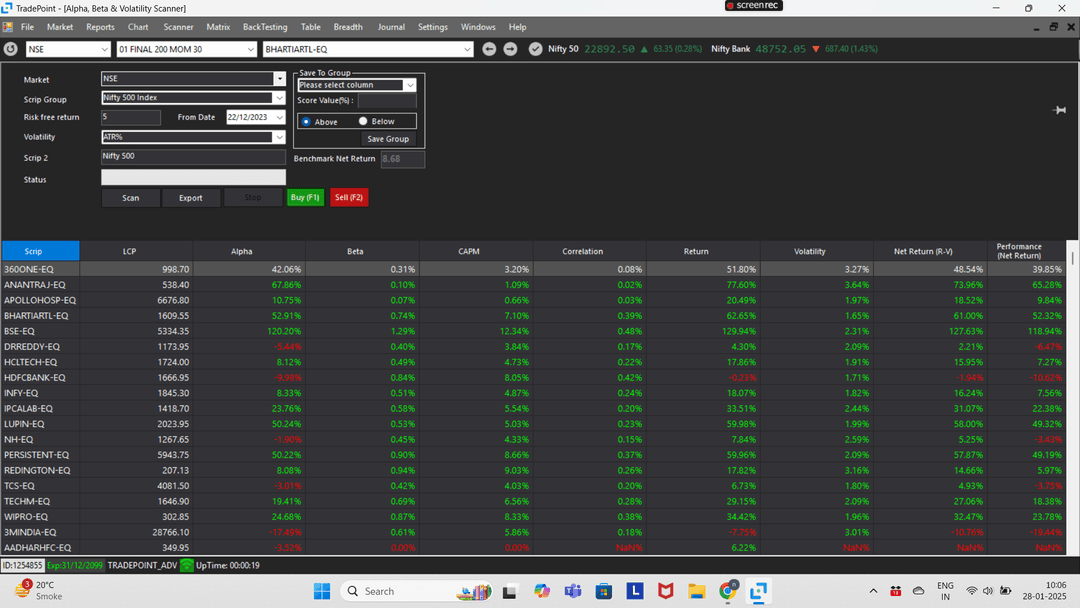
low beta or we need to define upper and lower barrier of beta so smooth re balanced happen ?
hello sir
lets say i am running a portfolio of bullish stock and on periodic basis i am re balancing keeping top 20 stock based on ultimate matrix ranking so my question is how much BETA of stock affect the rebalancing
Hello team in previous version of definedge desktop there was multileg chart option with plotting fu & option leg kindly add it back to see how my position is performing
Hello team in previous version of definedge desktop there was multileg chart option with plotting fu & option leg kindly add it back to see how my position is performing
Hello sir
kindly add or give option that only provide T Line -the idea is if somone is loking at larger picture based on weekly-monthly trend and wants to trade based on Trend that single line for long term will help to look back and if possible give scanner condition to back test
Thanks and Regards
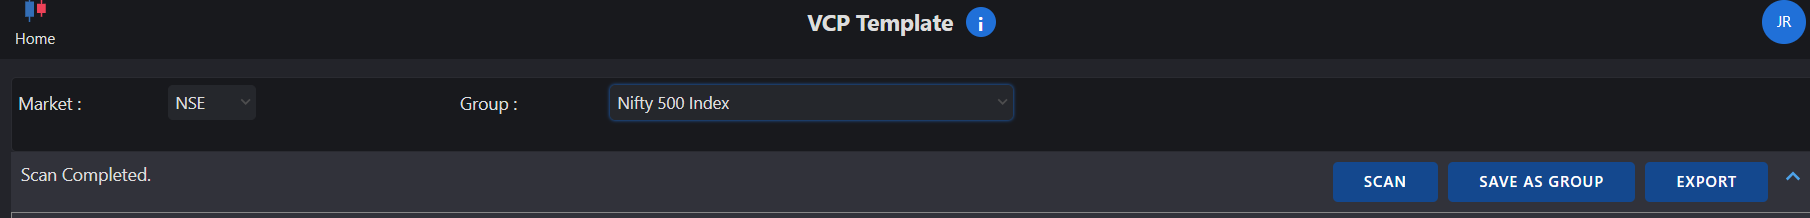
kindly add look back period on VCP templet that will help to back test and see how stock has in and out over period of time and one more rquest keep look back period mimum 5 year or higher that will help meaningful data
If the lower trendline hold and breakout above upper trendline could trigger nifty rally towards 29000
#Nifty50 #NSE #StockMarketIndia #analysis #candlestic #keepitsimple
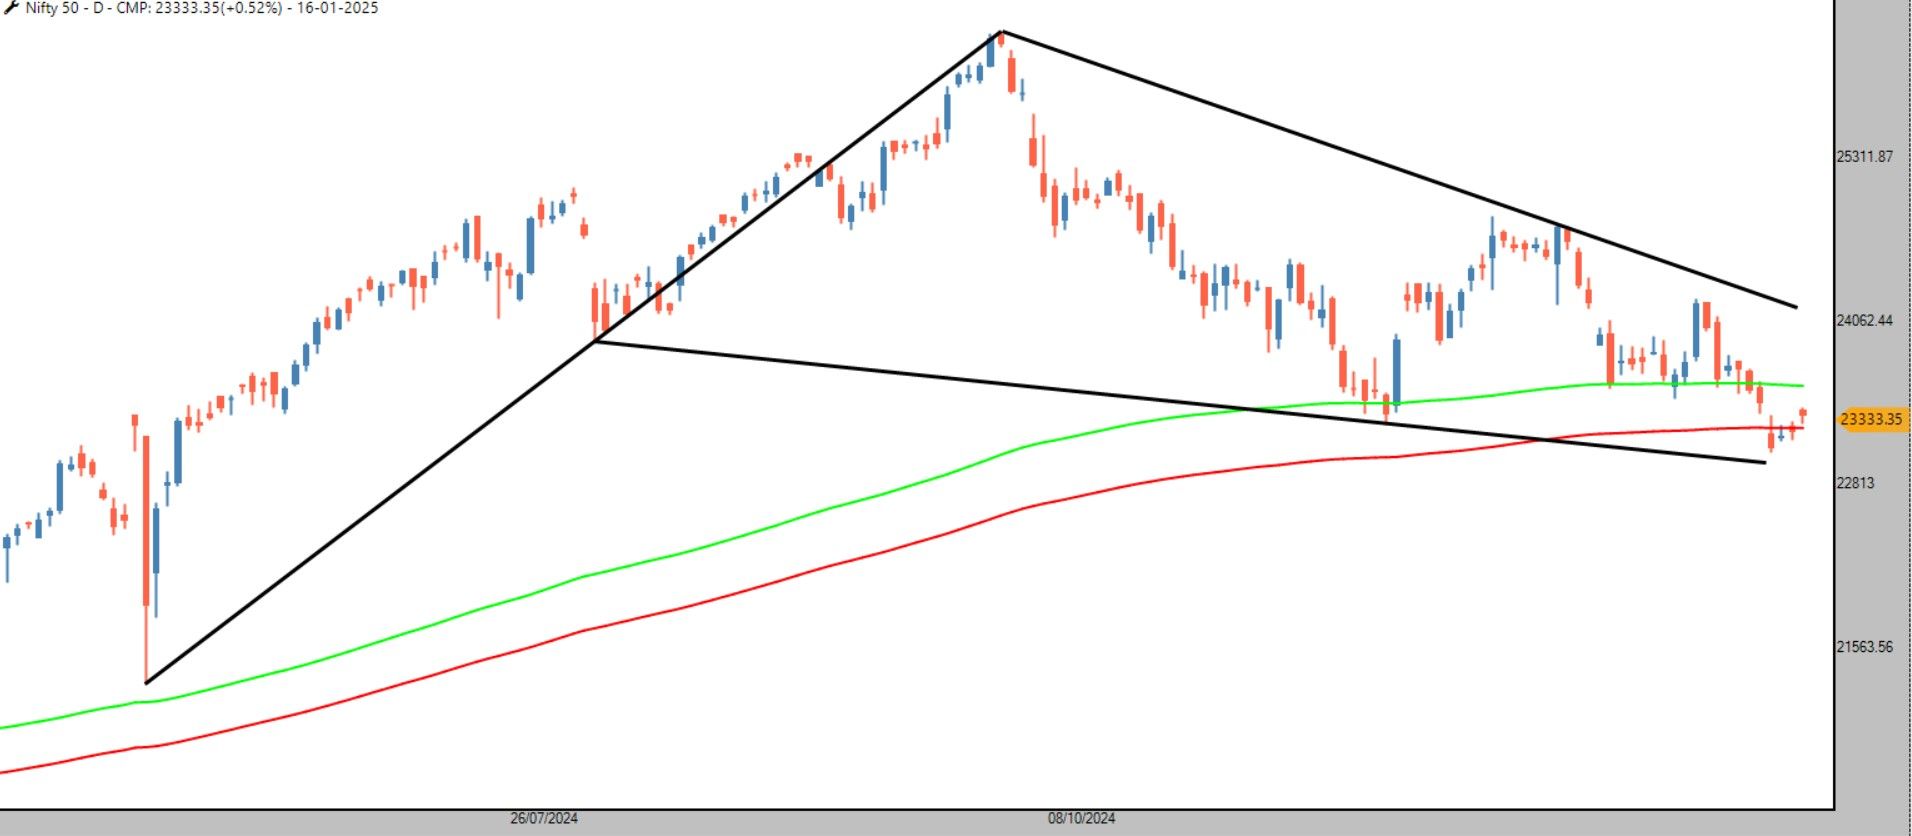
adequate divercified portoflio with proper position sizing (minimum 2%,maximum 5% allocation),follow backtestd model,follow proper entry exits,have diverified stock universe which gives good stocks -as every market will have both kind of stcoks up-down and expect old leaders will loose their leadership and new leaders will appear
End of Horny bull market ?
look at the chart setup DMI turned bearish and chart below MAST indicator
whenever this happen you will see
No strong positive momentum
Momentum Strategy will not work easily
Buy & Hold will not work
Easy system will not generate returns
Leverage/MTF will not have Favourable Time
High P/E & High leverage stock will be punished
Fundamentally strong/sustainable stock will show positive momentum
traders and investors lower down your expectations
Rate of Change-Speed of momentum will be slowdown
This phase is nothing new which has seen earlier this shall pass and new leaaders will emerge
at some point of time market will find buying intrest from value investors that will halt the fall -look for next strong sector-stocks- Find your setup-Follow charts-Have Proper Risk management & Position Sizing
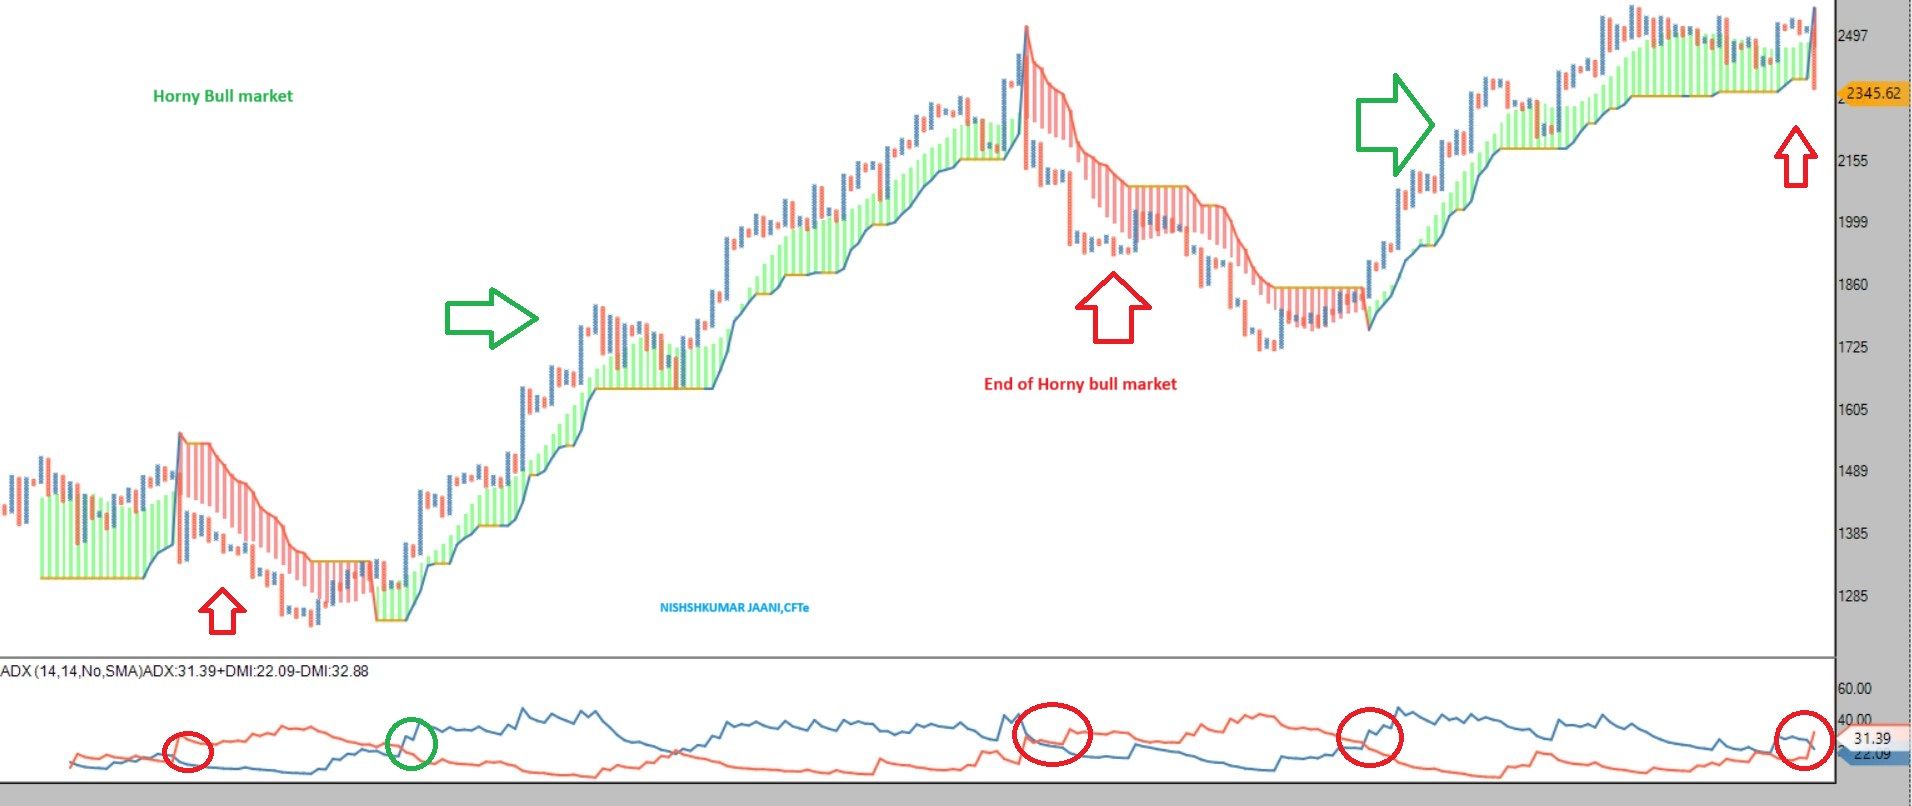
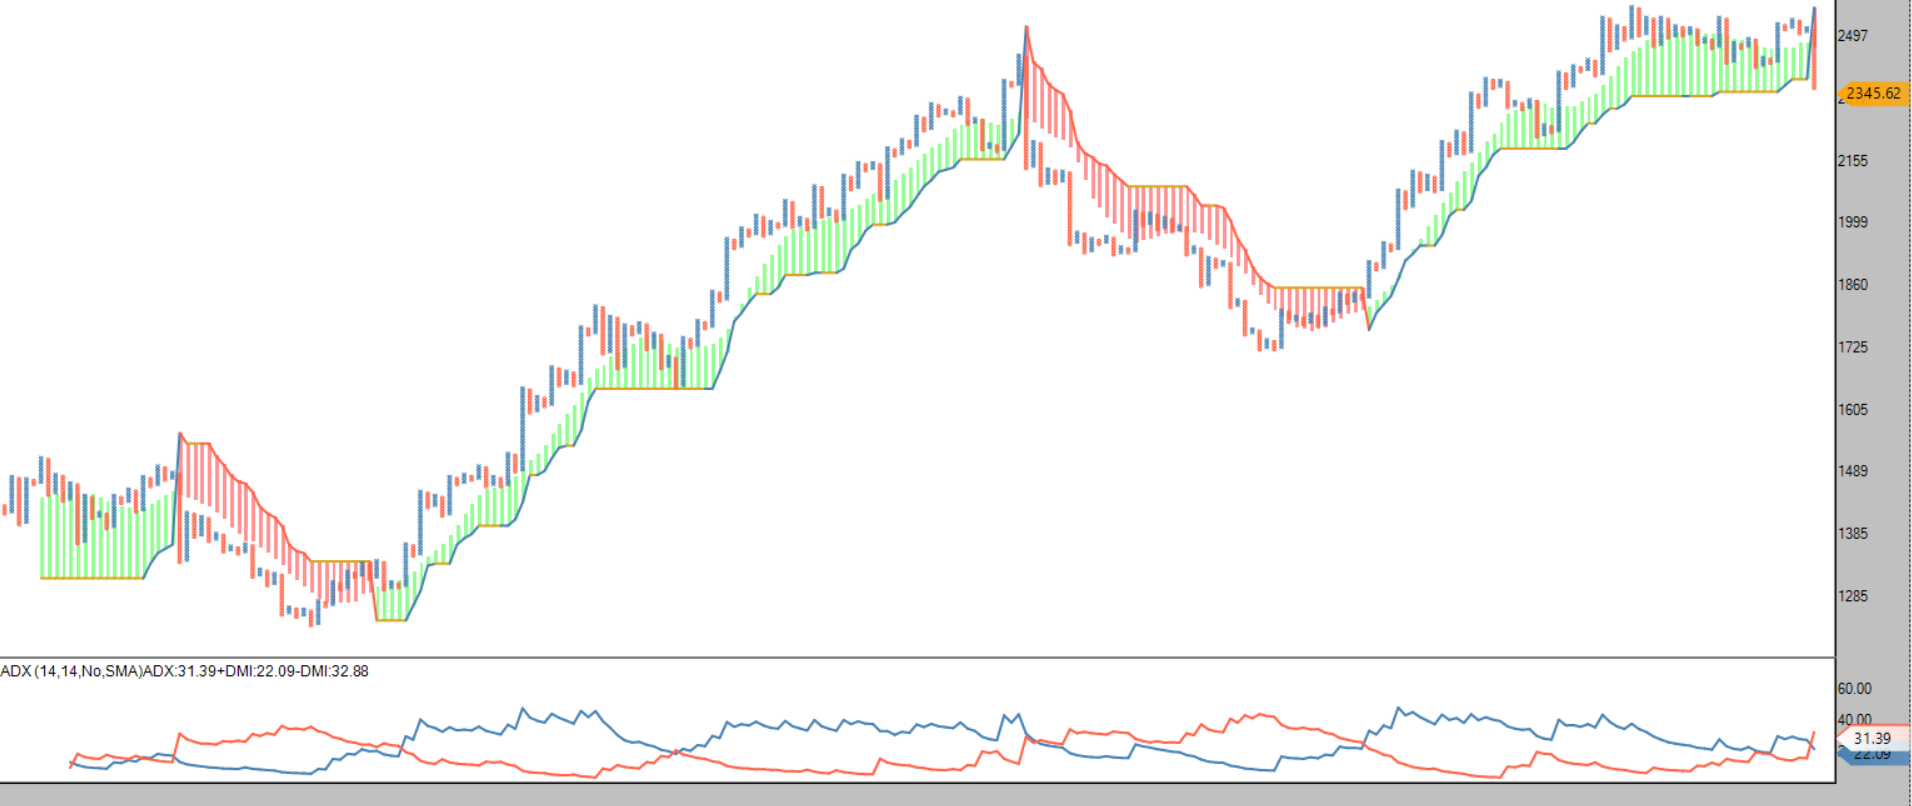
END OF HORNY BULL MARKET
Death of Long only Momentum Portfolio Strategy ?
when the levels is above Super trend with positive DMI it is best time to ride the long only momentum portfolio strategy
now we are at last stage confirmation DMI has turned negative and waiting for it to fall below super trend and break of bullish trendline
if this happen expect further Time and Price wise correction and in this scenerio long only momentum portfolio strategy will face rough periods
the easy money era will be over but yes in every phase select seectors and stocks which have negative correlation will shine well like IT-PHARMA and up to certain extend PVT banks can relatively outperform and help market to stablelize
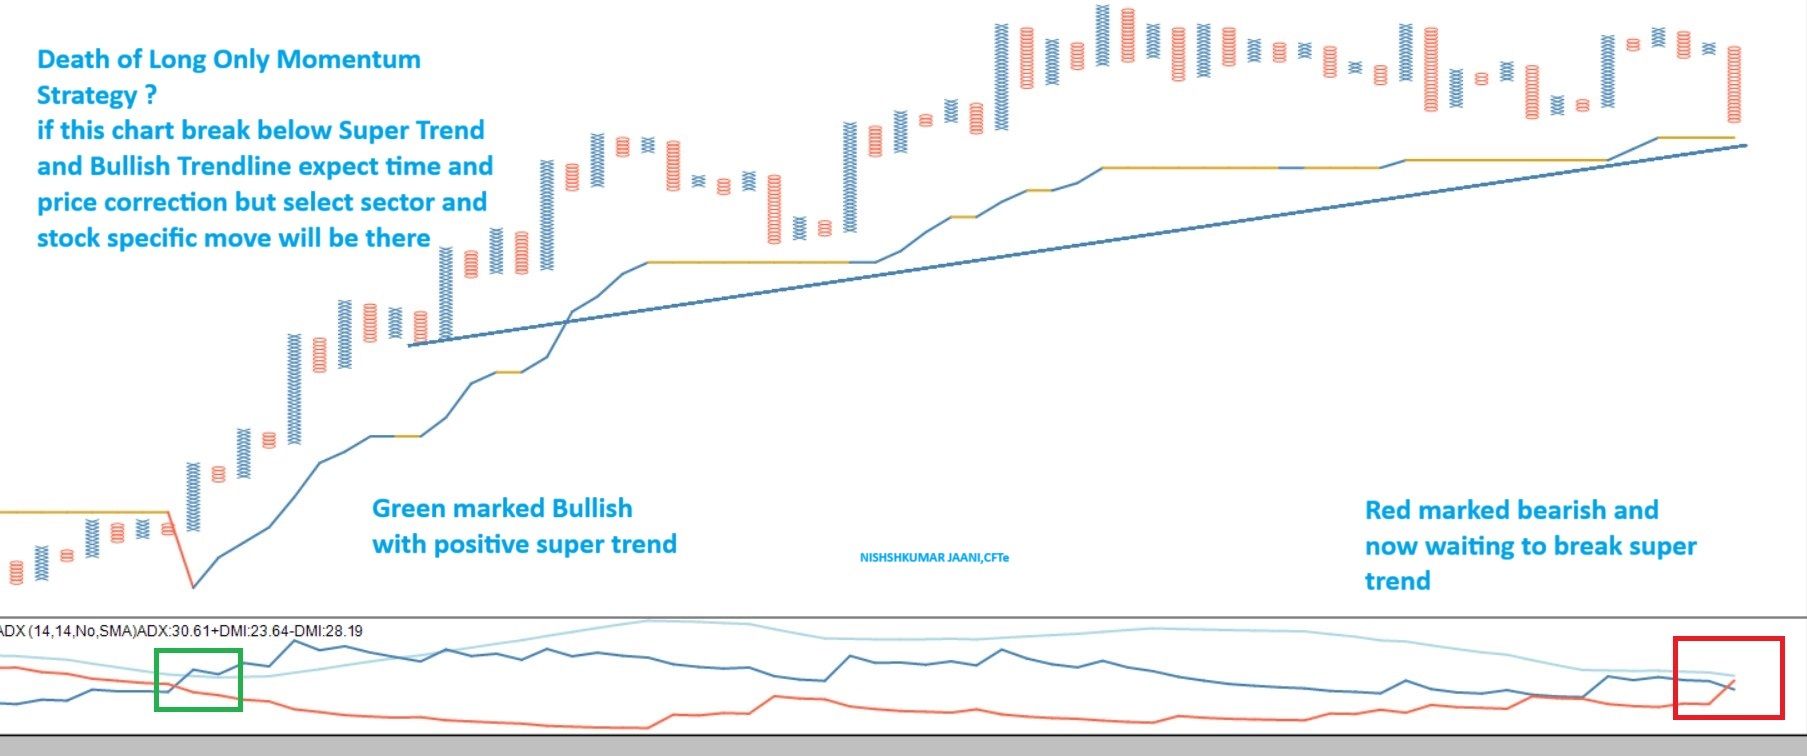
NIFTY 50 Fractle to lead all time high ?
Marked trendline with yellow box if hold 23500-23200 support zone and breakout from upper trendline will repeat fractle and possible to new all time high
#Nifty50 #analysis #StockMarketIndia #candlestic #charts #nse
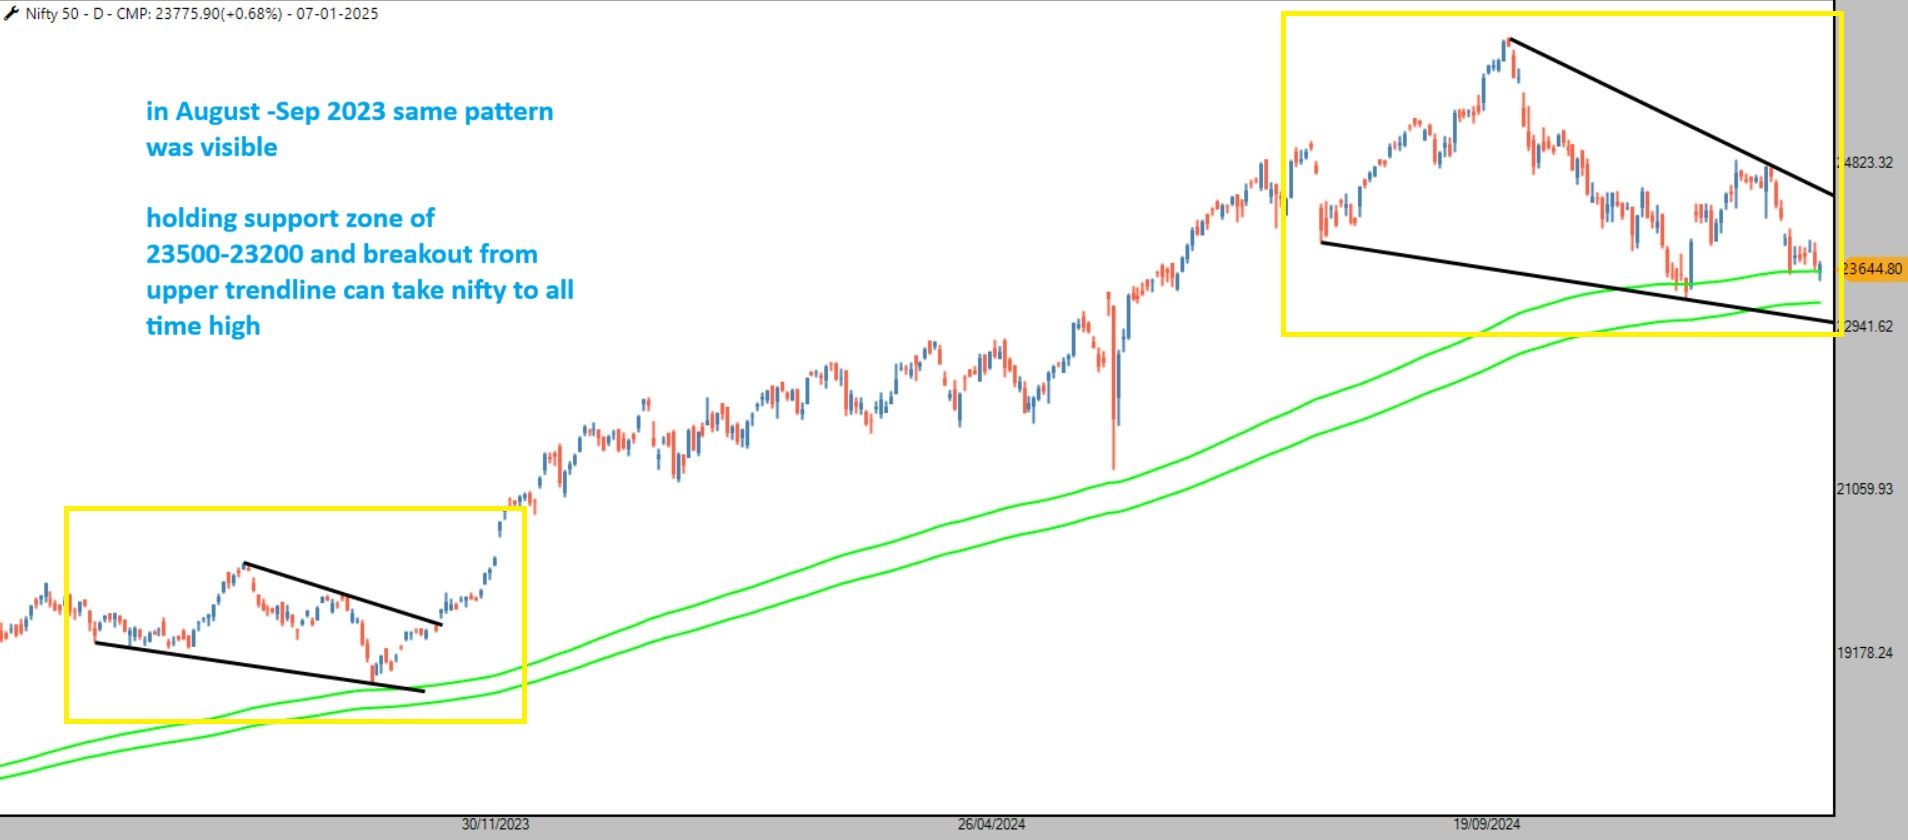
NIFTY 50
Support zone 23500-23200
Breakout from black trendline will be trending moves
#Nifty50 #analysis #StockMarketIndia #candlestic #charts #nse
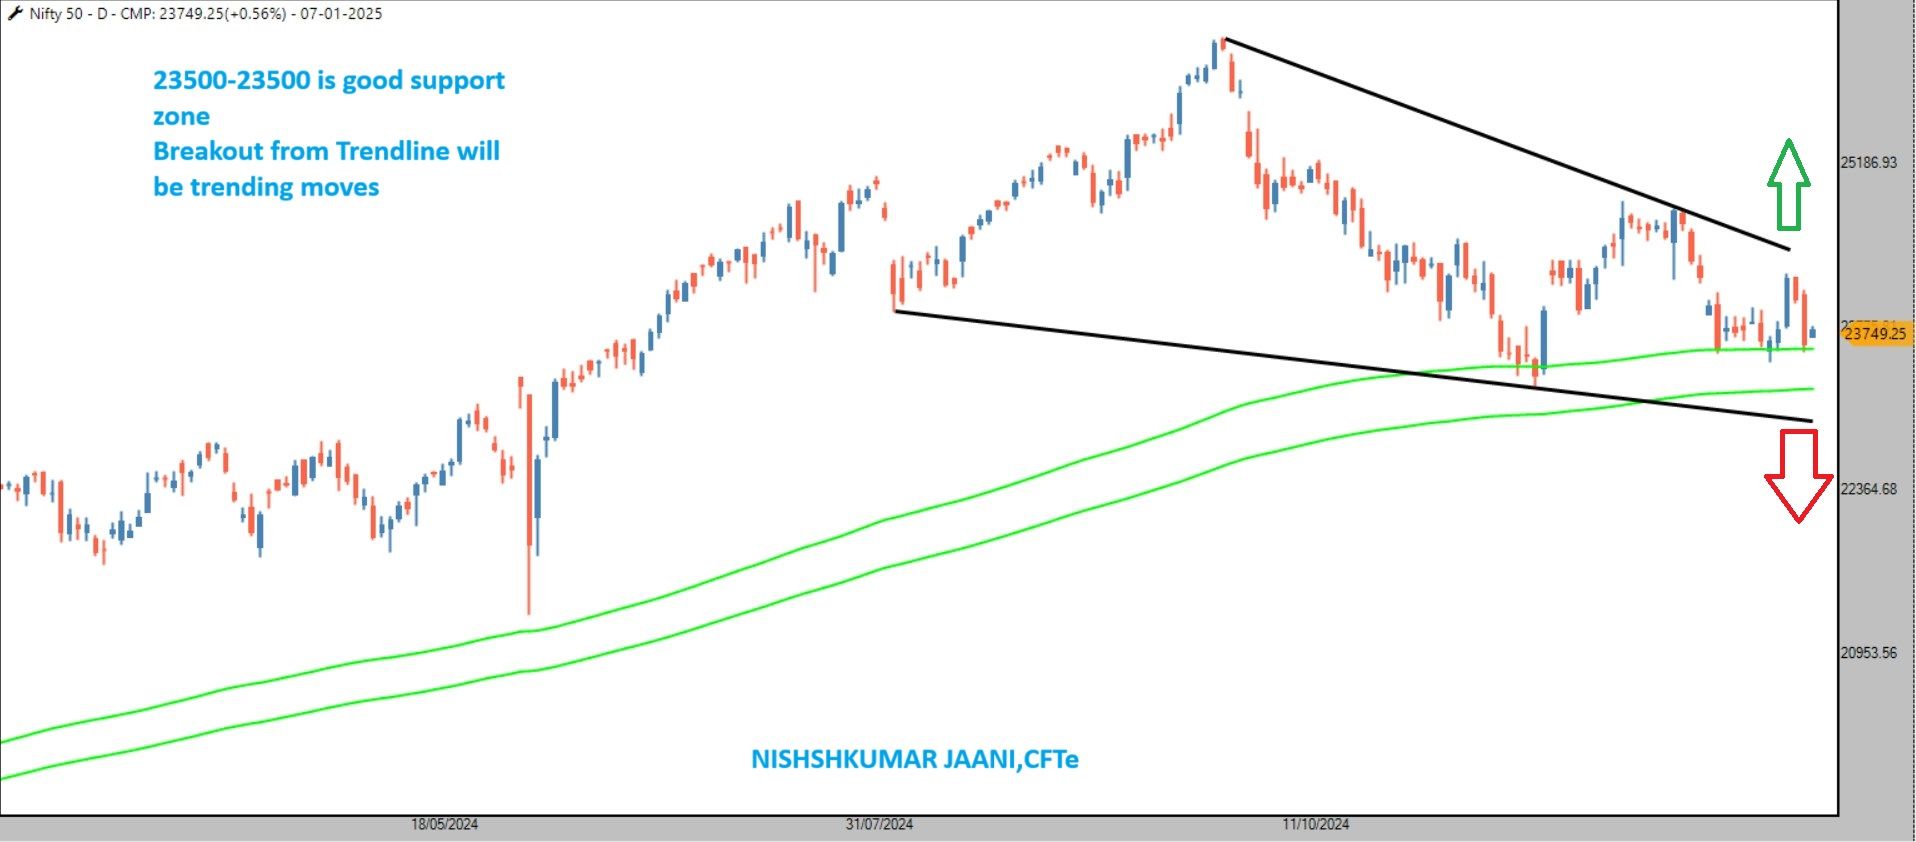
Bullish ABC
SL 401 on closing basis
Target 490
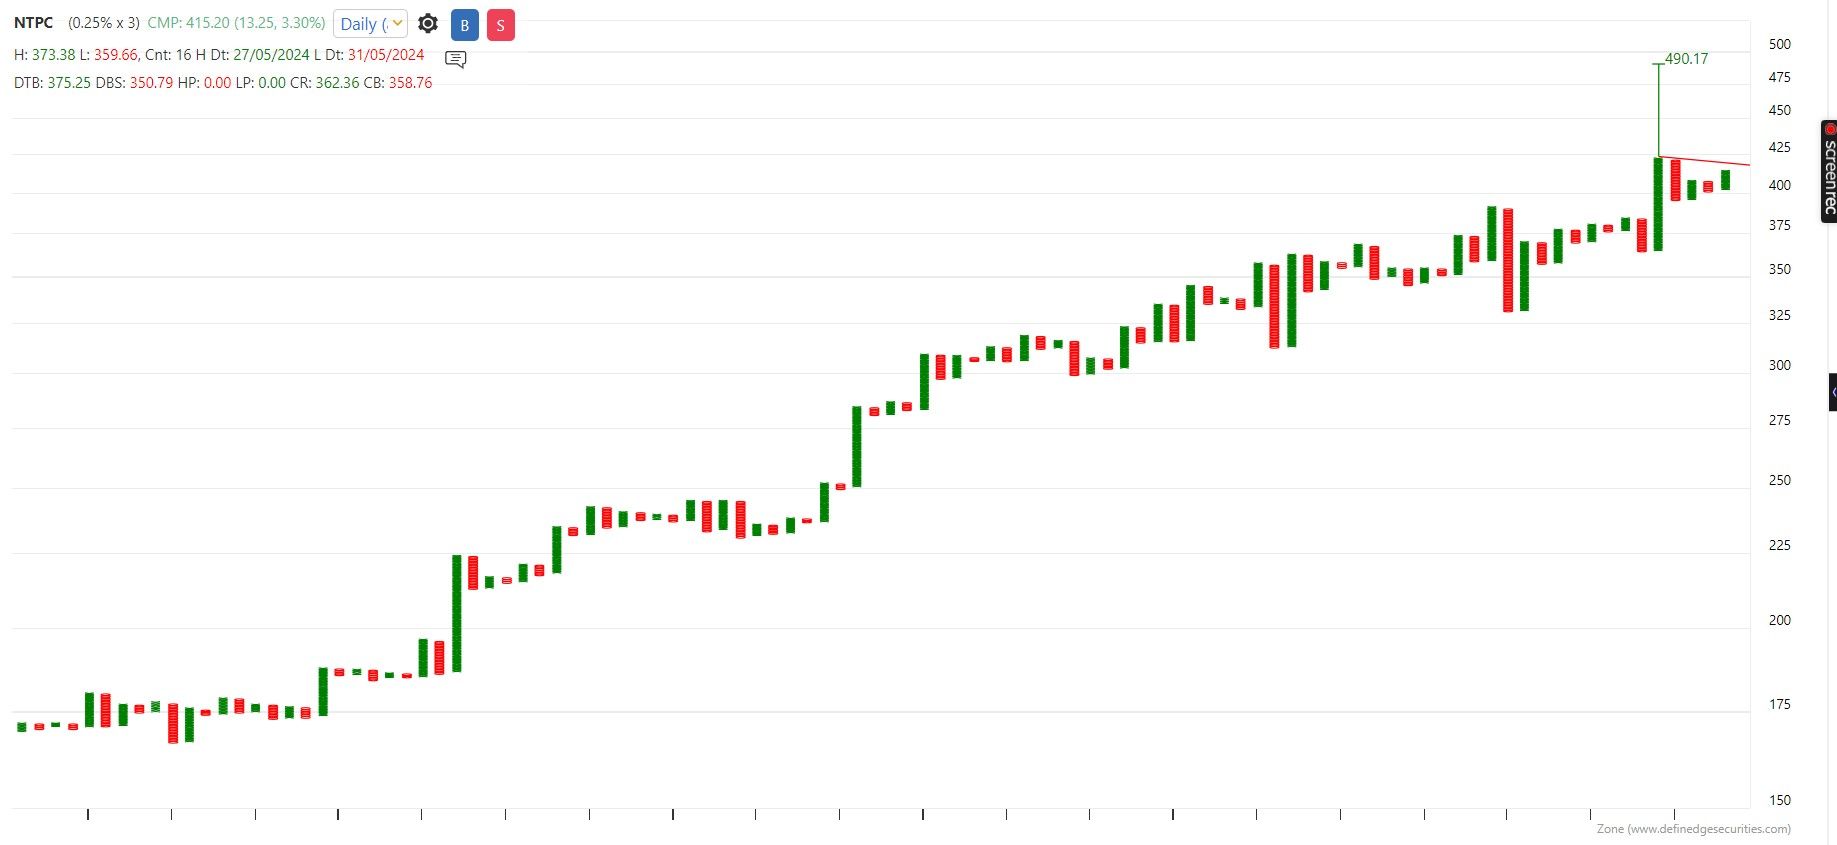
Bullish ABC Breakout
SL 12246 on closing basis
Target 17874
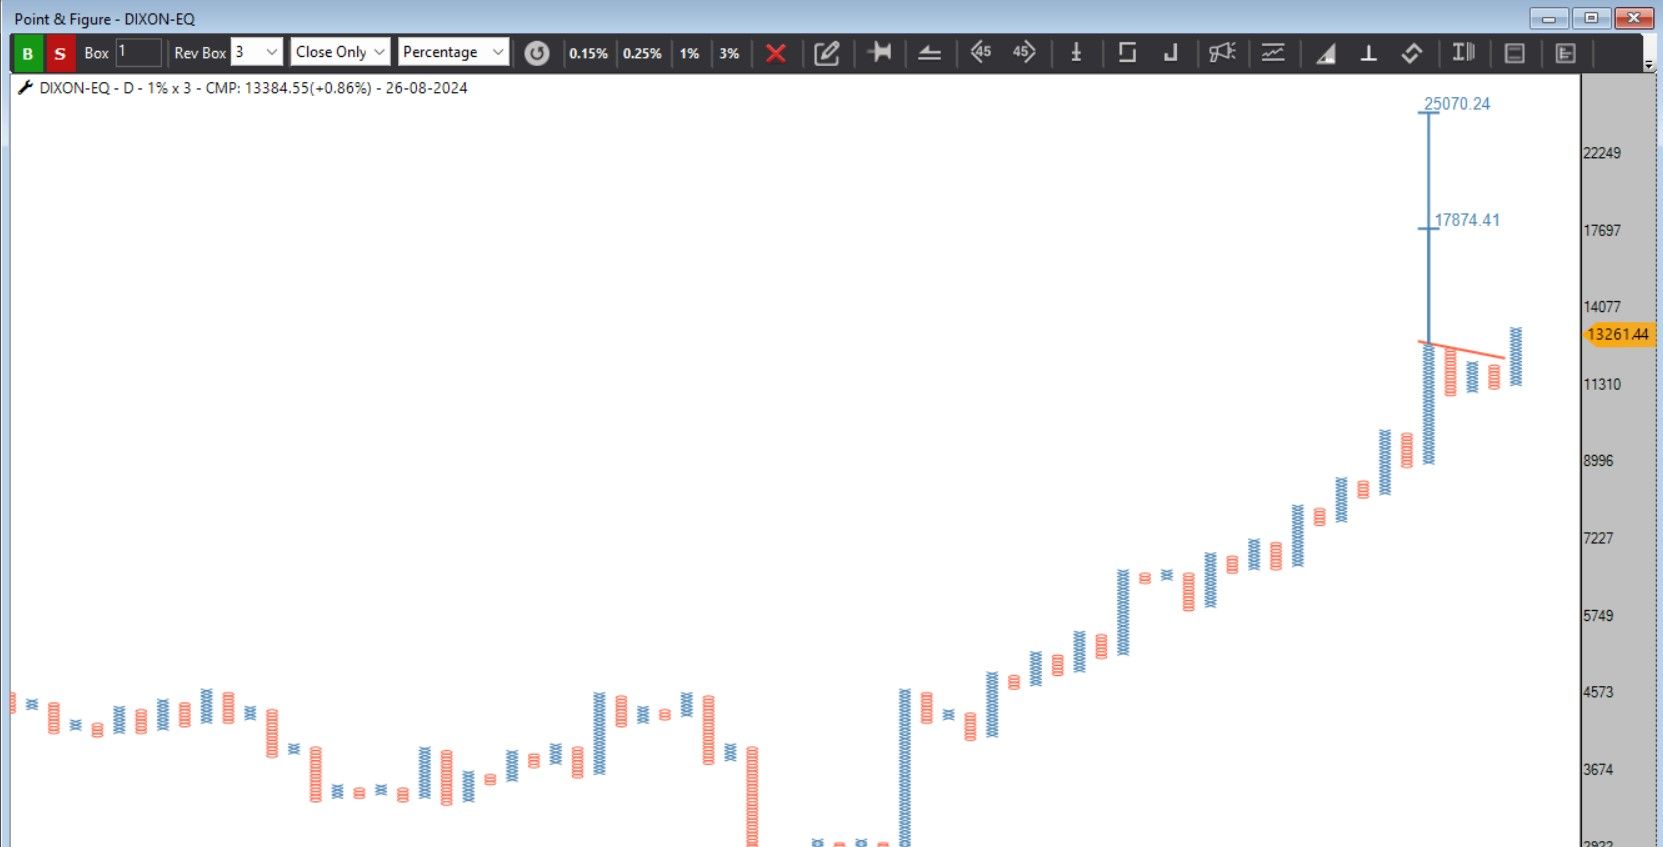
Turtle Bullish Breakout
SL 2836 on closing basis for 3900
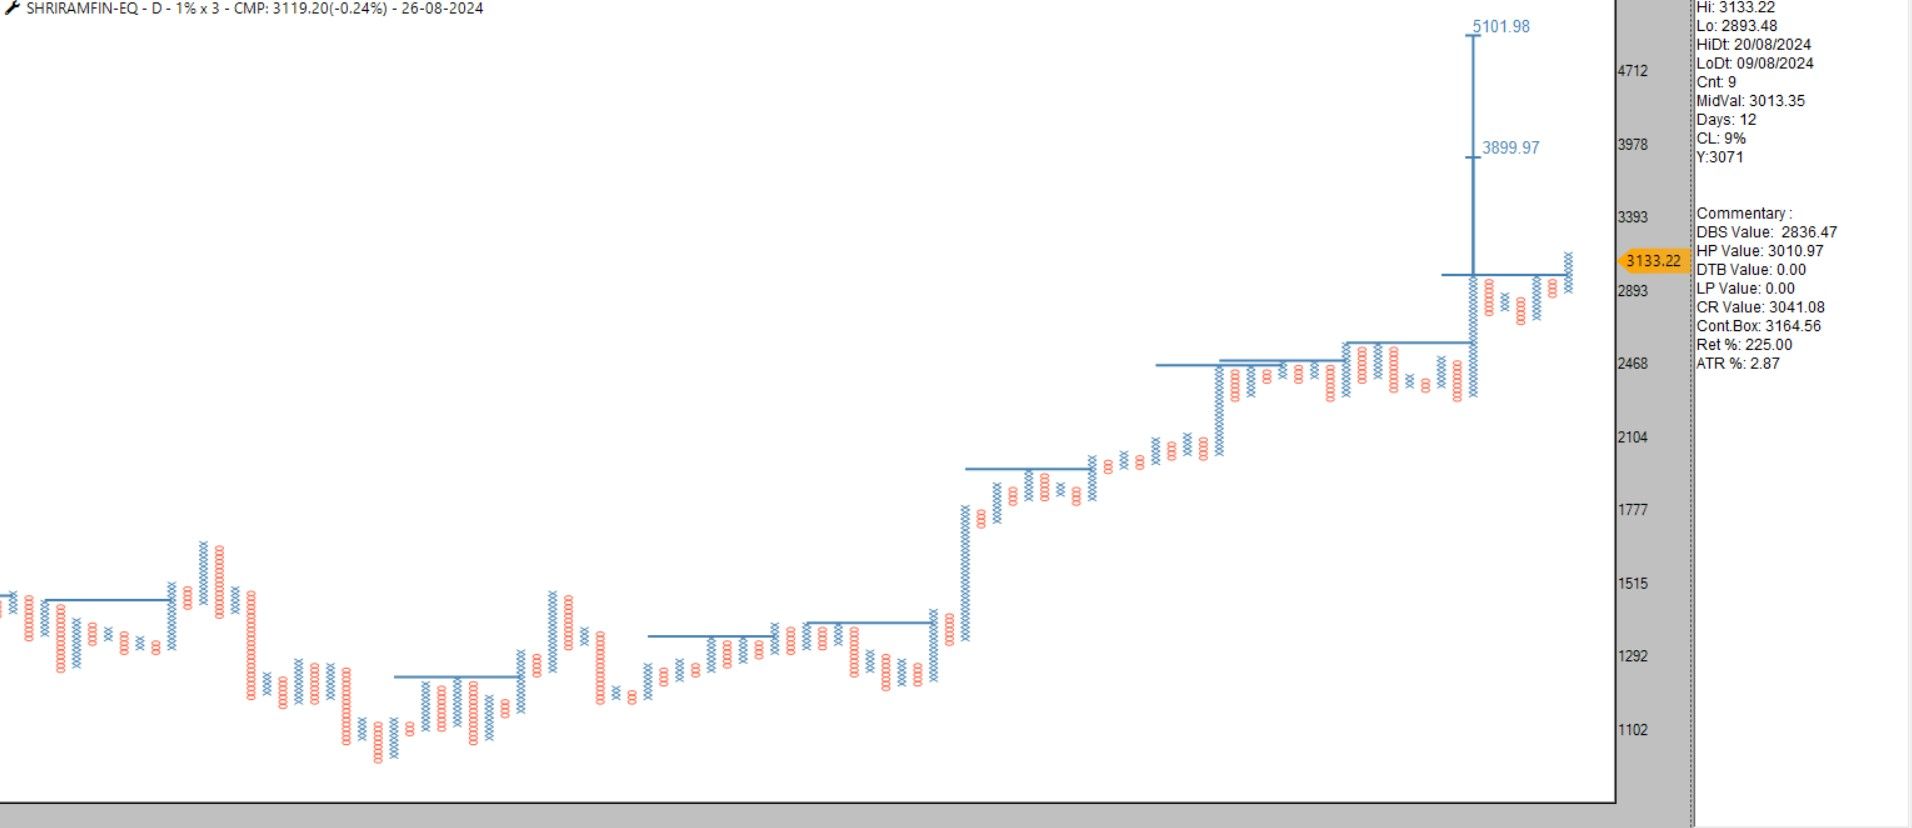
Close above 588 will trigger Bullish ABC can move to 885 with stop loss of 538 on closing basis
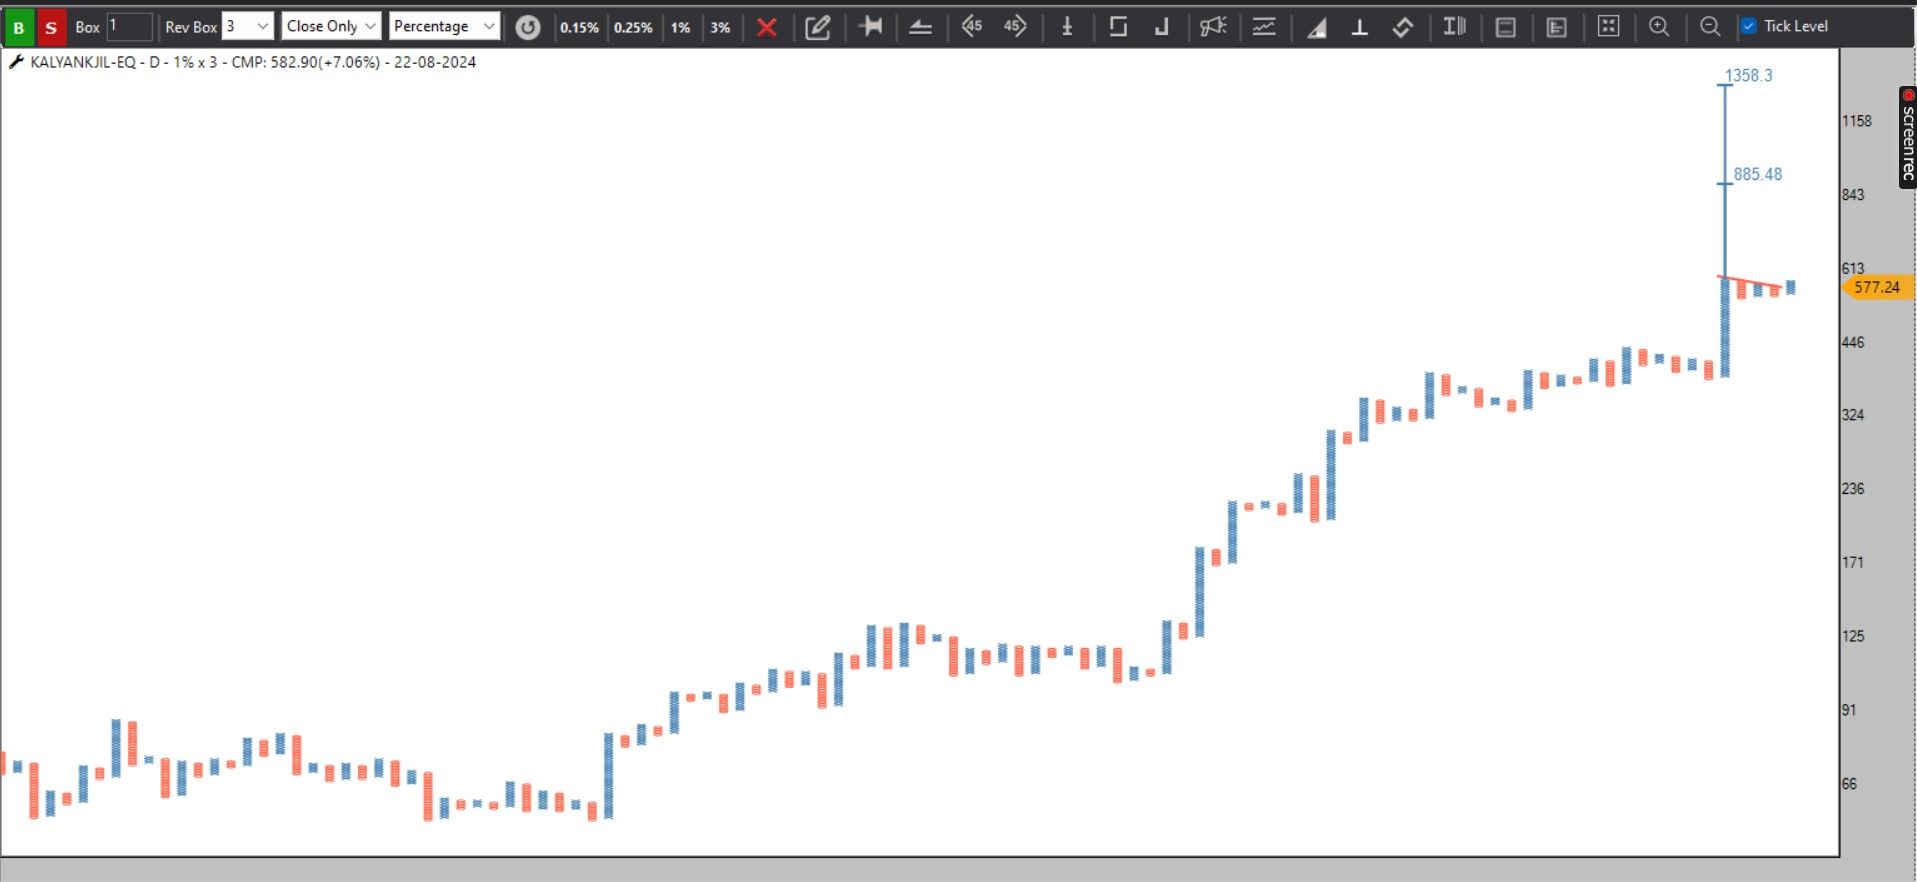
hello @Definedge @@Definedge-Experts
kindly add sum chart in P&F FUSION MATRIX SCANNER
Thanks and Regards
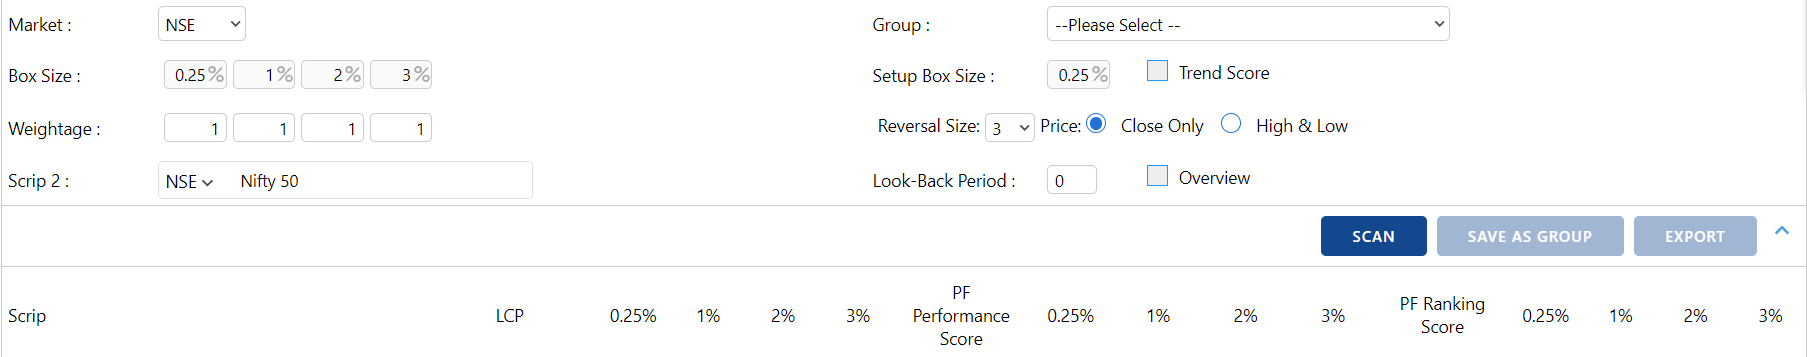
@Prashant-Shah sir @Definedge @@Definedge-Experts
in back test report please add two more function
1-Buy and hold return for the backtested period
2-cummelative return of the strategy for back test period
that two figure will help weather to execute the strategy or not as by doing all the backtest and finding good strategy at the end if the strategy is not able to bear the buy and hold approach its not good partucular index and mutual funds strategy
Thanks And Regards
NISHSHKUMAR JAANI
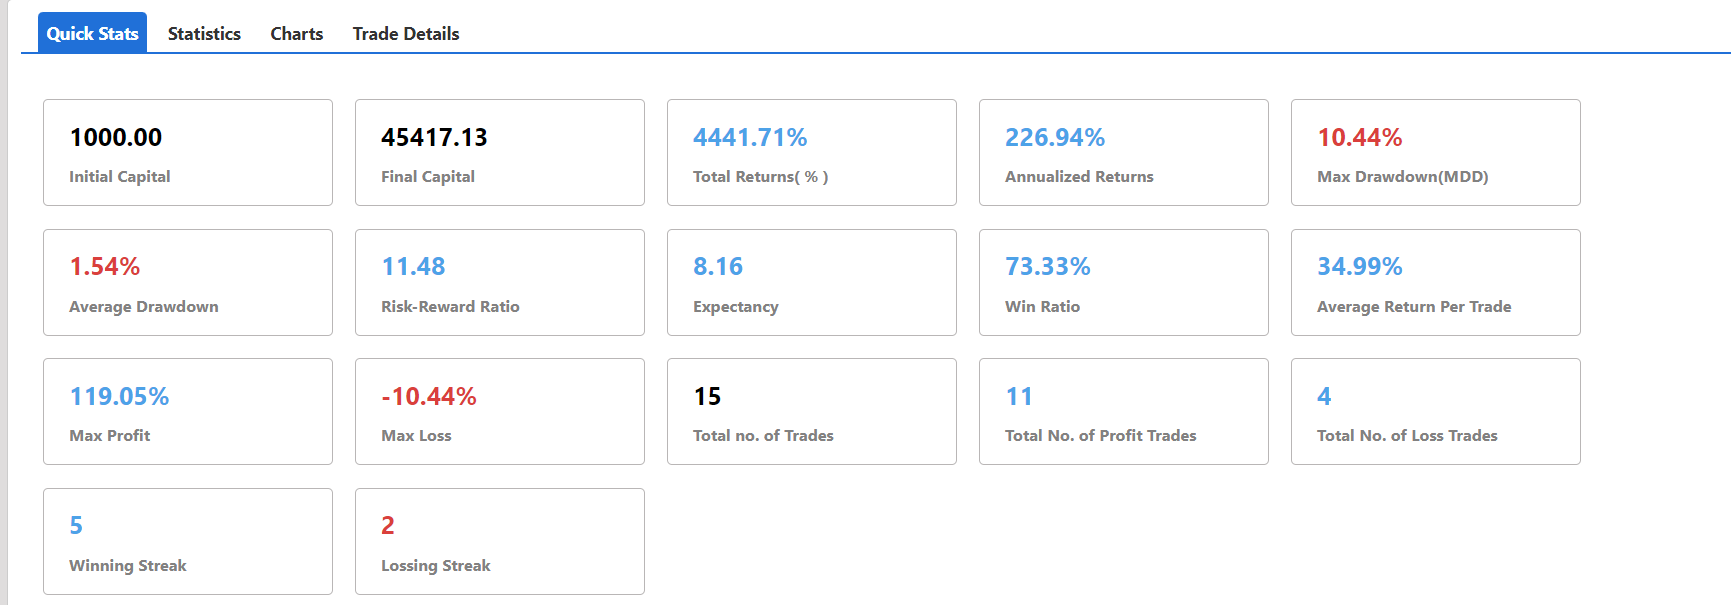
Hello @Prashant-Shah sir
team @Definedge @@Definedge-Experts
kindly add Dynamic Ultimate Matrix in Desktop version also -> all my scanning is done on desktop and need further ranking i need to take all the data to zone to scan that is time consuming so it will be batter to have on dekstop also
Thanks and Regards
@Prashant-Shah @@Definedge-Experts
can we have Congestion index in our softwares and with condition to back test ?
That will help to lot of traders where to apply trend following and mean reverting trading style
CONGESTION INDEX
Market movements can be characterized by two distinct types or phases. In the first, the market shows trending movements which have a directional bias over a period of time. The second type of market behavior is periodic or cyclic motion, where the market shows no consistent directional bias and trades between two levels. This type of market results in the failure of trend-following indicators and the success of overbought/oversold oscillators. Both phases of the market require the use of different types of indicator. Trending markets need trend-following indicators such as moving averages, moving average convergence/divergence (MACD), and so on. Trading range markets need oscillators such as the relative strength index (RSI) and stochastics, which use overbought and oversold levels. The age-old problem for many trading systems is their inability to determine if a trending or trading range market is at hand. Trend-following indicators, such as the MACD or moving averages, tend to be whipsawed as markets enter a nontrending congestion phase. On the other hand, oscillators (which work well during trading range markets) are often too early to buy or sell in a trending market. Thus, identifying the market phase and selecting the appropriate indicators is critical to a system’s success. The congestion index attempts to identify the market’s character by dividing the actual percentage that the market has changed in the past x days by the extreme range according to the following formula:
Readings between+20 and−20indicate congestion or oscillating mode. Crossing over the 20 line from below indicates the start of a rising trend. Conversely, the start of a down turn is indicated by crossing under−20 from above. The CI can also be used as an overbought/oversold oscillator.
It was taken from İntermarket Trading Strategies book of by Markos Katsanos.Read the book.
Hello @Prashant-Shah sir @Definedge @@Definedge-Experts
please add scanning condition like P&F score of 2 & 1 in Renko bullish continuation and when in retracement
P&F we have Easy DTB continuation and when goes into Bullish retracements it immediately removed from DTB condition even DBS is not active
same kind of scanning condition or give matrix like P&F Fusion matrix
attaching charts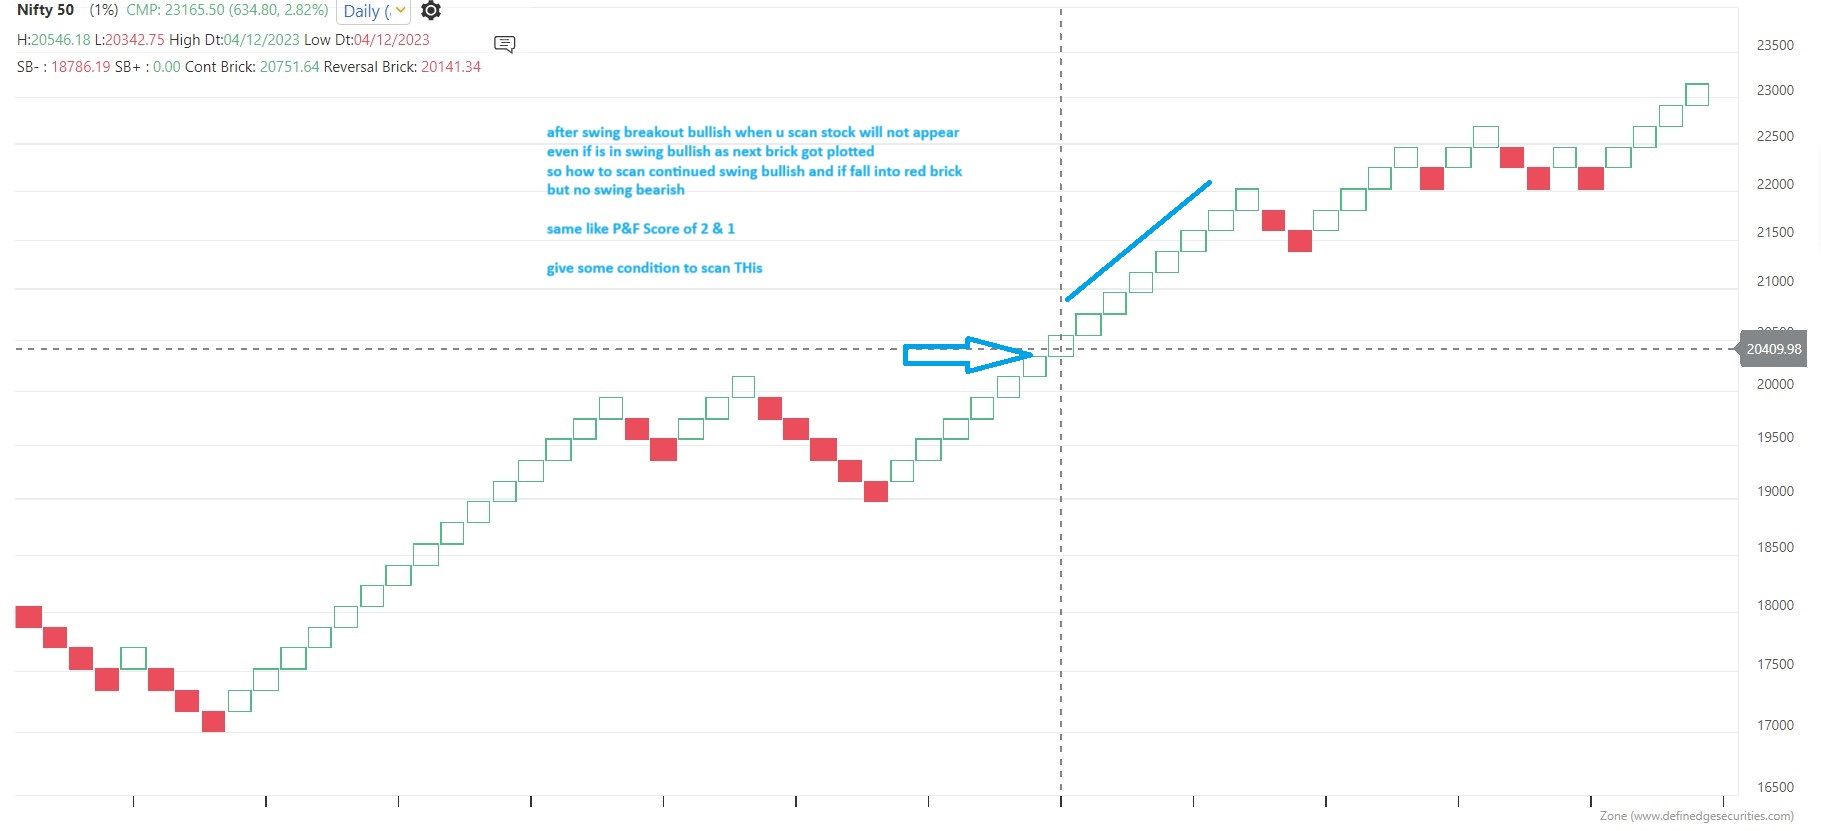
in trade point desktop version ther is available but i need to work in Mutual funds

@Prashant-Shah sir @@Definedge-Experts @Definedge
few months back there was SUM chart option along with RS in P&F + RENKO charts
please enable it
currently to plot i have to run scanner

INDIA VIX P&F Analysis
Before COVID 19 it breakout from T-20 pattern and all the way hit 82.3
Now before election it breakout from Super Pattern and its target is 82.3 which is called cluster count
Negation of pattern will be when it close below 19.79
Dara nahi rahe dikha rahe hai
#AhmedabadNest #india #vix #greed #fear #index #analysis #nseindia #stockmarket
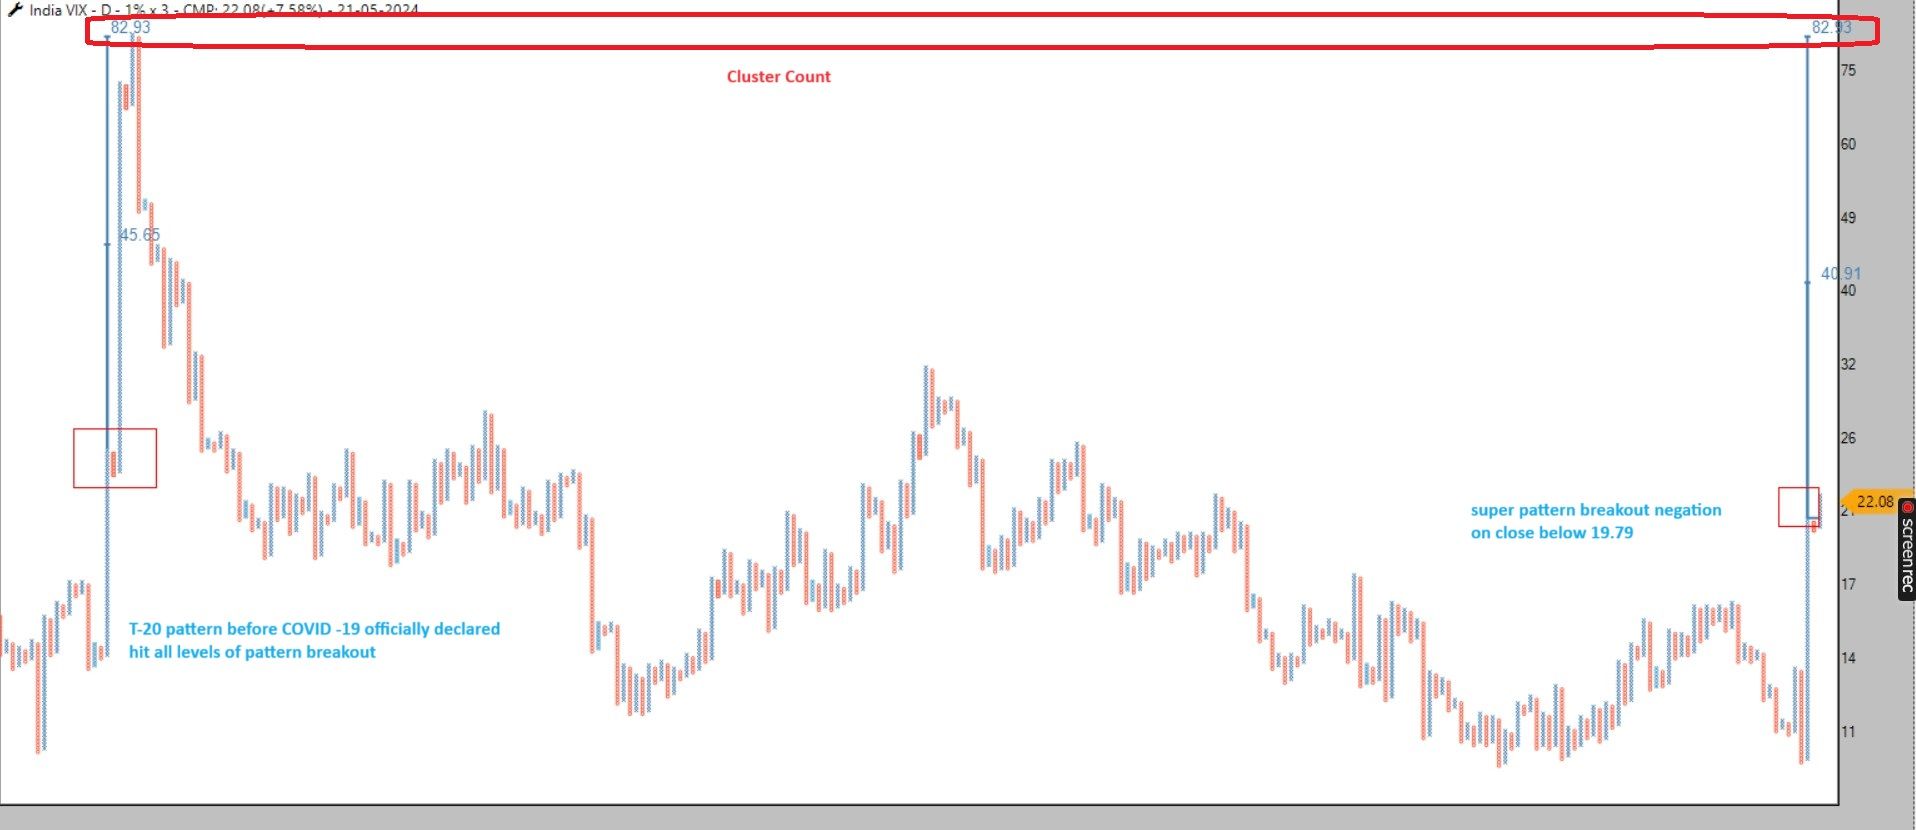
GOLDBEES
Super Pattern Breakout
SL 59.72 on closing basis for 74.33
Good RR
#AhmedabadNest #gold #goldbees #pattern #breakout #nse #stockmarket #india
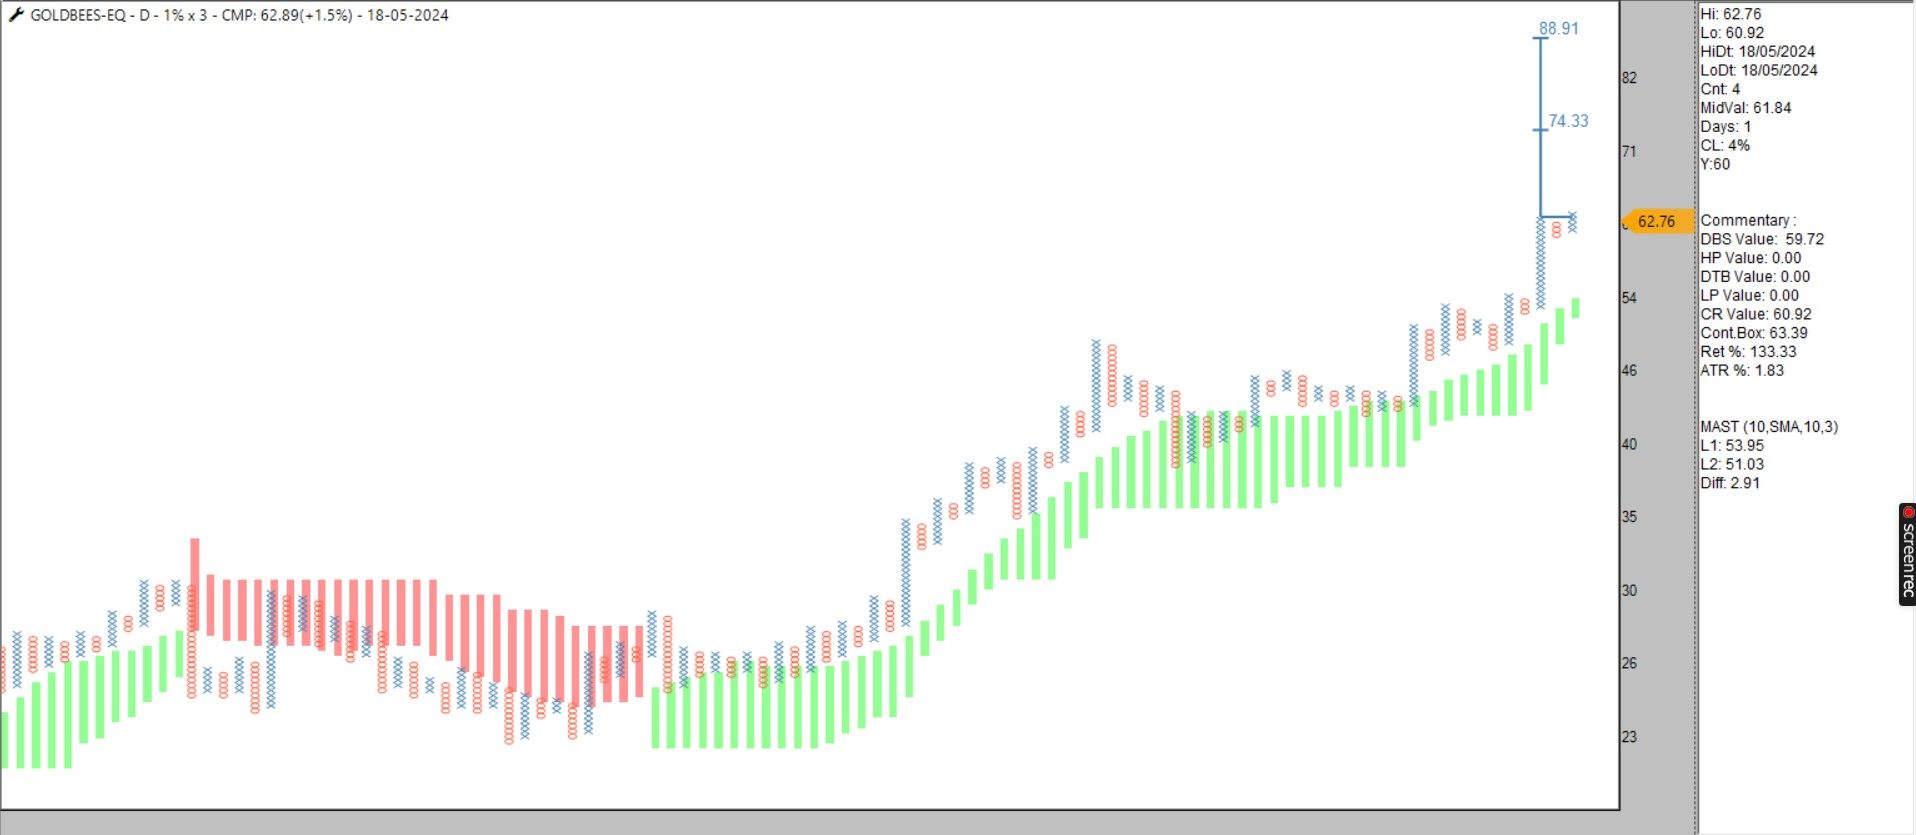
GOLDBEES/NIFTY 500 Pattern update
look at the weekly chart its forming Inv Head and shoulder pattern confirmation on close and follow thru above 93 currently stand at 90
if happen expecting major out performance of Gold since long time i am advocating allocation to gold
if pattern breakout will have good momentum
#AhmedabadNest #gold #nseindia #stockmarket #pattern #analysis #rotation #breakout
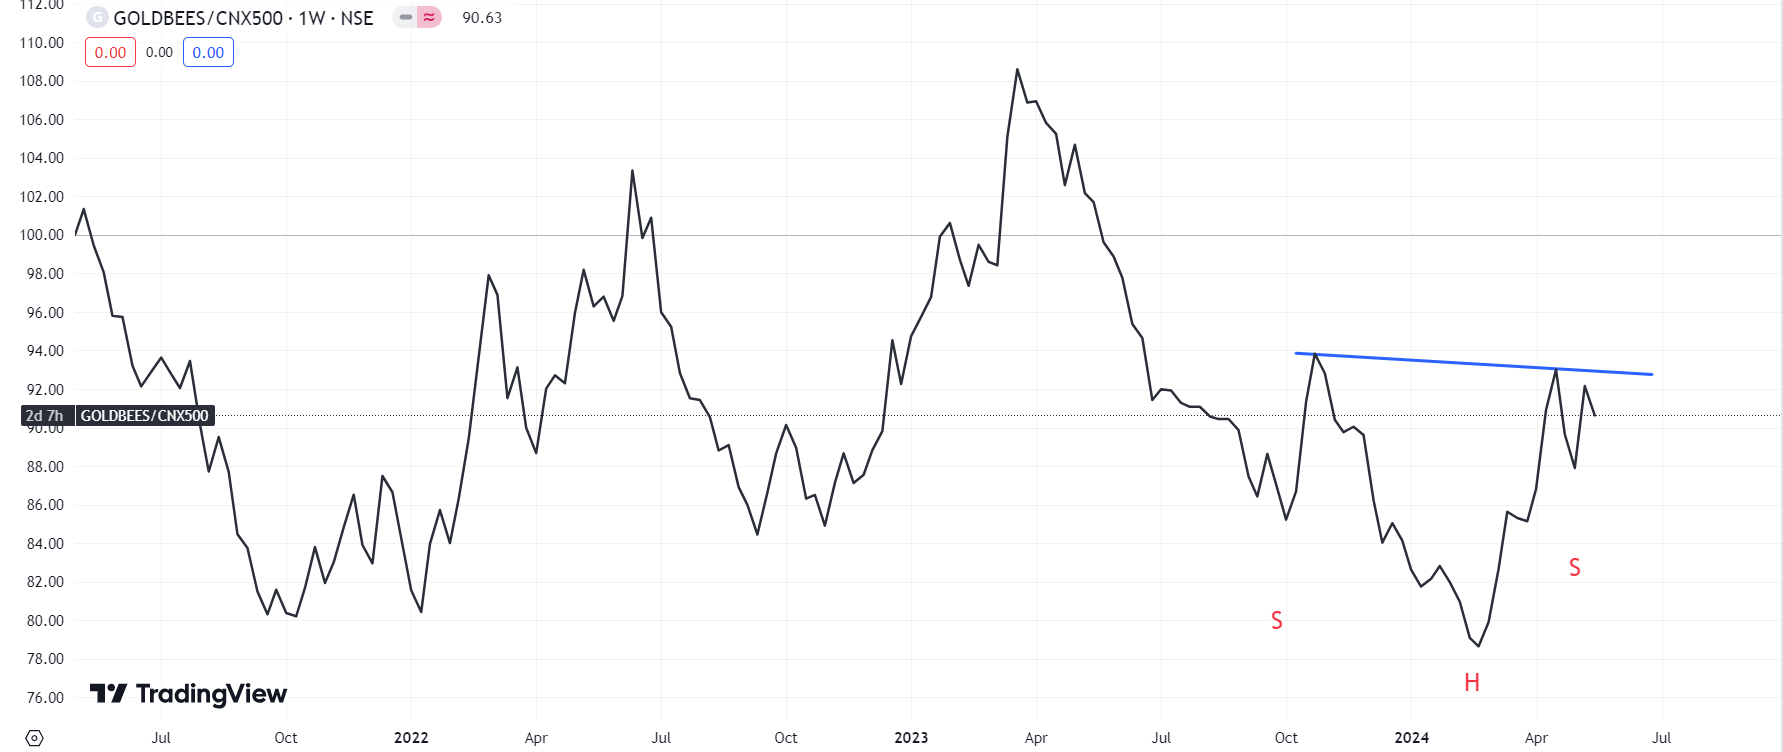
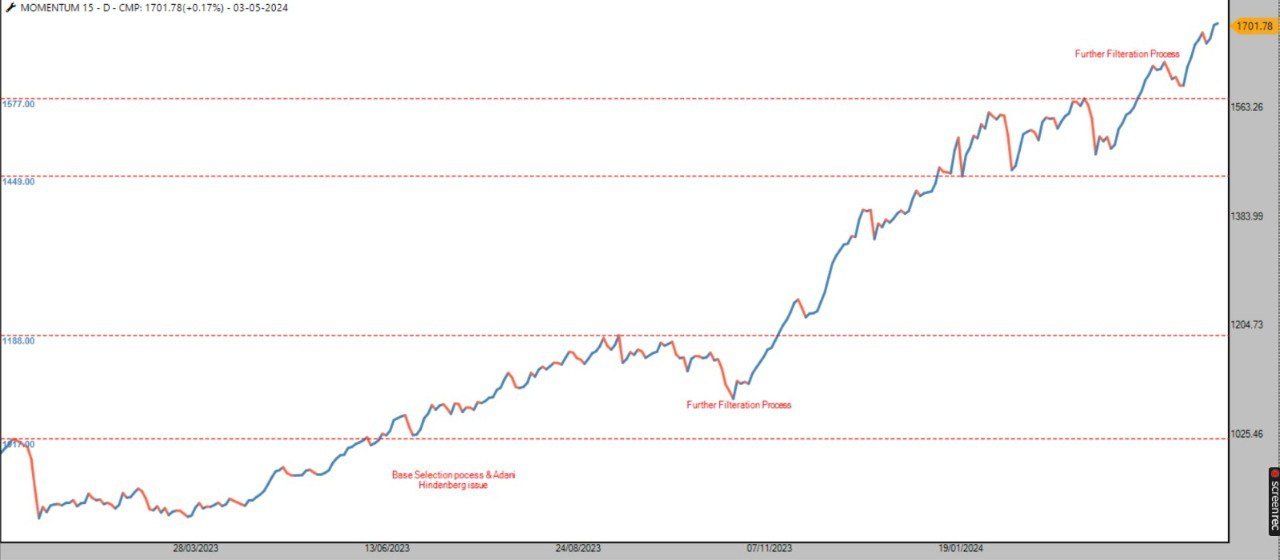
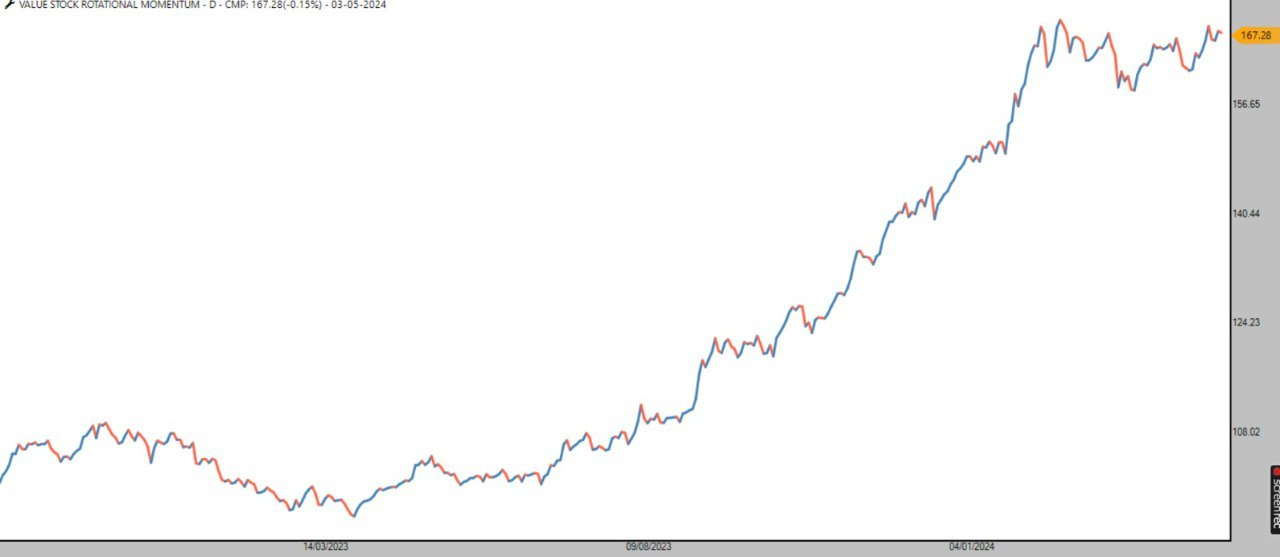
see both charts which is of my own index /equity curve of my strategy
Good Morning
@Prashant-Shah sir @Definedge @@Definedge-Experts
In the zone i can select any denominator from any segment like
stock/mutual fund
in Desk top kindly add this one also like i can add denominator from my market selected data as i maitain my own index so would like to plot various RS charts and Run fusion matrix by selecting denominator from my market which is out perfoming many broad based index like nifty 500
Thanks and Regards
Good Morning
@Prashant-Shah sir @Definedge @@Definedge-Experts @AP sir
make Table where every security shows MAX OI just by clicking only select all F&O stocks/index wise or selected stock wise with desired expiry
Thanks and Regards
Nifty Spot
Trendlines + Probable H&S Top Pattern
Confirmation below 21700 only but right now looking at Rise of VIX & Divergences probable Right shoulder top has been formed
below 21700 and drag below 21000
#nifty #pattern #StockMarket #analysis #nseindia
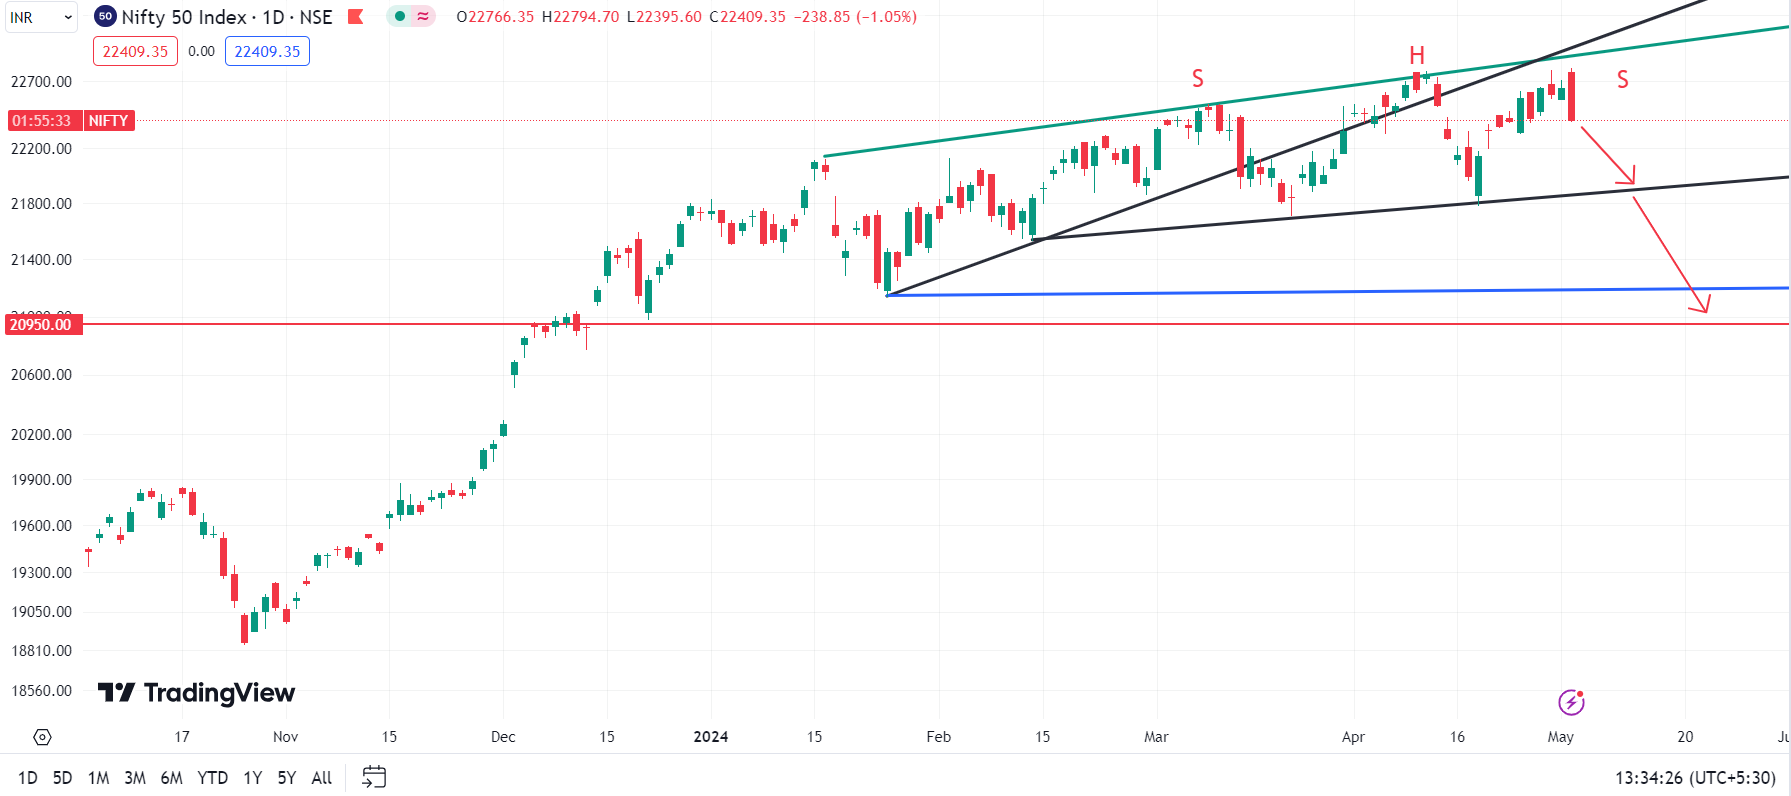
Hello @Prashant-Shah sir team @Definedge @@Definedge-Experts
Long pending request by when we will have Renko fusion matrix ?
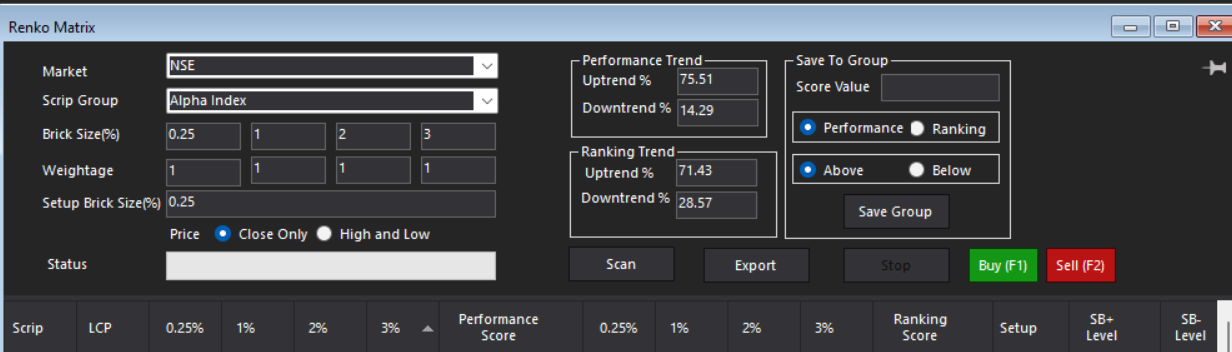
various stat is missing like in segment wise P&L insight various data points
#ipcalab
T-20 Pattern breakout
CMP 1338 SL 1102 On closing Basis Target 2241
Good RR
#AhmedabadNest #stock #analysis #StockMarket #India #NSE #quality
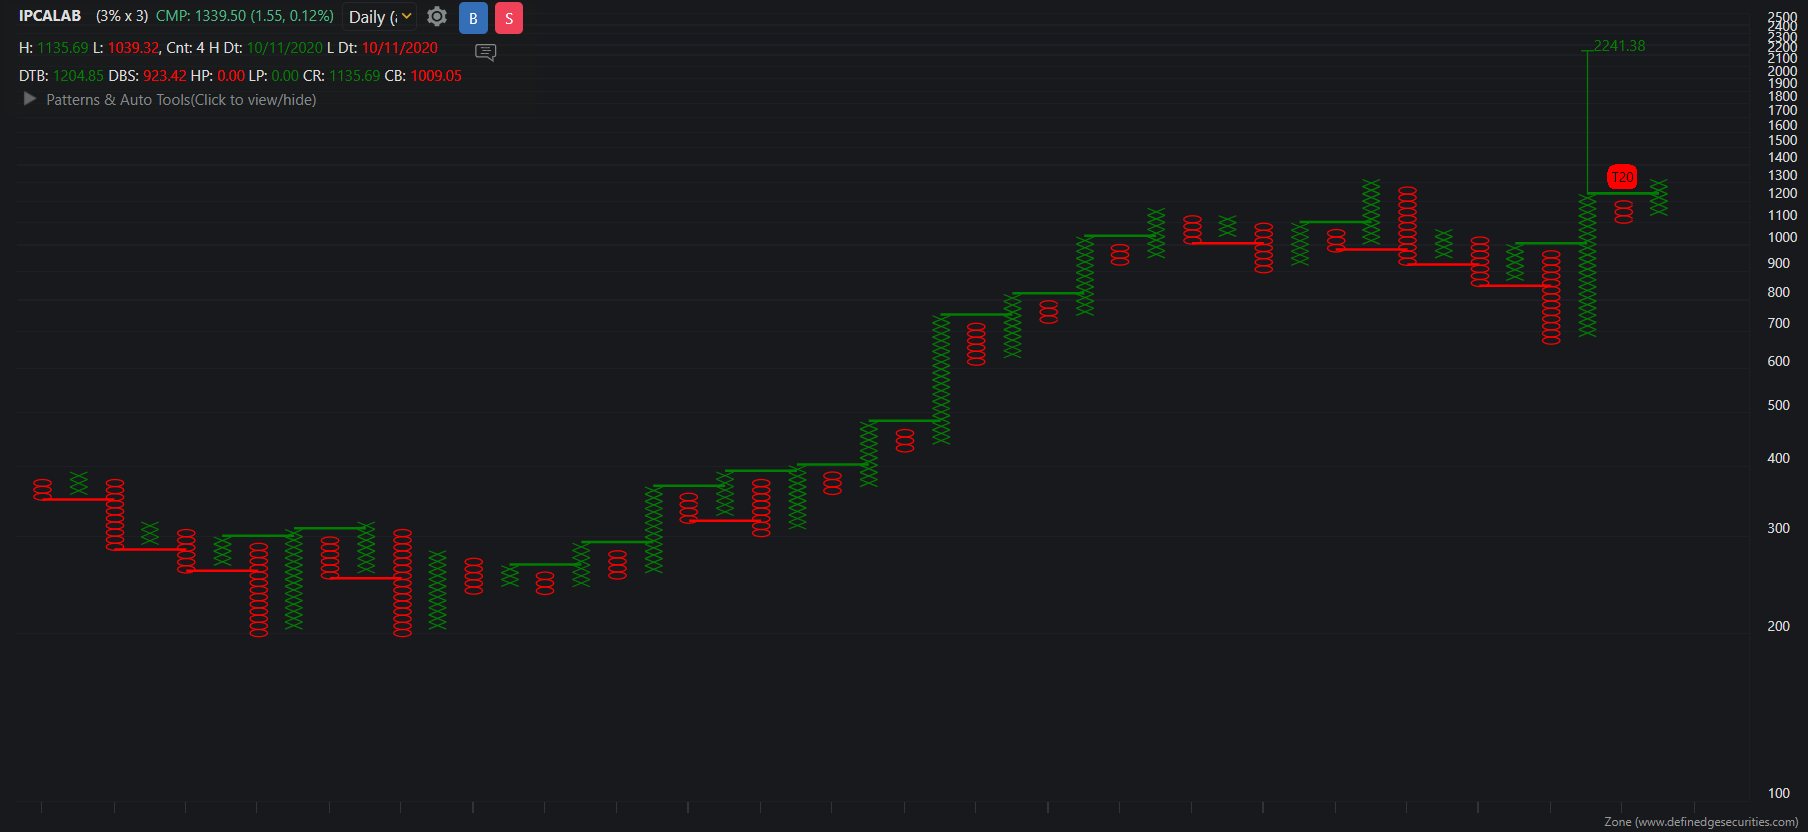
Hello @Prashant-Shah sir Team @Definedge @@Definedge-Experts
very good tool P&L Insight
my suggestion is to make segment wise seperate p&l insight that will show true picture of that particular segment efficiency of that trader & investor
Thanks and Regards
US DOLLAR INDEX-DXY-Monthly
Breakout from falling trendline can hit blue trendline between 110-112
That will put more pressure on
Emerging market like india
That will help to gain
GOLD
#AhmedabadNest #DXY #NSE #StockMarketindia #analysis #GOLD
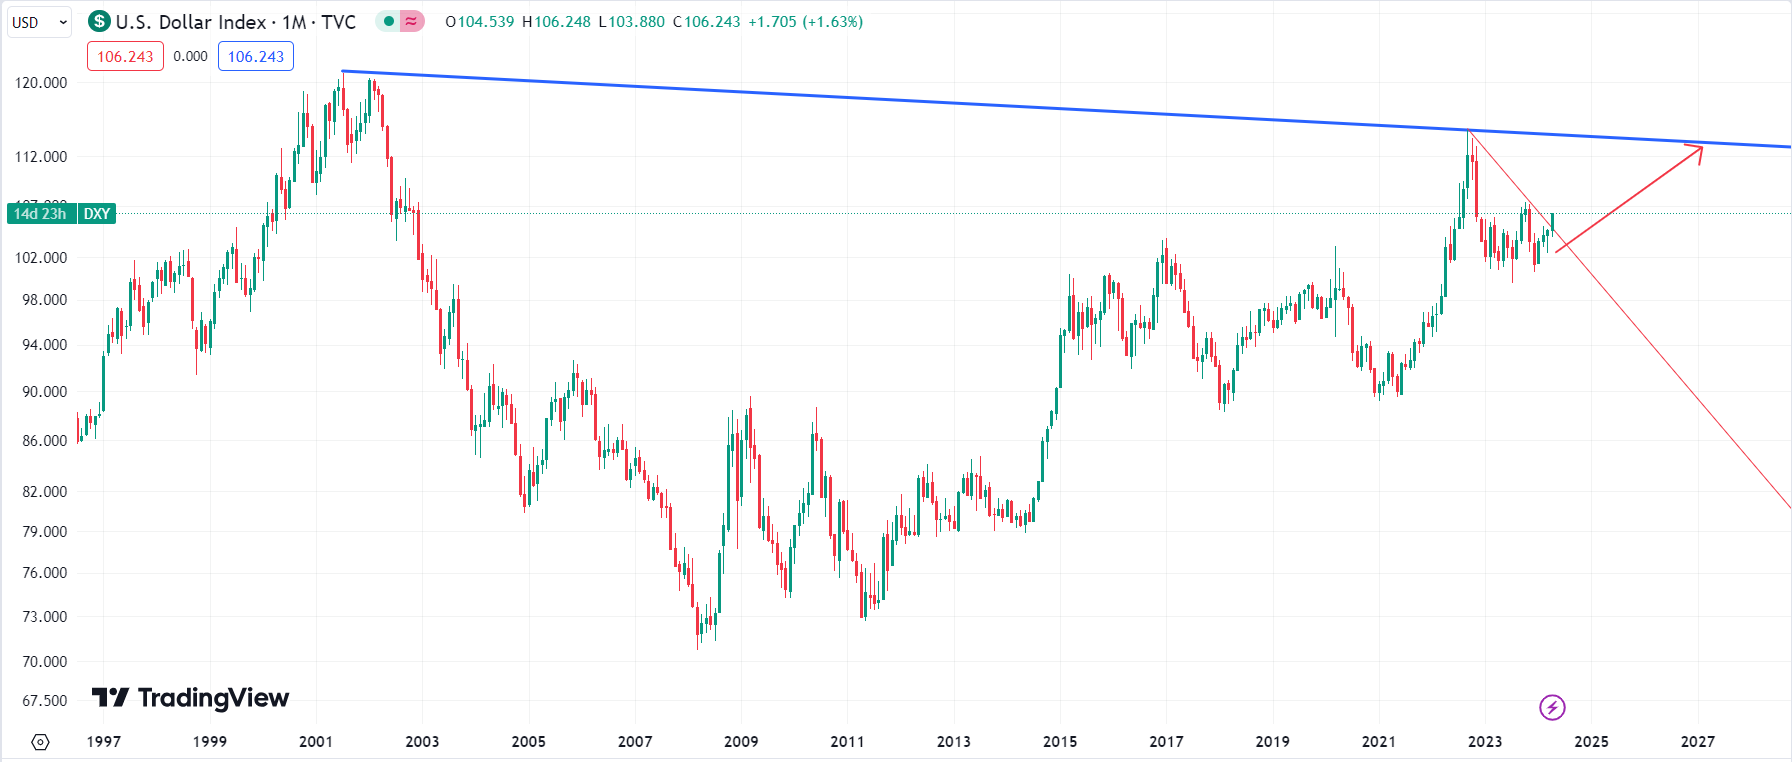
GOLD MCX-Repeting Pattern ! GOLD USD-Pattern Breakout
weekly chart
getting some similiar pattern breakout
consolidation between 2016-2019 then all the way 34000 to 54000 ->Even dosent came to test breakout levels
Now consoldation between 2020-2023 now breakout
expecting positive momentum for long time as USD Gold has broken very large Cup & Handle pattern which will be failed only below 1600
Keep watching Ratio charts of GOLD VS EQUITY to get more insight and where to be aggrasive
#AhmedabadNest #GOLD #MCX #USDollar #pattern #Breakout #analysis #relativestrength #allocation #rotation
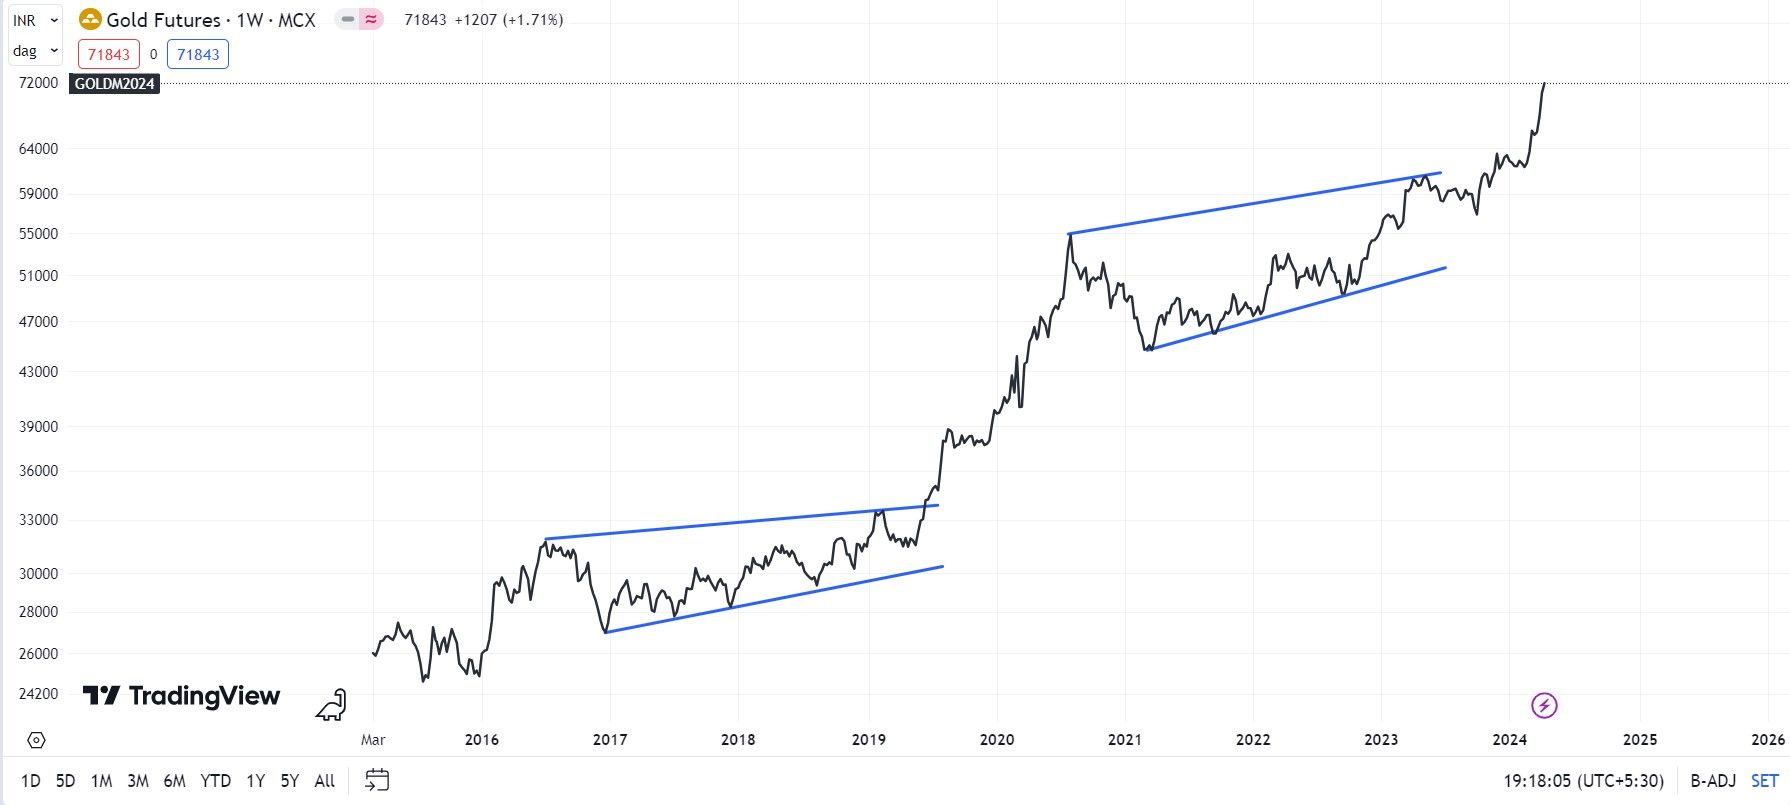
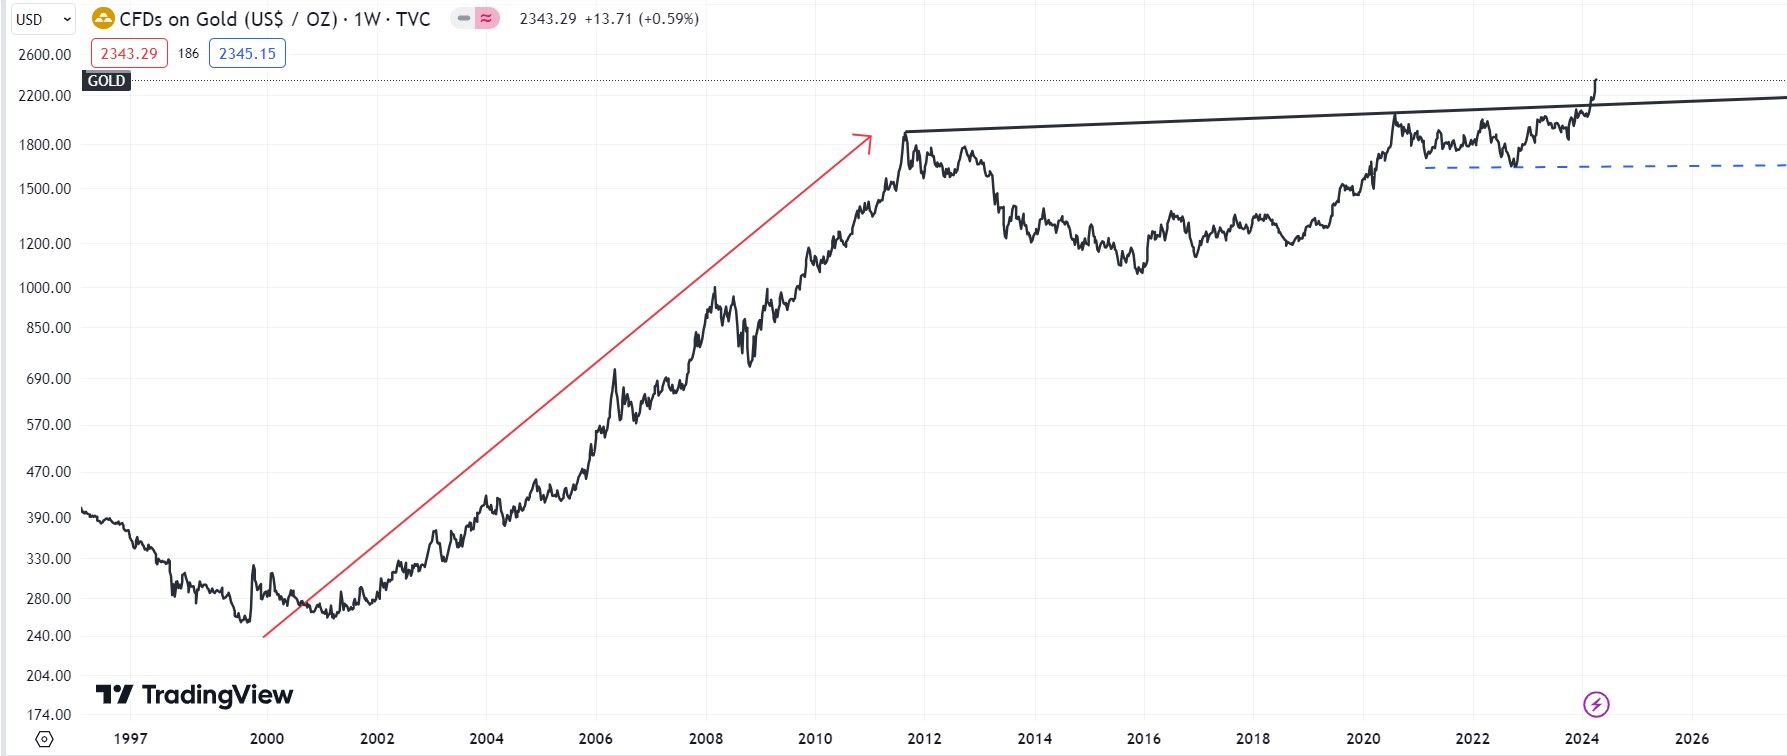
Multiple Time well alerted that gold will out perform check my posts
@Prashant-Shah sir if i wants to build stock portfolio based on sharp ratio then what is the minimum time period based on that i need to calculate the sharp ratio and what will be the minimum and maximum range i can select for sharp ratio (my goal is for long term only )
target abhi dur hai
even internation GOLD is breakout after 12 years
abhi to party shuru hu hai
please push update in system as early as possible as wants to re balance many portfolio based on it & wants to calculate breadth data -otherwise i have to cerate group manually buy using the NSE re balance files @Prashant-Shah @Definedge @Definedge @@Definedge-Experts pleas look into it
only nifty 50 & nifty 500 re balanced pushed into system rest not pushed by when all will be updated in web ?
The Index Maintenance Sub-Committee (Equity) of NSE Indices Limited has decided to make the
replacement of stocks in various indices as part of its periodic review as listed hereunder. These
changes shall become effective from March 28, 2024 (close of March 27, 2024)
when this re balance will be reflected in web & desk top version ? as i take breadth data so for me it becomes important
@Definedge @@Definedge-Experts @Prashant-Shah
basically its breadth based model-contterian in nature when in Golden cross mkt will see correction when in death cross mkt will see rally -weekly updated
yes this is highly needed
ok but on what basis this line plots -whats calculation behind it ?
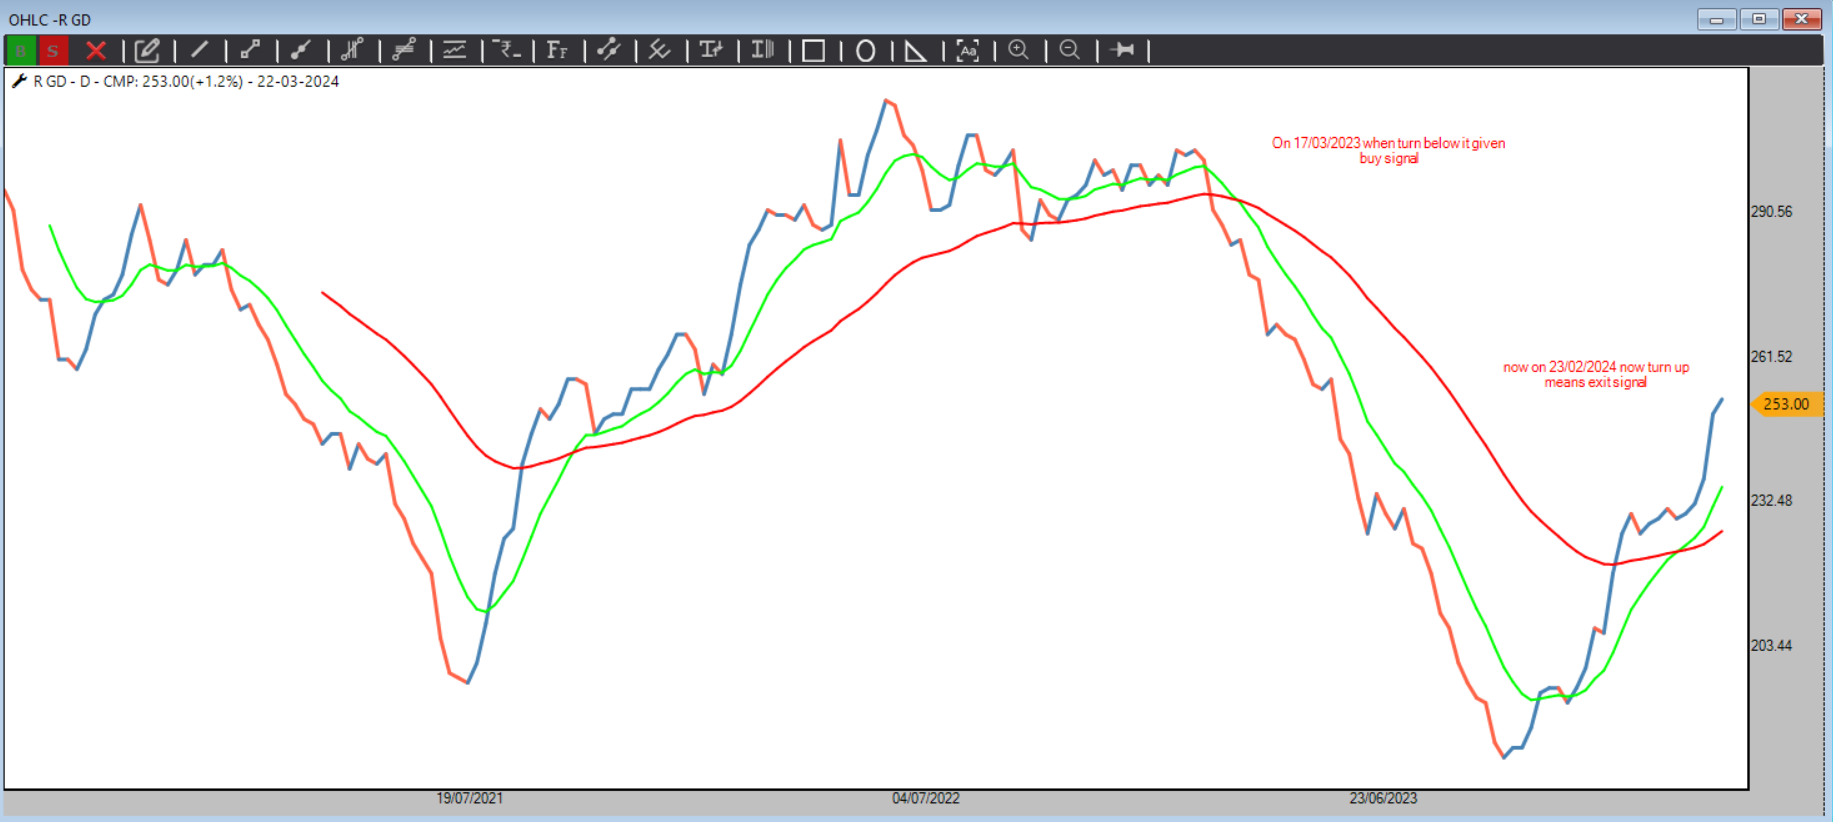
22-03-2024 RGD Conterian indicator Remain on Exit mode since 23-02-2024
Hello prashant Sir & Team definedge
we have facility to plot Sum chart in desk top (P&F /RENKO ) kindly add this zone
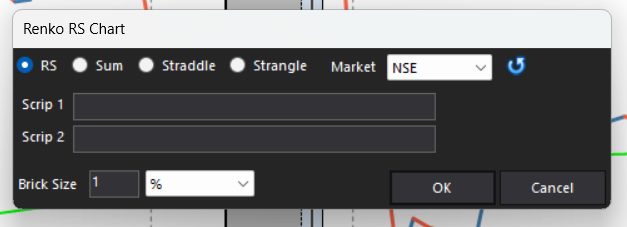
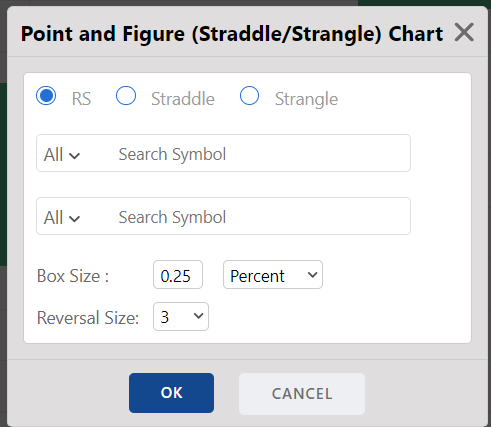
@Prashant-Shah @Definedge @@Definedge-Experts
Hello prashant sir and Team definedge
my suggestion is that the way we have pivot levels based on yesterdays close can we have levels based on VIX
1 SD Up & Down levels (68.2 % probability that instrument remain in this range )
2 SD Up & Down levels (95.40 % probability that instrument remain in this range )
3 SD Up & Down levels (99.70 % probability that instrument remain in this range )
That will help to find good support resistance-strangle writing for intraday etc
@Prashant-Shah @Definedge @@Definedge-Experts
Thanks and Regards
Nishesh Jani
also gives option to analyze last 10-20-30-50 trades
Good feature
give option to select own dates that will help more
@Prashant-Shah @Definedge @@Definedge-Experts
Hello friends
started Telegram Channel dedicated to #VGM Setup
https://t.me/+CwZgjOIvOdViYmU1
Thanks and Regards
Nishshkumar Jaani
GOLDBEES/Nifty 500-Ratio Chart Breakout
Expecting further out performance in Gold
Super Pattern above Super Trend so dont expect immediate down turn in gold
#AhmedabadNest #GOLD #outperformance #relativestrength #nseindia #ETFs #PassiveIncome
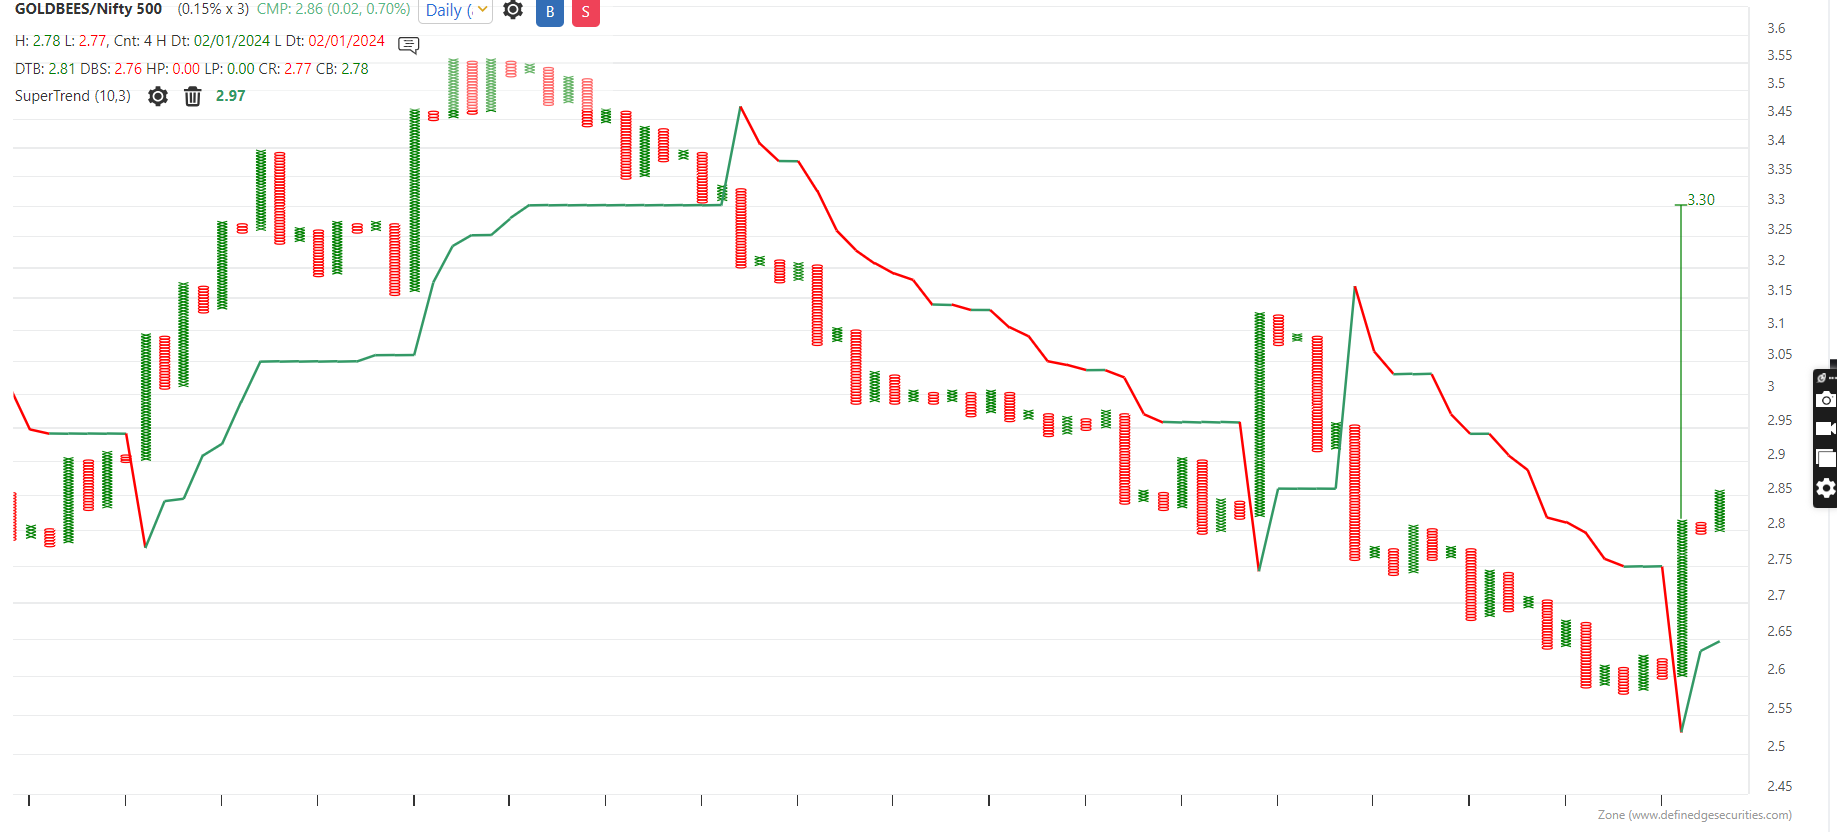
yes @Brijesh-Bhatia sir
GOLDBEES-Breakout
keep DBS 52.07 on closing basis as SL For 60 & 64 TGT
As per my market timing model we are holding GOLDBEES
#AhmedabadNest #GOLD #breakout #nseindia #stockmarkets #ETFs #passiveearnings
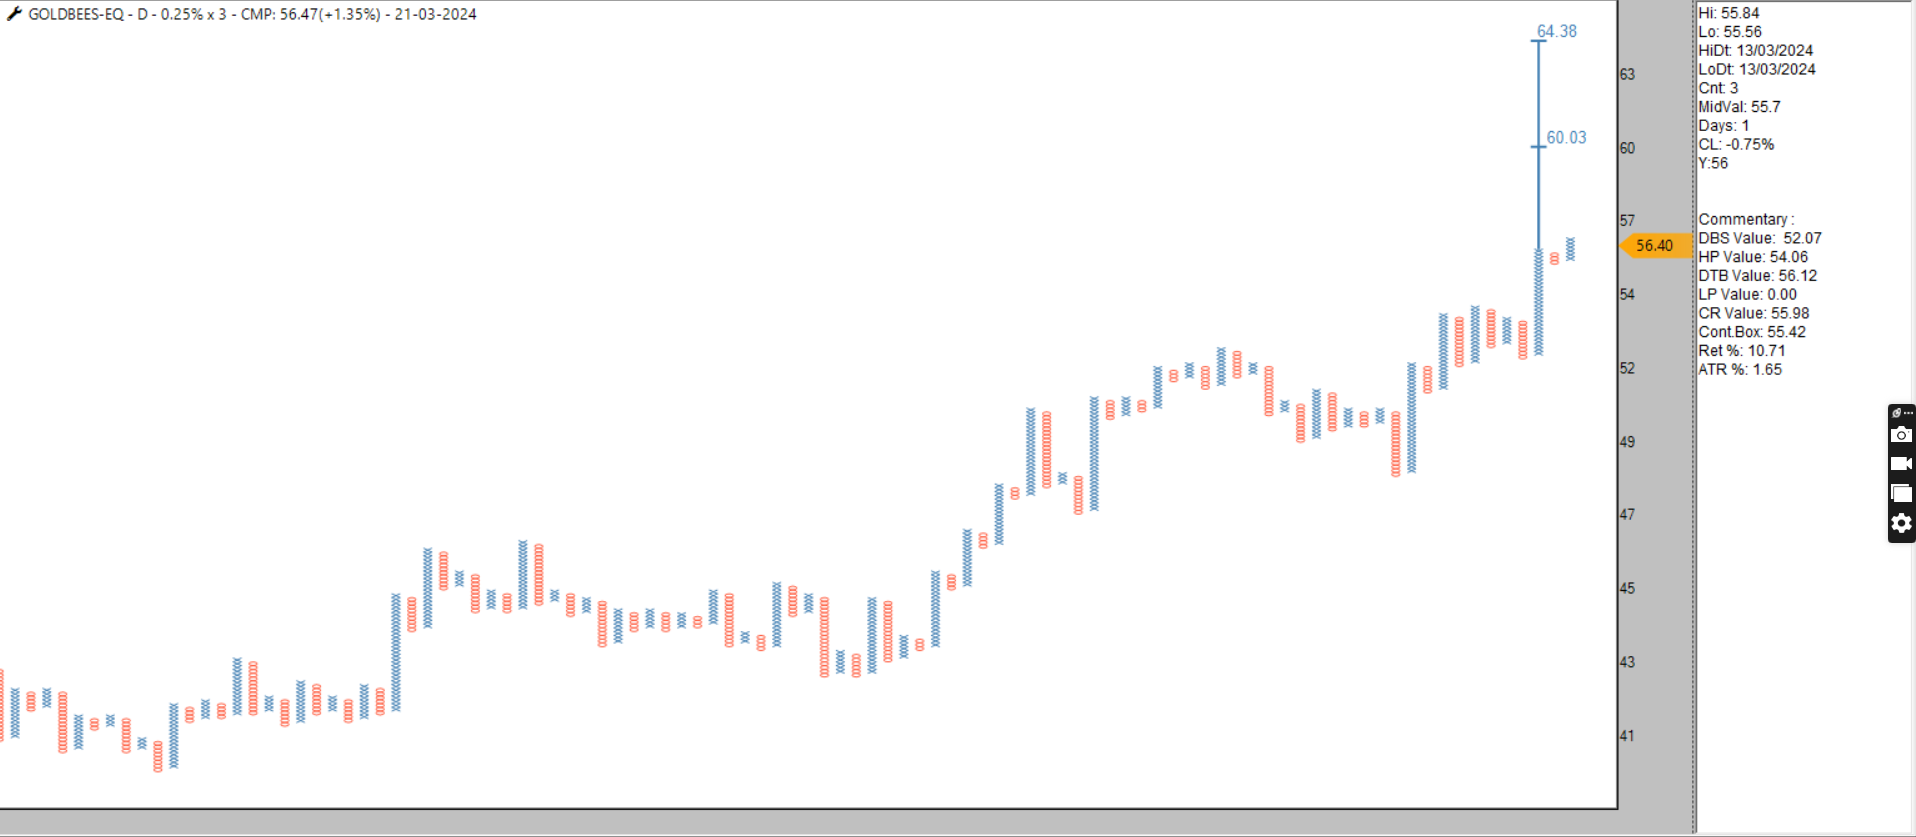
Thanks
Hello
@Prashant-Shah sir @AP sir @@Definedge-Experts @Definedge
kindly add study option in Opstra TOI
I wanted to check some historical charts of TOI where i wants to change the EMA value but i cant do that
Thanks and Regards
Bull-Bear Momentum Indicator-Turn Bearish
Another Market timing model turn bearish by giving swing bearish signal hinting more weakness in broder market going ahead
as long as dosent turn swing bullish market is weak
#AhmedabadNest #conterian #nseindia #StockMarketindia #Indicator #analysis #index
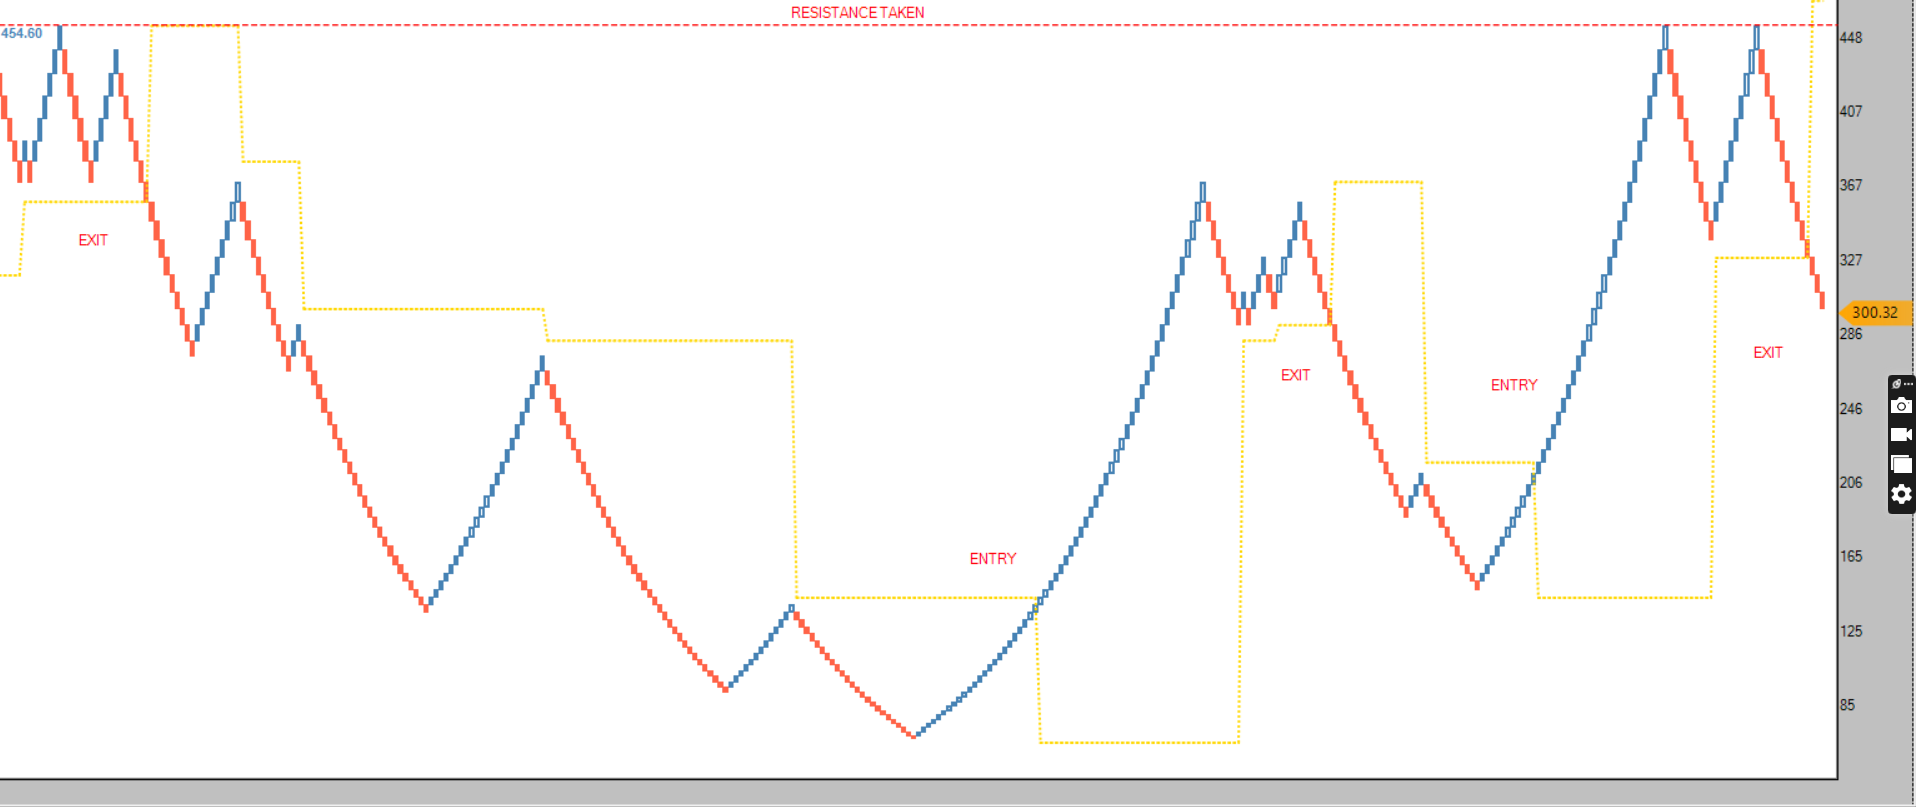
R GD Conterian Market Timing Model update 18/03/2024
Continue in Exit mode and even Rising means broder market to see more tough time ahead
Now based on my experience Few point to kept in mind
1-Long only apparoch will have little difficult time
2-Stop leverage Trading
3-Stop Marging Funding
4-High P/E stock will have more correction
5-Valuation will back to mean
"Will Feel it was market that it wants to give you Returns "
#AhmedabadNest #conterian #nseindia #StockMarketindia #Indicator #analysis #index
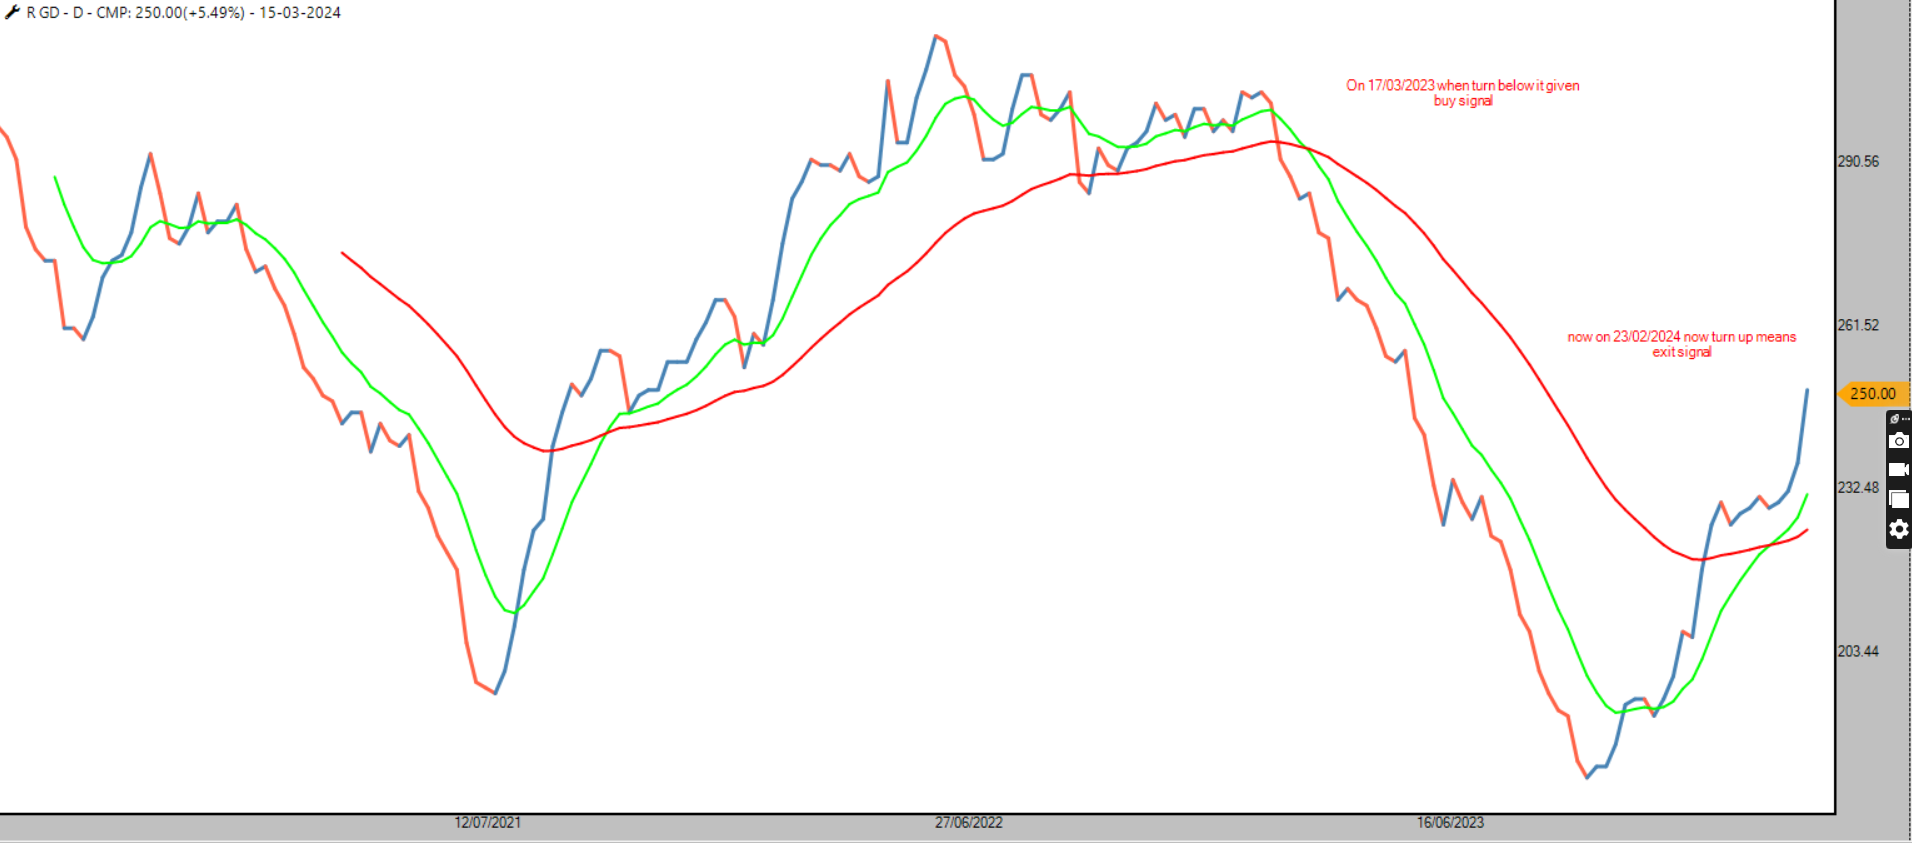
Market Trend & Your System Analysis
As prashant sir says 3 M Matrix are important
Method
Market Trend
Me
as per my observation and RGD indicator data Any system generates smooth return when Market trend is favourable in this period relaively easy money comes
i have done back test on simple P&F chart with 3 *3 Box size on Nifty 500 stocks
Entry DTB
Exit DBS
see how results dramatically changes
Sell Mode date 22-10-2021 to 17-03-2023
Buy Mode date 17-03-2023 to 23-02-2024
Notice in image when in sell and buy mode Average return per trade-success ratio-Risk Reward-Exepectancy Ratio all drametically changes
Do backtest what ever the strategy you are doing between buy and sell mode date and see the difference
Will Feel it was market that it wants to give you Returns
your feedback/query kindly send me mail at [email protected]
#AhmedabadNest #analysis #StockMarketindia #system #DataAnalytics #nseindia #breadth #Indicator
@Definedge
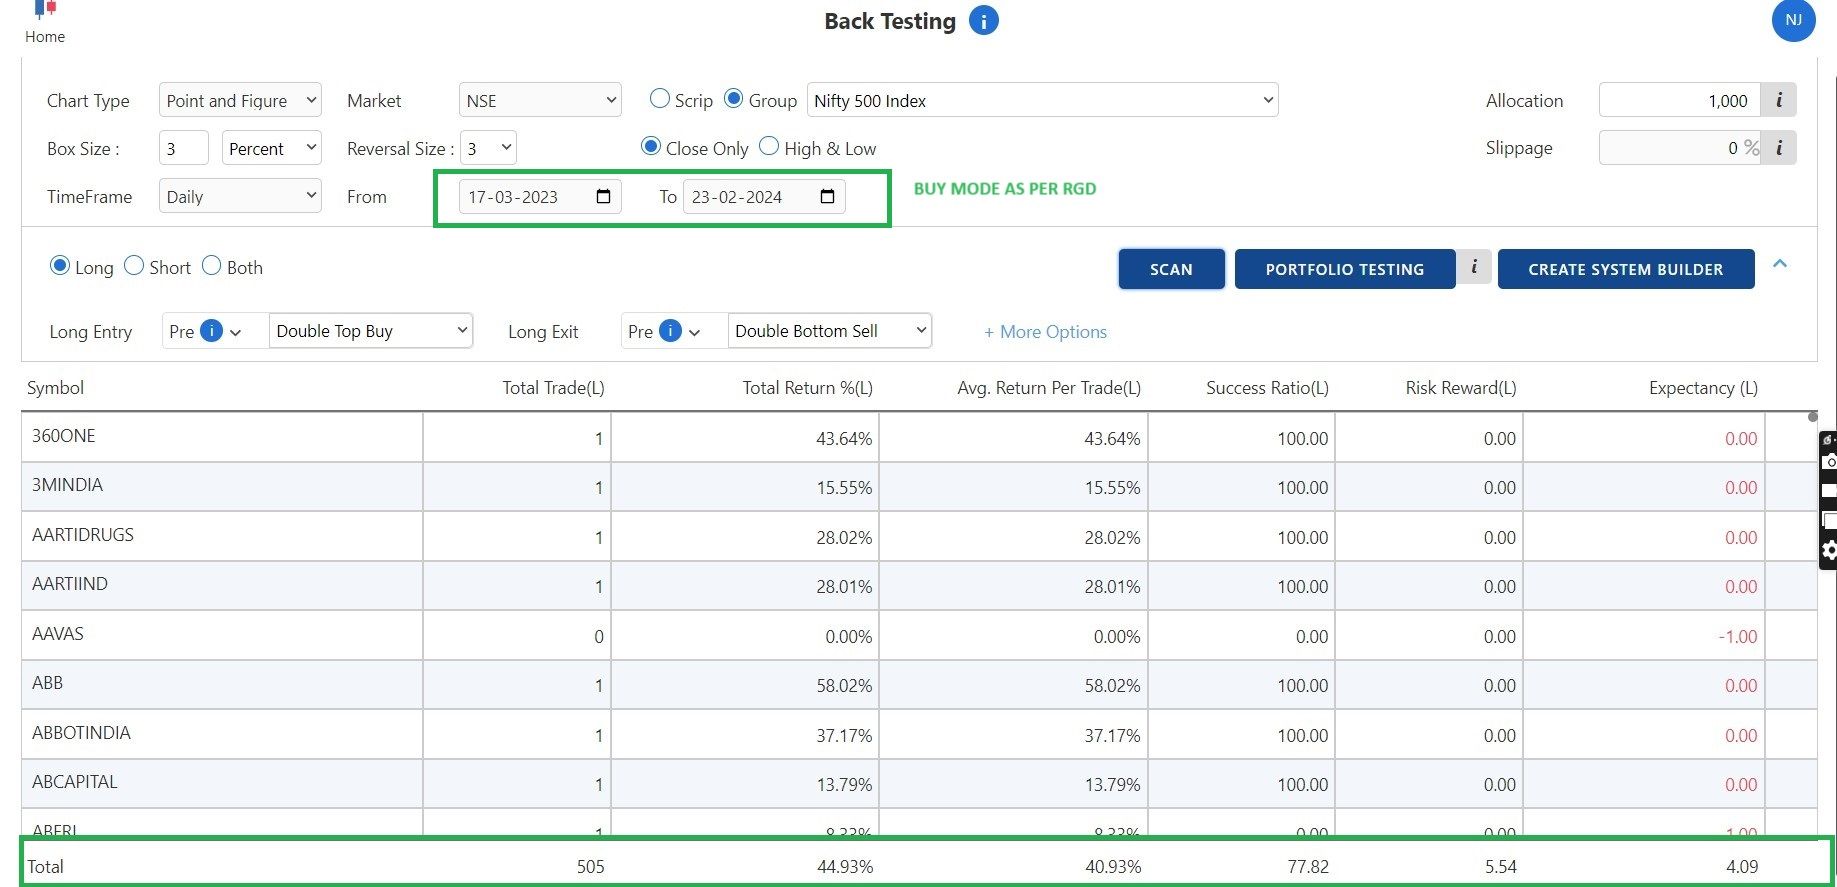
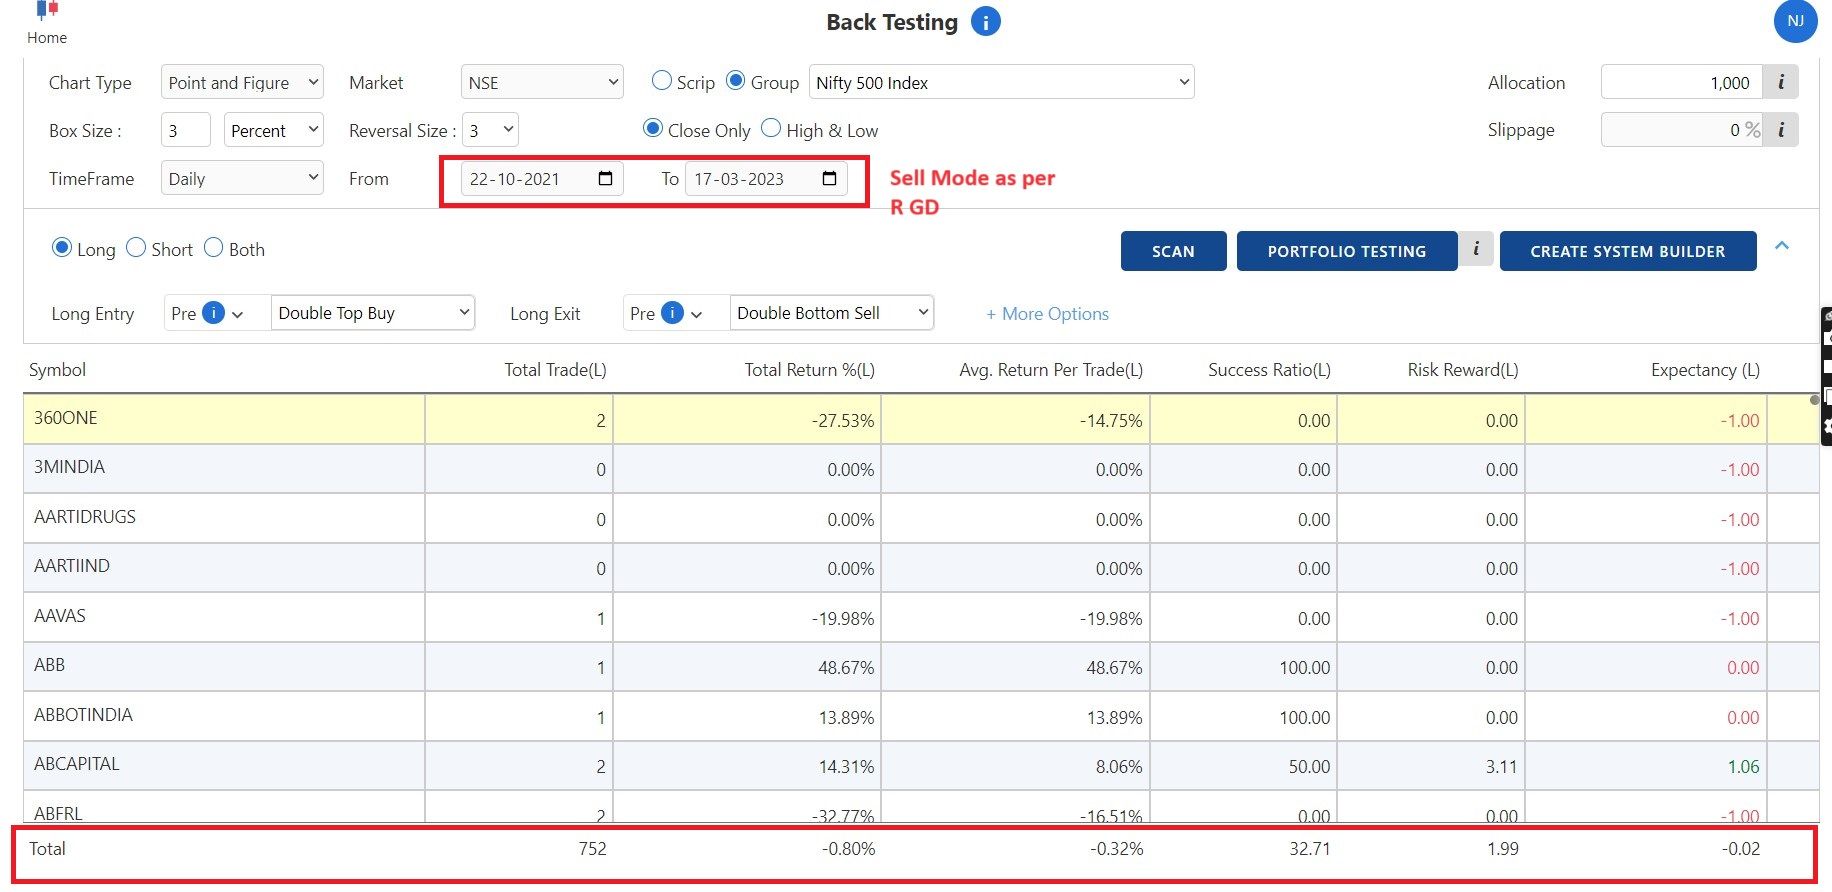
Silver
Mcx silver is trying to breakout after long consolidation
expecting 121000
Retailers can have an option on NSE-SILVERBEES
#AhmedabadNest #silversqueeze #analysis #India #mcx #nseindia #bees #ETFs
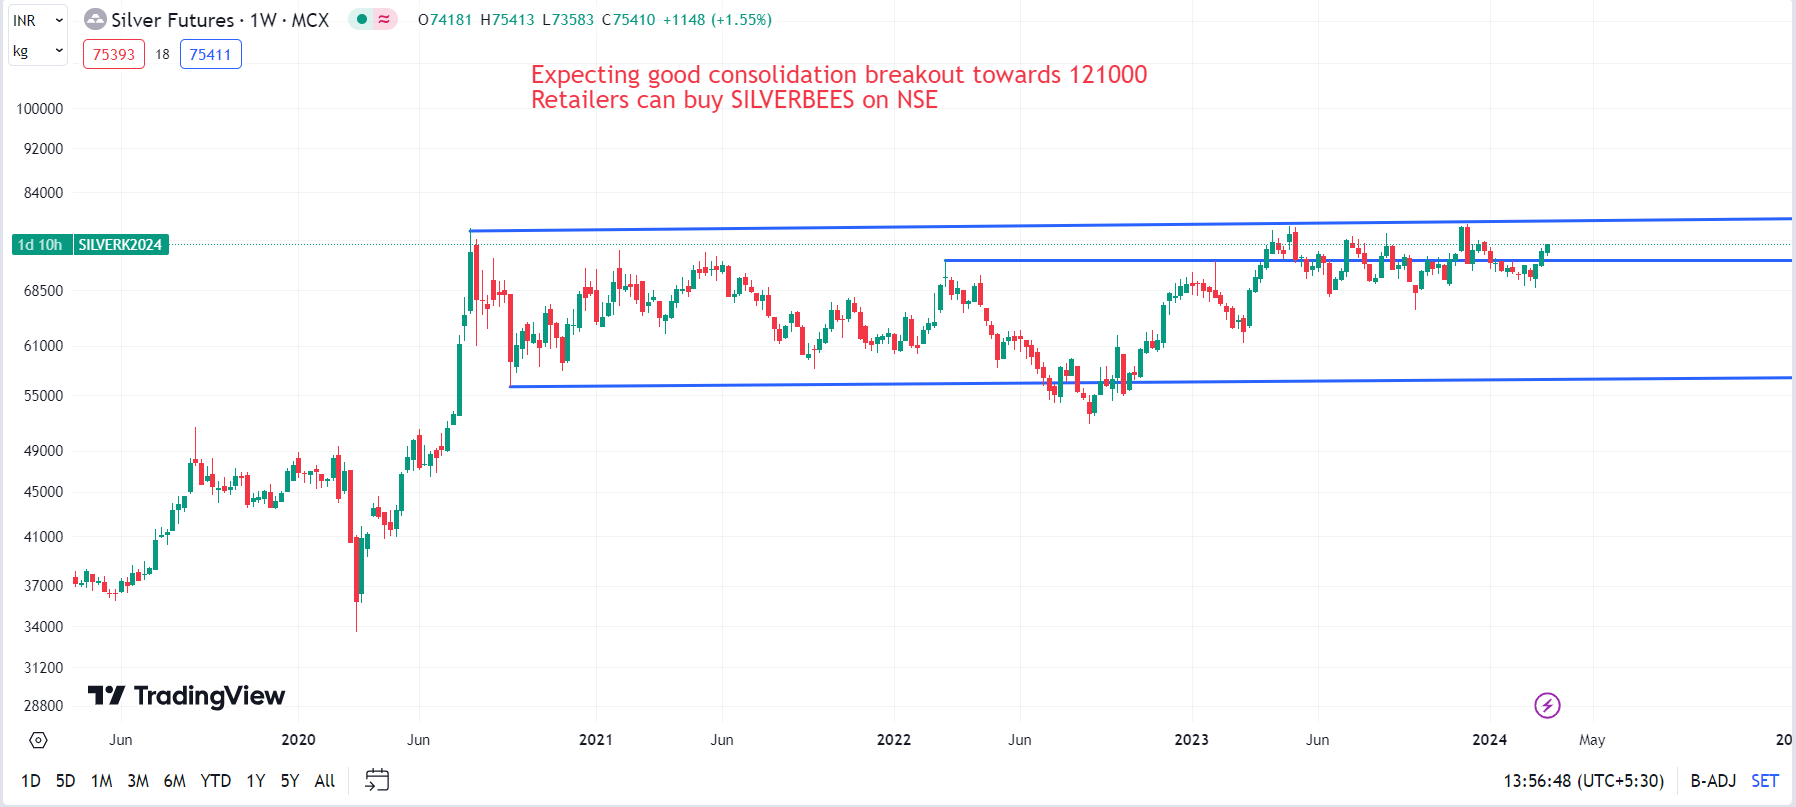
@Prashant-Shah @Definedge @@Definedge-Experts @Prasiddh-Shroff
can you add look back period in marketcap ranking scanner -> that will help while building dynamic breadth data -when ever you add please add at least 1000 days
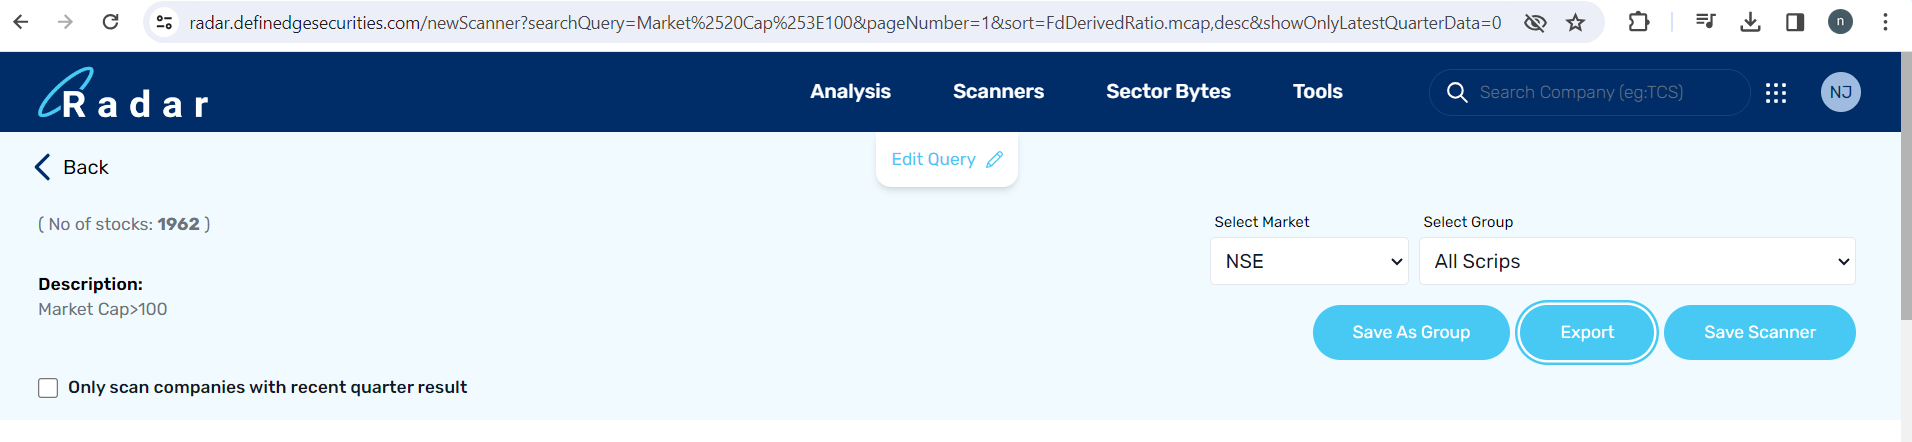
Nifty Bank
Be careful
Psu banks are weak and PVT bank index probable H&S
Expecting 10 % correction
#AhmedabadNest #pattern #failure #analysis #StockMarketindia #nseindia #nifty50 #niftybank
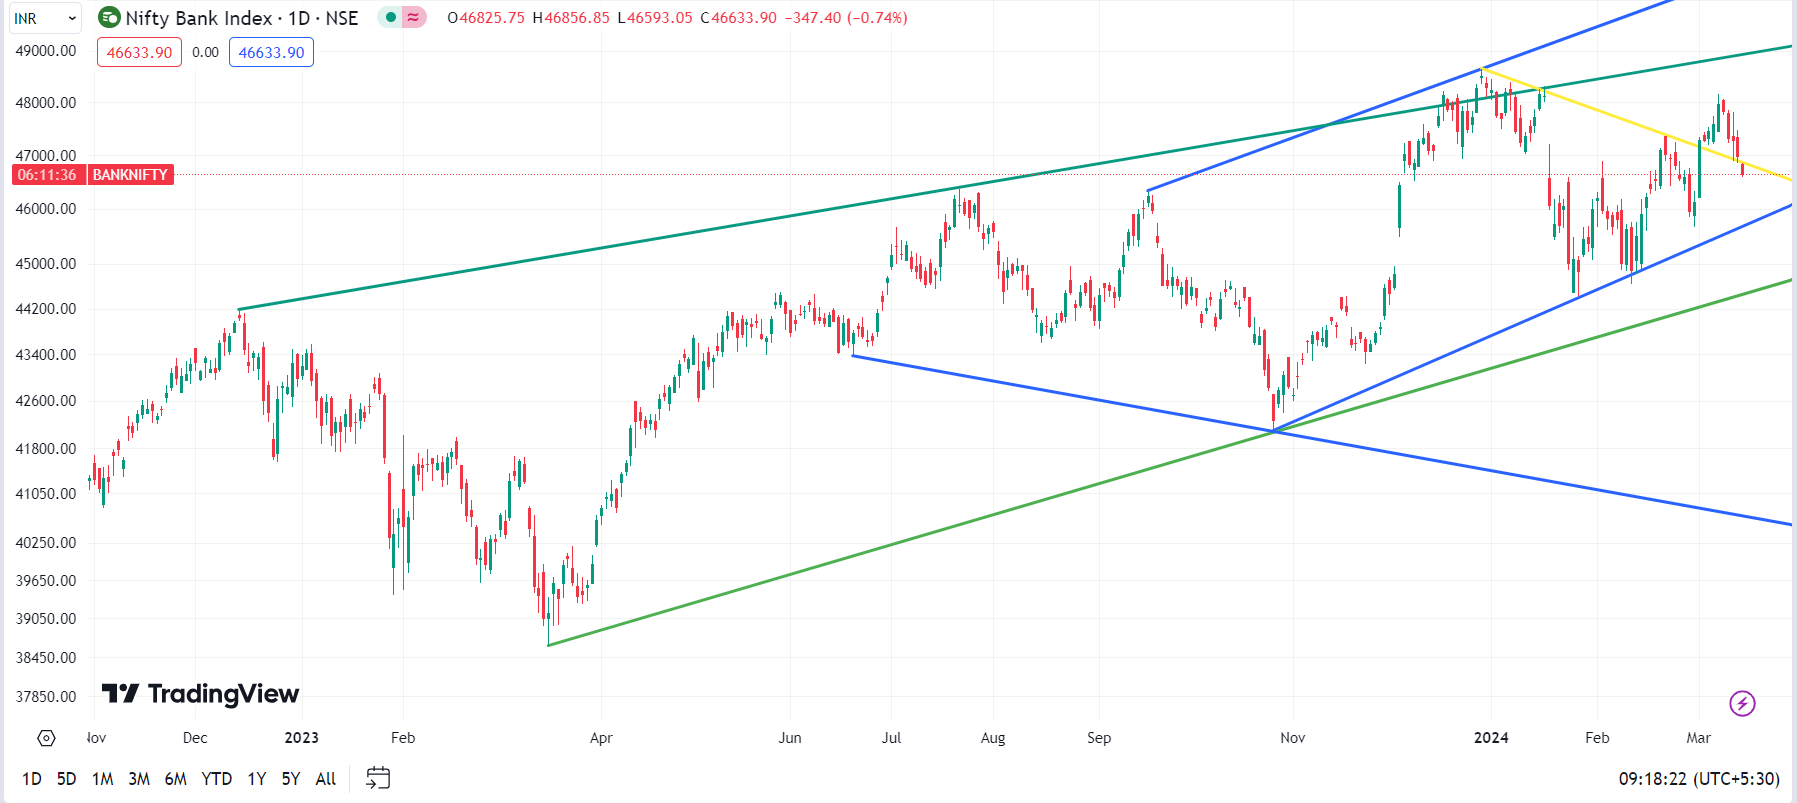
Failure of Inv H&S in Nifty ?
Look at yellow trendline and marked Inv H&S pattern
close below 22100 can be failure
Chart patterns are subject to failure. When a chart pattern fails, that is a more reliable signal than the chart pattern itself
@PeterLBrandt
@jackschwager
#AhmedabadNest #pattern #failure #analysis #StockMarketindia #nseindia #Nifty
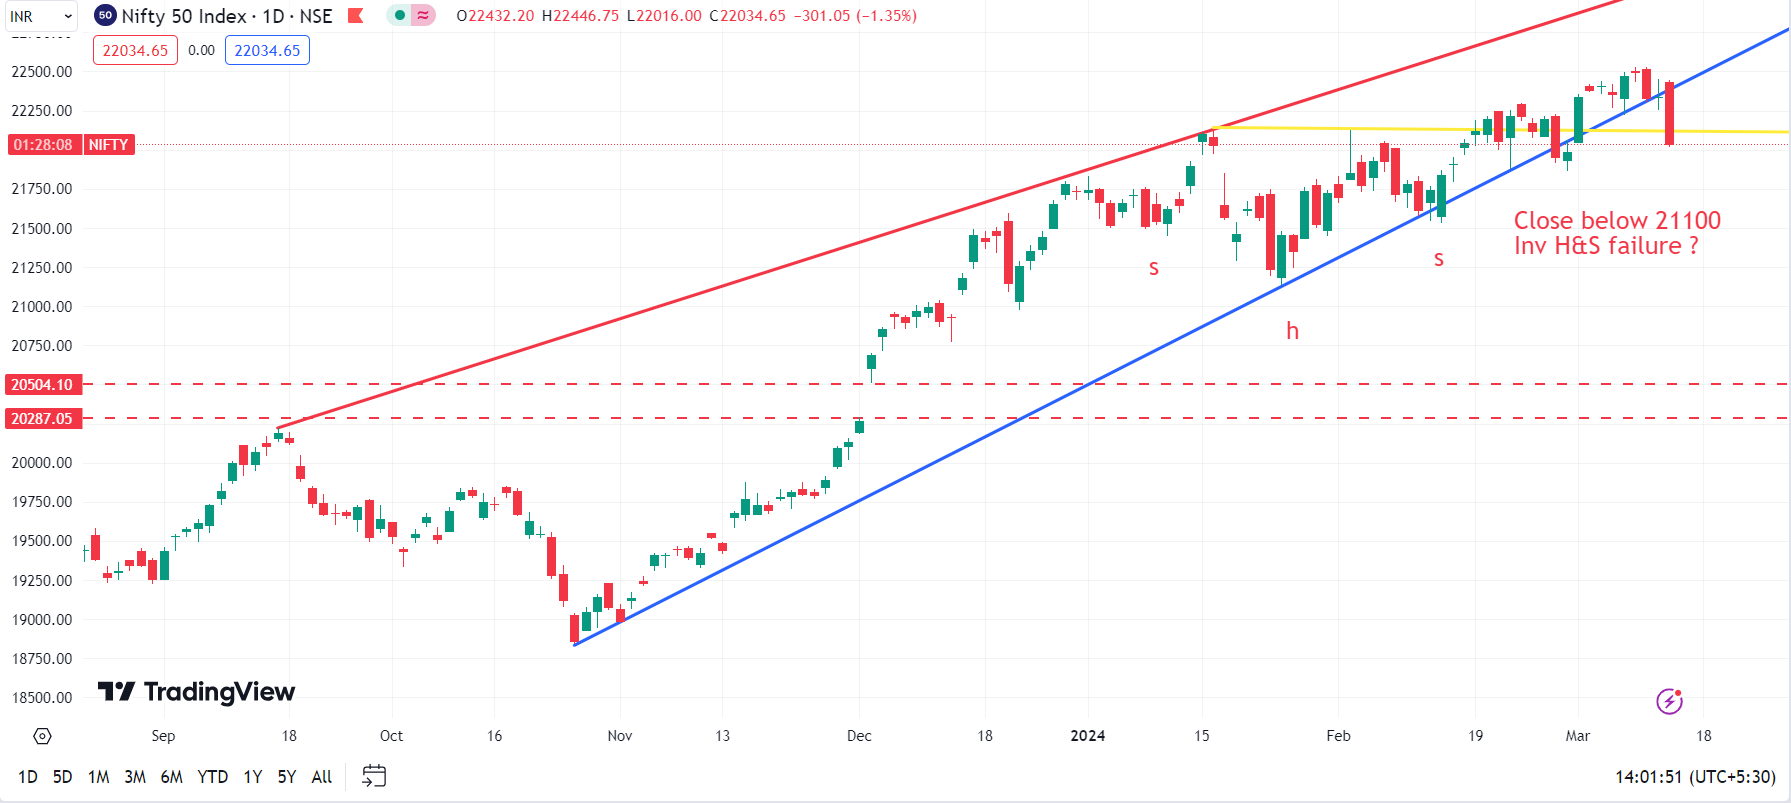
Kindly add MACD indicator in Study list of TOI-Total Open Interest
@AP @Definedge @@Definedge-Experts @Prashant-Shah
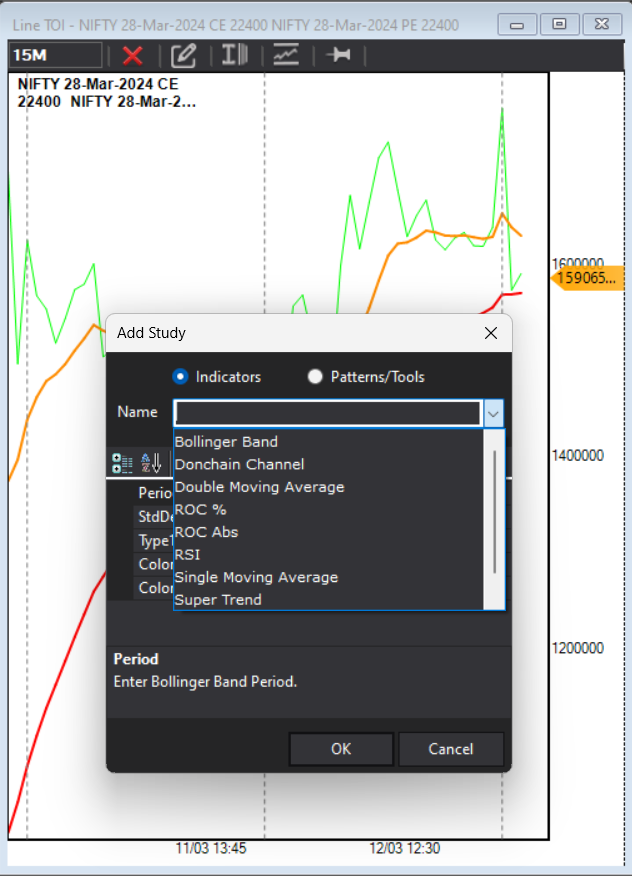
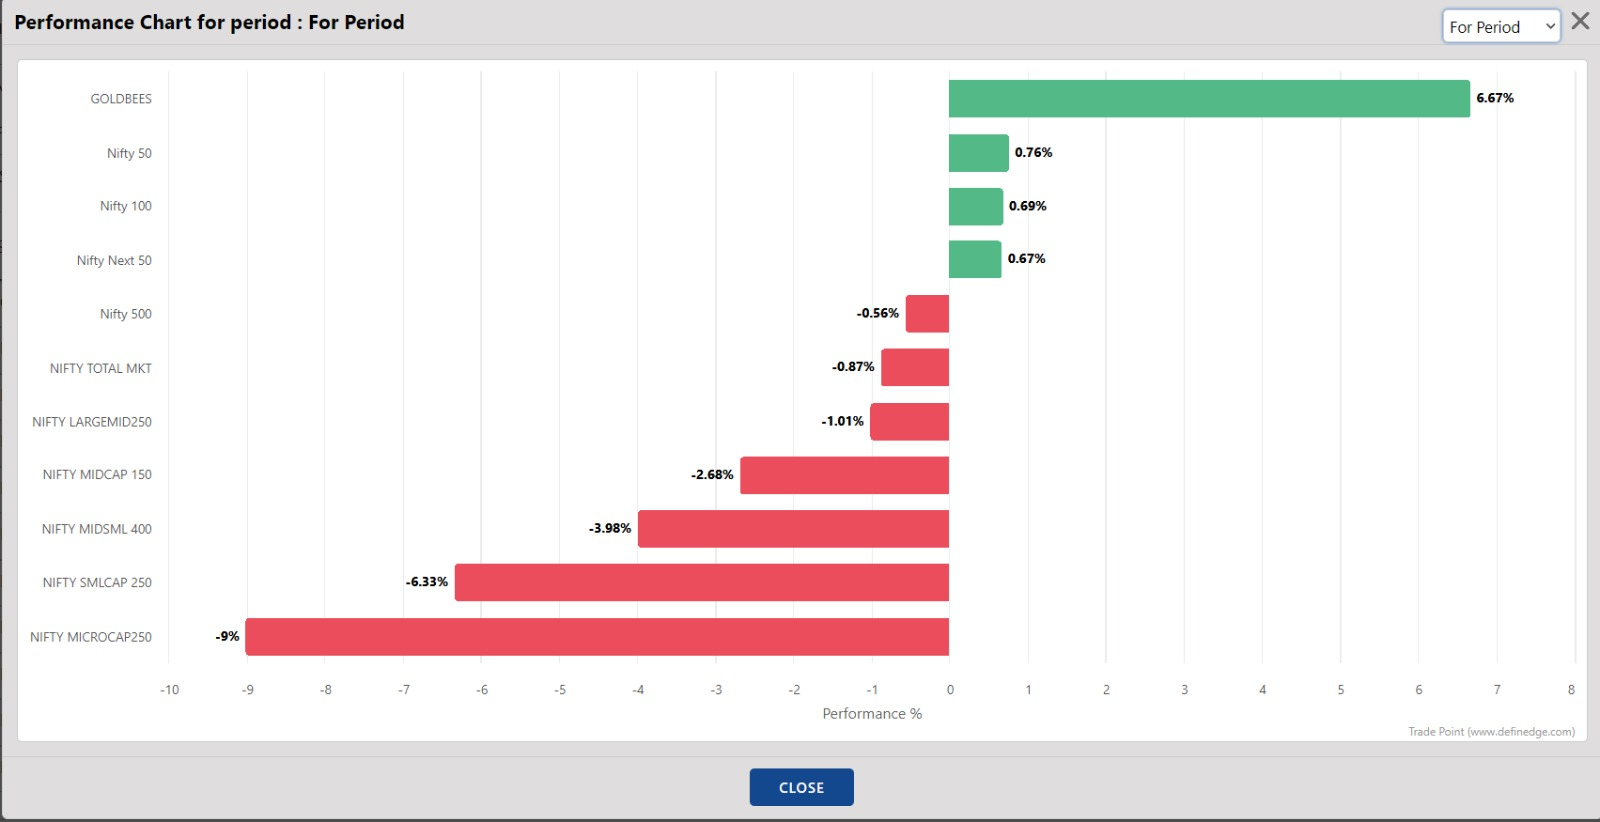
Performance of various index after Market timing model RGD generates Exit signal
no where
R GD-> Market timing Model
Updated chart -> Generate exit signal on 23/02/2024 now continue in exit mode
this suggest overall weak market structure
Avoid leverage/Margin Funnding
Tight Trailing stop losses
Avoid buy on dips look for Gold/Silver as earlier indicated for breakout and entry into this asset class
#AhmedaadNest #breadth #DataAnalytics #stockmarkets #India #analysis
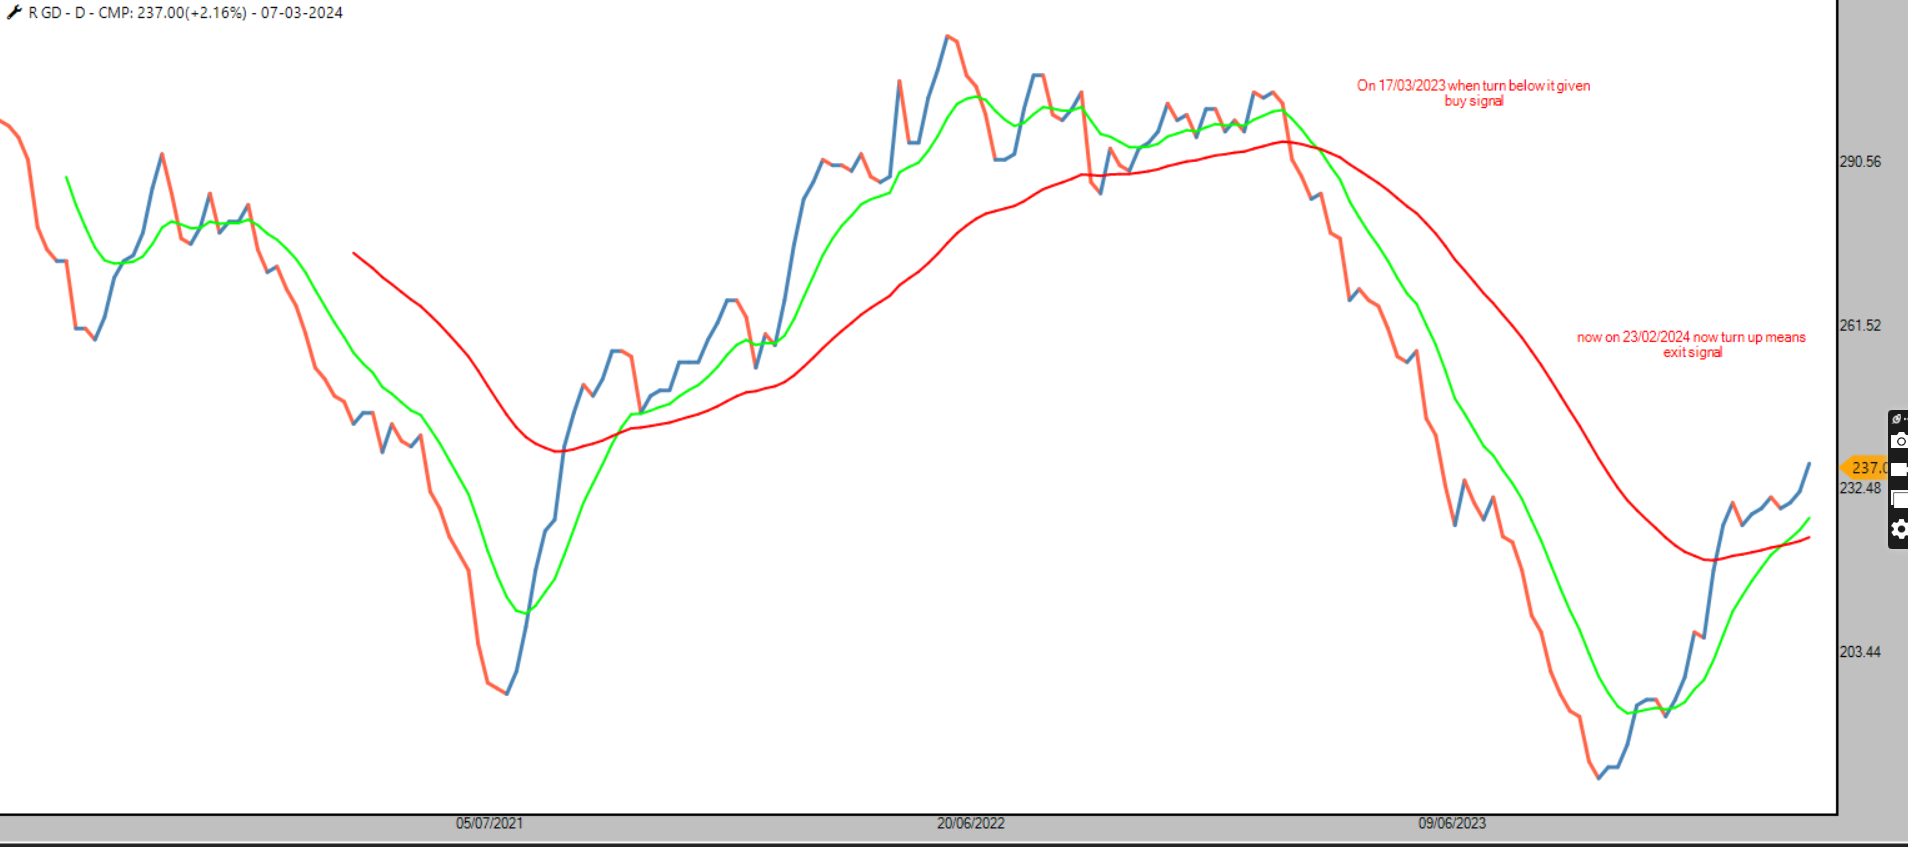
Hello Friends
Latet #VGM stock list is prepared which was presented at EDECNOCH 2021 in case you have missed or wants to revise the presentation sharing the link
https://www.youtube.com/watch?v=yUEdH9dlSHg&t=19s
Full list and seperate list of Motilal oswal & Parag parikh is available on Telegram channel of definedge or you can mail me at [email protected] i will send
Thanks and Regards
Nishshkumar Jaani
Nifty PVT Bank
probable Right shoulder ? till it dosent close above head it could be the H&S Top pattern
on RS charts its is taking support but need to cautious till it dosent cross previous high
once it negate H&S pvt bank again will lead the bank index with my favourite HDFC -ICICI-AXIS-KOTAK
#AhmedabadNest #NSE #pattern #CHARTS #analysis #stockmarkets #India #pvtbank #bank
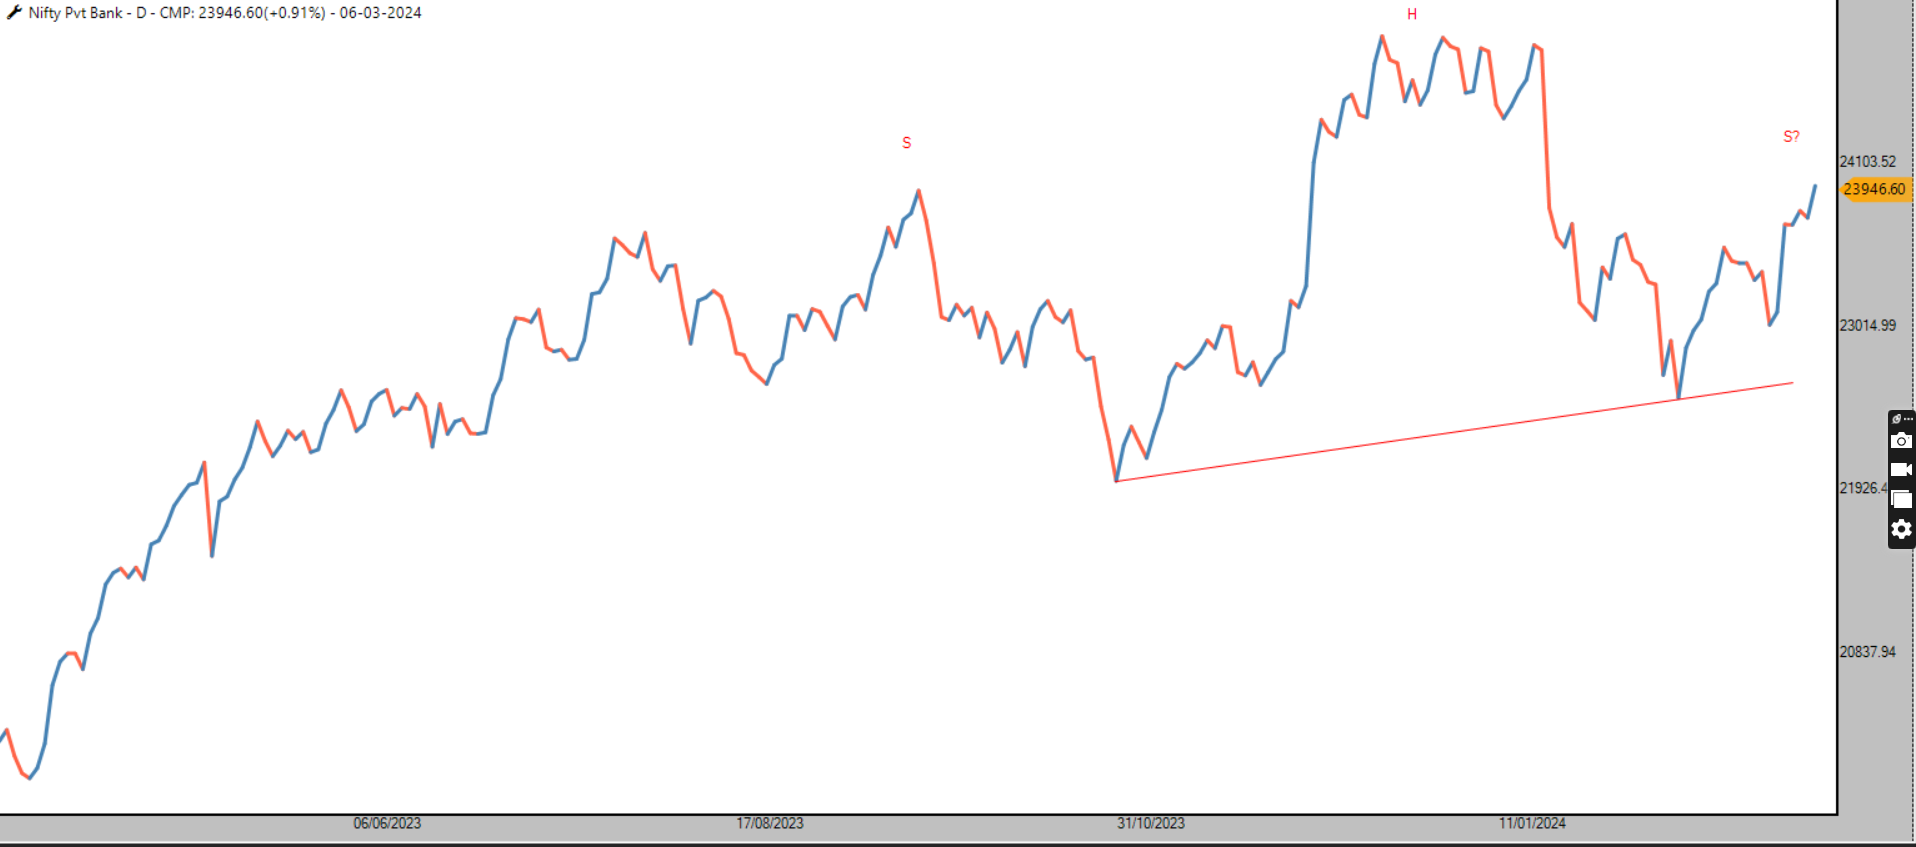
Important question for Every trader-> Initial capital Requirment
Gone through many books / videos / course / connected traders and investors who presents excellent strategies but one important aspect about initial capital is not much talked about
Veteran trader and author Ashwani Gujaral sir in his book says you can not control the price movement but you can always control the volume you trade,most traders go bust because of volume ,not price !
For me I have identified few rules which might help you
naked Fu or Hedged Fu keep 3 times margin what the exchange ask For 1 lot
For spread in nifty keep 3 times of margin required by exchange For 1 lot
For naked long options keep 1 lot of margin equvivant to what the margin required to short that option for 1 lot
You can do anti martingale process where you reduce position sizing during drawdown and rising position sizing during favorable period
After seeing this much of margin requirment you will say return will decrease yes it affect but you can use extra margin in other investment like equity portfolio or Instrument like Gold silver ETF if price is favorable and raise Return on investments
Hope you like my words your suggestion / feedback kindly mail me [email protected]
#AhmedabadNest
#nseindia #stockmarkets #position #sizing
It is the first Liquid ETF in India that provides convenience of Growth NAV (Net Asset Value), thus making it easier to track and maintain by eliminating dividend tracking. Additionally, the returns are taxed only when the ETF is sold, unlike other ETFs that pay dividends and are taxed continuously.
So no problem of fraction Units and its calculation
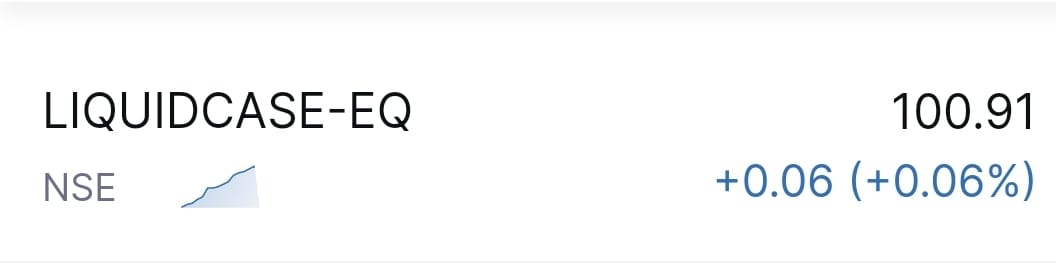
Snapshot of March 2024 Portfolio
An equal weightage of 20 stock portfolio which covers large-mid-small caps across various sectors
Irrespective of market movement it holds 20 stock and re balanced every month
its for passive investors index who dont have time to look for day to day market movements and can follow for long time
Happy for your feedback/suggestions/query at [email protected]
#AhmedabadNest #2024 #yearly #portfolio #StockMarketindia #nseindia #Quant #DataScience #DataAnalytics
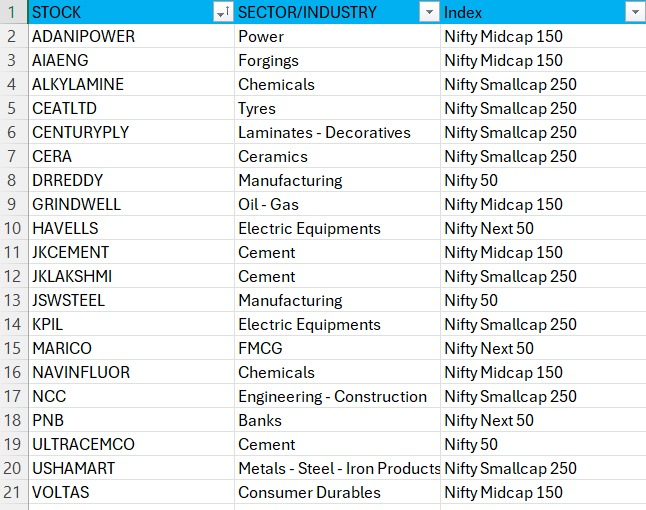
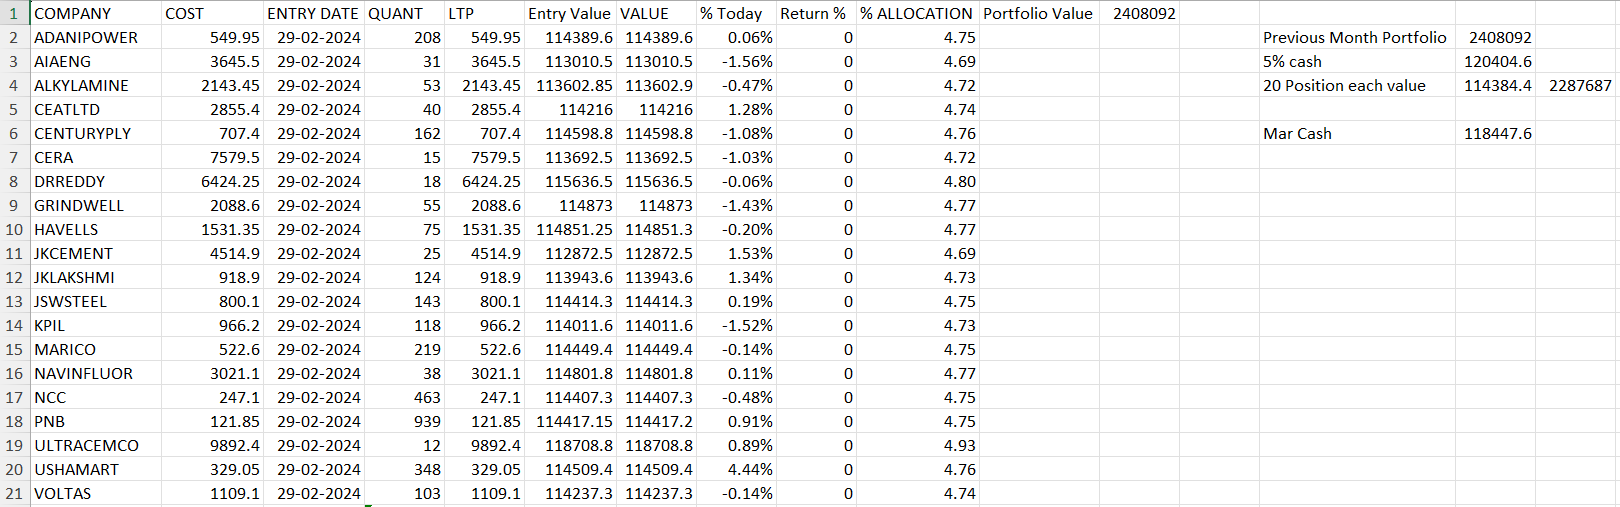
Ratio chart of GOLDBEES/NIFTY 500
Now trading at 2008 levels
Look for Bullish Setup to enter into Goldbees
Look For bearish Setup to Exit from market
#AhmedabadNest #nseindia #StockMarketindia #nifty #gold #rotation #assetclass
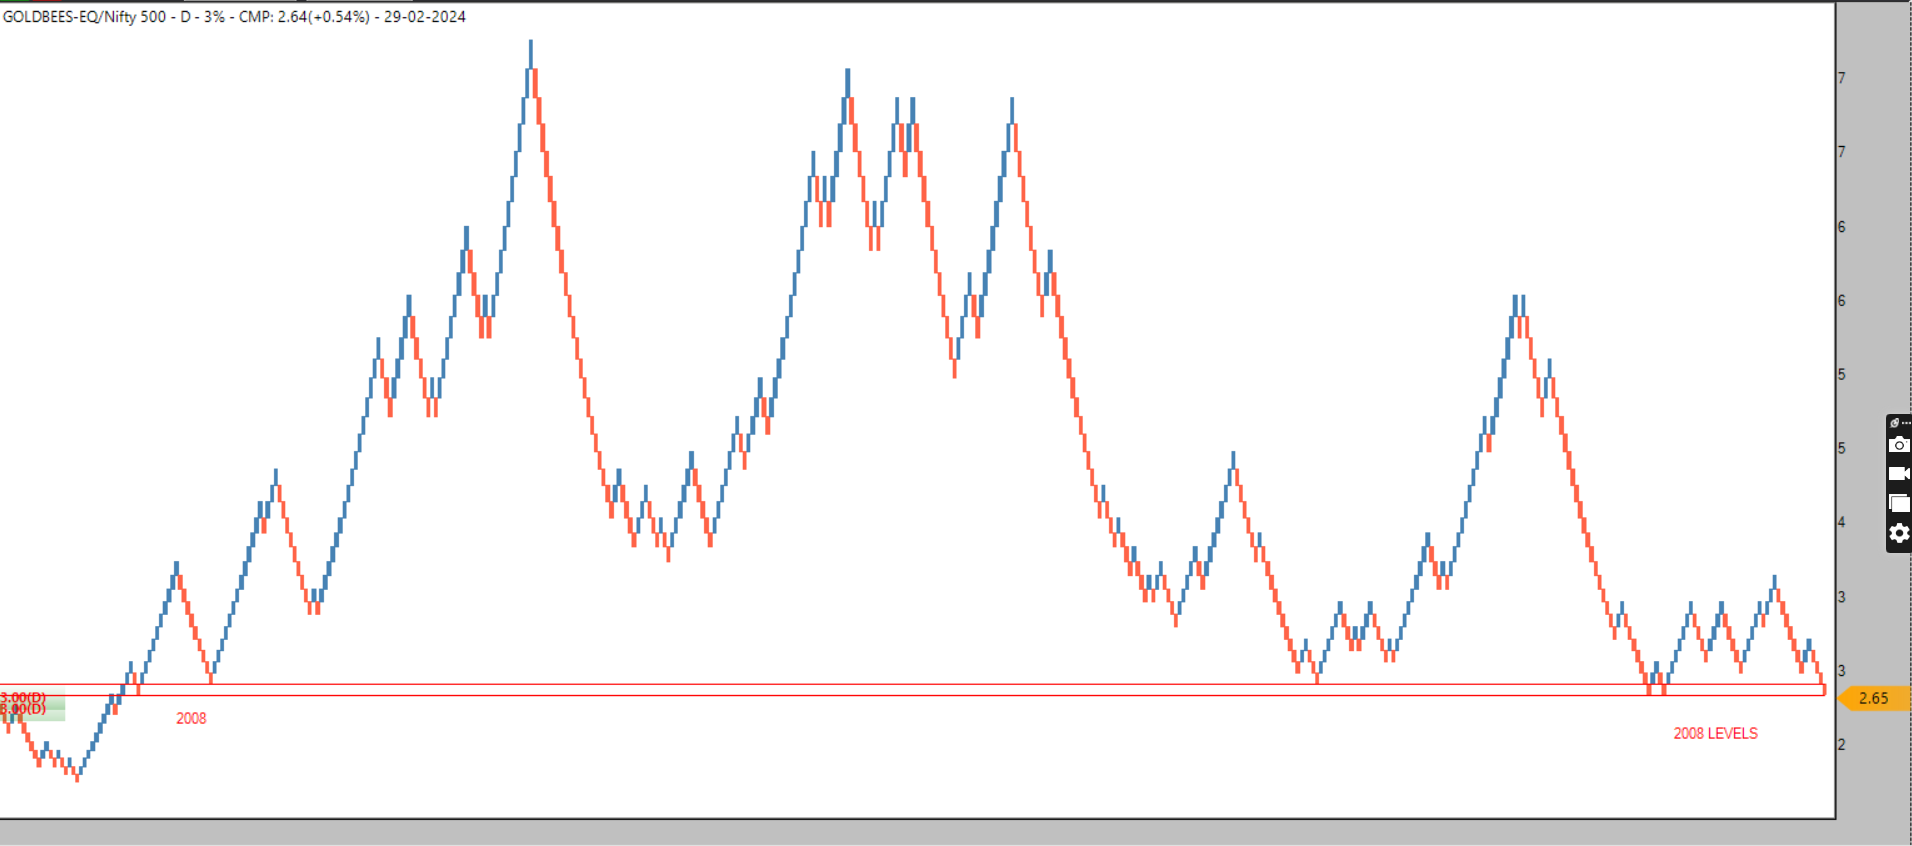
Hello prashan sir
Capture ratio measures the performance of an investment (like mutual funds) during upward and downward market trends with respect to its benchmark index.
Ratio Rank i think dose the same thing ?
@Prashant-Shah @Definedge @@Definedge-Experts
Thanks and Regards
Nishshkumar Jaani
no video or any details
Conterian Indicator R GD flashed Exit Mode
Last time on 17/3/2023- This indicator flashed Entry Mode (check tweet )
When ever Indicator in Death cross and Below Zero-Entry Point into market
When ever Indicator in Golden cross and above Zero-Exit point from market
See how various Index has delivered Return weekly and monthly basis and net basis
Now based on my experience Few point to kept in mind
1-Long only apparoch will have little difficult time
2-Stop leverage Trading
3-Stop Marging Funding
4-High P/E stock will have more correction
5-Valuation will back to mean
"Will Feel it was market that it wants to give you Returns "
Also find image in which index i see more correction
attached image-R GD/ Return of various index/List of index where i see more correction
#AhmedabadNest #conterian #nseindia #StockMarketindia #Indicator #analysis #index
Thanks and Regards
Nishshkumar Jaani
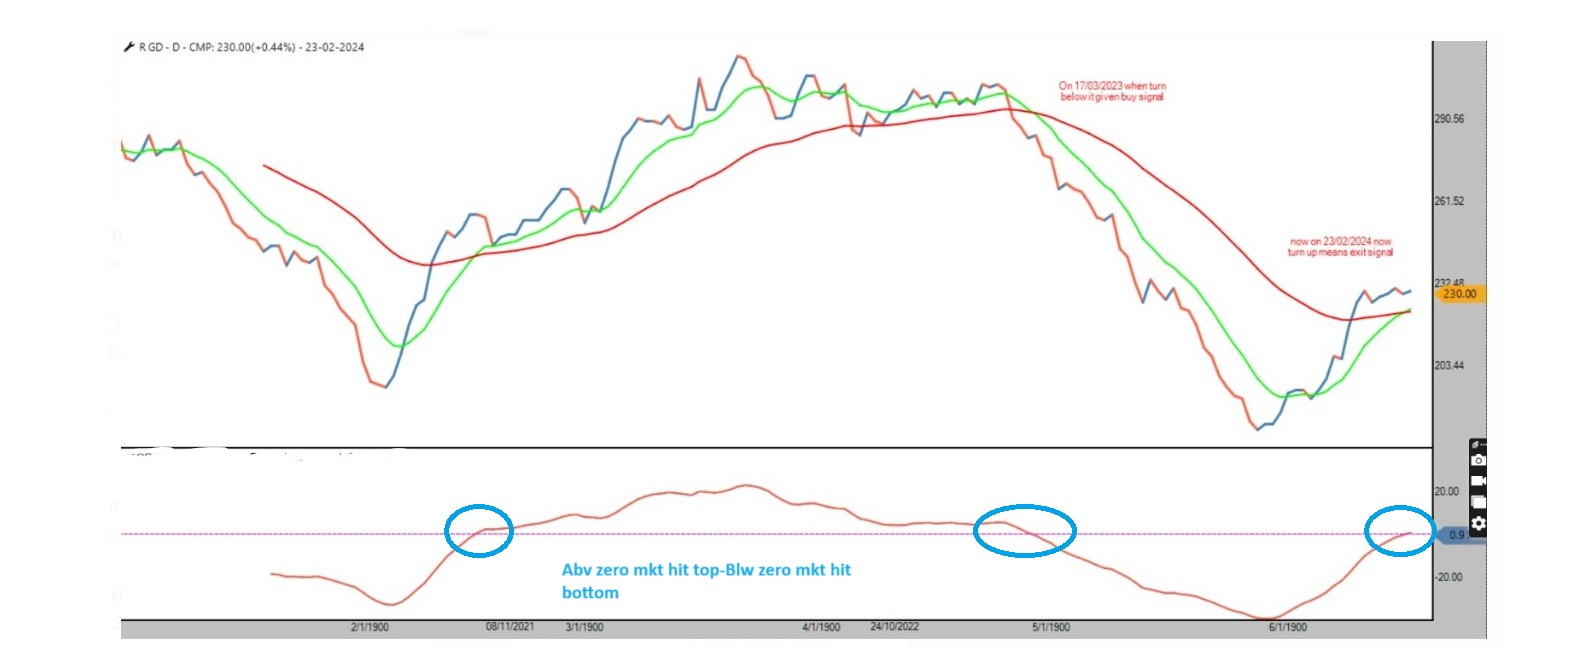
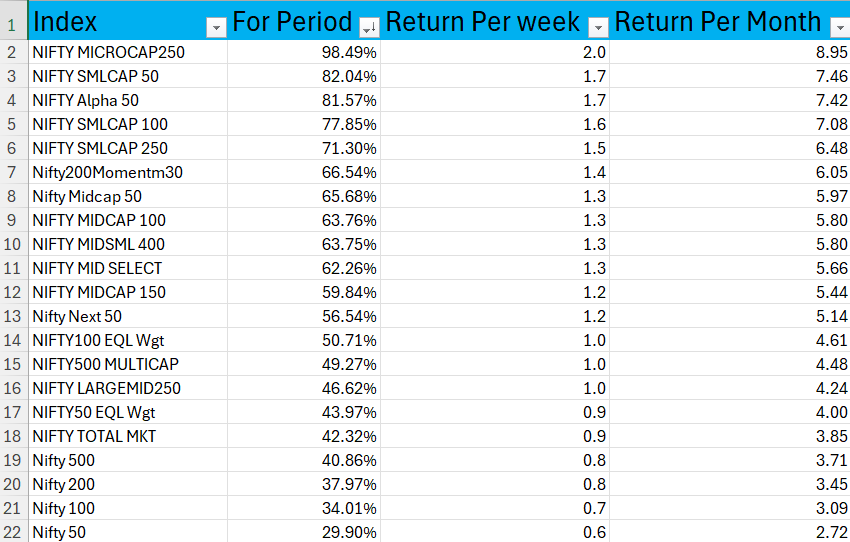
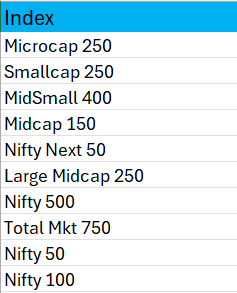
Hello Team @Definedge @@Definedge-Experts @Prashant-Shah
add Fusion matrix like P&F charts
Thanks and Regards
Nishshkumar Jaani
Are you a trend follower ? if yes then this post is for you
as a trend follower traders buy and sell & trade every movements of index or stock particular to get maximum benefit of the every twist and turns of that particular security.
like me you may have also face situation where trend following has extremely favourable time and extremely whipsaw phase
in times of whipsaw phas trade loose two important thing
A-> Capital
B-> Mental fitness
and due to both trader stop following strategy and step into finding another holy grail strategy and keep doing it
The real problem is not in the strategy it has the characteristics of generating super return and whipsaw phase the real problem is to find out the most beneficial period where the strategy has high chance of generating return
A->Fast
B->Easy
C-Consistance
No security has constant trending move ever so as a trend follower one need to findout the
TRENDING Moves where fast-easy-consitance move comes
see attcahed image where i have marked T which is the phase where security has TRENDING move at that time run trendfollwing strategy to get benefit and where there no T this is the phase where stop taking trades
Hope you love reading the article
Thanks and Regards
Nishshkumar Jaani
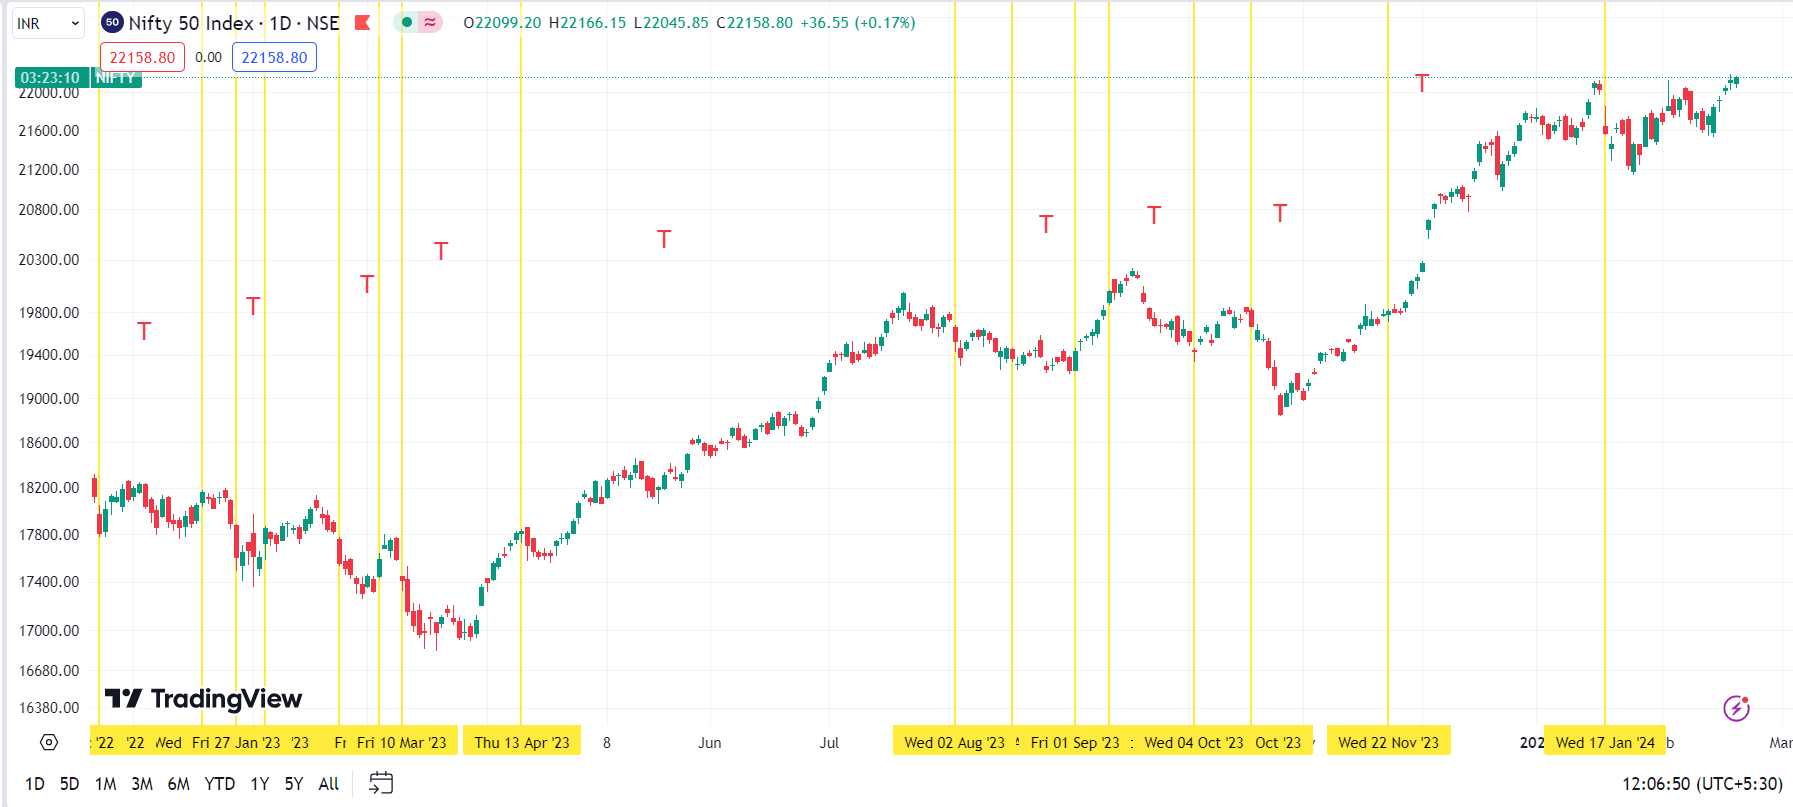
Hello Team @Definedge @@Definedge-Experts @Prashant-Shah sir
Thank you for giving 1 year intra day data -> my suggestion is to create intraday data only portal where few years of data is available -> make it extra paid like Trading view-> as back testing on 1 year and taking trades is not viable where one wants to put serious amount of time & money -> we need larger data which has seen up-down-consolidation trend of various index and stock and across various events like geopolitical as well as local events like election-> so one can have in smaple and out of sample data analysis and know the exat results of the strategy that how it has performed across various market cycle
Hopeing your favourable Response
Thanks and Regards
Nishshkumar Jaani
add all study in weighted avaerage index @Definedge @@Definedge-Experts @Prashant-Shah
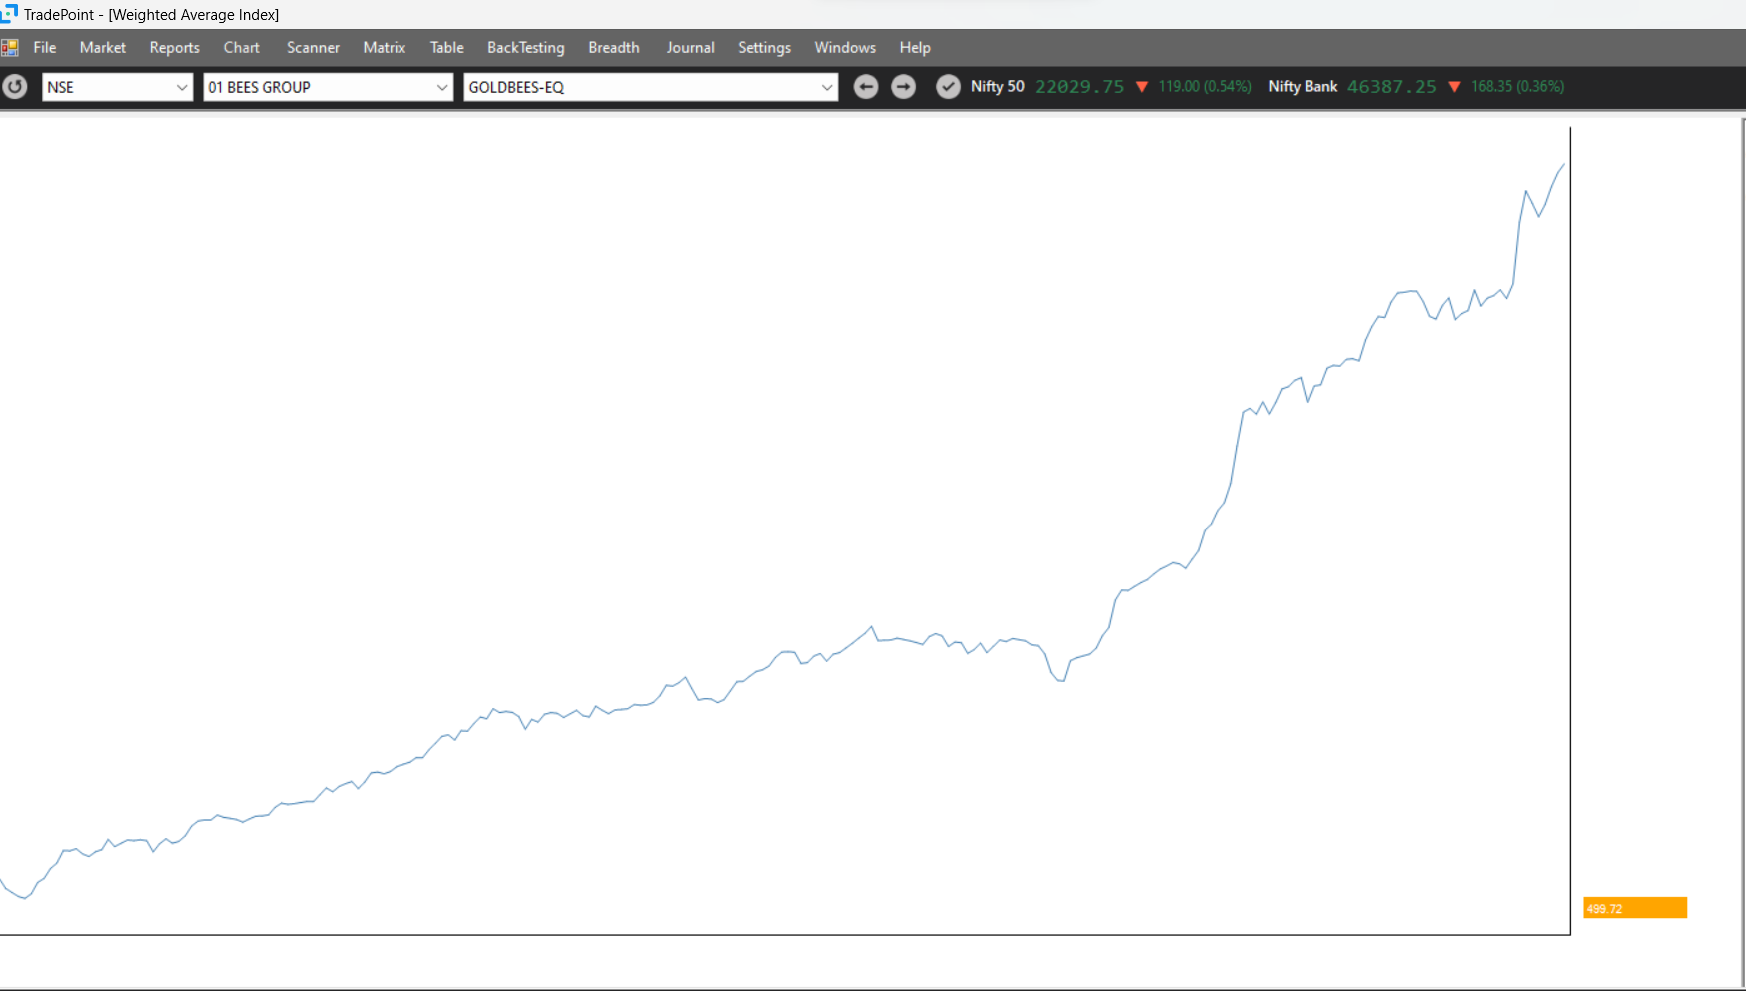
yes they have contacted and solve as it is below for those who dont know like me
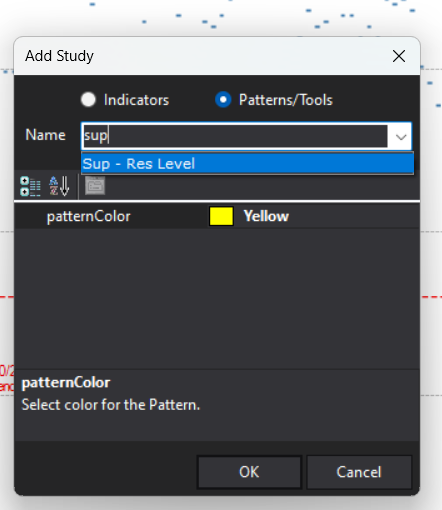
An answer Where to invest
Stay Tune more update soon .....................
#AhmedabadNest #opportunity #ETFs #index #nse #StockMarketindia #index
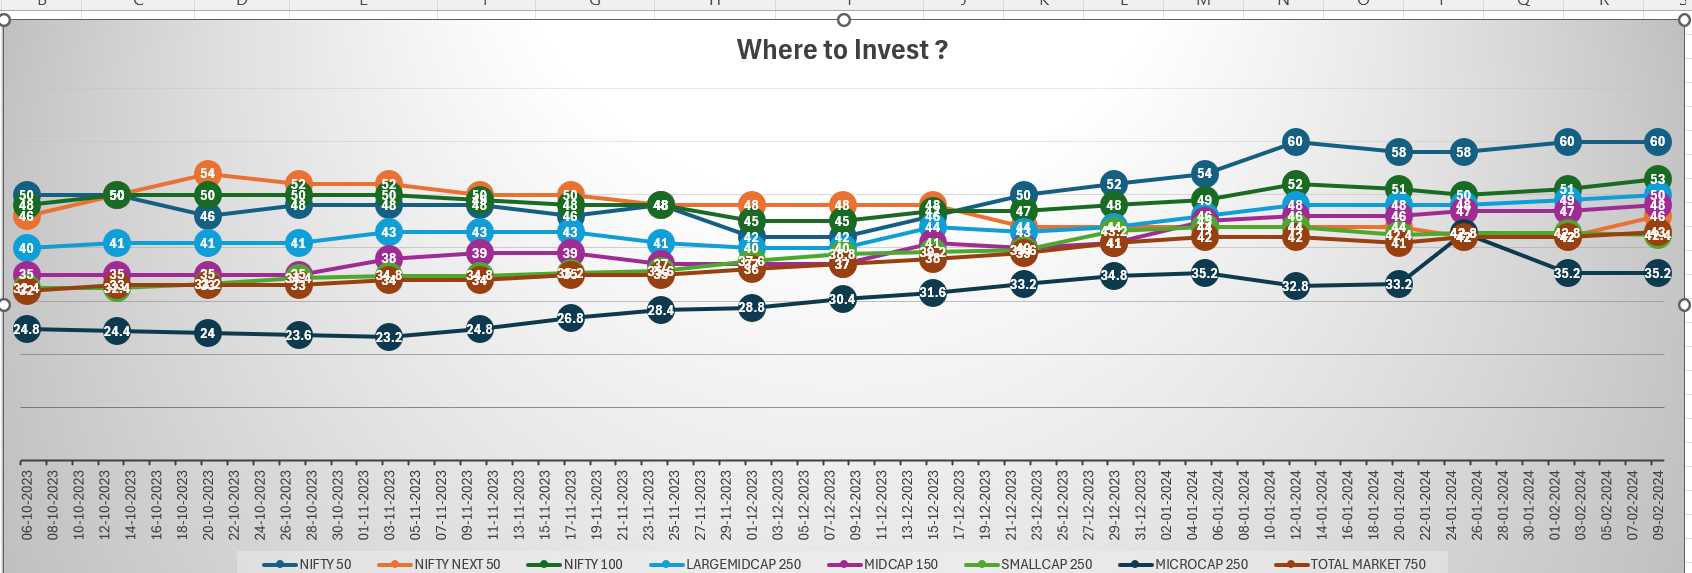
Team @Definedge kindly add facility to plot exat Horizontal levels by writing like trading view give option to both desktop and web version
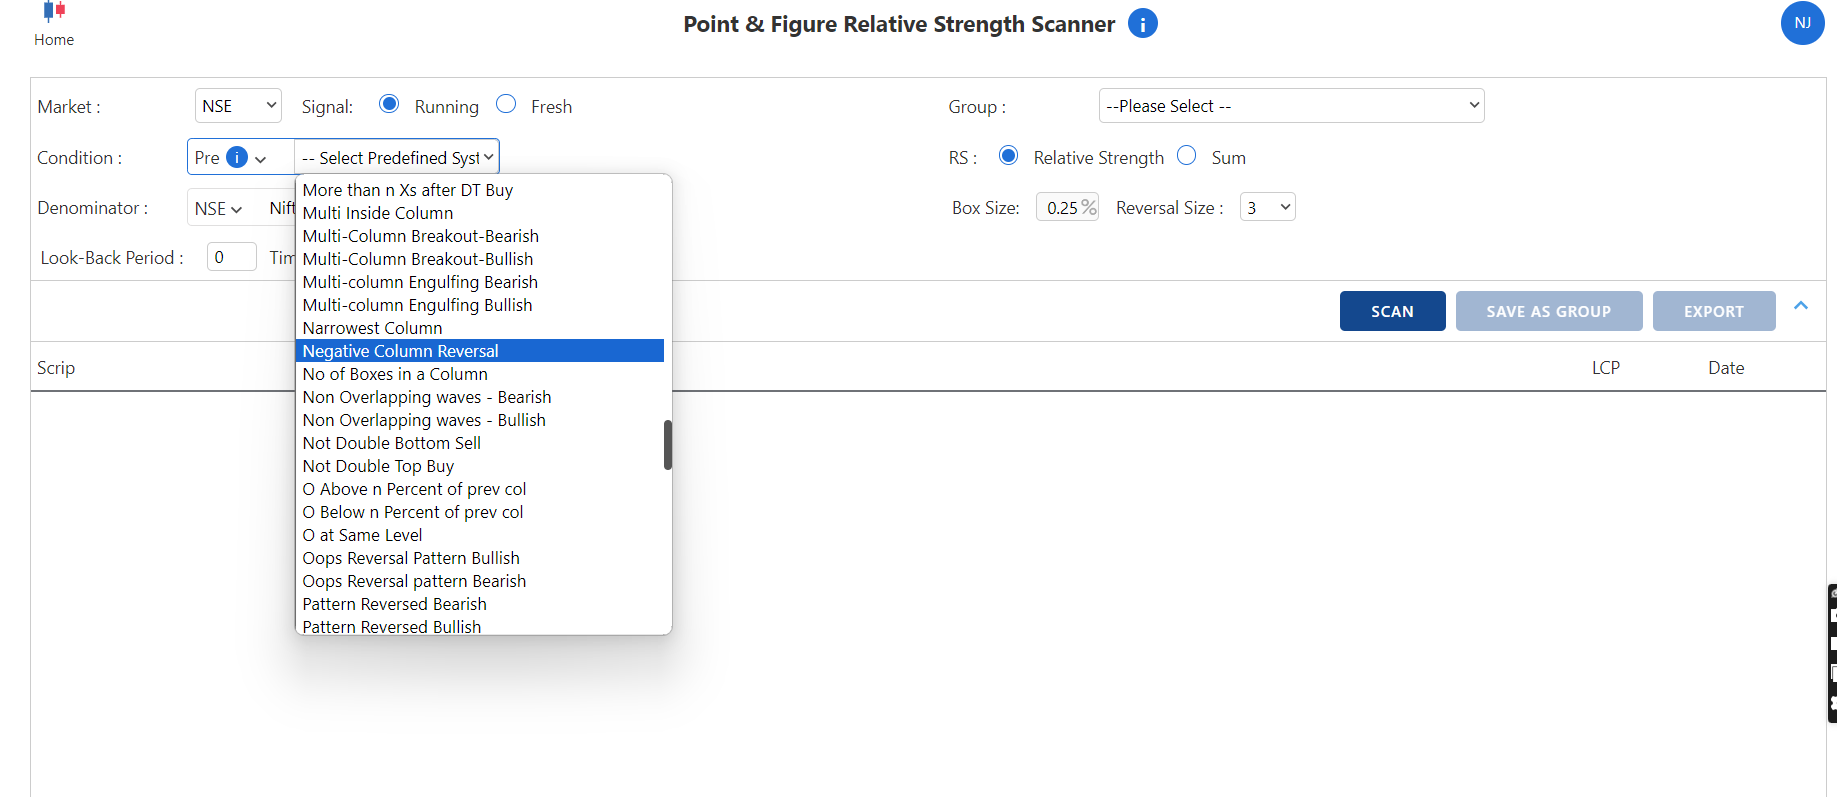
ready made available
#VGM-Trading & Investing | #EDECNOCH2021
Universe of stock Ready to upload in Desktop & Web version link of Presentation
Ride the out performer and make your team strong Stay ahead with my VGM Setup
https://www.youtube.com/watch?v=yUEdH9dlSHg&t=18s
Those who need can mail me on [email protected]
#AhmedabadNest #system #trading #investing #nseindia #RS #relativestrength #StockMarketindia
@Definedge
yes thanks team definedge
when we scan P&F -RENKO chart we have facility to save group based on performance & ranking score total
i rquest to add box size & brick size based score save option currenty i have to scan first then download pick my filtered stock into CSV and upload
@Prashant-Shah @Definedge @@Definedge-Experts
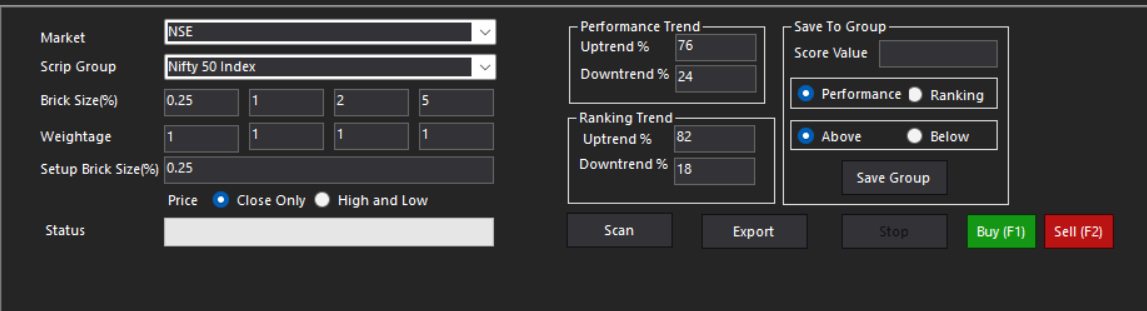
yes
#VGM #Paytm
On Ratio chart since mid of November 2023 it was in Double Bottom Sell now in Bearish anchor Follow Thru
Ride the out performer and make your team strong Stay ahead with my VGM Setup discussed in E-DECNOCH 2021 Sharing link
https://youtube.com/watch?v=yUEdH9dlSHg&t=17s
your feed back /suggestion are welcome at [email protected]
#AhmedabadNest #VGM #SETUP #StockMarketindia #nseindia
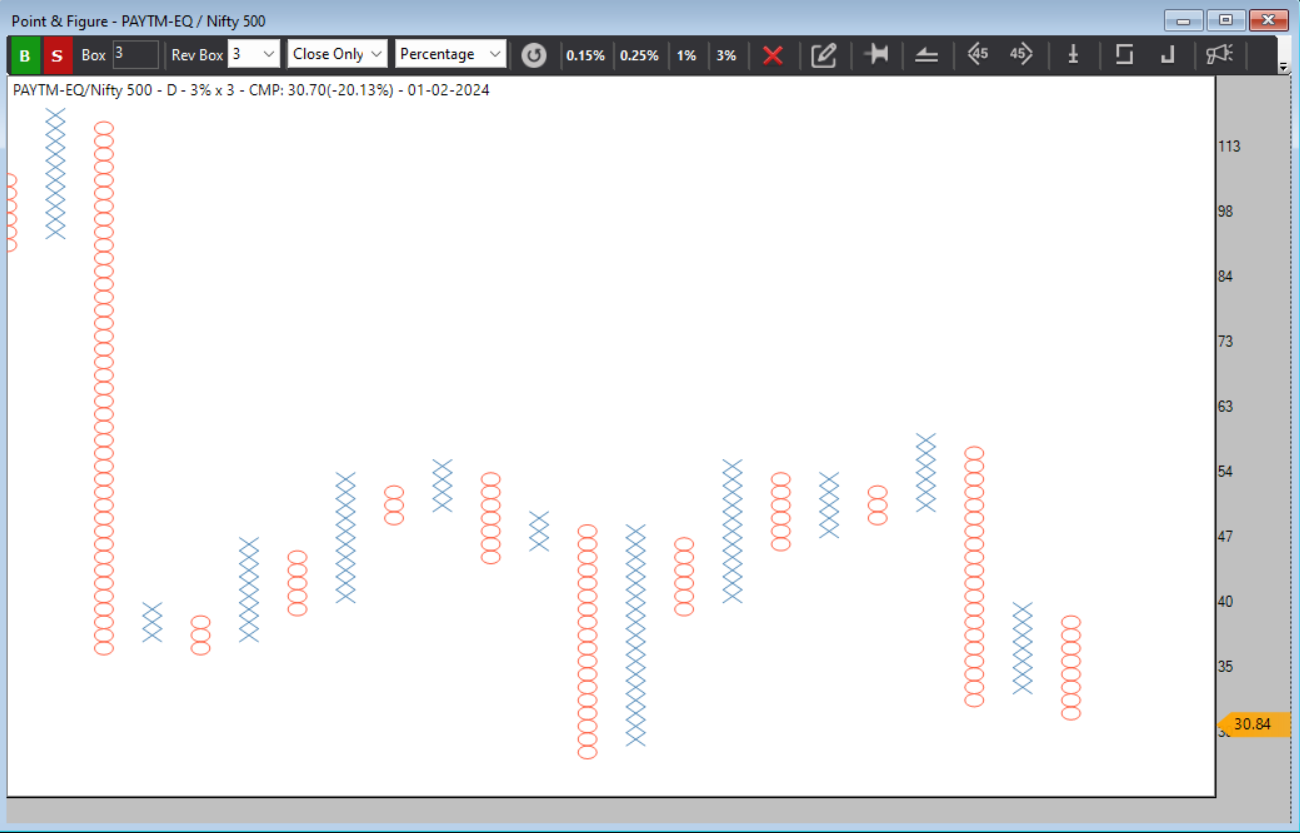
Snapshot of February 2024 Portfolio
An equal weightage of 20 stock portfolio which covers large-mid-small caps across various sectors
Irrespective of market movement it holds 20 stock and re balanced every month
its for passive investors index who dont have time to look for day to day market movements and can follow for long time
Happy for your feedback/suggestions/query at [email protected]
#AhmedabadNest #2024 #yearly #portfolio #StockMarketindia #nseindia #Quant #DataScience #DataAnalytics
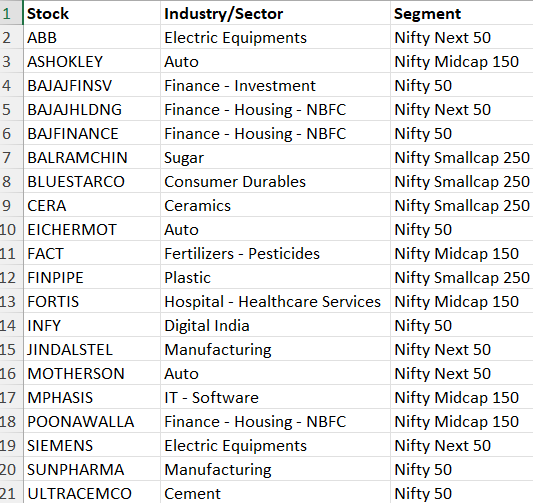
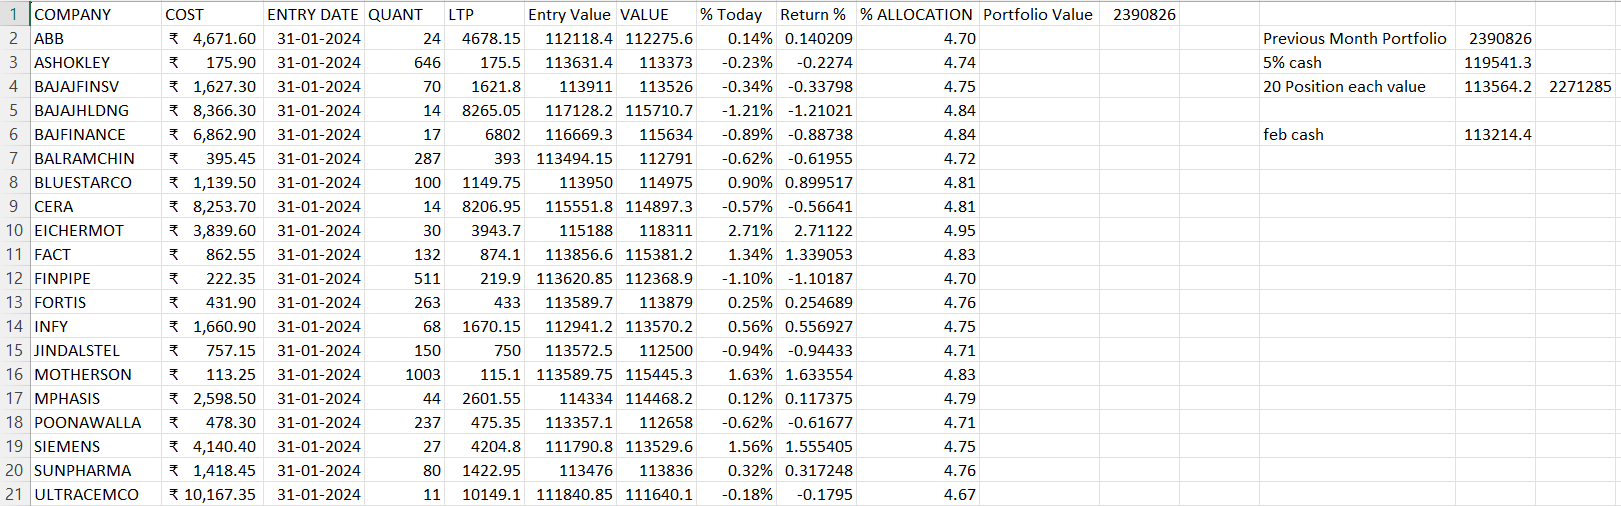
Quarterly Re Balanced Portfolio Series
Sharing 2 portfolios of 20 stock equal weightage-> Next Re balance in April 2024 -> Under serious problem of corporate governance stock will be removed on immediate effect to protect value.
from April 2024 will share the Equity curve of both portfolio and regular analysis of that equity curve on various charting techniques like Candlestic /Ratio/P&F/Renko etc
will be happy to address your valuable feedback/suggestions and query on [email protected]
#AhmedabadNest #portfolio #factor #Momentum #DataAnalytics #nseindia #StockMarketindia #India
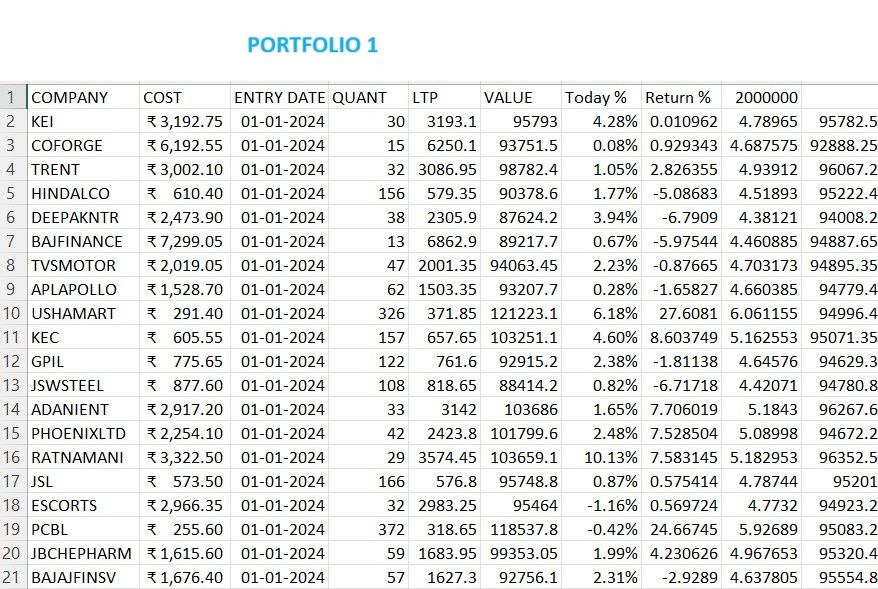
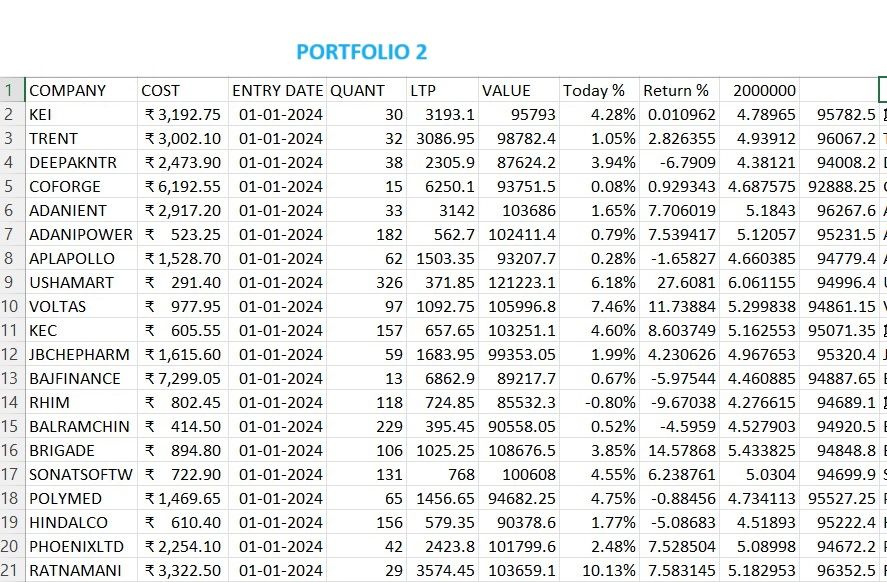
#VGM #Hindunilever
As per Value Growth Momentum concept it was in Bearish anchor Follow Thru sell and below MAST indicator since 2021
Ride the out performer and make your team strong Stay ahead with my VGM Setup discussed in E-DECNOCH 2021 Sharing link https://youtube.com/watch?v=yUEdH9dlSHg&t=1s
your feed back /suggestion are welcome at [email protected]
#AhmedabadNest #VGM #SETUP #StockMarketindia #nseindia
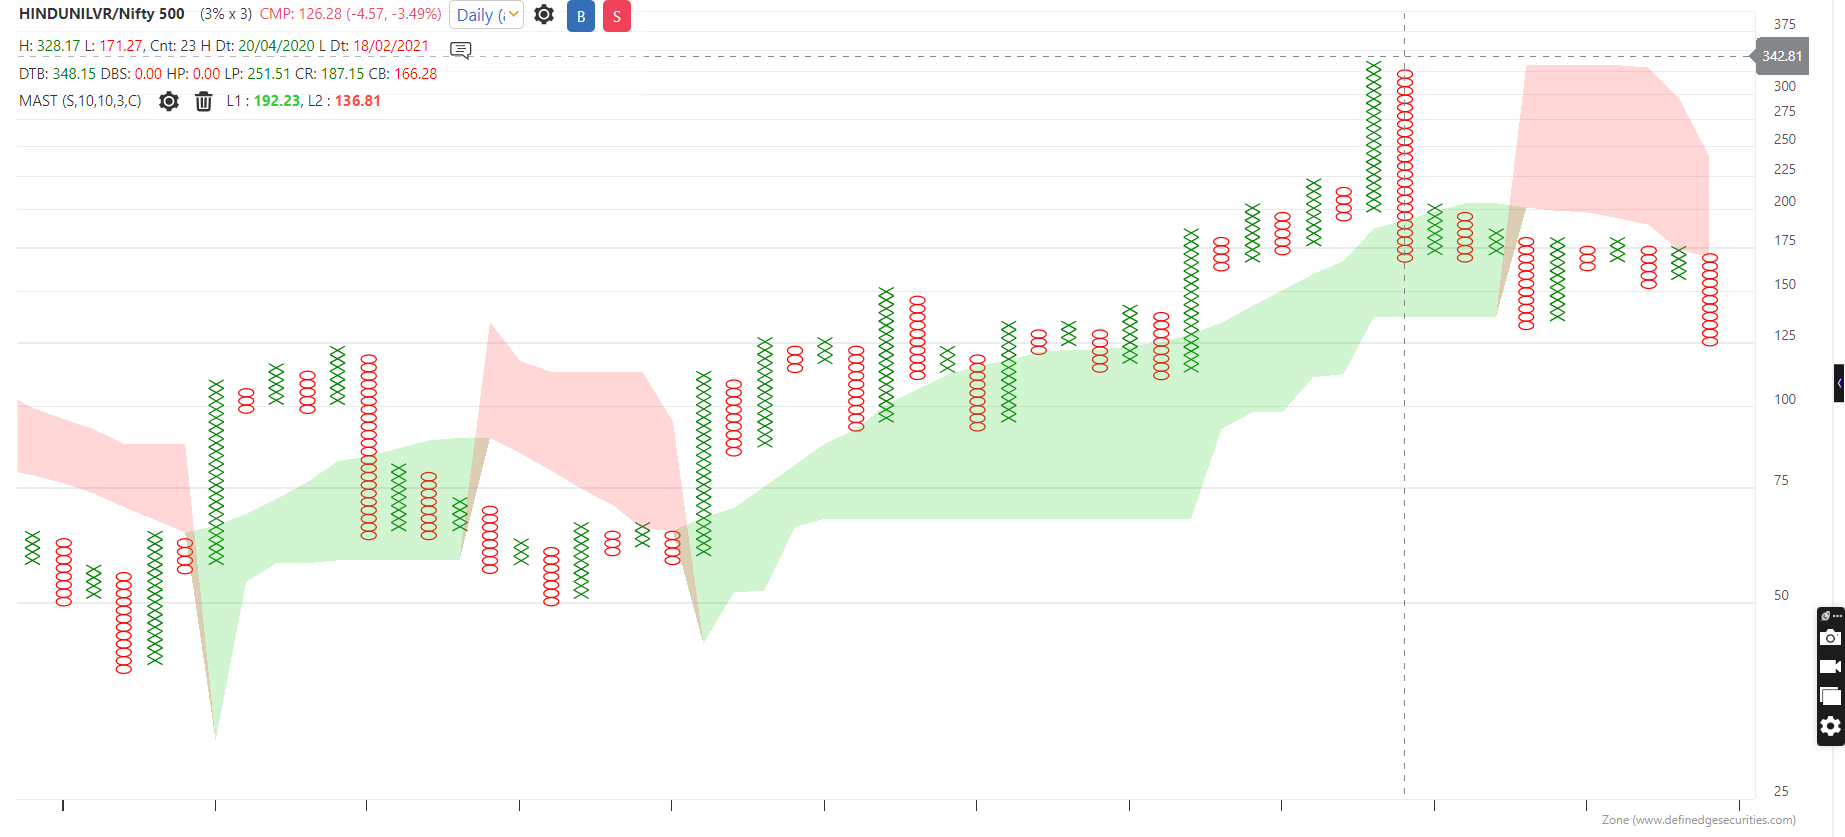
Not available anywhere -in forum and various social media platform i will update time to time
Simple -> is conterian indicator
when R GD Breadth is in Golden crossover->Mkt is bearish
When R GD Breadth is in Death Crossover->Mkt is bullish
the way its is diverging seems in next 2/3 week it may have Golden cross over and mkt top
when this indicator is bearish look for shortning
when this indicator is bearish look for long opportunities as per the owns setups weather in candle/P&F/Renko This is the condition where system has high success ratio
soon will share the dates and can see the various sectors perform in Death & Golden cross over so can have idea
Distribution activity !
look at Nifty 500 price chart and my R GD Breadth chart
same structure happening like 2021 top
when mkt rising in one way this indicator has given golden cross in november 2021 and mkt suddenly made top -currently very close to give golden cross over
#AhmedabadNest #breadth #divergence #analysis #StockMarketindia
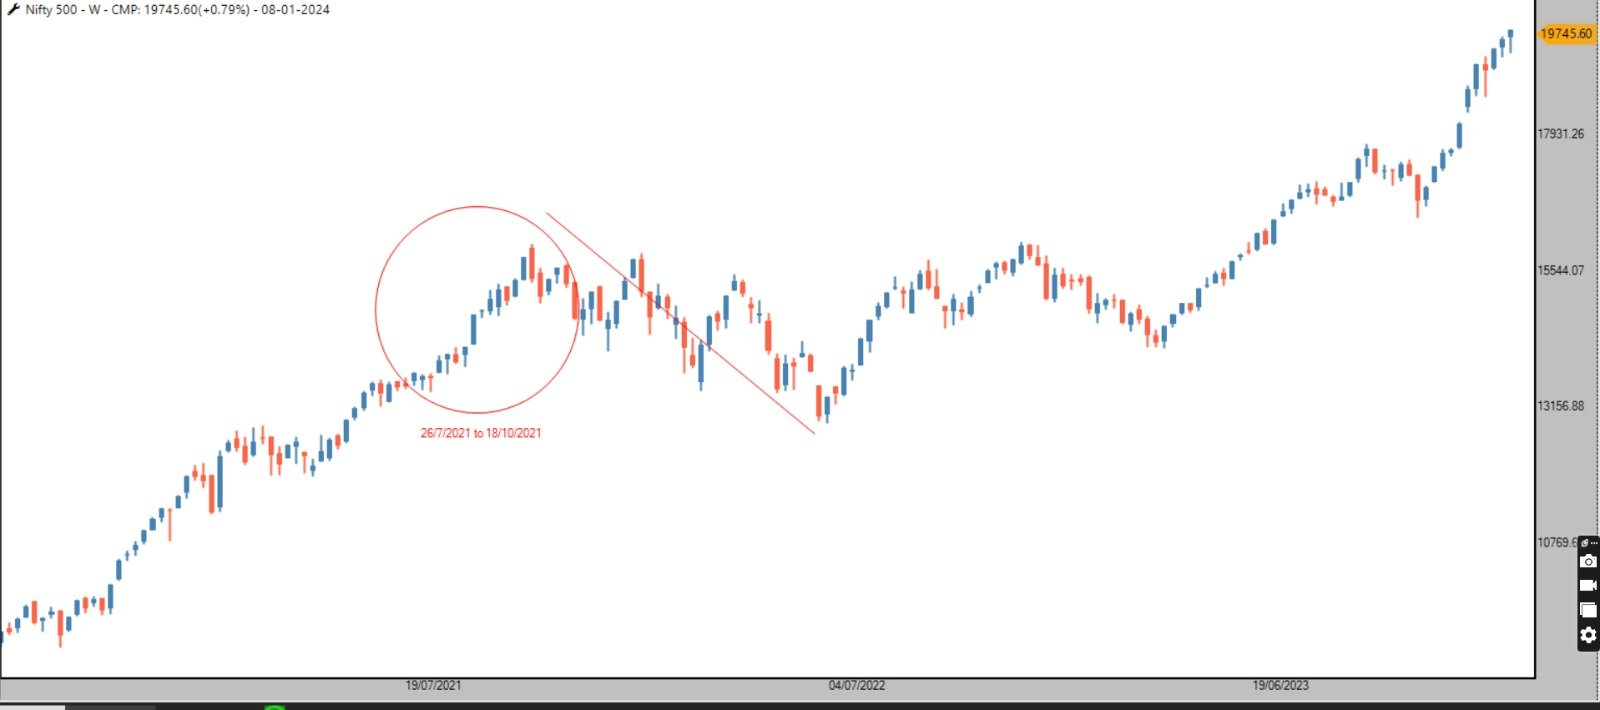
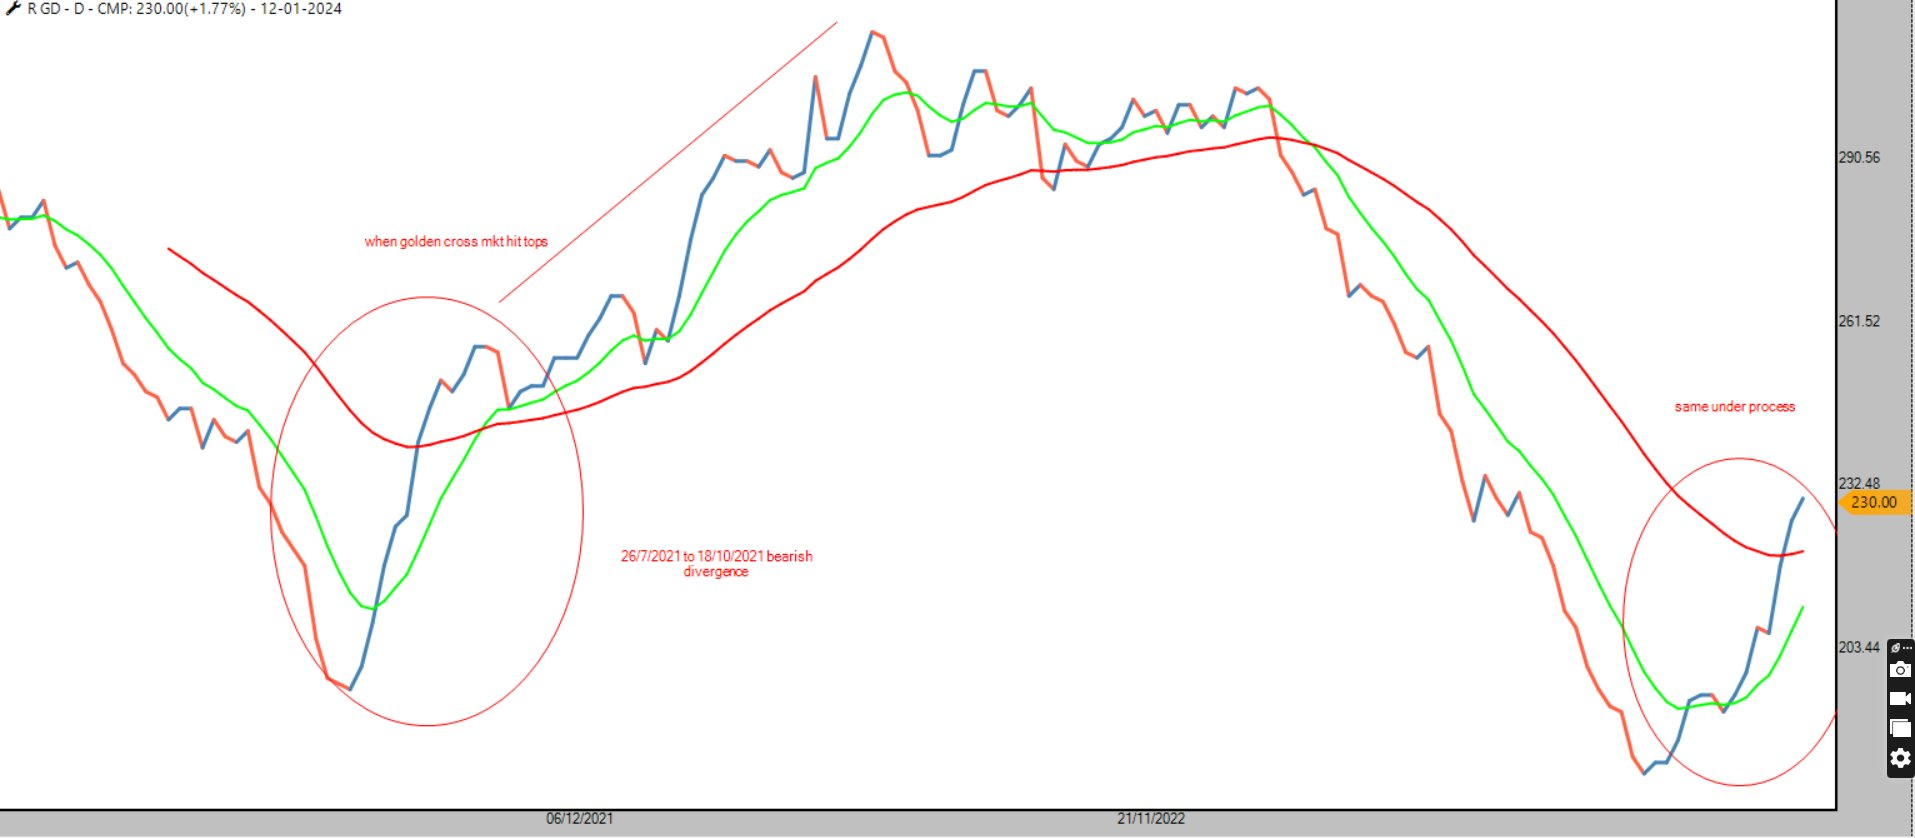
Nifty Spot
There is negative divergence on RSI now break below the Rising trendline with big bearish candle can create havoc and can fill the gap of 20300
#AhmedabadNest #Nifty #StockMarket #analysis #StockMarket #india
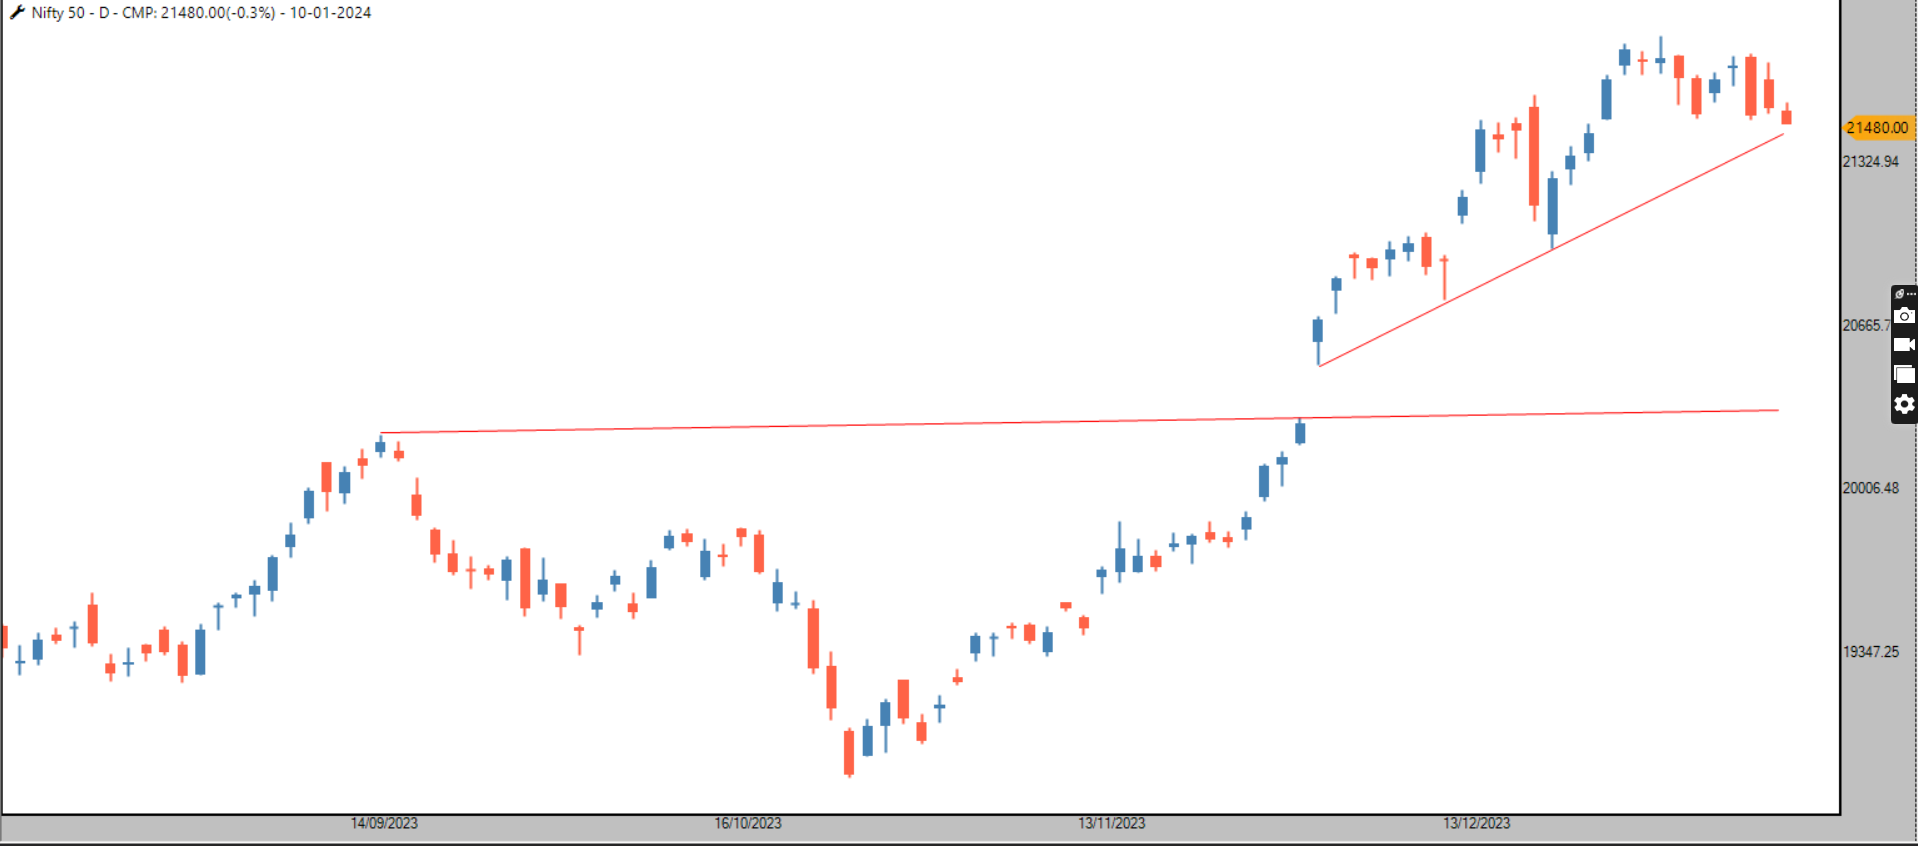
@Prashant-Shah @Definedge @@Definedge-Experts make dedicated portal where number of years intra day data available and one can do back test -make it chargable so those who wants it can have that data lets say i wants to back test P&F 0.25% entry exit based on MAST indicator for last 10 years then i dont have the data and based on its performance i can manage my position sizing like kellys formula also Thanks
Snapshot of January 2024 Portfolio
An equal weightage of 20 stock portfolio
Irrespective of market movement it holds 20 stock and re balanced every month
its for passive investors index who dont have time to look for day to day market movements and can follow for long time
#AhmedabadNest #2024 #yearly #portfolio #StockMarketindia #nseindia #Quant #DataScience #DataAnalytics
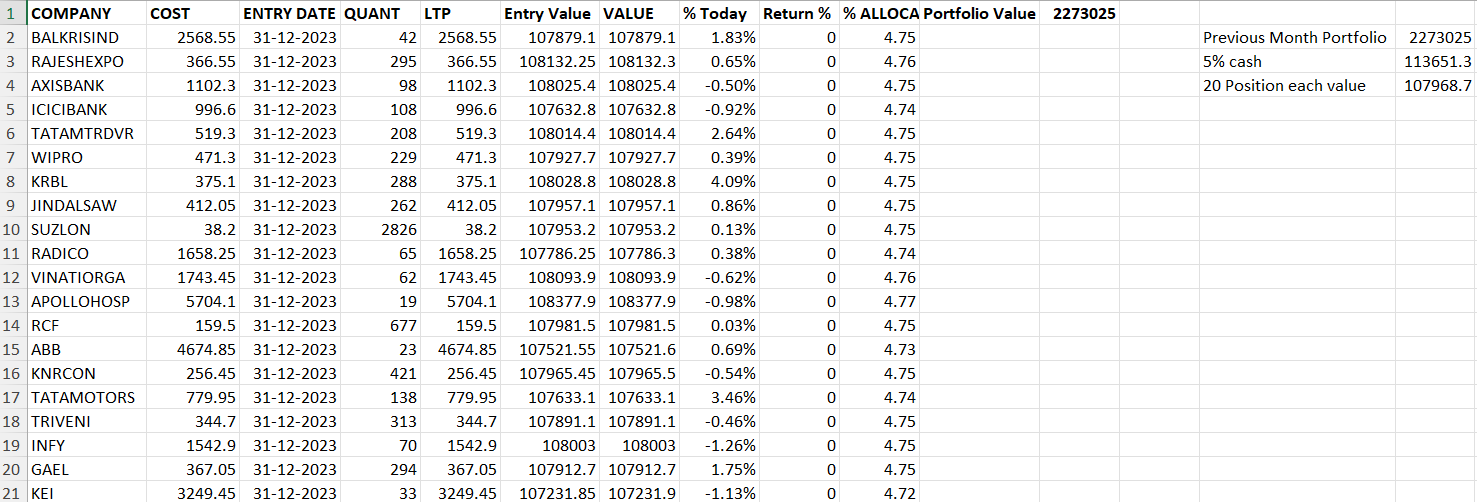
Portfolio for 2024
20 stock equal weightage 2 model portfolios
No re balance required -will remove if significant event like merger or serious corporate governance issue happen
#AhmedabadNest #2024 #yearly #portfolio #StockMarketindia #nseindia #Quant #DataScience #DataAnalytics
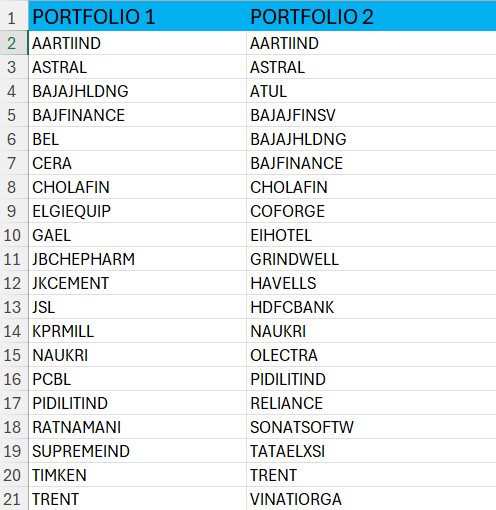
Hello @Prashant-Shah sir @Definedge @@Definedge-Experts
i request you to increase the no of bars to 50 in ratio trend matrix from current 30
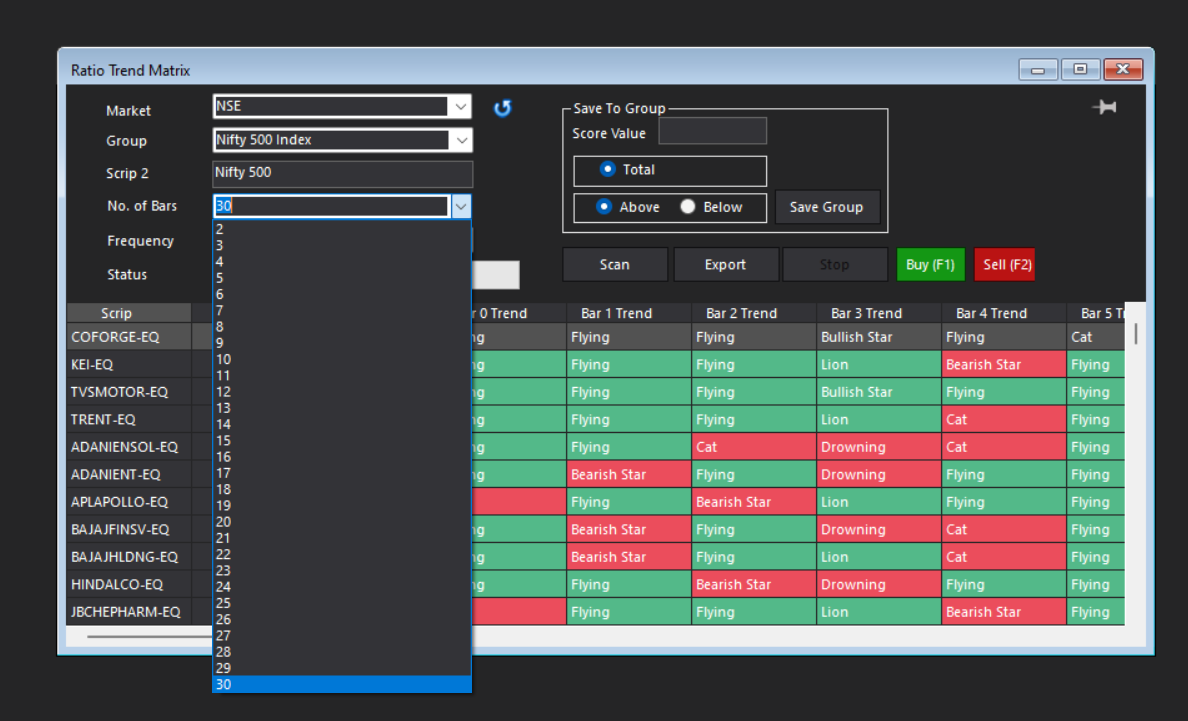
kindly check there is serious problem in web version compare to desktop of securities
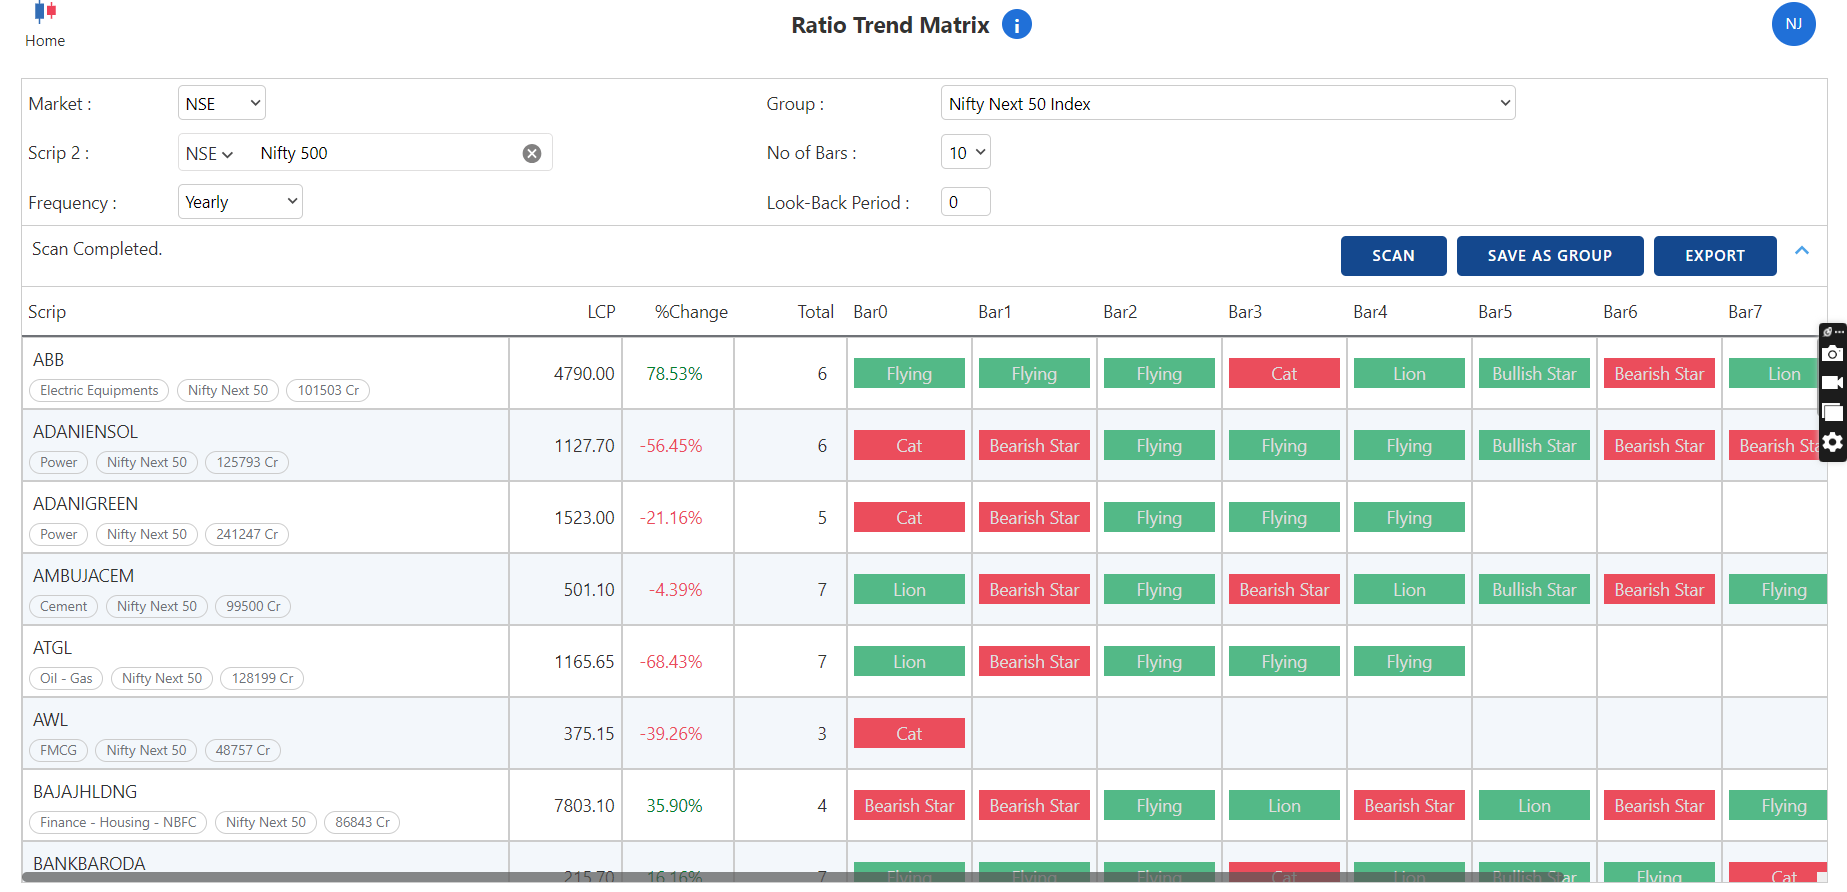
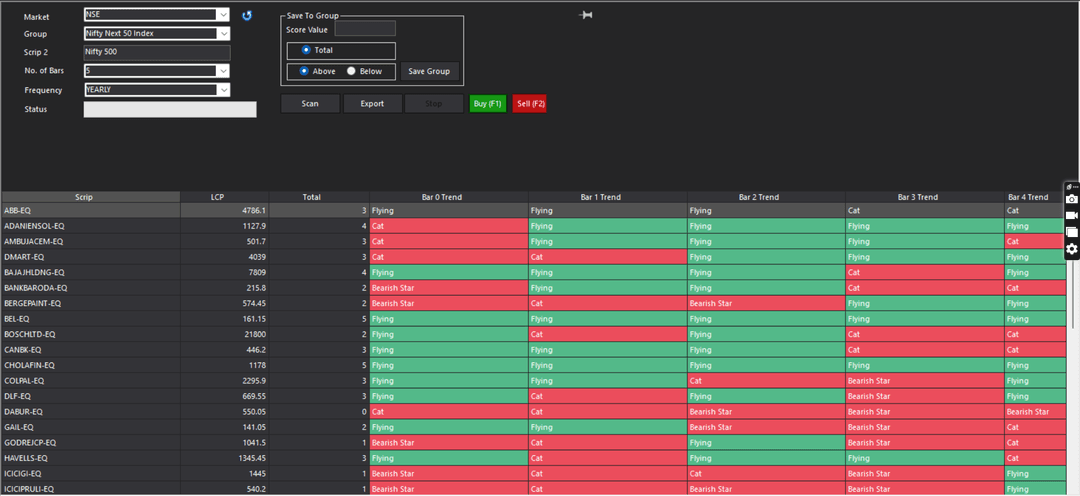
see the attached image-in last year there is both pattern Lion & Flying as per rule only one can happen either lio or flying as per RS book when Denominator is same, last year denominator was Up so two condition can happen Flying or bearish star but lion can not happen when deniominator is up ,lion happen when denominator is down and numerator is up
in current year all MF which i selected are out performing but showing bearish star example
nippon india growth has generated 42 % return against nifty 500 of 21 % still showing bearish star instead of flying
kindly look into it @Prashant-Shah @@Definedge-Experts @Definedge
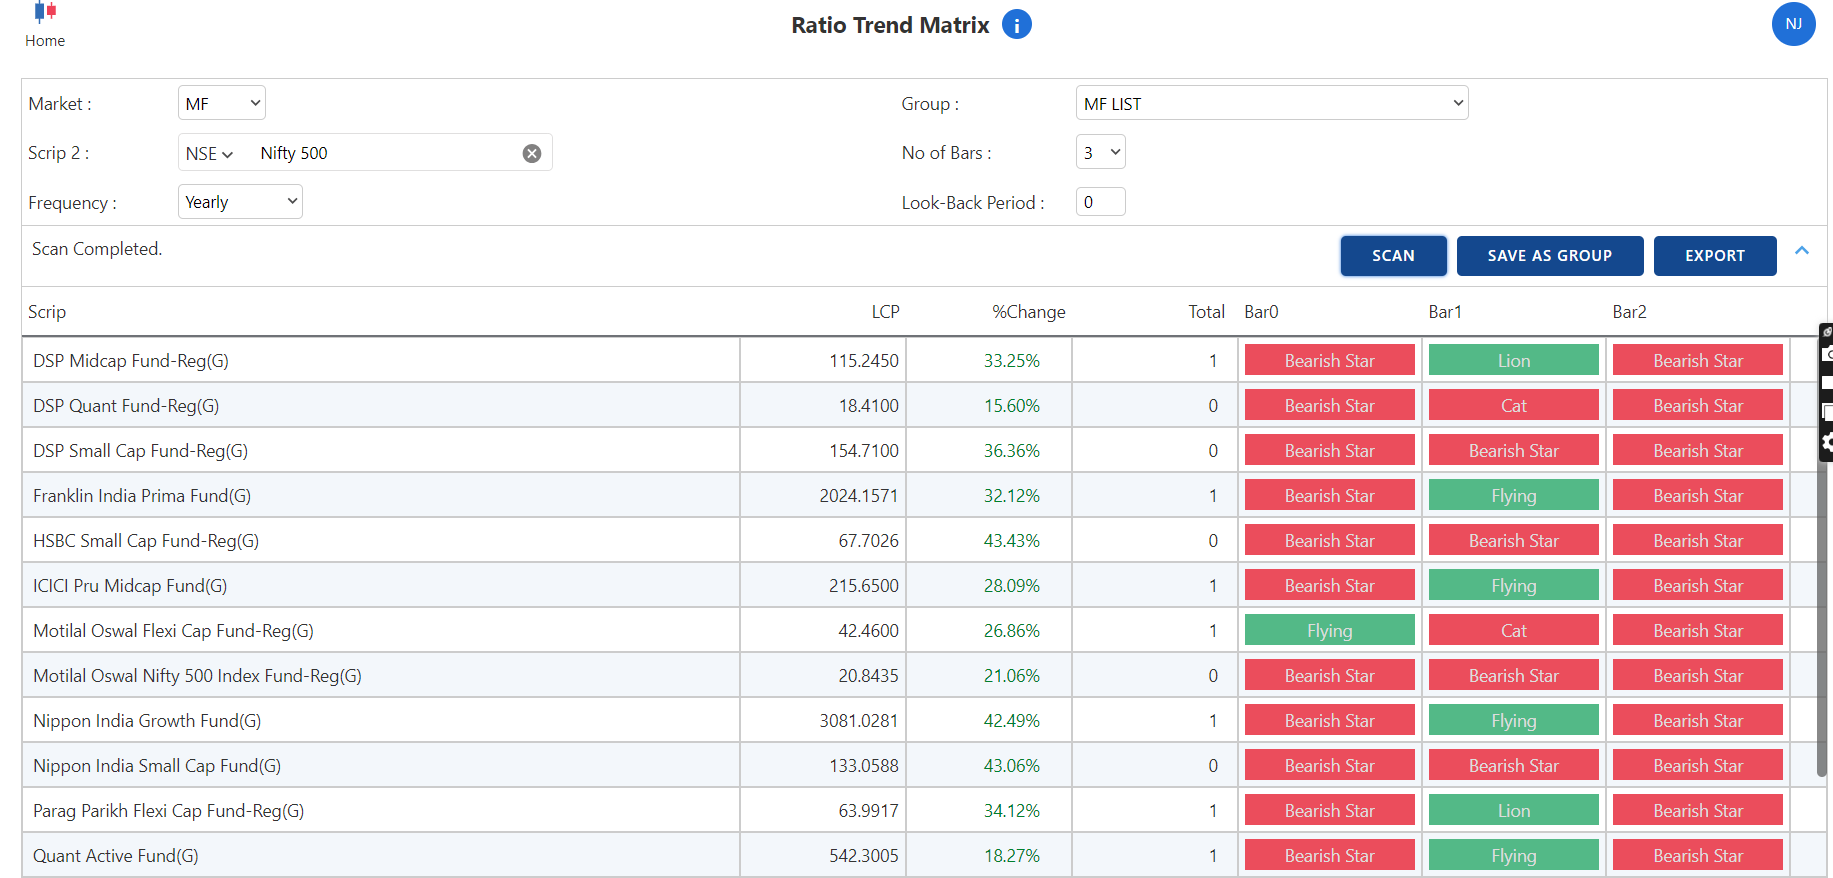
Hello team definedge we have very goof facility of backtesting in software -very intresting position sizing calculator also which helps a lot
currently we have only BSE-NSE stock only please add Mutual fund also as we have back testing facility there also so we can have position sizing there also
@Prashant-Shah @Definedge @@Definedge-Experts
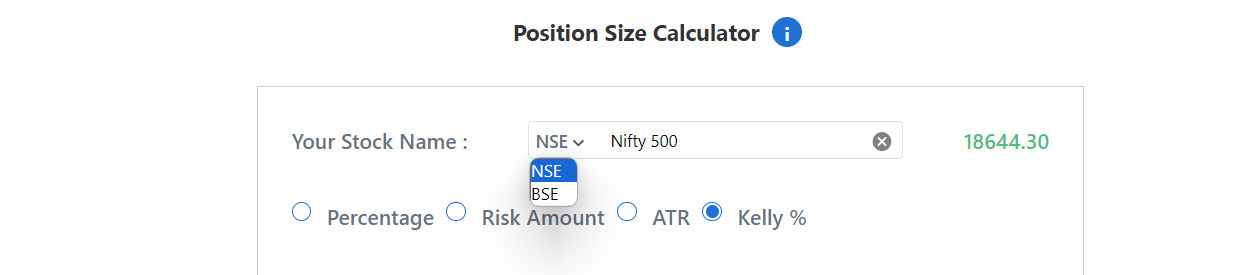
Give date selection tab also along with period that will help
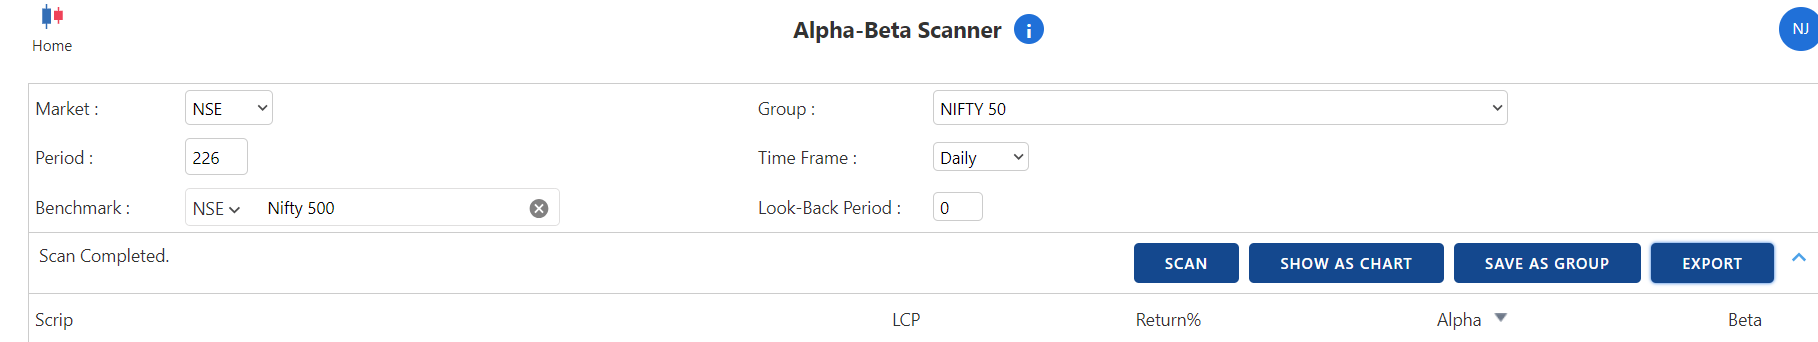
Some tiem ago there was Multi denominator RS scanner but i am not able to find out
kindly help me @Definedge @@Definedge-Experts
congrats from #AhmedabadNest
in back testing give export option so one can sort best stock based on many factors like
Total minimum trades,ave return,success ratio,expetancy and make list to mimum
@Prashant-Shah @Definedge @@Definedge-Experts
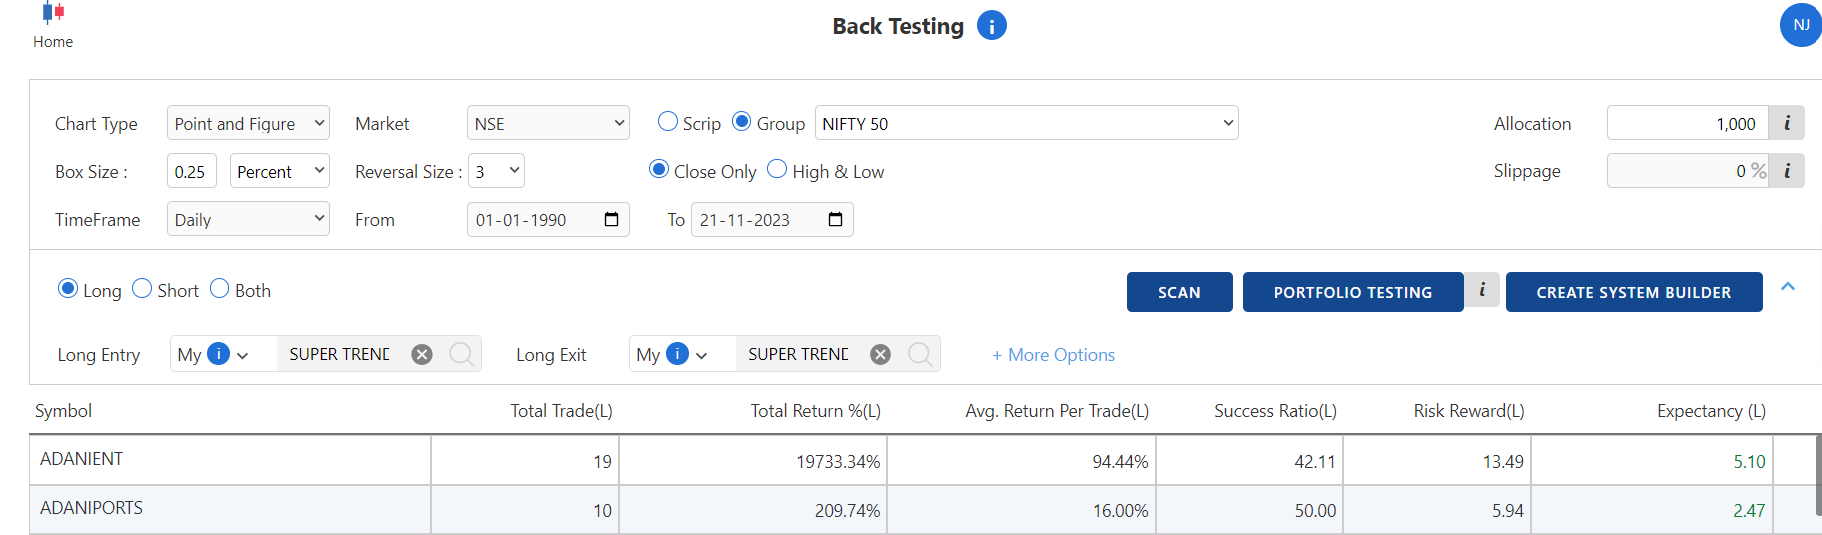
In Ultimate Matrix of P&F -Renko for look back period give date selection tab so one do not need to calculate how many days he needs to go back he just can select this dates like i run of may be thursday so i have to calculate past days from current and with this i need to remember the trading holidays also otherwise result will be wrong so give direct date
plus rise the look back period from 100 as we are having the data with us ,if not possible on web version give in Desktop
@Prashant-Shah @Definedge @@Definedge-Experts
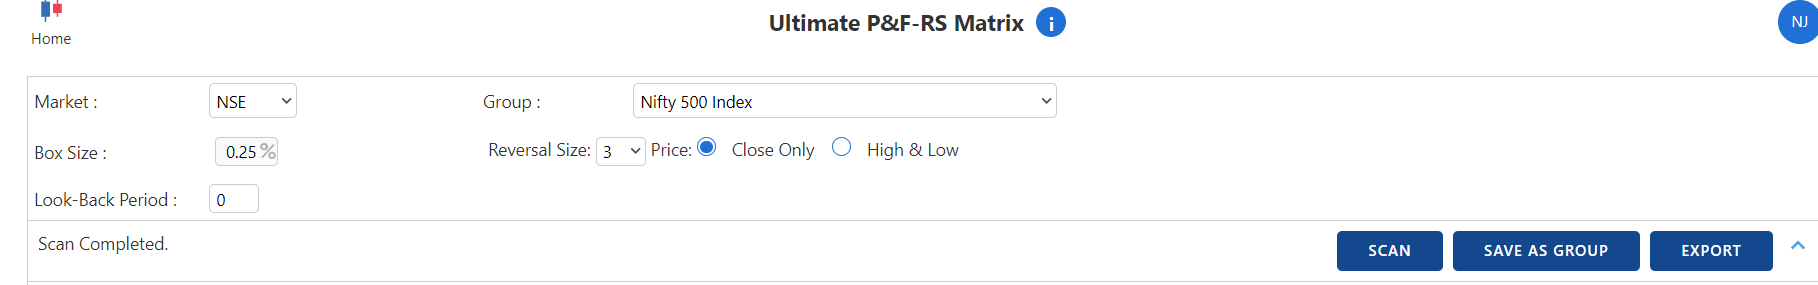
please add save option in back testing feature-lets say i wants to crete group with X% success ratio,minimum expetancy ration,RR etc @Prashant-Shah @@Definedge-Experts @Definedge
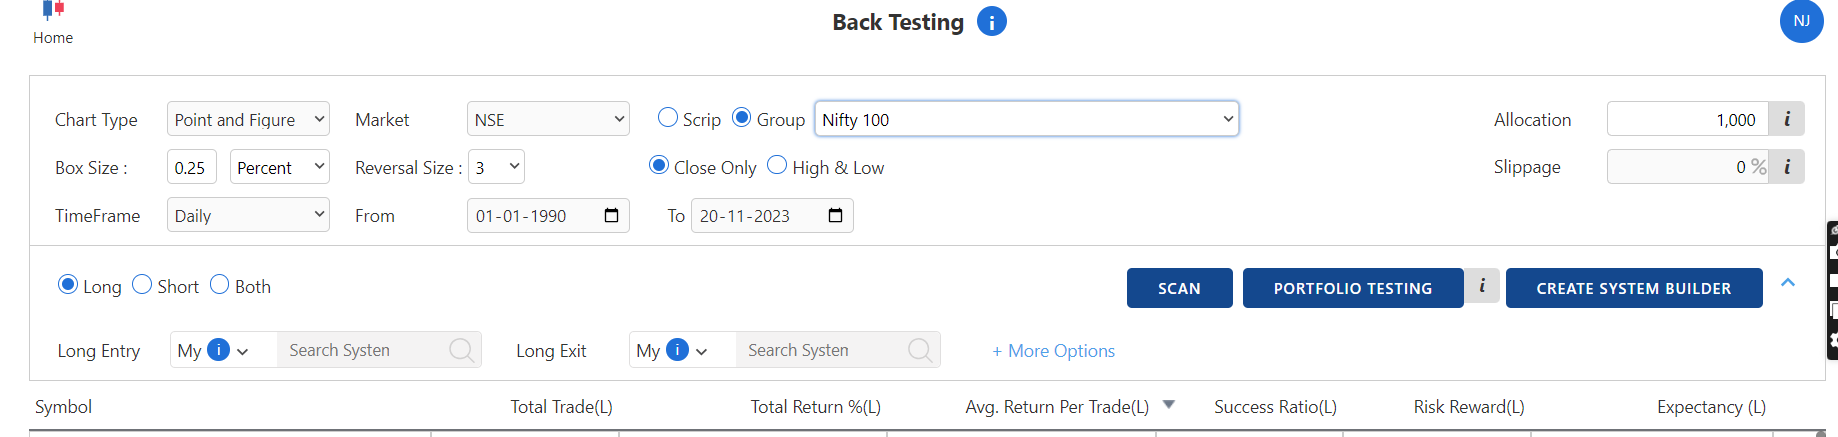
in multi chart scanner add Renko RS also ,like P&F RS @Prashant-Shah @@Definedge-Experts
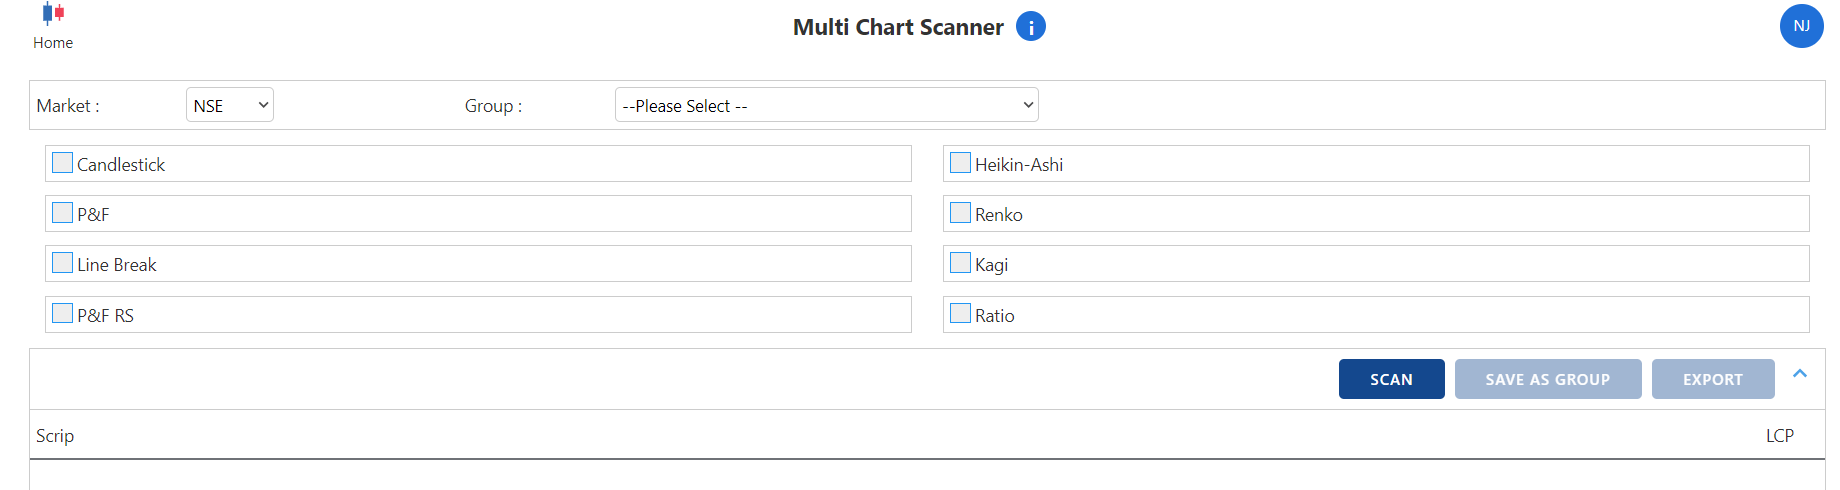
ALERT -Pullback Complete ?
on 26th October alerted Dead cat Bounce
https://x.com/Nishshkumar/status/1717419973067329676?s=20
Nifty 19250 Bank Nifty 43000 (Spot)
close below will confirm the pullback seems over and will head lower to respect H&S and Double Top pattern and probable targets are 18400-40000
#AhmedabadNest #nseindia #nifty50 #bank #analysis #patterns
#SPX -LT LB Formation
S&P 500-US Mkt
observe Dow theory lower top lower bottom formation resistance placed at 4390 on closing basis
as long as this pattern is valid in simple term its is in downtrend
last time H&S Pattern from top achieved targets and now bounced
#AhmedabadNest #spx #USA #market #analysis
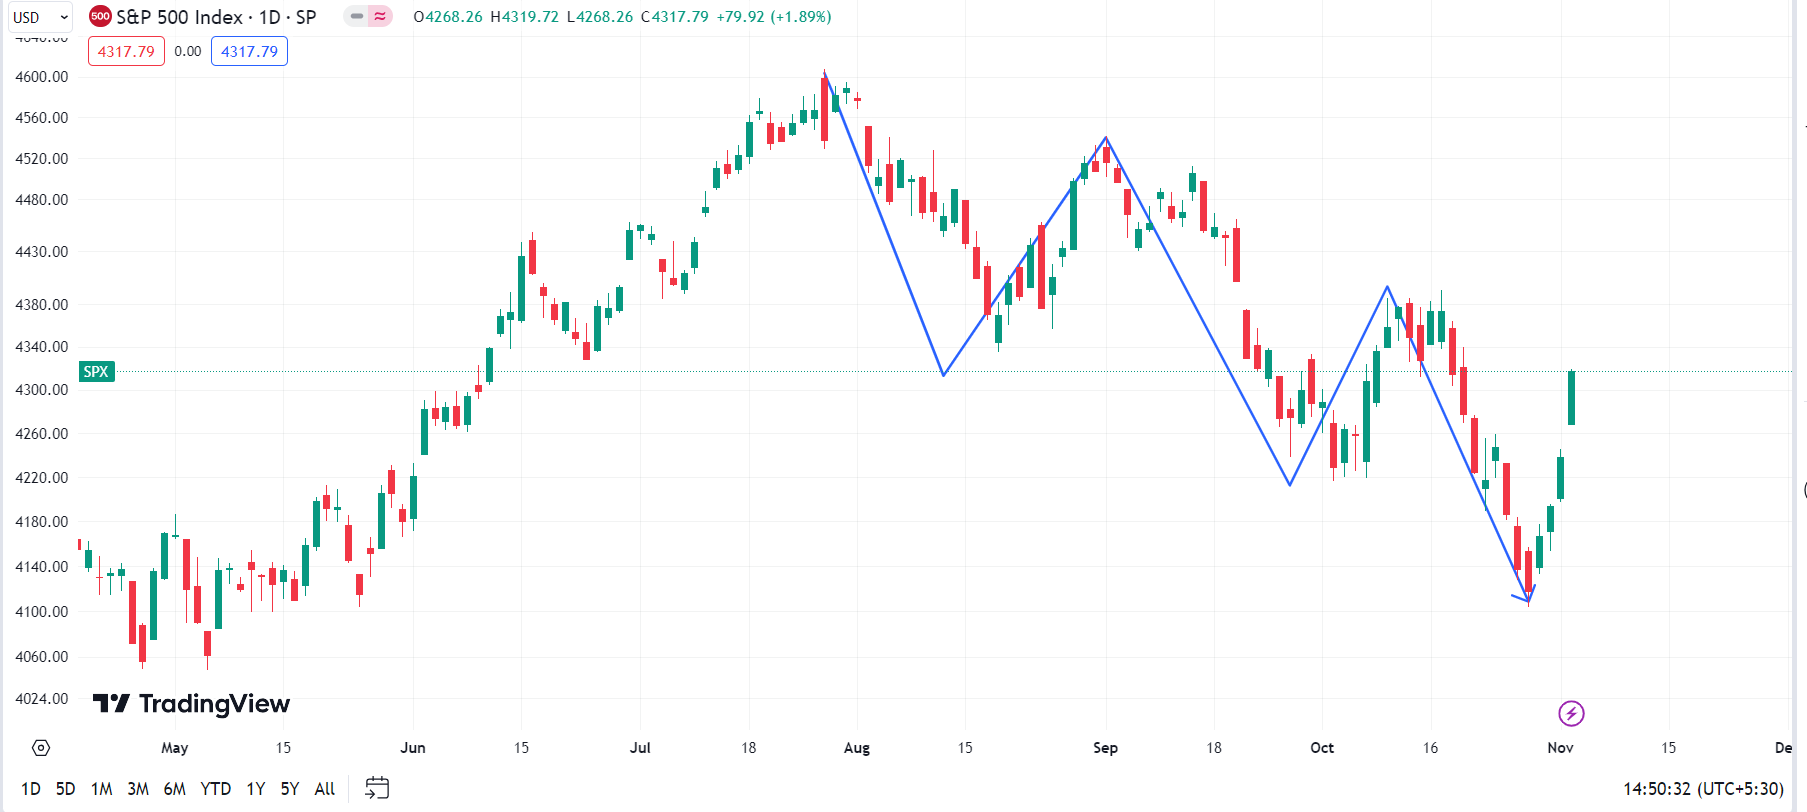
Pattern observation Analysis
Bank nifty-Double Top formation trading below neckline
Nifty active Head & shoulder pattern trading below neckline
This rounding pattern have tendancy to test the neckline which is know as pullback
as long as not getting any bullish pattern we have to respect current pattern
#AhmedabadNest #Nifty #banknifty #StockMarket #analysis #india #patterns
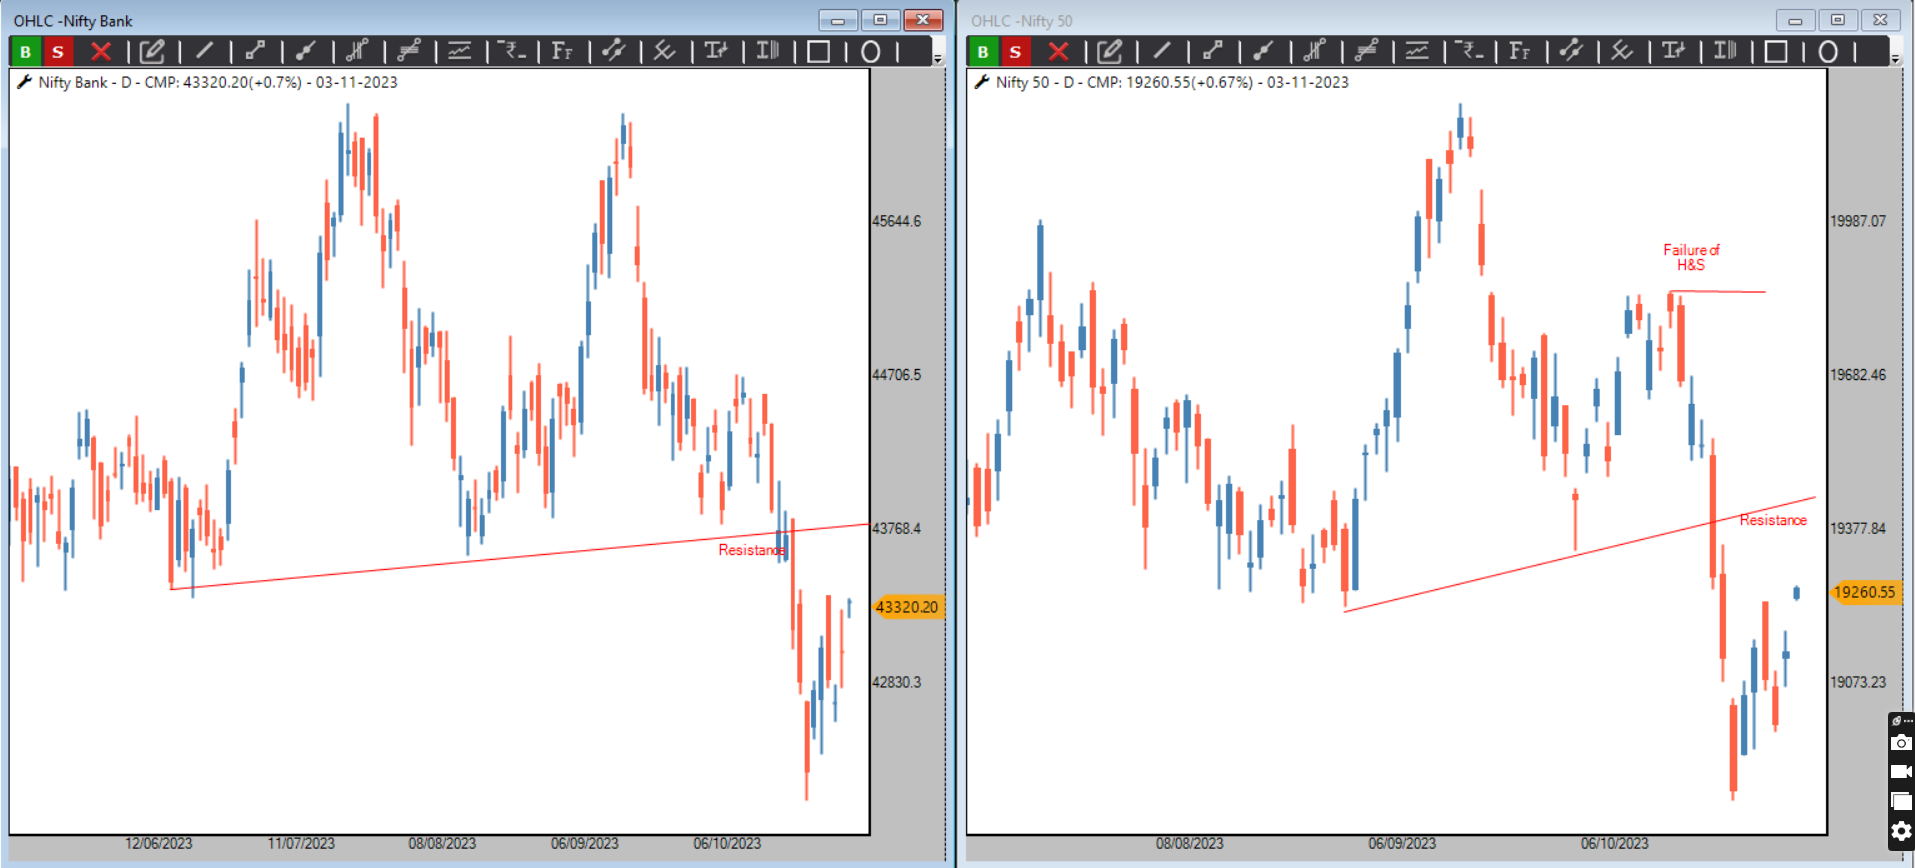
Nifty Bank & Nifty analysis
Common for Both -Trading below 10 SMA,Both have formed large bearish anchor,Both trading below Anchor points,Both has not got bullish follow thru above anchor column and in correction
Level wise analysis
Bank nifty -Anchor point resistance
@43850
,Bearish anchor column negation
@44650
Bearish breakout follow thru below 422235 for 40136-38085
Nifty-Anchor point resistance
@19420
,Bearish anchor column negation
@19813
Bearish breakout follow thru below 18846 for 17981-17139
No biasness Only levels to act upon
Be open minded & adaptive
#AhmedabadNest #analysis #StockMarketindia #Nifty #banknifty
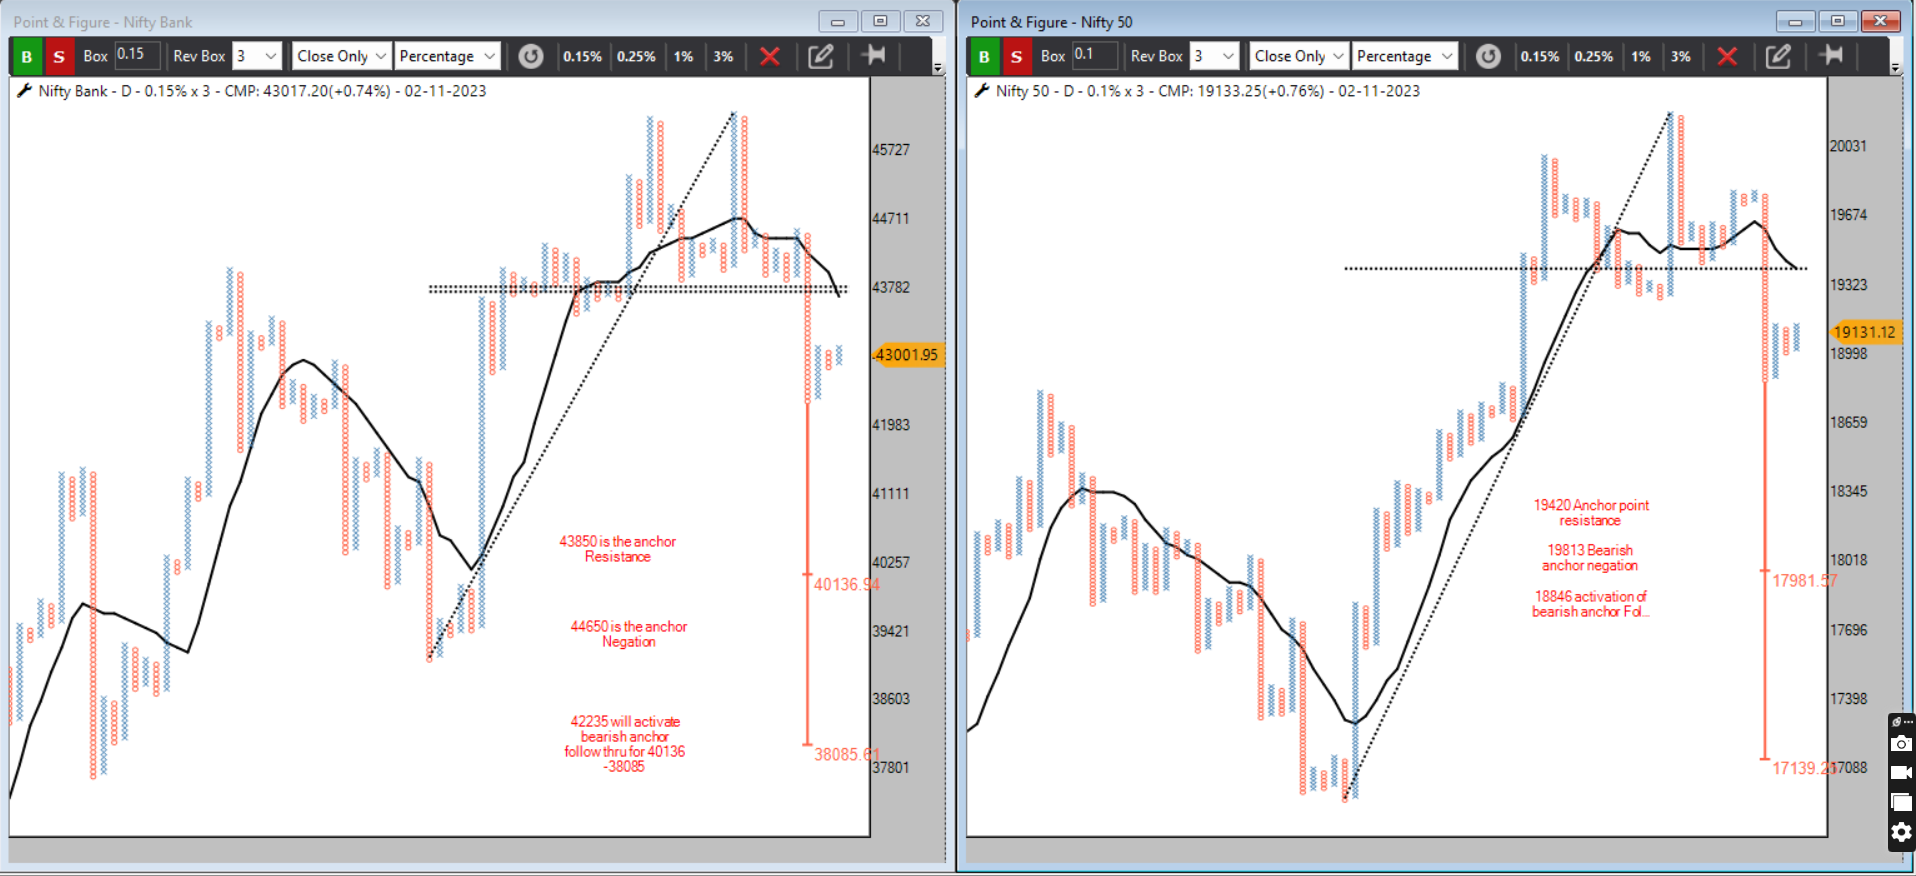
yes that possible but u need to scan another thing that can be incoporated in same scan for faster analysis
yes thanks a lot
and based on that i can have breadth data bullish PMOX(stock above 75 + Netural zone ) -Bearish PMOX(stock below 25 + Netural zone )
Today shown Raju sir video on PMOX very good analysis
Stock Gives Bullish Momentum & oversold in bullish momentum AND Bearish momentum & over bought in bearish momentum
after that it goes into NETURAL zone between (75 to 25 )
when i scan it will show me oversold-over bought & bearish bullish momentum but after that PMOX indicator will fall into netural zone now in that condition i have to manually go and check weather stock is in netural zone after bullish & bearish momentum that will be time consuming
so my suggestion is that when PMOX is in netural zone put lable that this netural zone is followed by Bullish or bearish momentum so i can plan my entry
see chart of BHEL currently in netural zone but that is after Bullish momentum that i have to check charts by charts
@Prashant-Shah @@Definedge-Experts
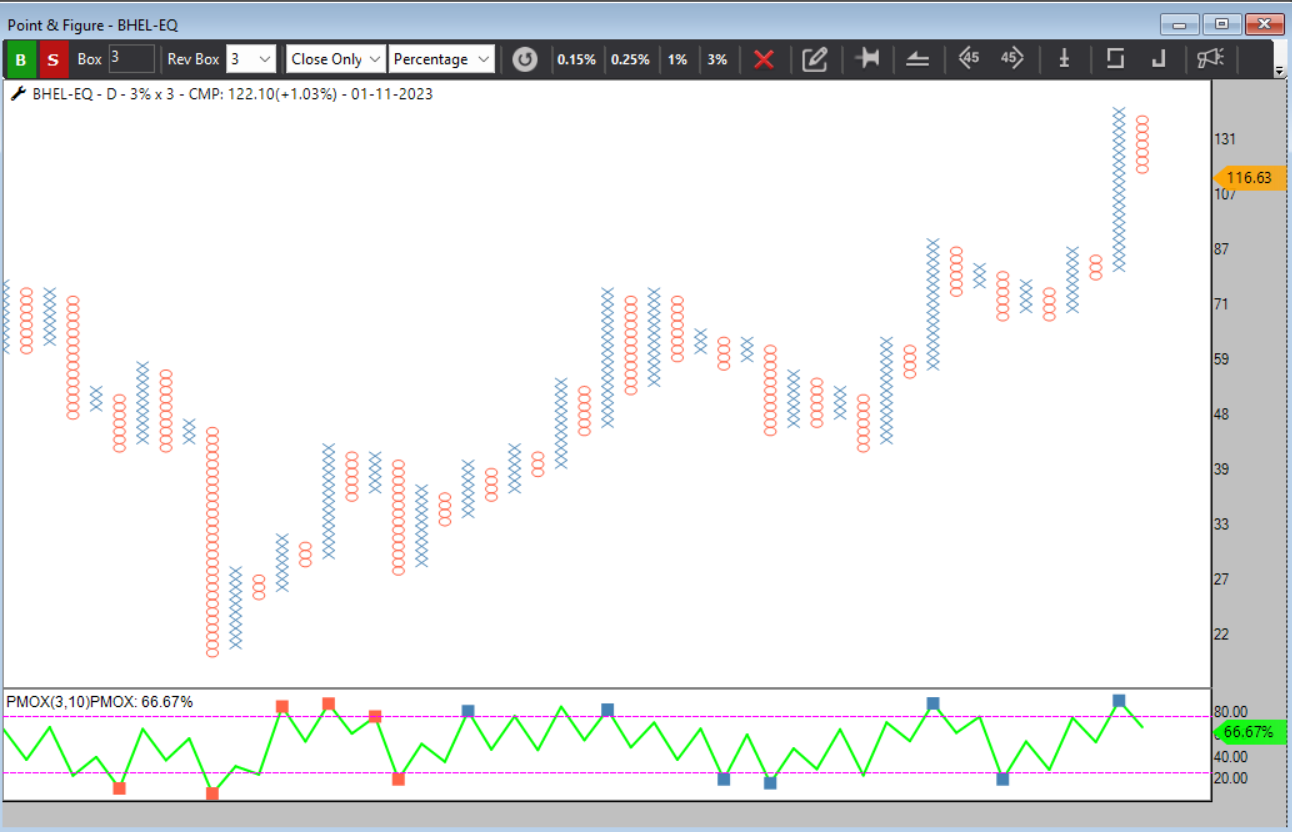
Those who are holding stocks equivivalant to future lot size can do covered call strategy in Asian paints
Asian Paints -Ratio chart analysis
Plotted against Nifty 500 with Triple Moving average
Broken below large box
Bearish Anchor Follow thru
TMA negatively allinged
so all in all it looks stock will underperform the market
same thing has happen in reliance between 2008-2016 where it massively underperform the market
if i have only two choice between Asian paints and Nifty 500 i will choose to invest my money in nifty 500 BEES or That index fund till ratio chart dosent turn in favour of asian paints so my pain area reduce and if mkt rise i earn returns
#AhmedabadNest #stockmarkets #AsianPaints #analysis #ratiocharts
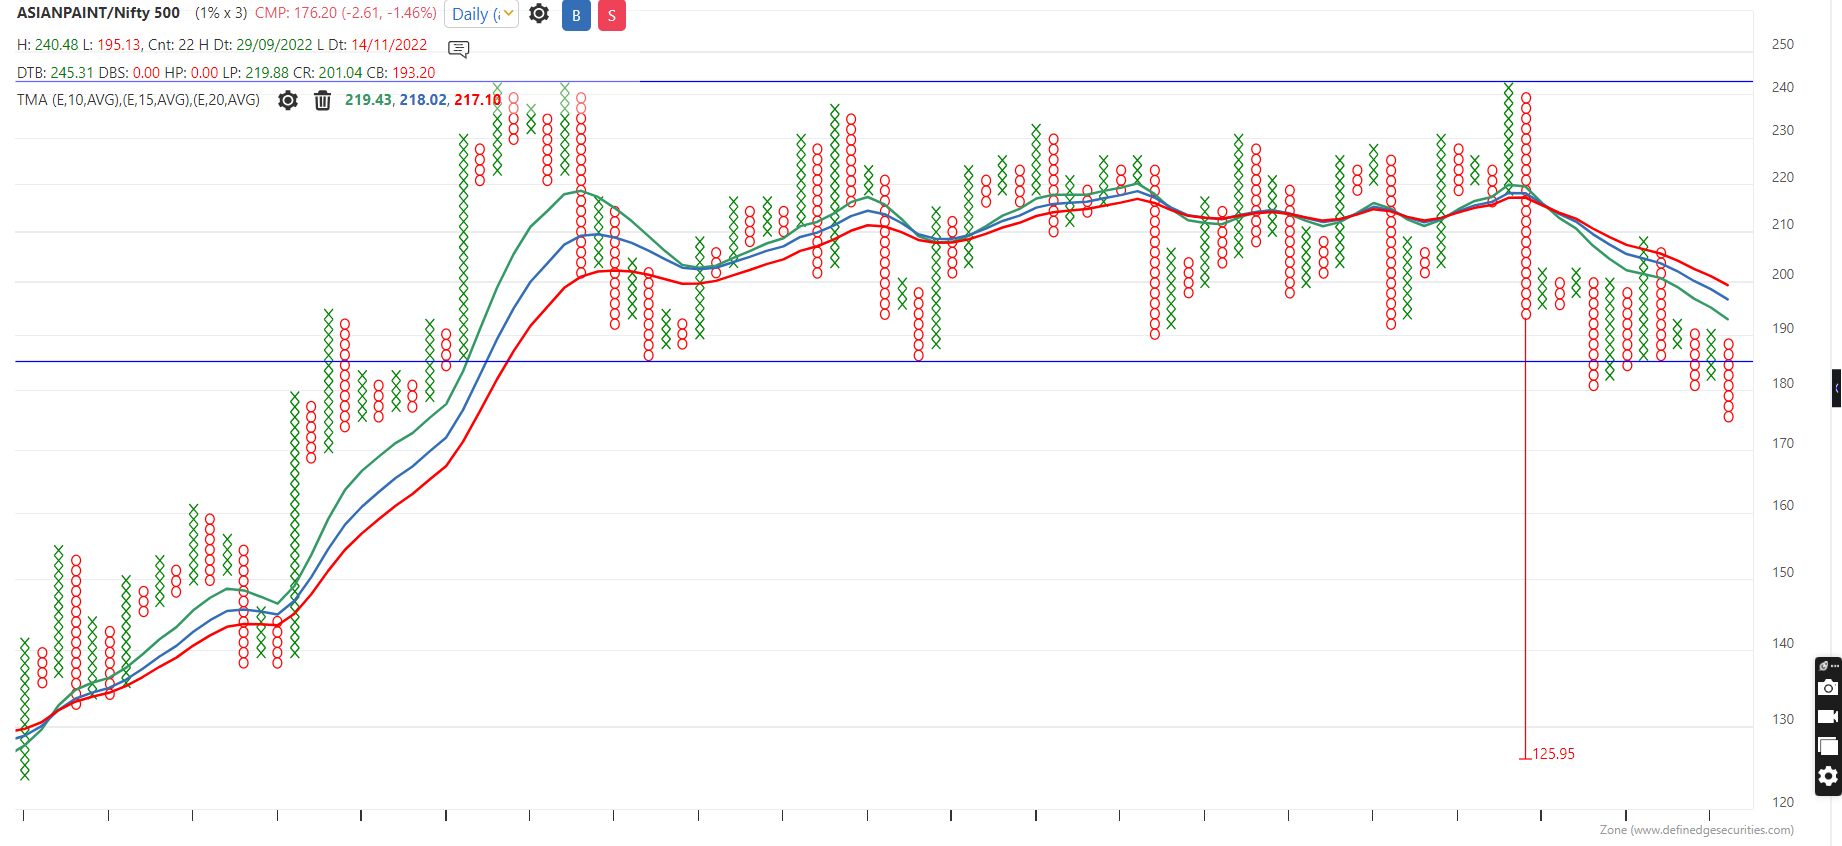
Nifty 500
Break below Super Trend indicator =>Bearish
ADX works very good for buy sell,now near to give sell signal if that happen then expect further downside move
for me as a momentum trader no scope for equity
#AhmedabadNest #nseindia #stockmarkets #analysis
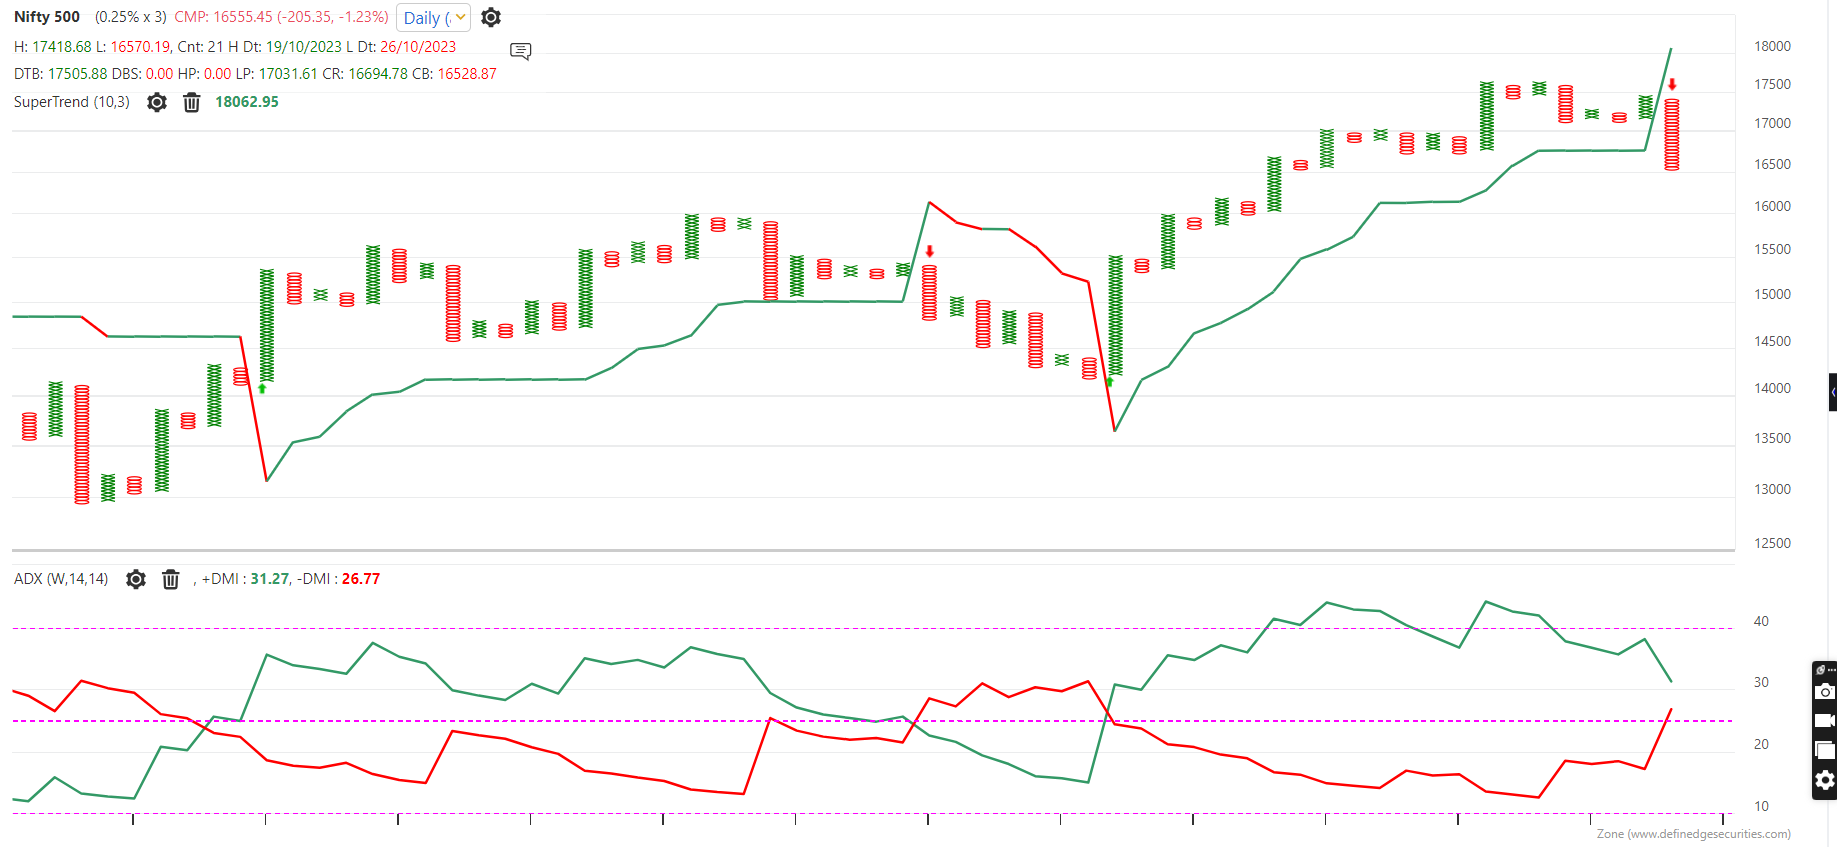
#PowerPortfolio
Price and Ratio wise below Super Trend means no scope for Equity for me.
if you remeber i was updating my market timing model reading was above 90% in fcat reached 94 % at its peak and this is highly overbought zone
Always do check the Health of market along with price action
50% work is done if you can save drawdown in correction
Equity Curve Trading
Edge is the key
#AhmedabadNest #nseindia #StockMarket #india #analysis
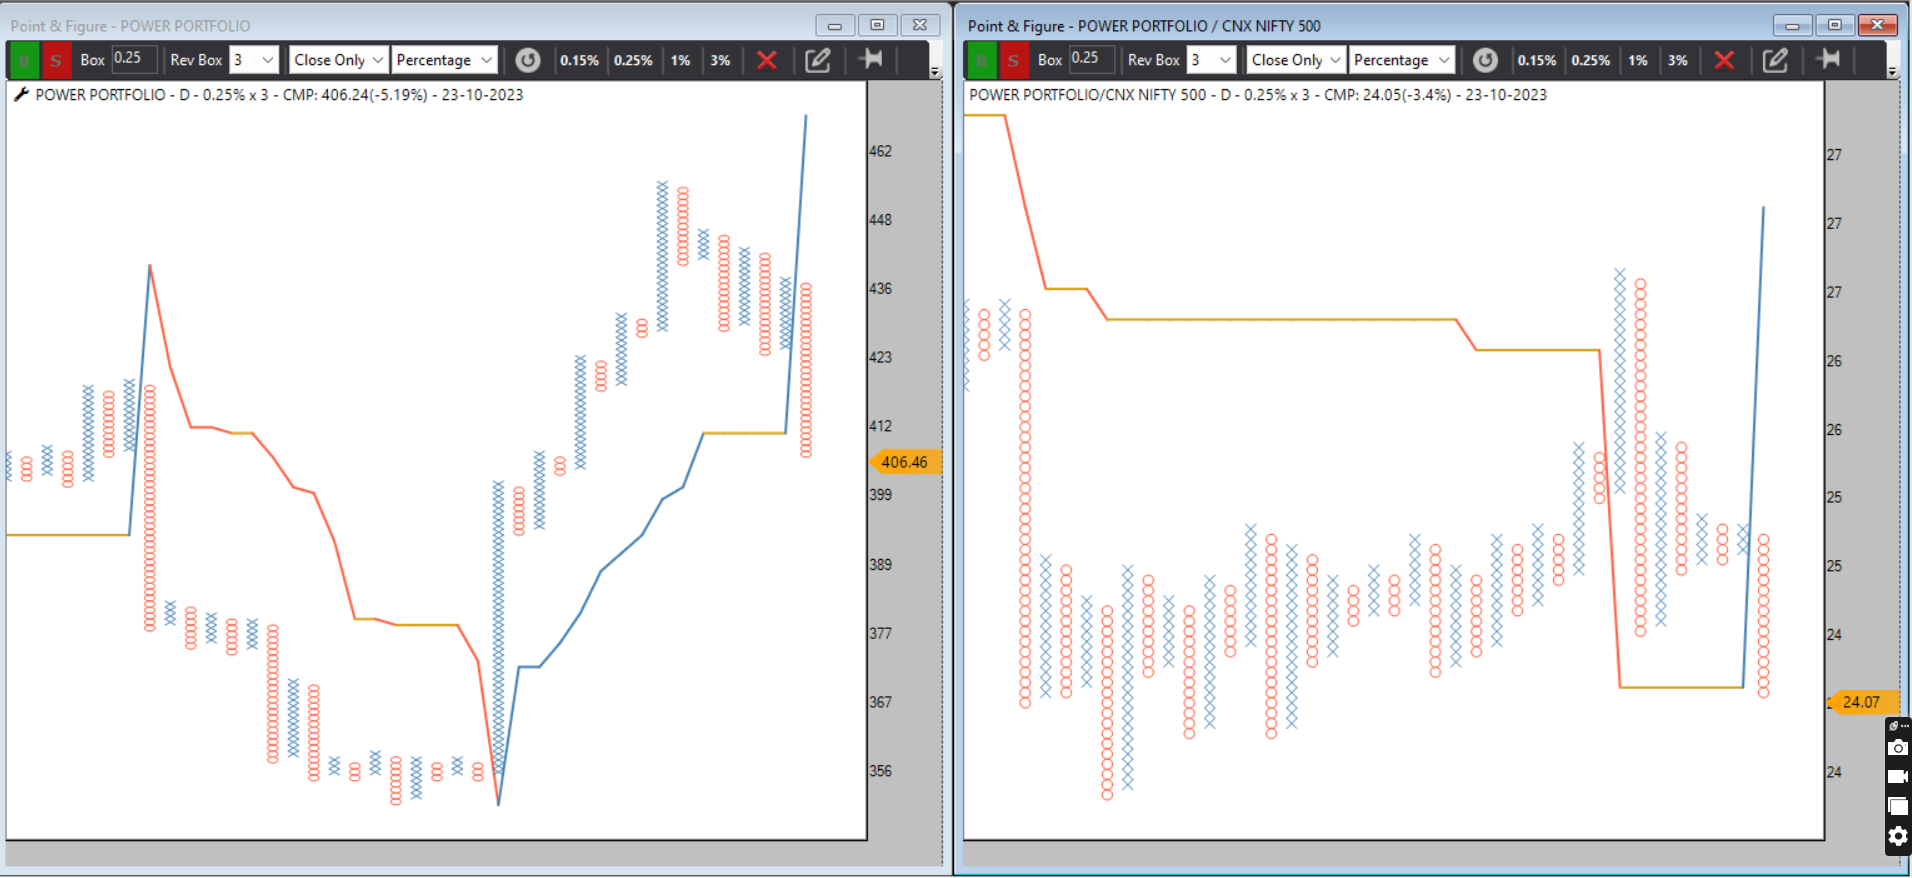
#AhmedabadNest #index #analysis #StockMarket #india
Fake News Low is getting broken
Midcap 150 -Microcap 250
on 12th september fake news came of front running done by one of society generally fund managers and that day is now getting broken
on Rumours some inteligent investors/trader likely to offload in big chunk
attchaing boths charts for referance lets see where the correction ends on Fibo Retracements
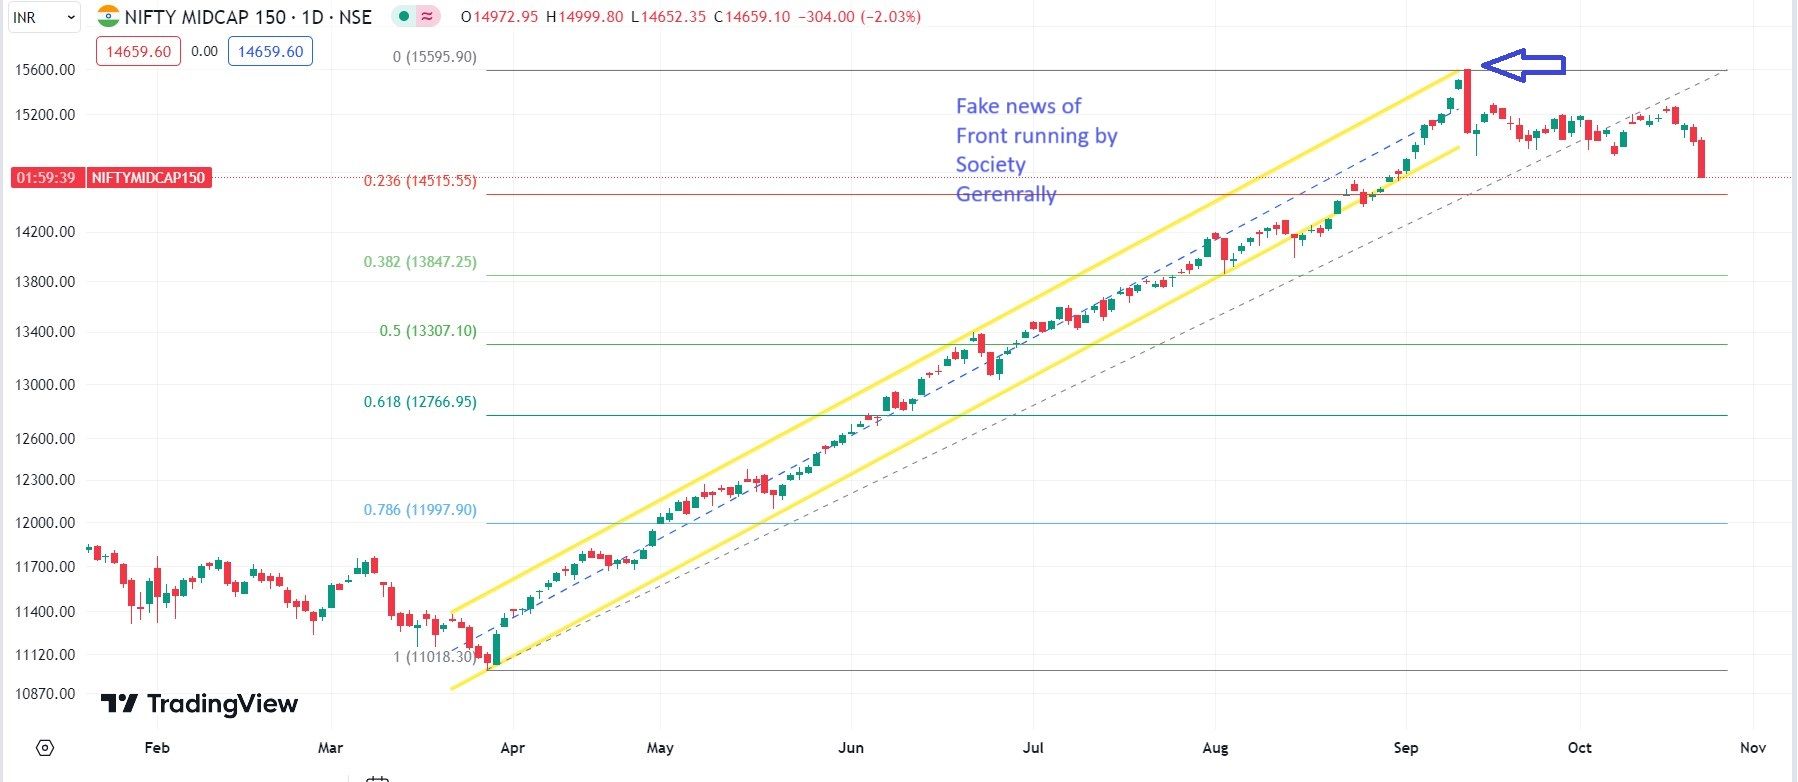
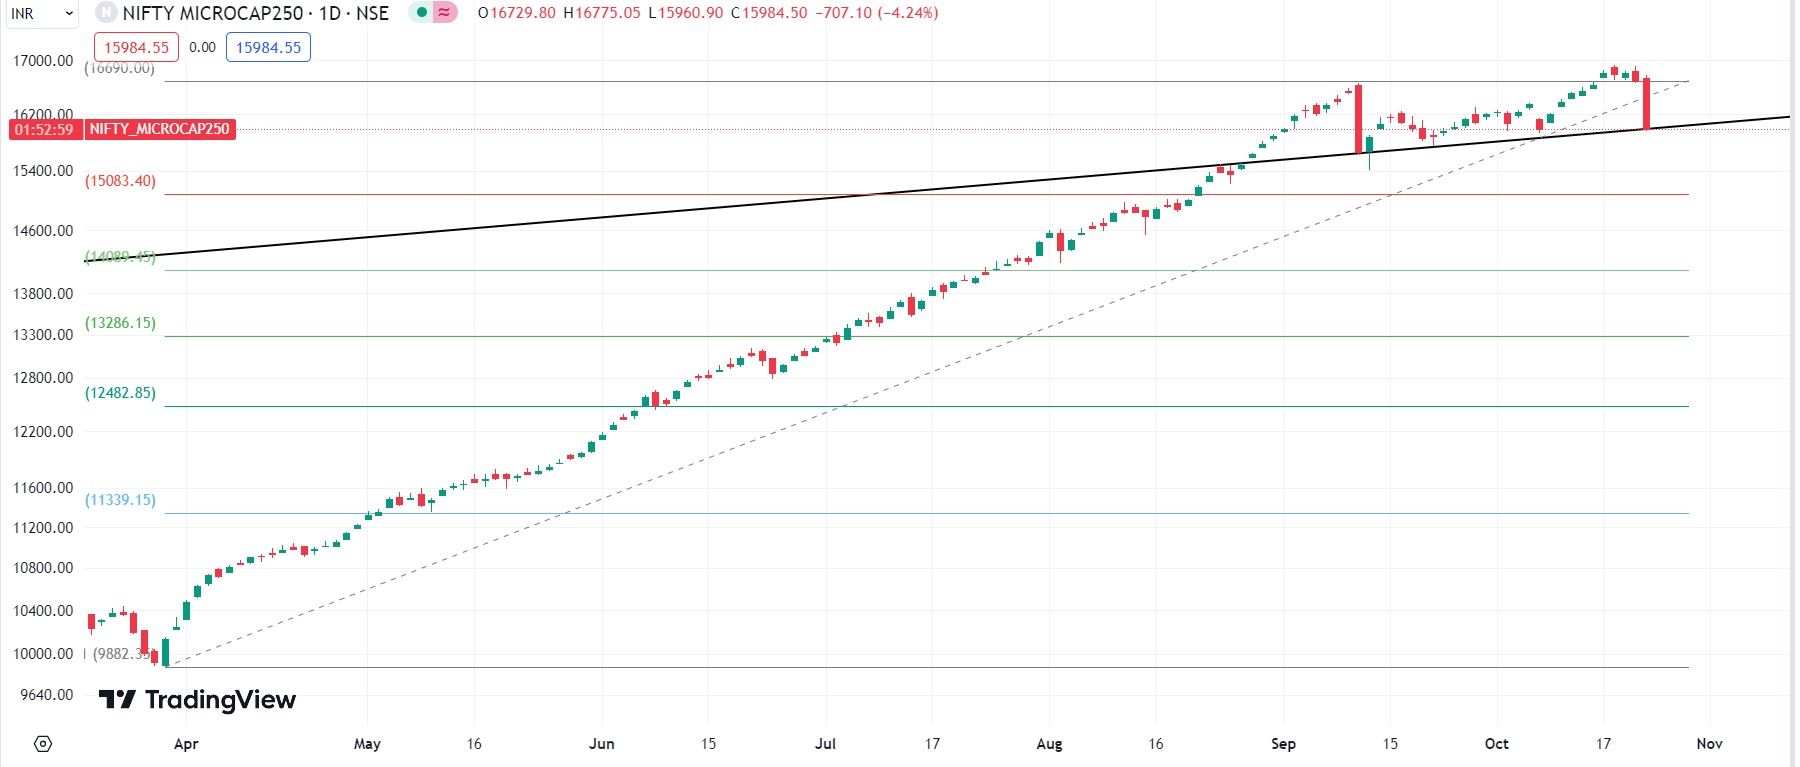
India VIX
Double Triangle
along with probable H&S Pattern in Nifty & Bank nifty daily charts
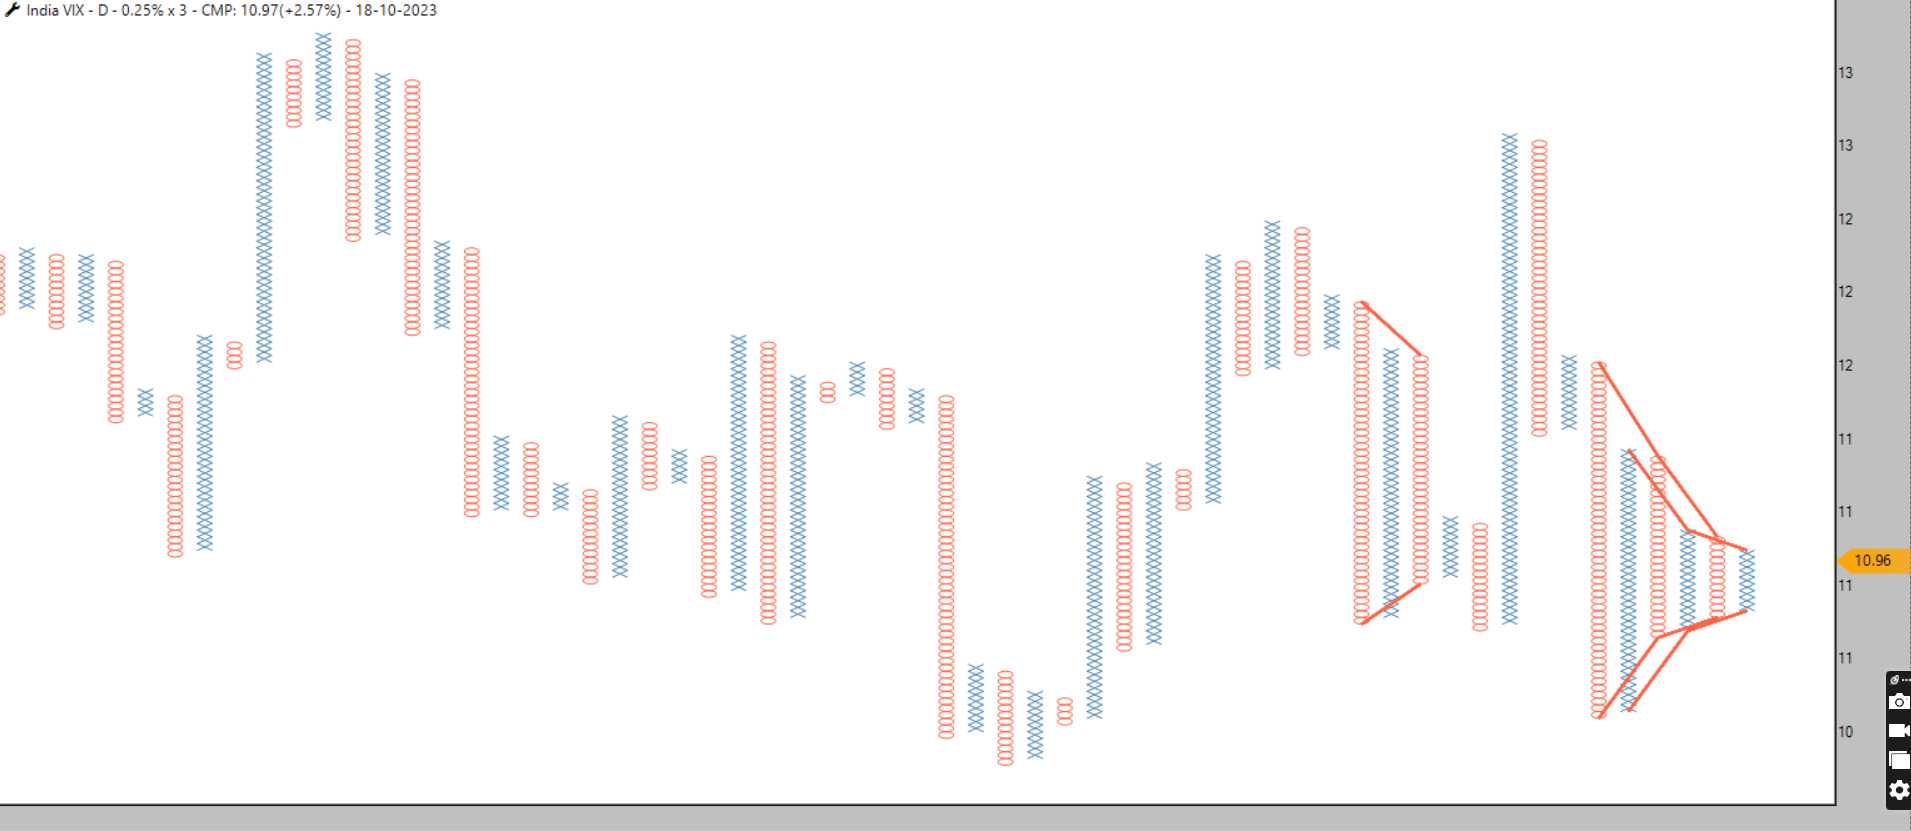
Nifty-bear attack ?
Nifty not able to cross the gap down gap
ADX falling has taken whipsaws in trend following system
if ADX cross both DMI then bears ko control karna muskil hoga
#AhmedabadNest #analysis #StockMarket #india #nseindia
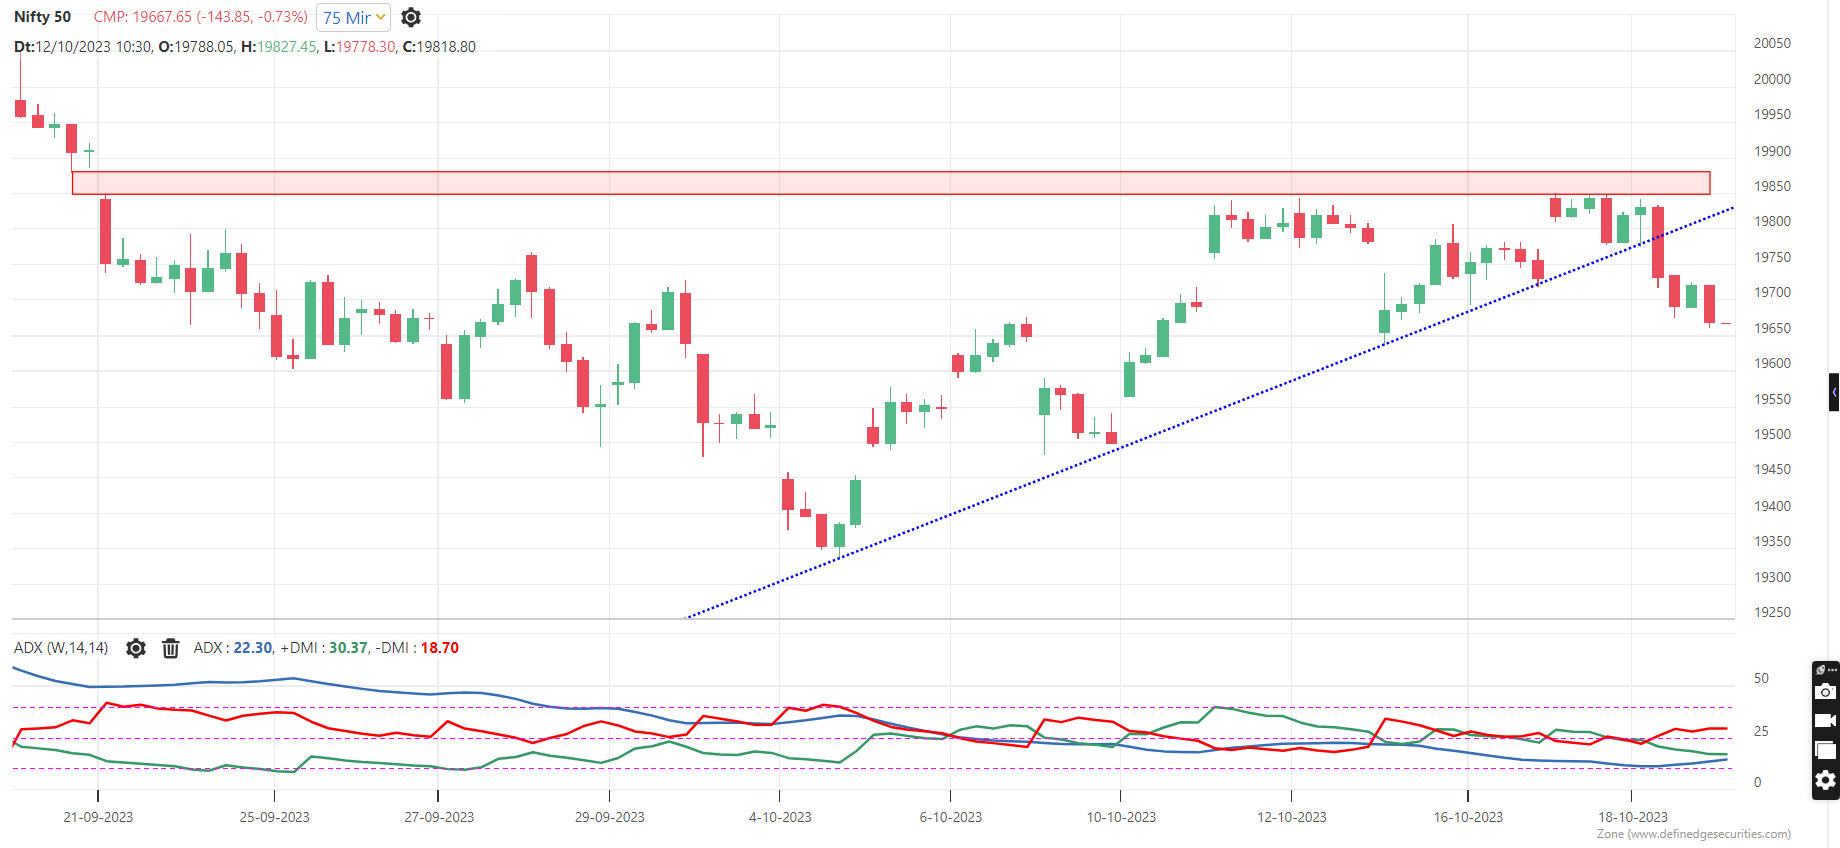
Nifty Alpha 50-Bull trap or Euphoric move ?
Double Top buy active with T-20 pattern
Two probability either bull trap or Euphoric move
why Bull trap-> Breadth is in over bought zone
Why euphoric move-> In strong market breadth can remain overheated longer then one can expect
#AhmedabadNest #Nifty #analysis #StockMarket #india #momentum
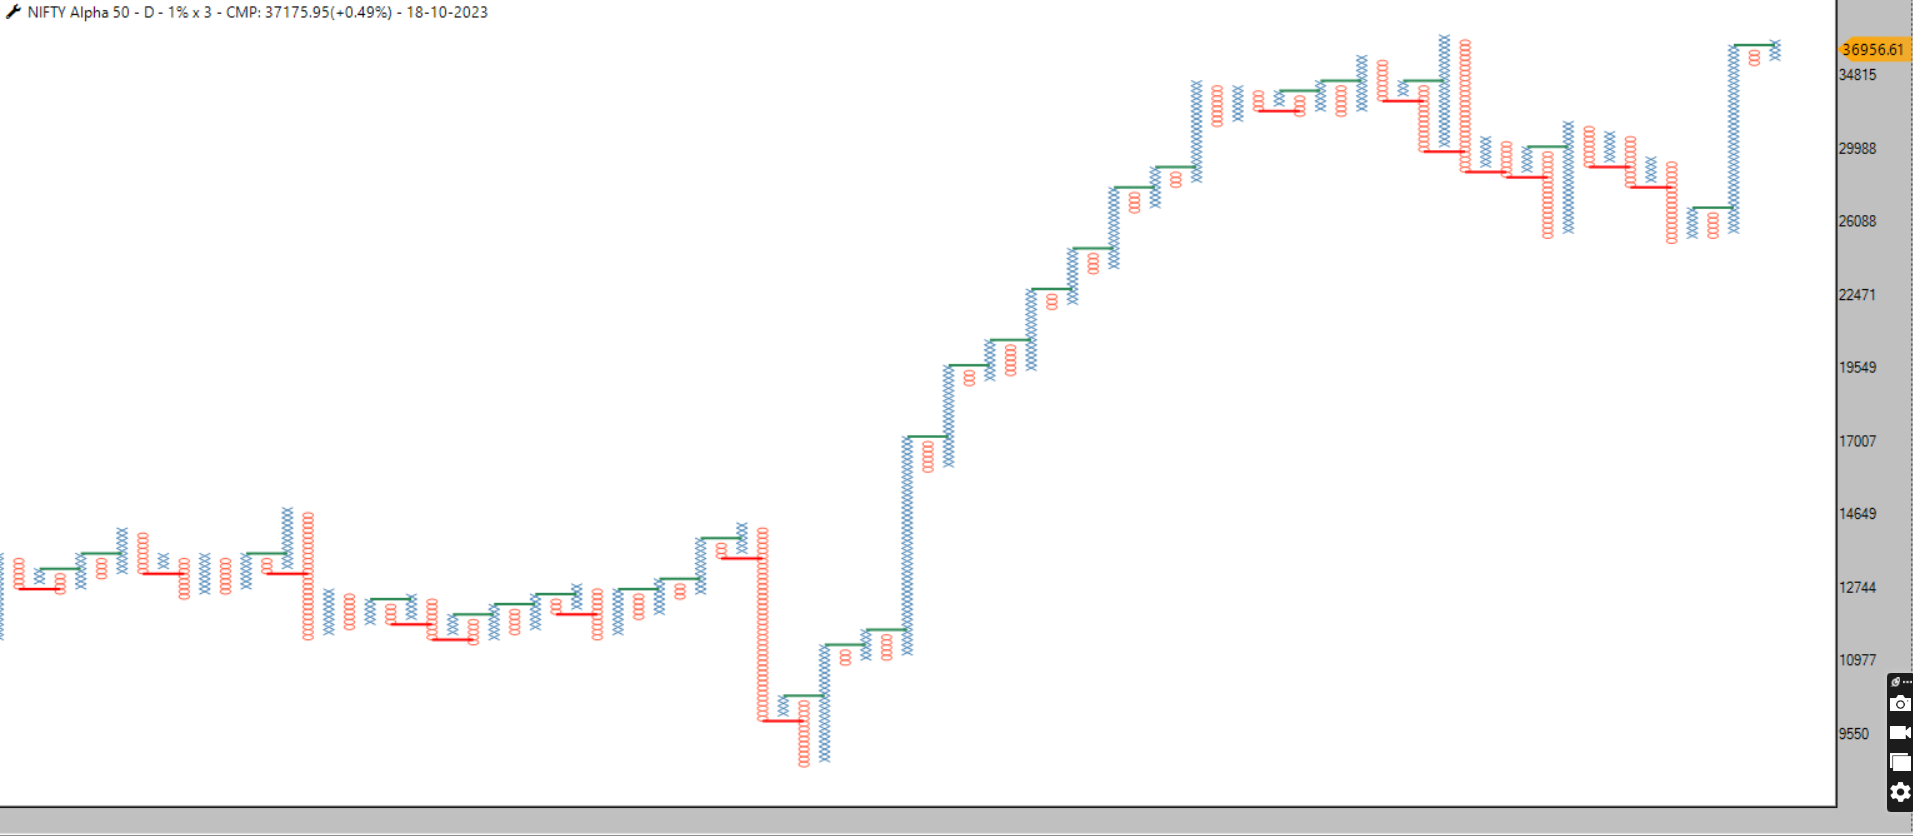
Does all stock have liquidity?
Hello Team definedge and prashant sir
very good scanner in zone app now if possible enable user definedge group for scanning
@Shashank Jain This i have request to @Prashant-Shah sir when we meet at ahmedabad this year to allow with user define weighted portfolio charts
my re balance is on every 15 days so on add or exit stock with my pre defined rules with cash allocation as well -as per your allocation /entry exit rule u can maintain them and take daily NAV data into CSV file and save in my market folder then u can plot your charts according to your allocation
for that on daily basis u need to maintain its NAV like mutual fund does consider cash addition/deletion/stock entry exit etc in xl sheet or 365 refer attached photo
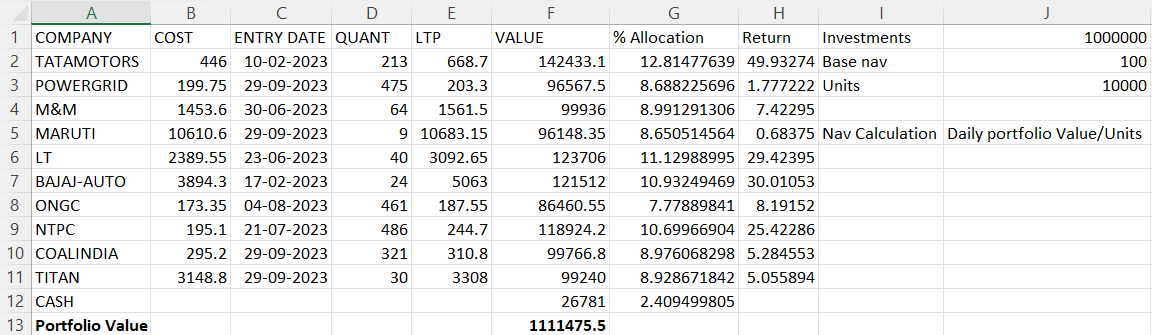
#GOLDBEES
Currently my Power Portfolio is in Double Bottom sell so i have another option to park my money in GoldBees
which is currently below super trend so have to park money in LiquidBees
attaching BackTesting Data & GoldBees chart for referance
#AhmedabadNest #goldbees #gold #analysis #DataAnalytics #backtesting
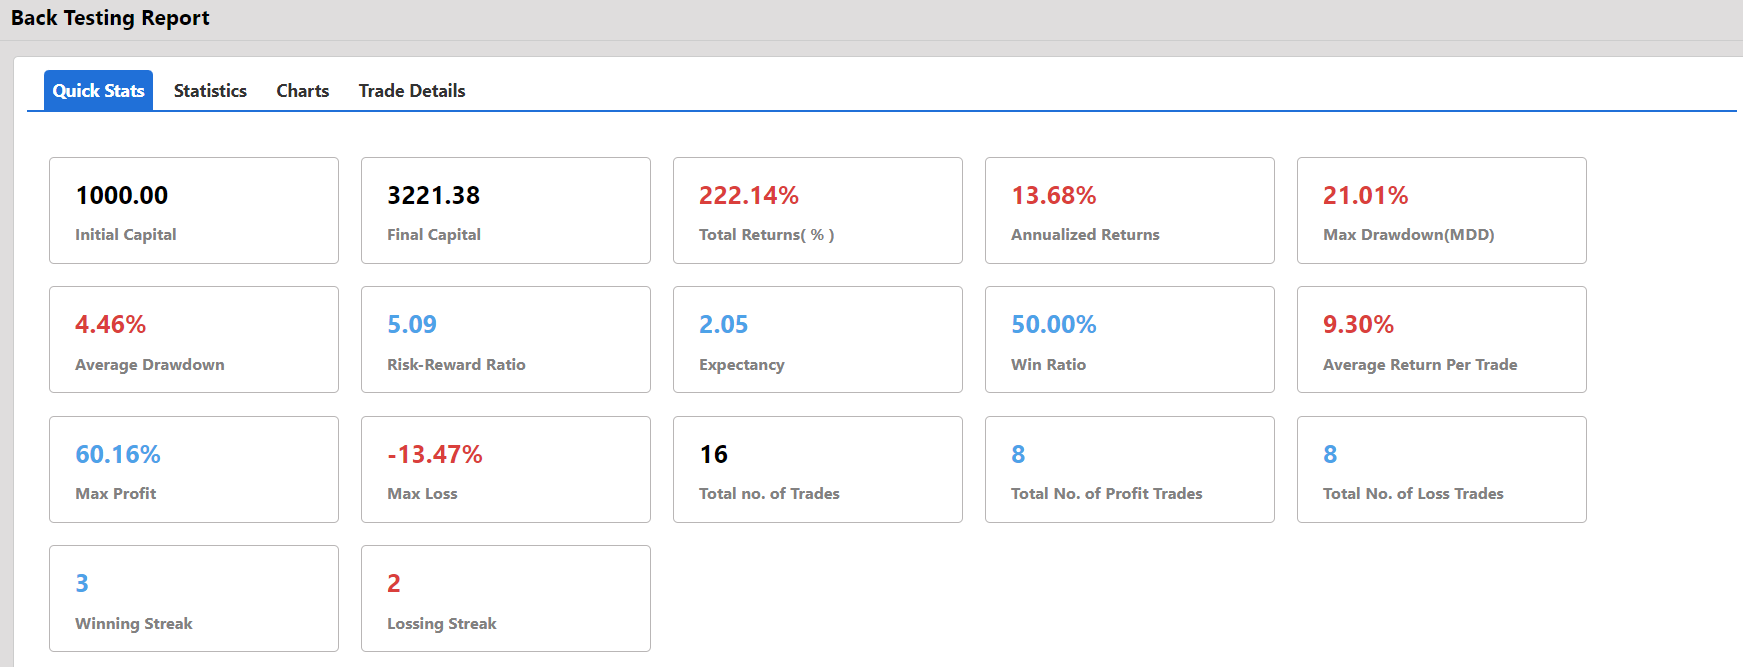
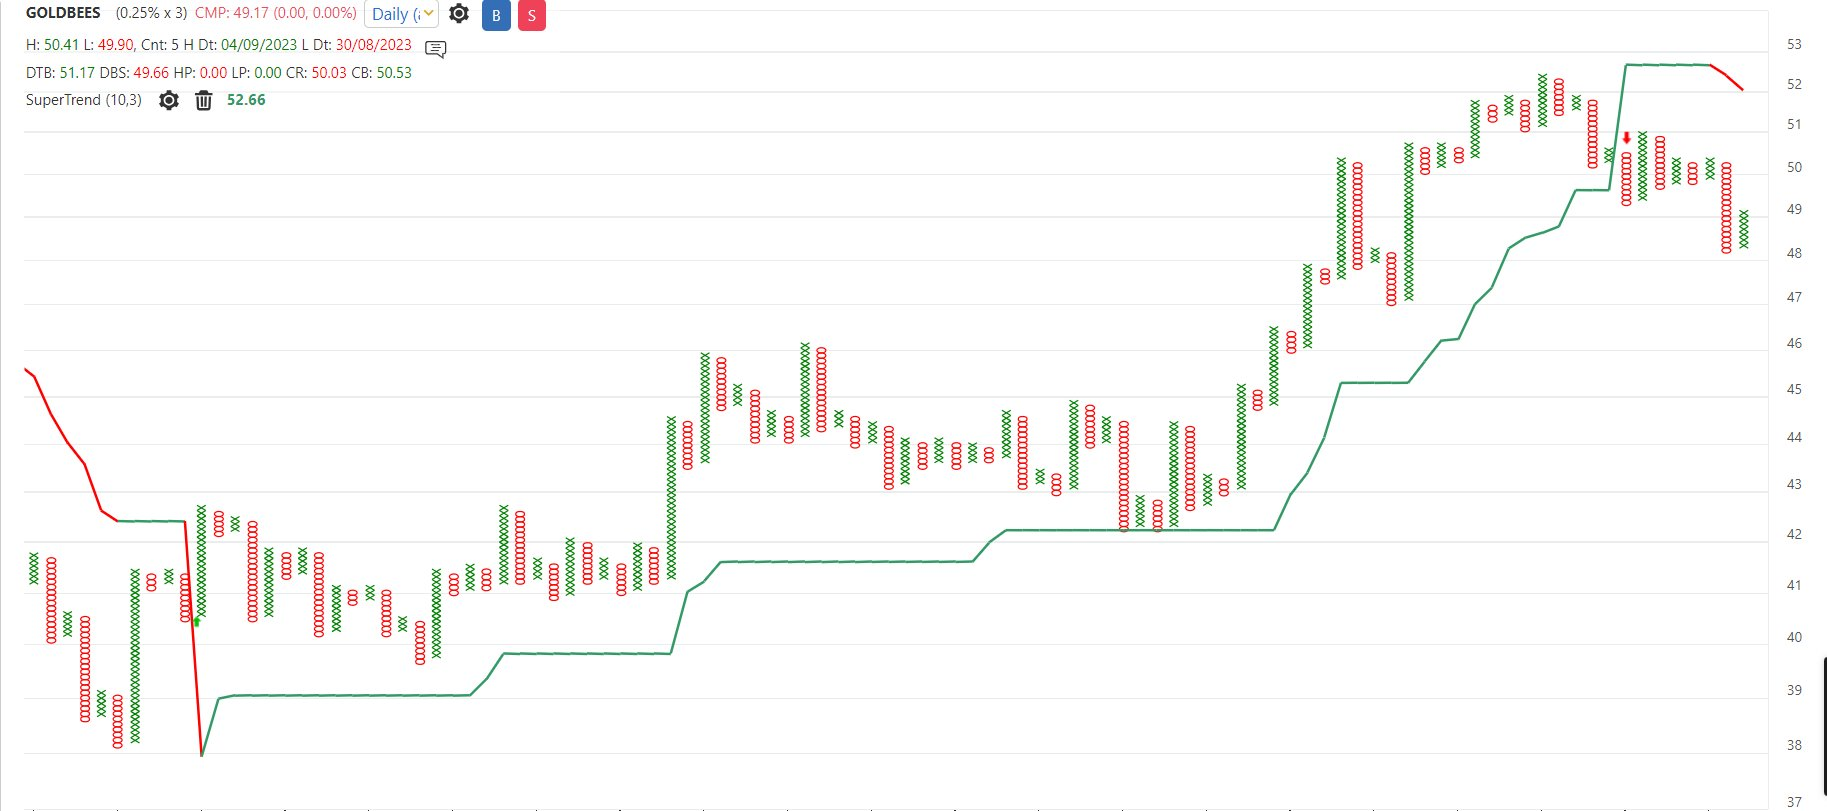
Power Portfolio RS & Price Analysis
Left side chart is of Price chart which is in Double Bottom sell after anchor column so probably forming bullish ABC
Right side chart is Relative Strength chart against Nifty 500 which is above super trend means its relatively strong
as long as price chart dosent give buy signal no commitment into the market
Equity curve Trading
Edge is the key
#AhmedabadNest #power #portfolio #stockmarkets #nseindia #analysis
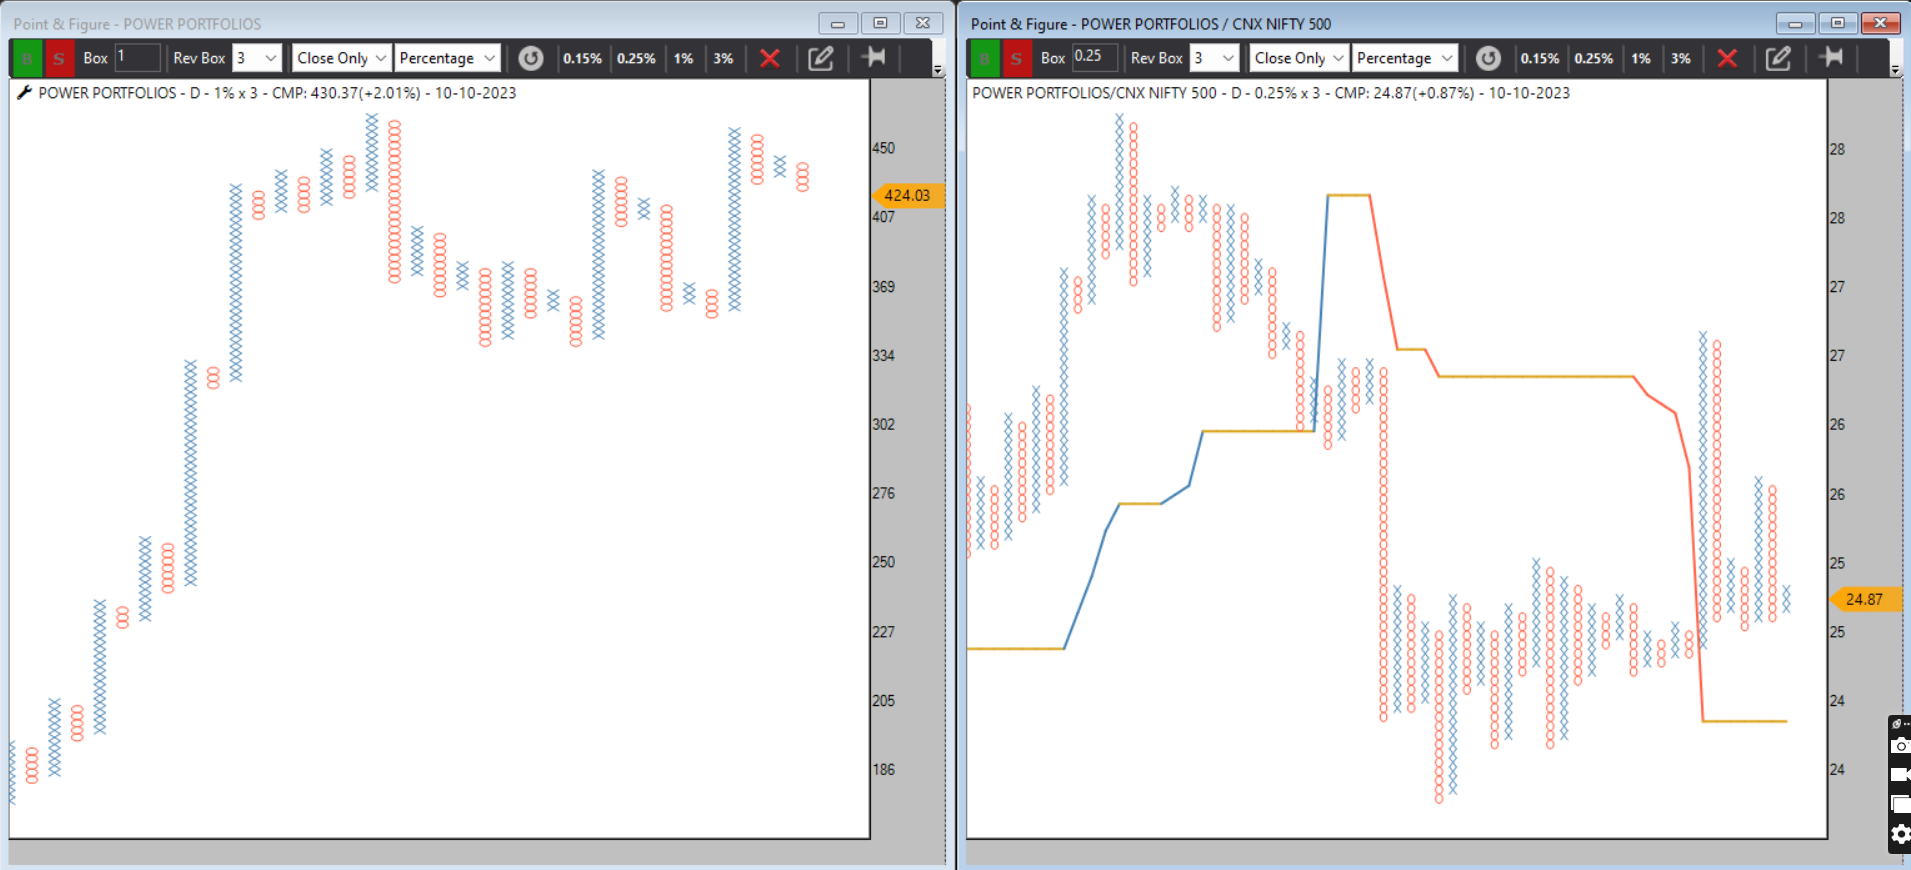
Momentum Dominator Portfolio
Bearish Anchor Follow thru suggest soft landing for bears going ahead
along with this still my market timing model is highly overbought above 90% which suggest cool off required in market
Equity Curve Trading
Edge is the key
#AhmedabadNest #momentum #dominators #Portfolio #pattern #analysis
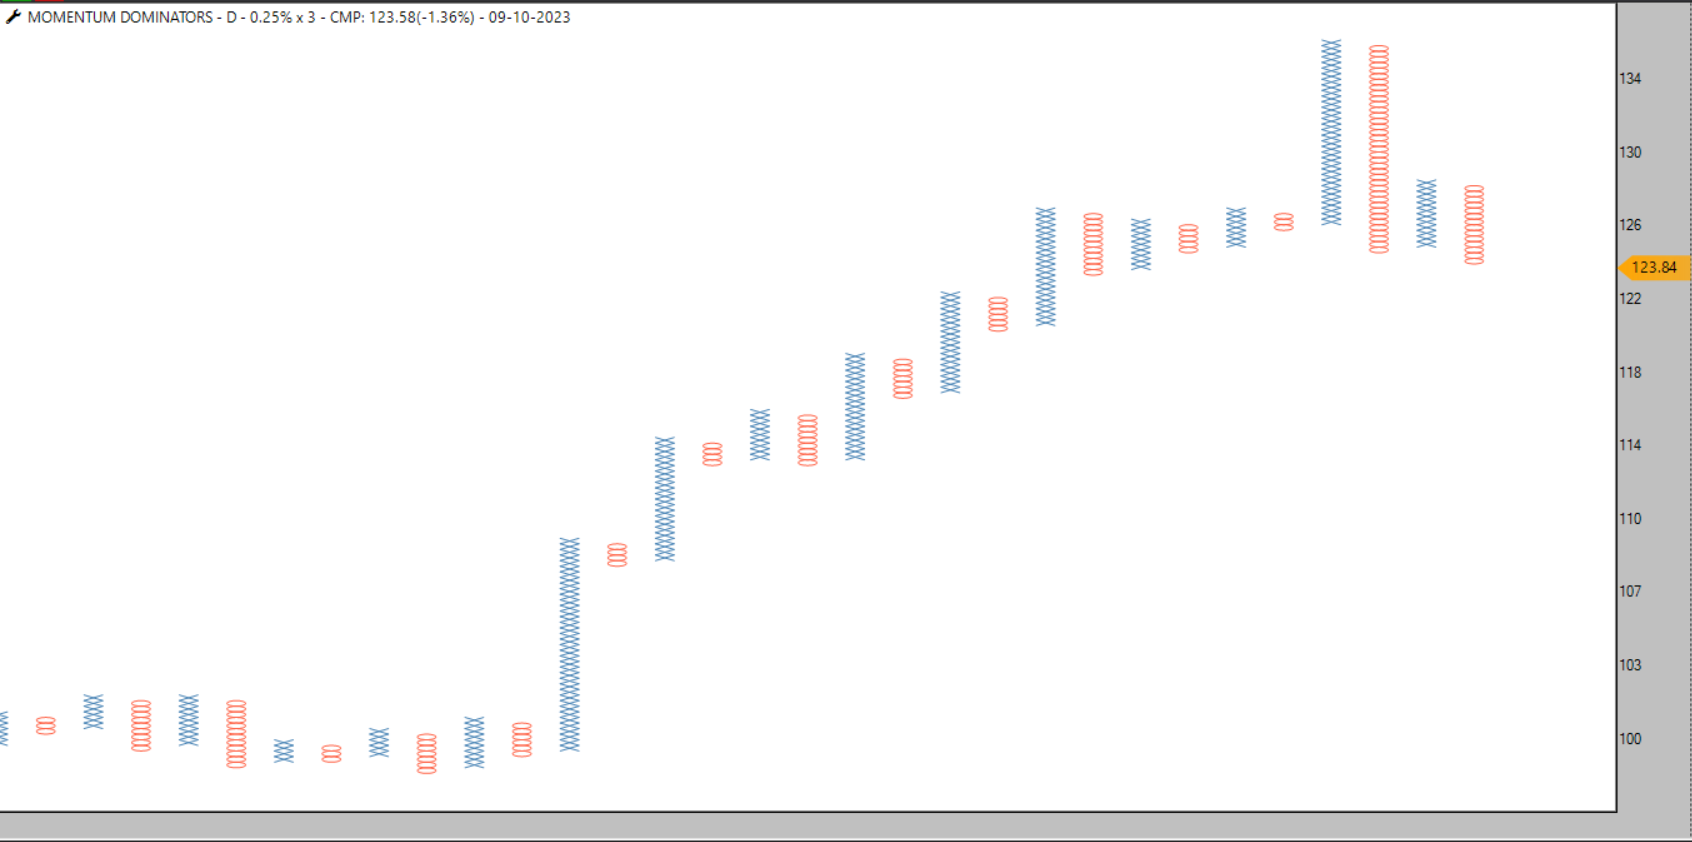
i wants to create scanner for Renko & PNF ->
Brick & coulum was below super trend indicator now it cross super trend this condition i need
Thanks
since many days i raised my query that weighted avaerage index is not properly plotting kindly solve it as fast as possible @Definedge
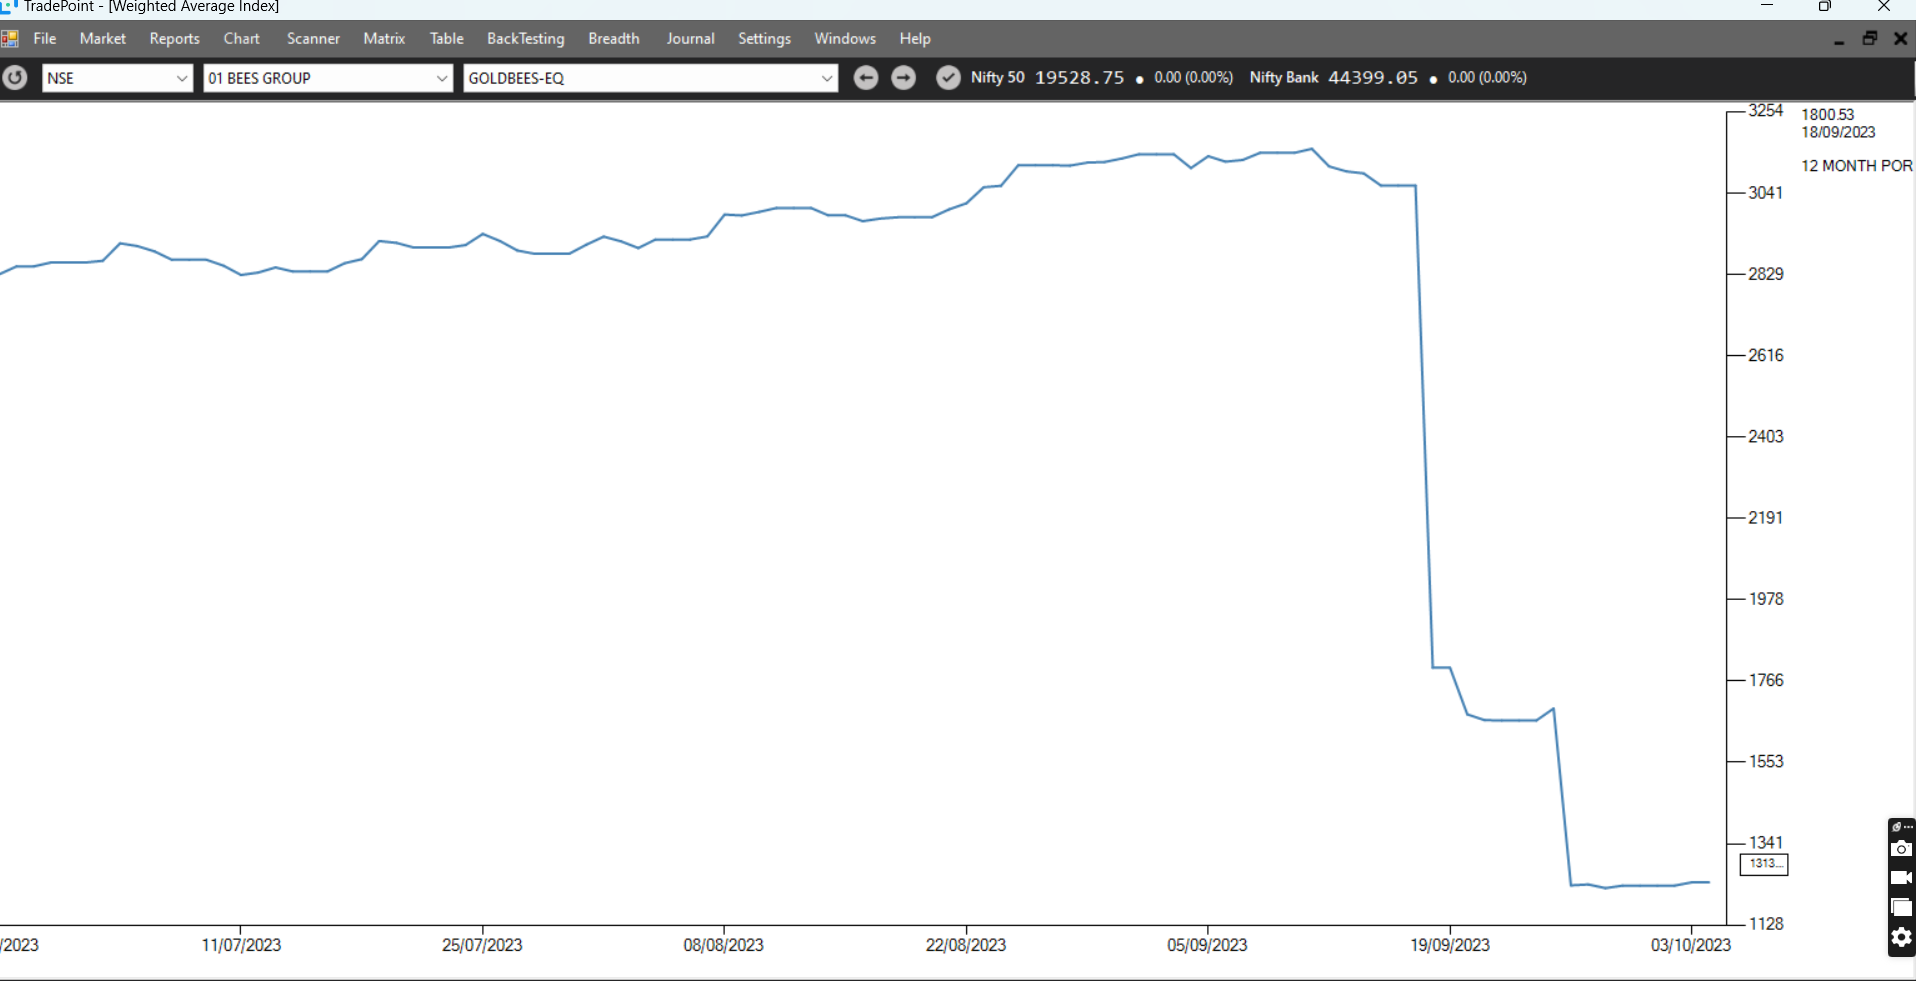 @Prashant-Shah
Validity of Bearish Divergence
Nifty has shown bearish divergence on Daily RSI but with that we need firm pattern breakout to validate it
attached chart of nifty 50 with Dicergence & trying to break the trendline
one that happen divergence will show its power
#AhmedabadNest #nifty50 #bearish #divergence #analysis #StockMarketindia
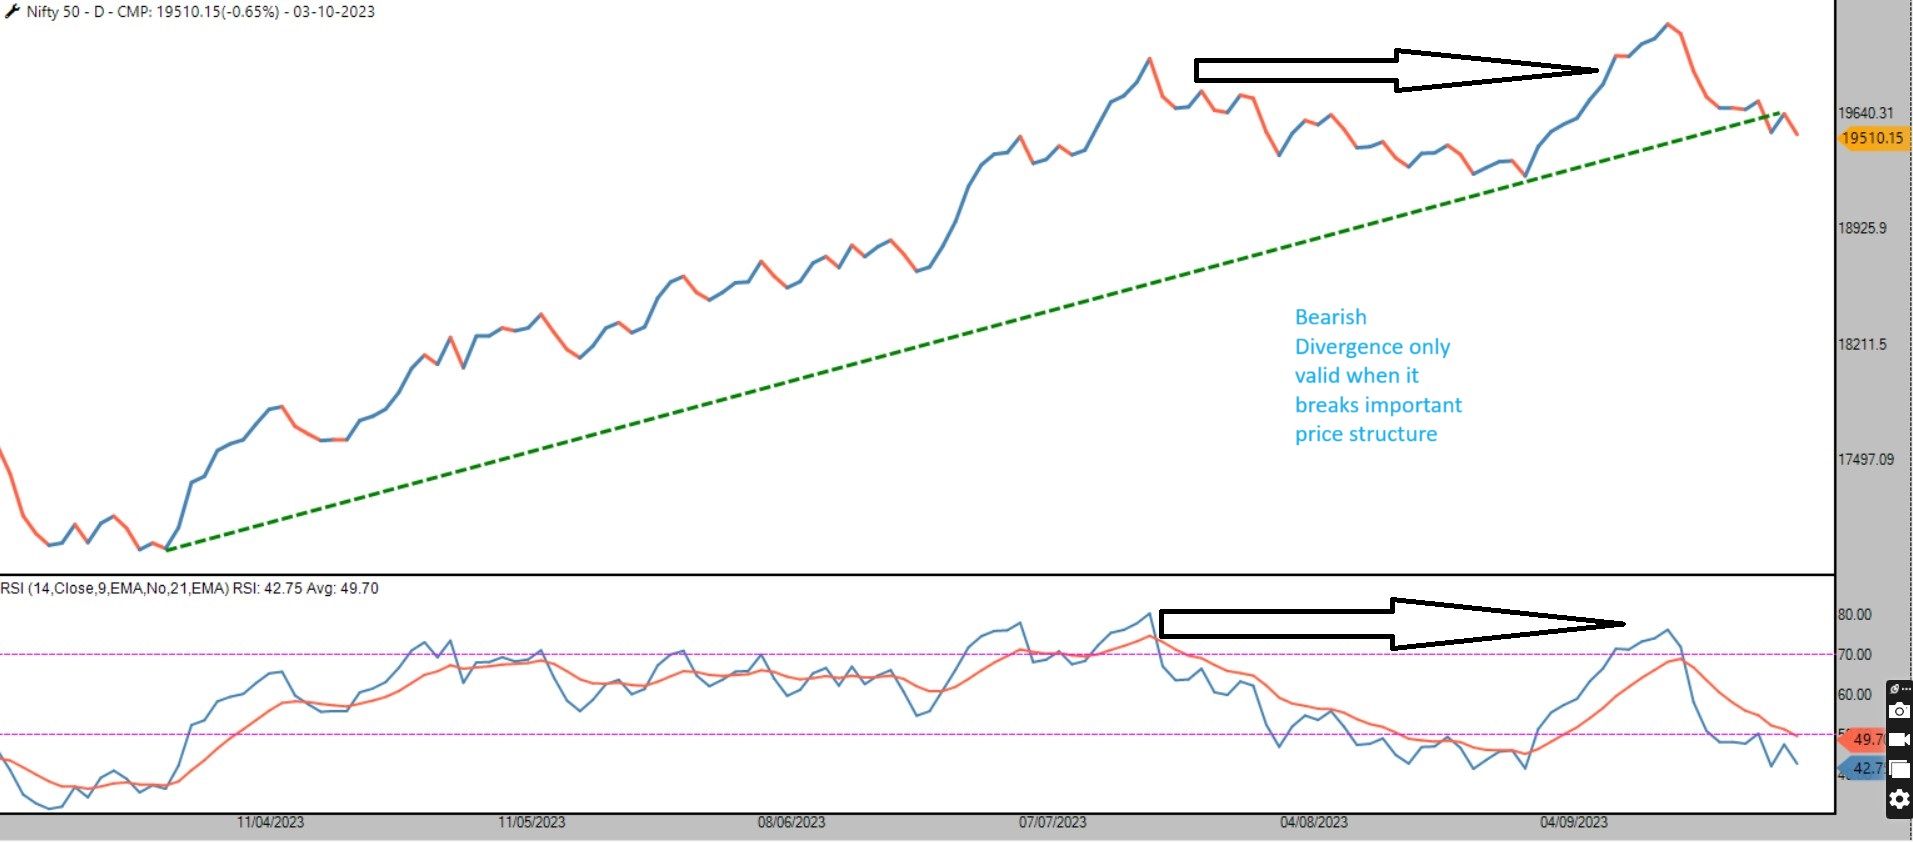
Thanks @The-Wealth-Vriksh
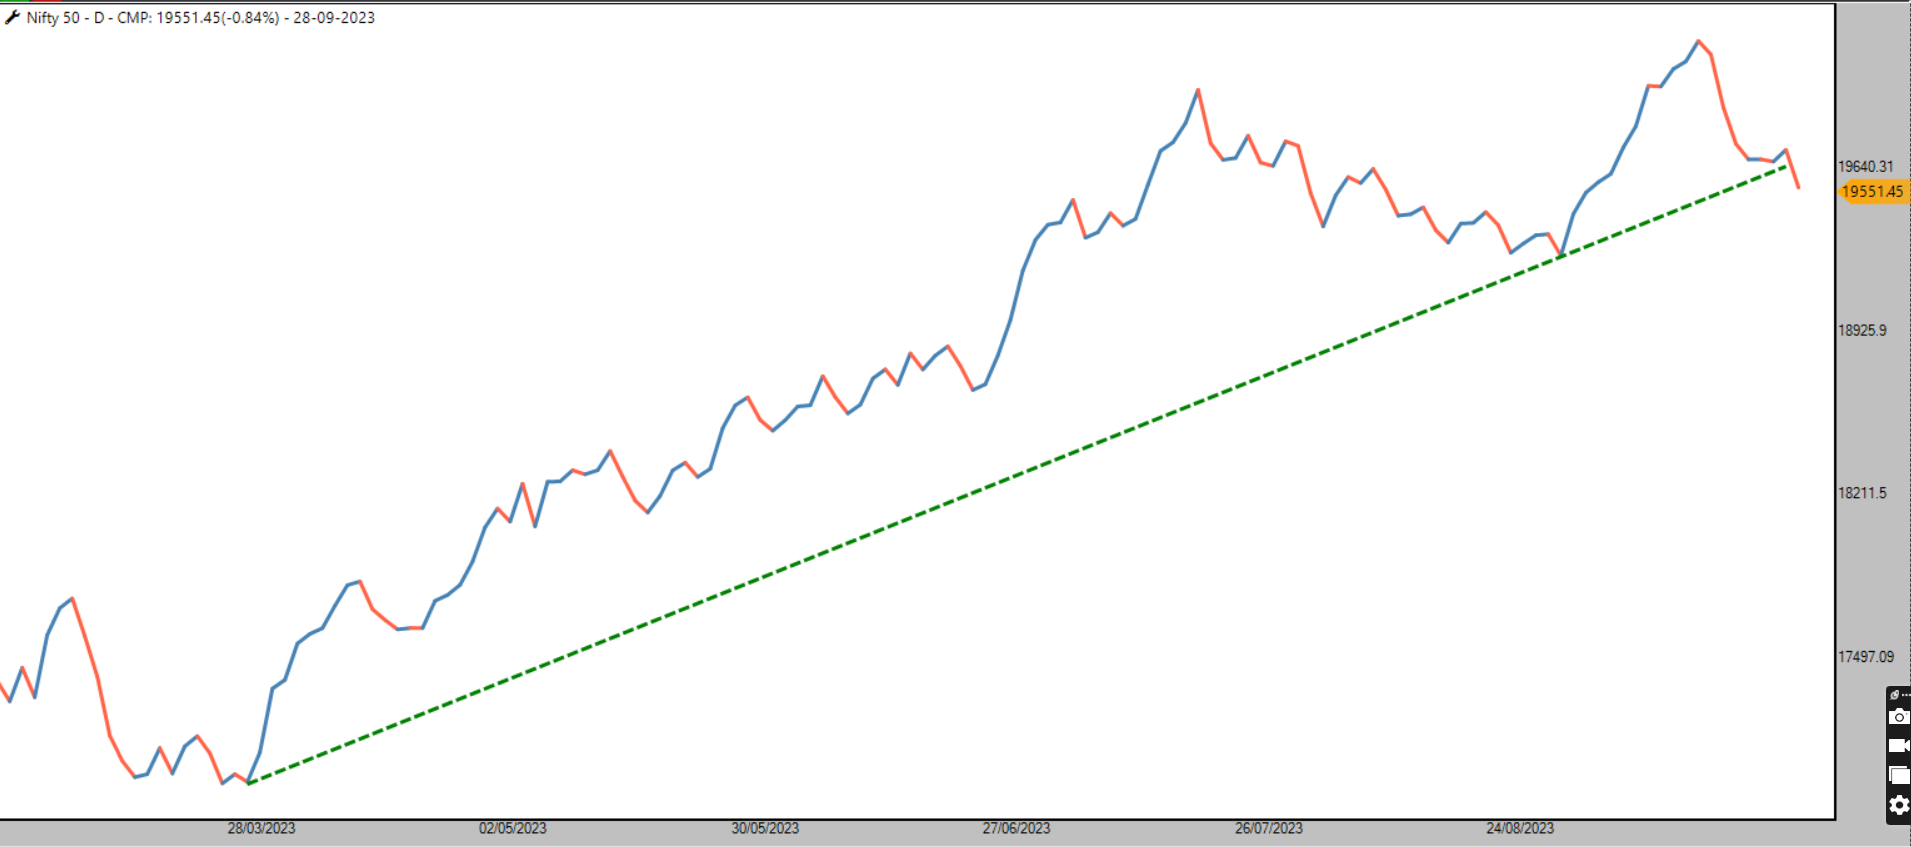
#Nifty
Ganpati bappa kal friday hai sambhal lena
#INDIA #VIX
at important levels of 45 degree trendline -if sustain above trendline be ready to quick correction in #Nifty
#AhmedabadNest #NSE #StockMarket #india #analysis
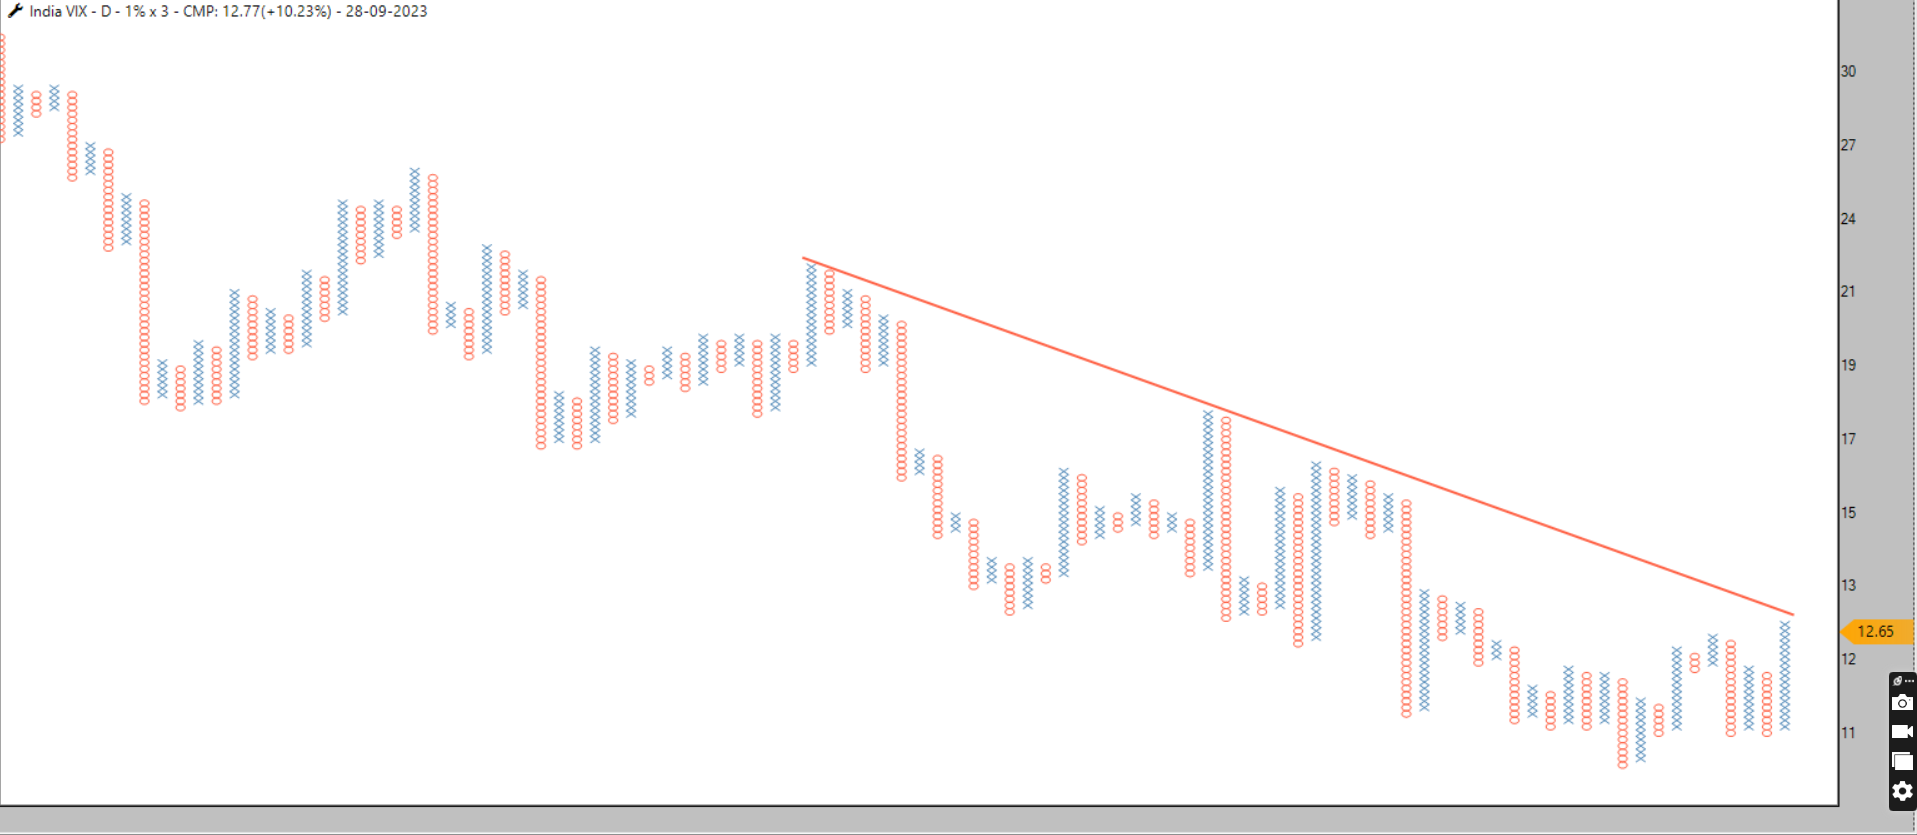
P&F Ratio chart of Mutual Funds/Index is not plotting
In many cases we need NAV to dowwnload and compare against own index
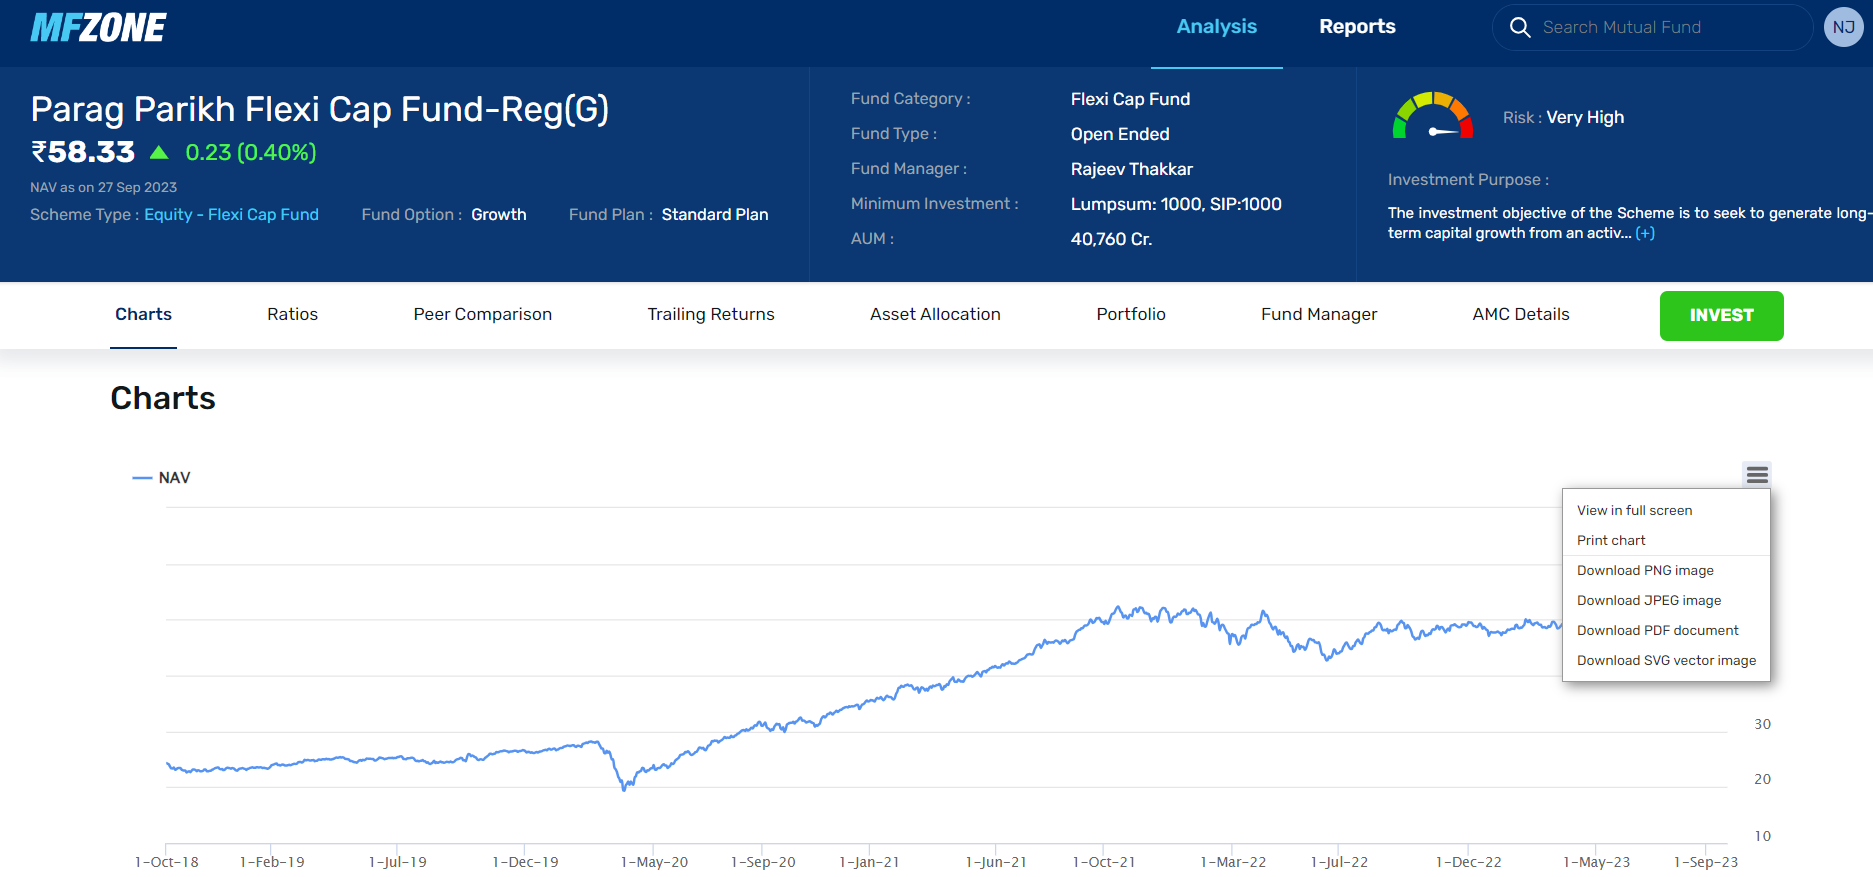
hello @Prasiddh-Shroff sir build such scanner which shows red flags that will help to eliminate junk companies once this criteria is pass half work is done in that case people dosent looses much even if prices dosent rise or fall example like castrol since many years not generated any return but not loosesn its value
overbought reading (My breadth indicator)
#Nifty
cluster of support
Trendline + 50 EMA
If both dosent respect then correction towards 100 & 150 EMA (19200-18900)
My market timing model is 94 %
#AhmedabadNest #nseindia #StockMarket #india #analysis
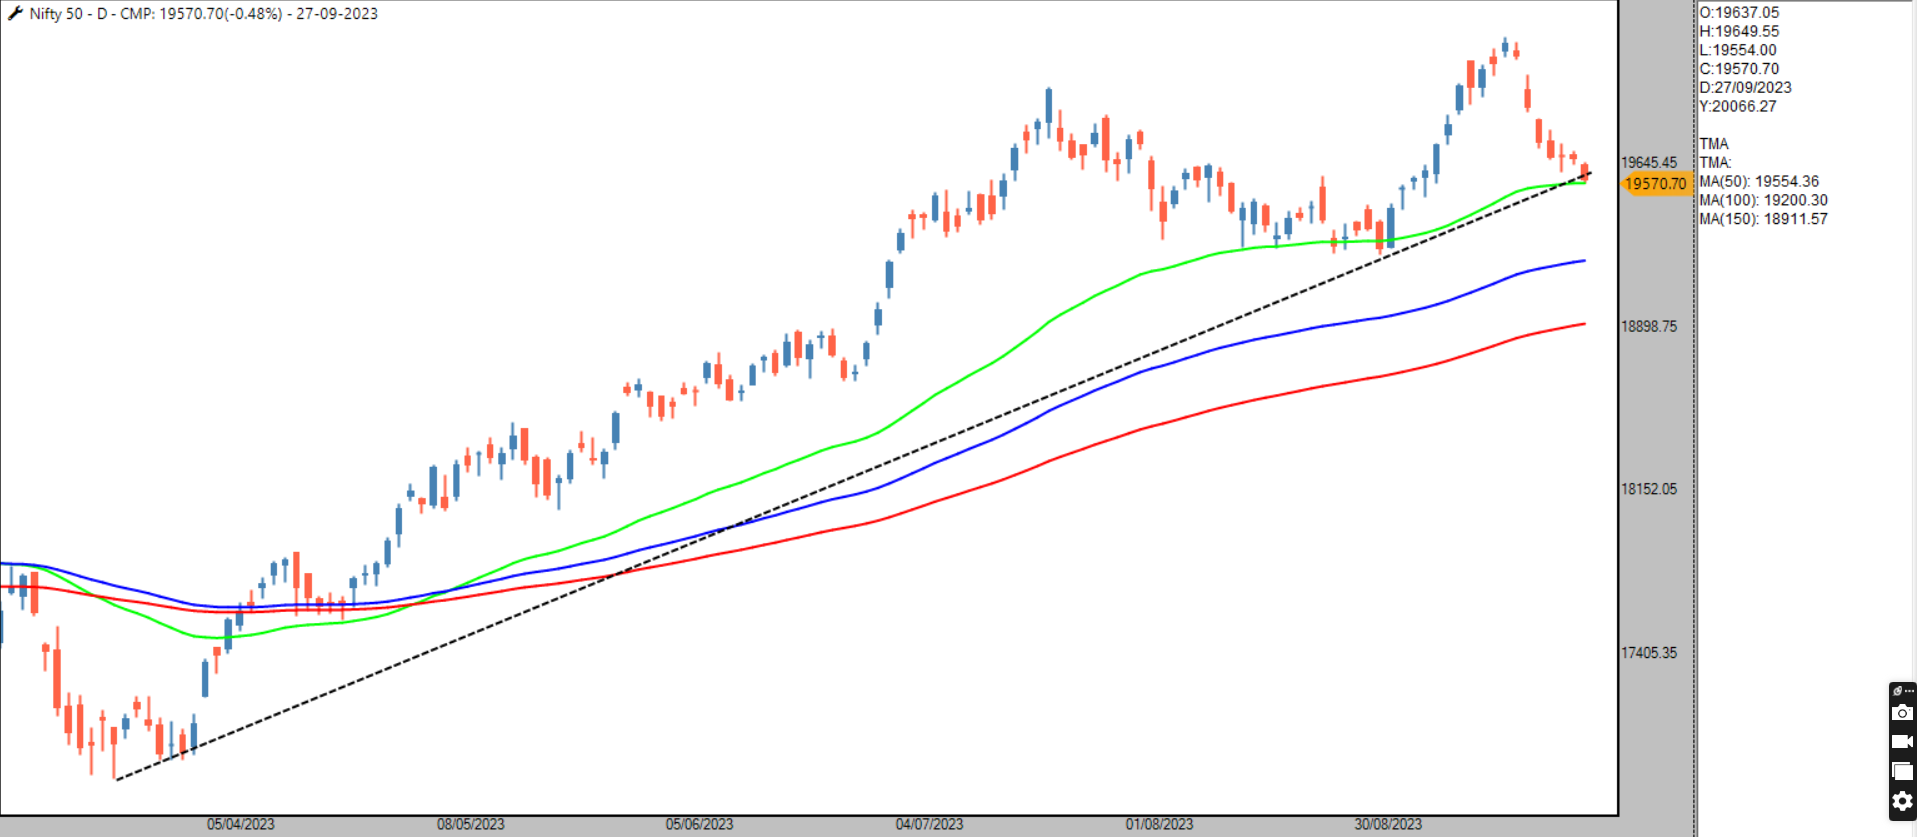

#Nifty 5% Correction ?
Turn Back Pattern on weekly chart
After 3 Green candle now complete strong bearish candle
looks Throw Back towards 18600 another 5 % Correction !
#AhmedabadNest #nseindia #StockMarket #india #analysis #candlestic
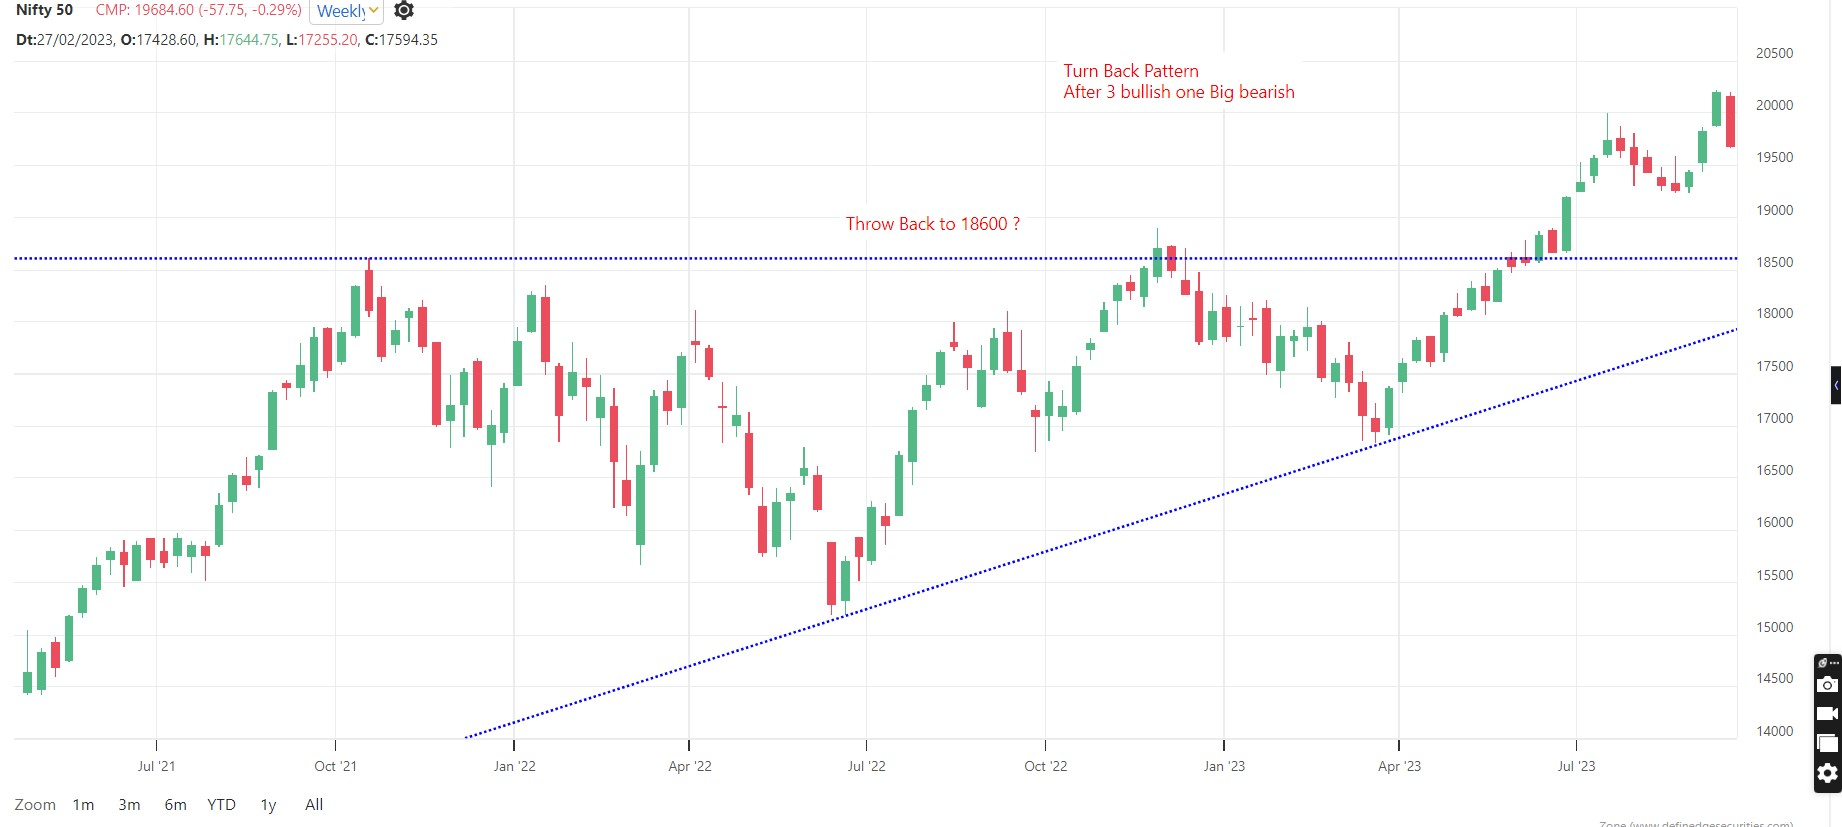
3 Dominators Portfolio given Exit Signal
Focused Momentum
Value Dominators
Momentum Dominators -100 % Bearish Pole & Double Bottom sell
when momentum dominators gives such signal in backtesting we have observed fast correction in market so be careful in longs now as momentum has loose its charm so dont focus on breakouts chances are high that it fails now
in week end will study my market timing model if given sell signal from highly overbought zone will allocate equity to Gold
Equity Curve Trading Edge is the key
#AhmedabadNest #dominators #Portfolio #nse #StockMarket #india #analysis
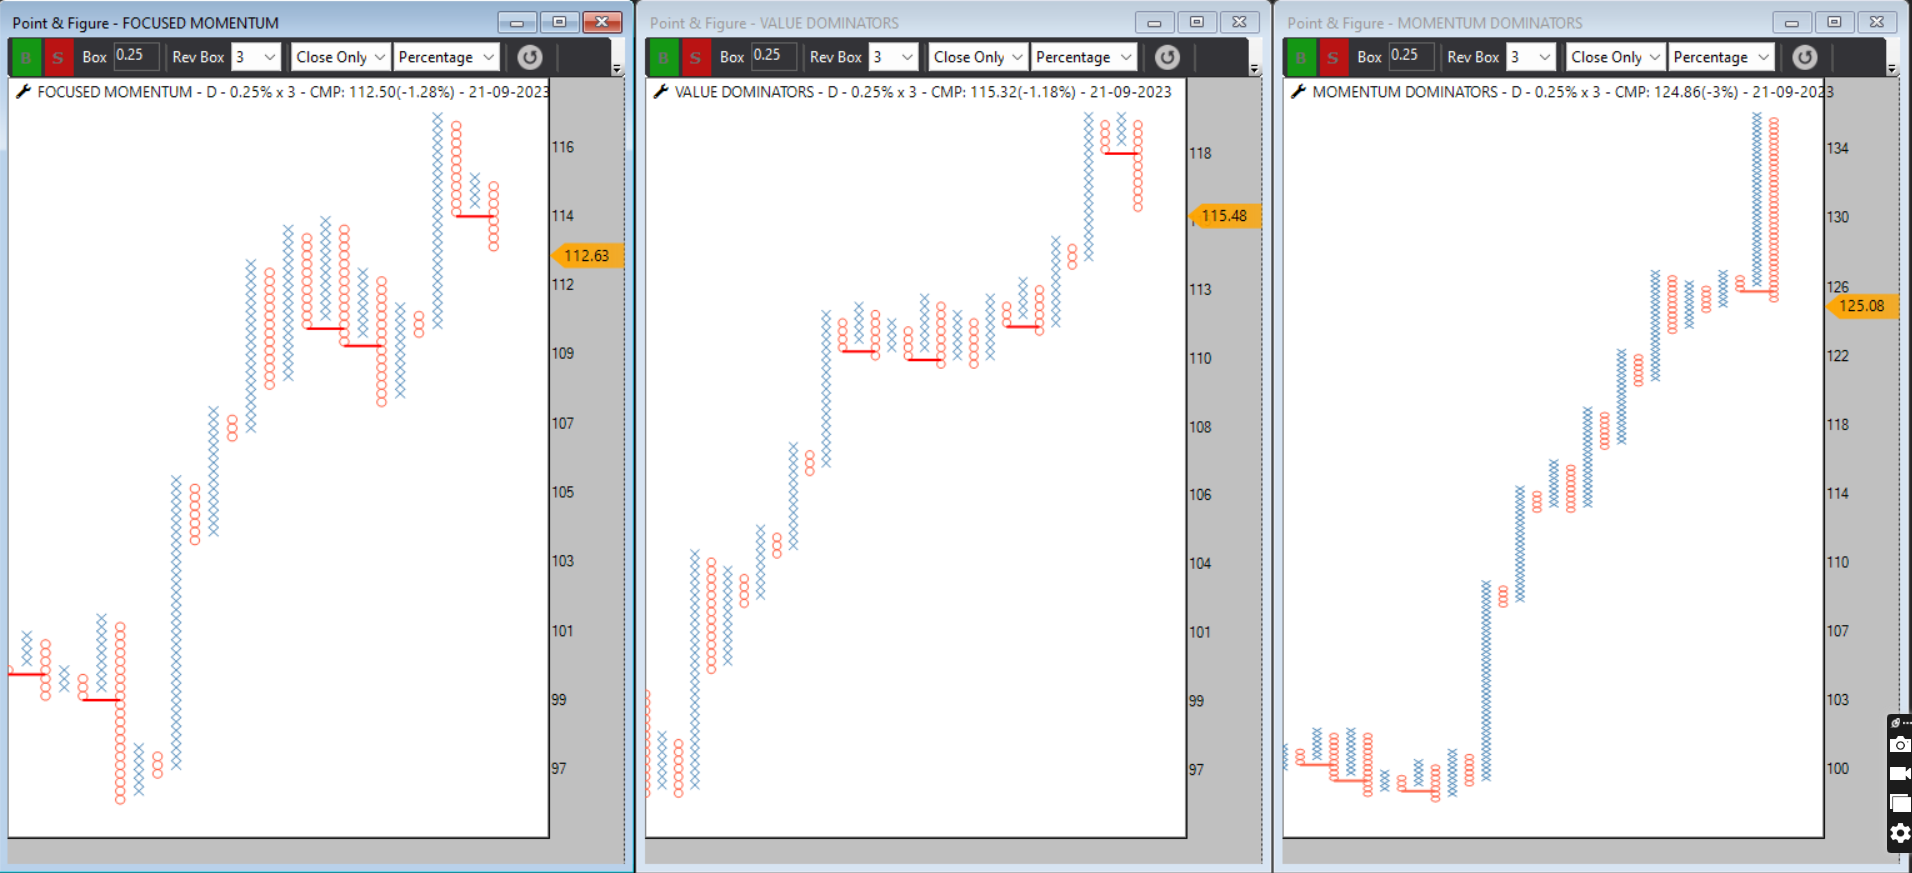
#Nifty
Break below Rising Red trendline will confirm bull trap
Need more confirmation from Indicators & Breadth data
can have some good correction if get all confirmation
once connfirmation comes can look to GOLDBEES
#AhmedabadNest #nifty #nseindia #StockMarket #india #analysis
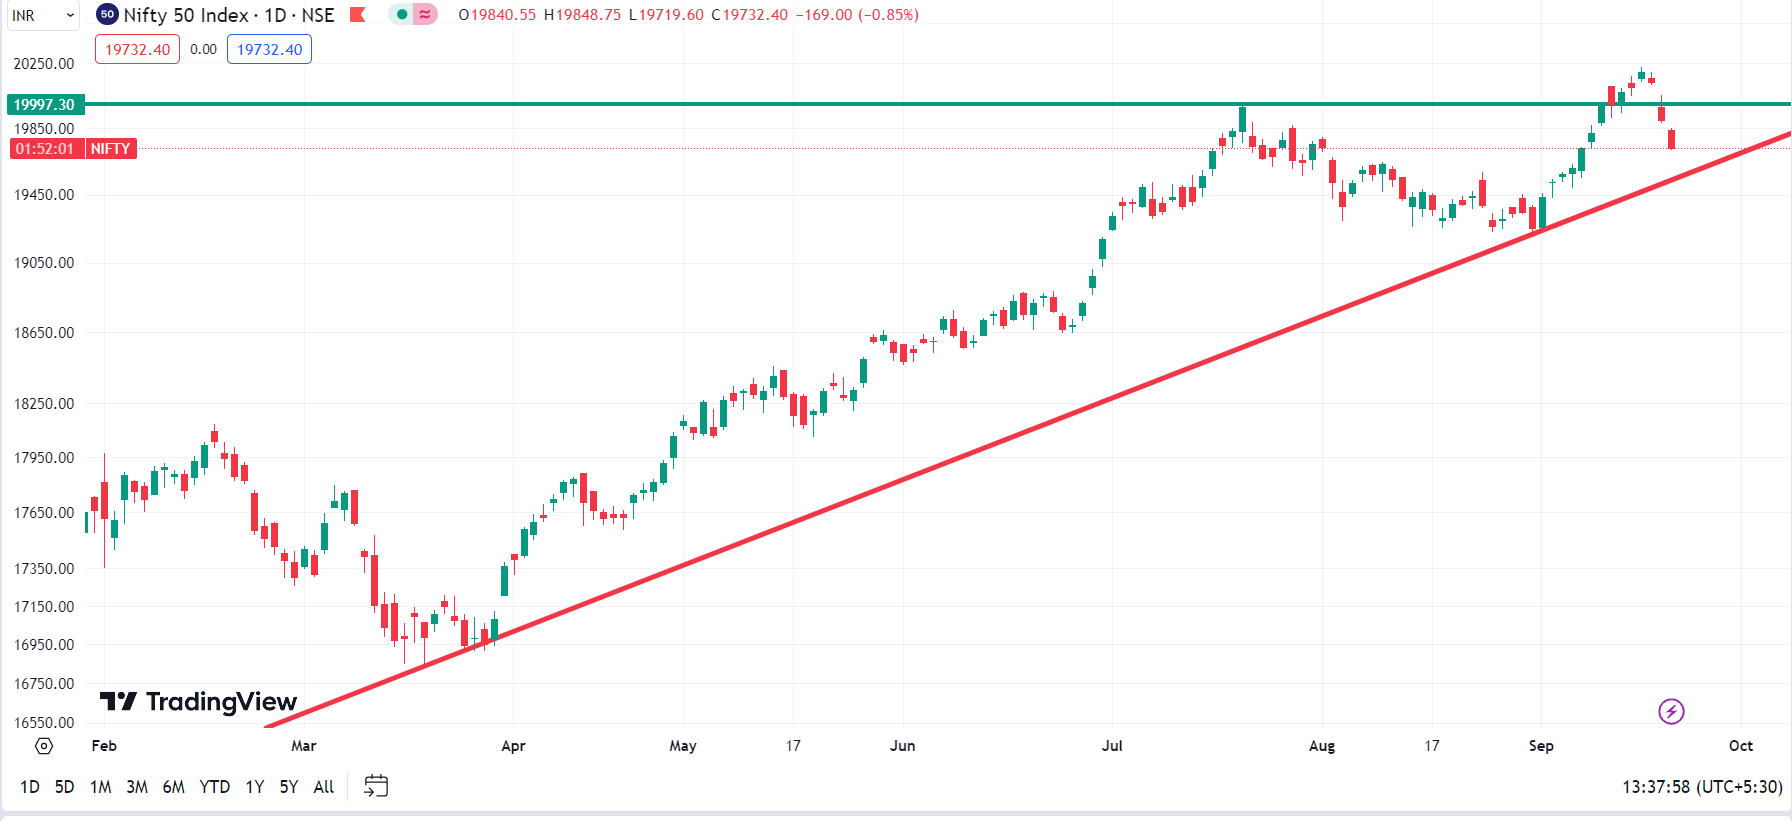
82 Days Time Cycle for Nifty 50
Nifty has wonderful ups & down based on 82 days fixed time interval
As J M Hurts principal of Variation -> Financial market dosent repeat exat cycle ,it has its own variation
so i have put 21 days EMA to follow bullish & bearish cycle
If bullish period & Price Below 21 EMA then ignore bullish phase
If bearish period & Price Above 21 EMA then ignore bearish phase
Currently in bullish cycle which is going to mature around 16th november 2023 as long as holds 21 EMA i am bullish
#AhmedabadNest #Cycle #analysis #StockMarket #NSE
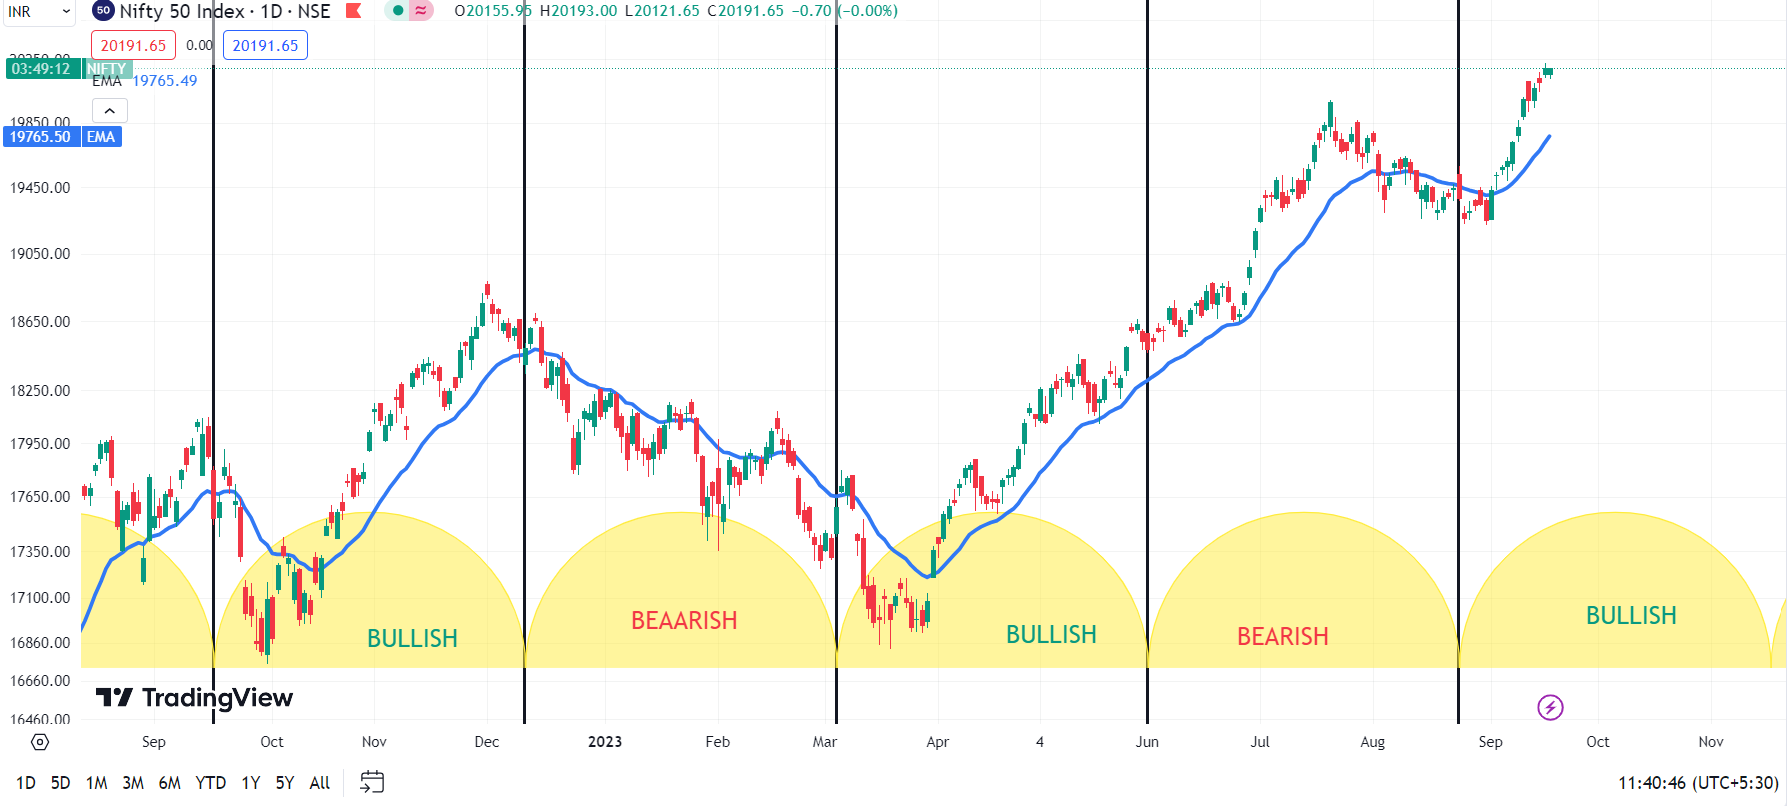

RS analysis of Value Dominators VS Momentum Dominators
Value was constantly underperforming Momentum-> still below super trend but now it seems bottming out & once we see it cross super trend means quality stock has batter Risk Reward
10 stock portfolio has already been shared one can look towards the stocks for Breakouts
#AhmedabadNest #value #Momentum #dominators #nseindia #StockMarketindia #analysis

Value Dominators Portfolio Analysis
Above Super Trend now preparing for Super Pattern breakout
Sharing Names ITC CCL ZYDUSLIFE NSLNISP OFSS BAJAJ-AUTO MAHSCOOTER DRREDDY IRFC HCLTECH
Next Re balance in october month
#AhmedabadNest #portfolio #RS #analysis #stockmarkets #India
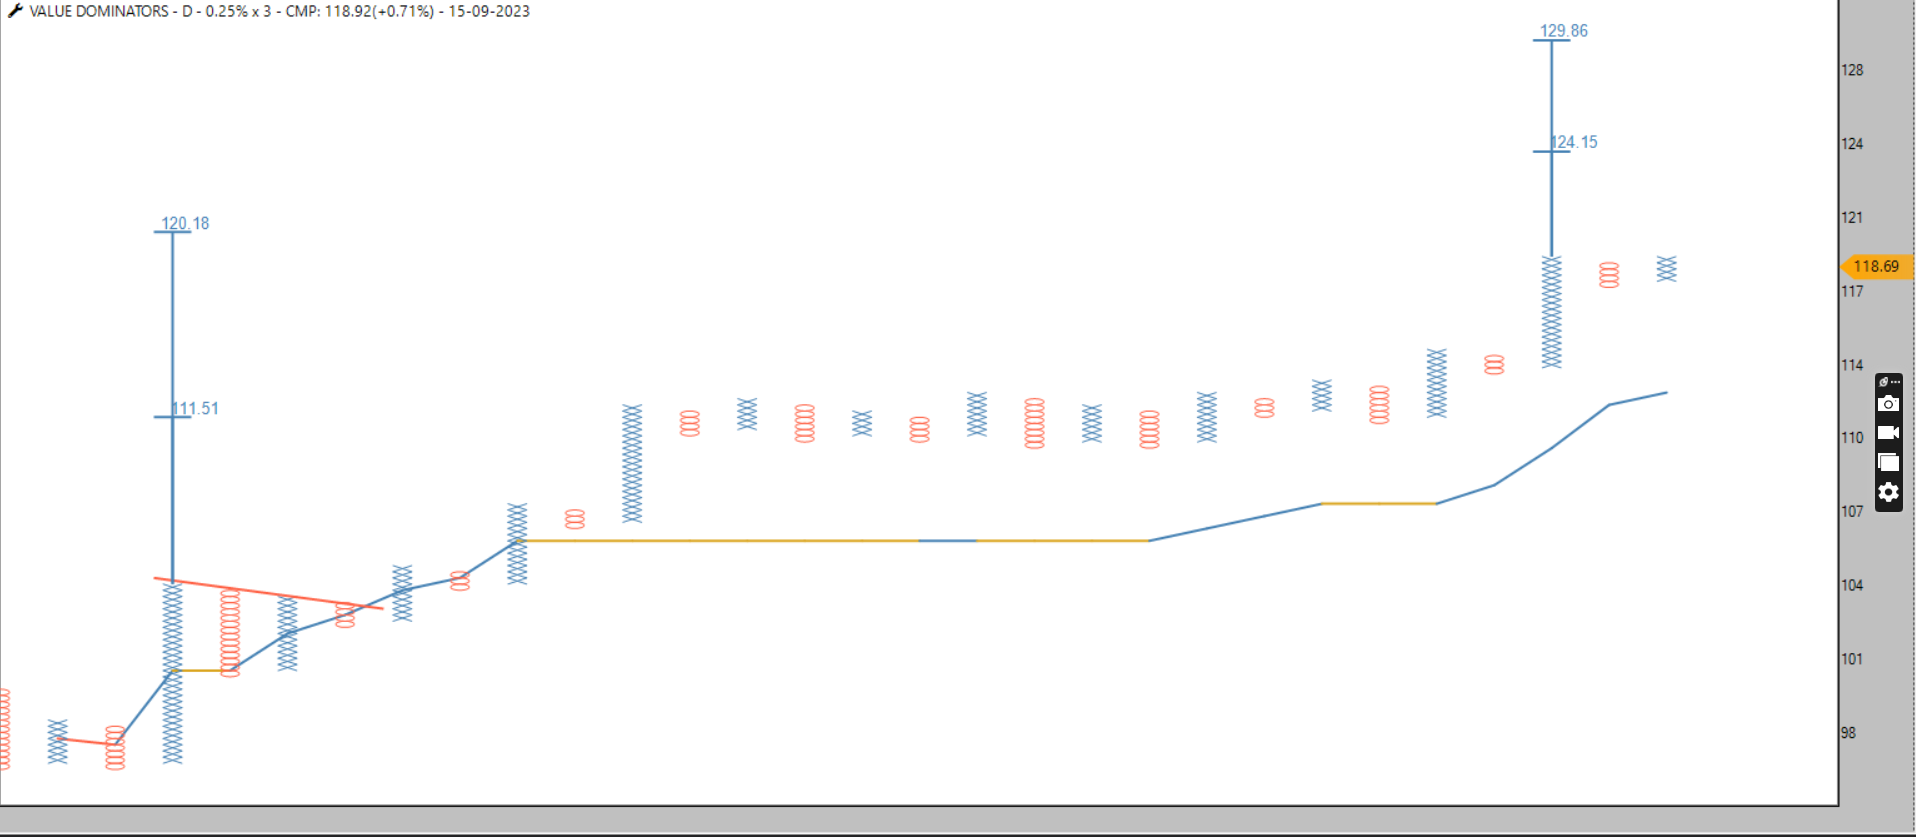
one can find active chart pattern in above stocks on various charting methods on comfertable box sizes
Value Stock Rotational Portfolio Analysis
Relative Strength Chart on Point & Figure charting Method
Above Super Trend-> Super Pattern active
as per setup the bunch will have continue outperformance against nifty 500
On Price charts how beautifully achieveing targets close above 122 will have super pattern activation towards 135
Sharing names HCLTECH CDSL PETRONET MARUTI MCX COALINDIA IRFC NMDC OFSS MAHSCOOTER
Next Re balance in october month
#AhmedabadNest #portfolio #RS #analysis #stockmarkets #India
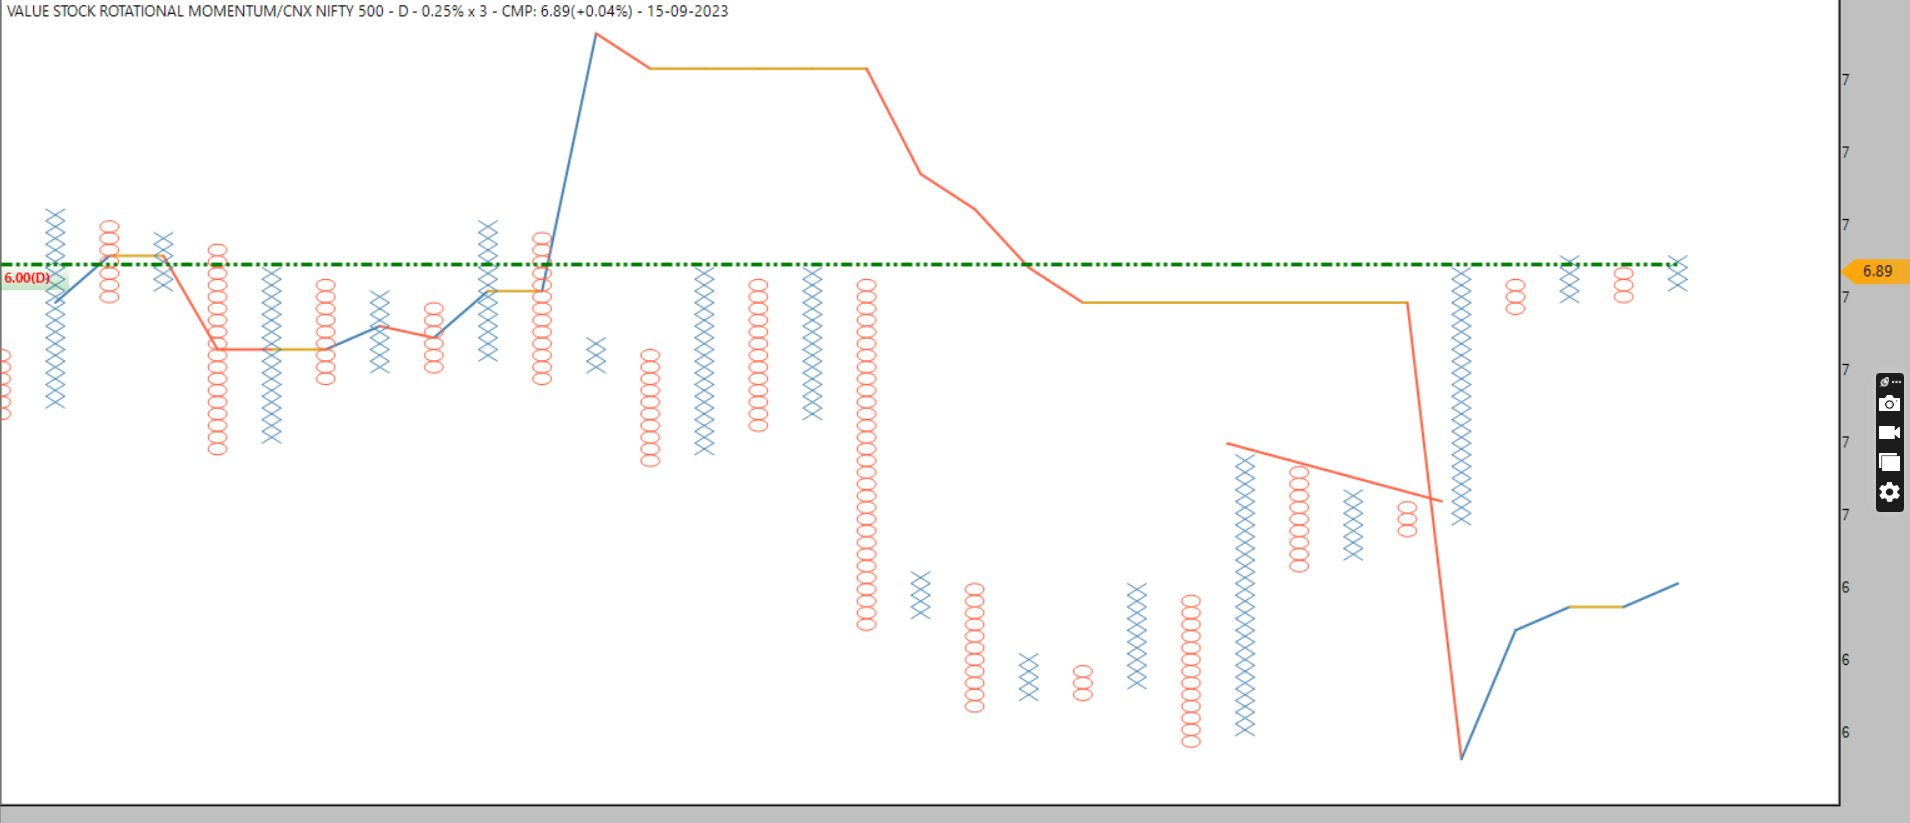
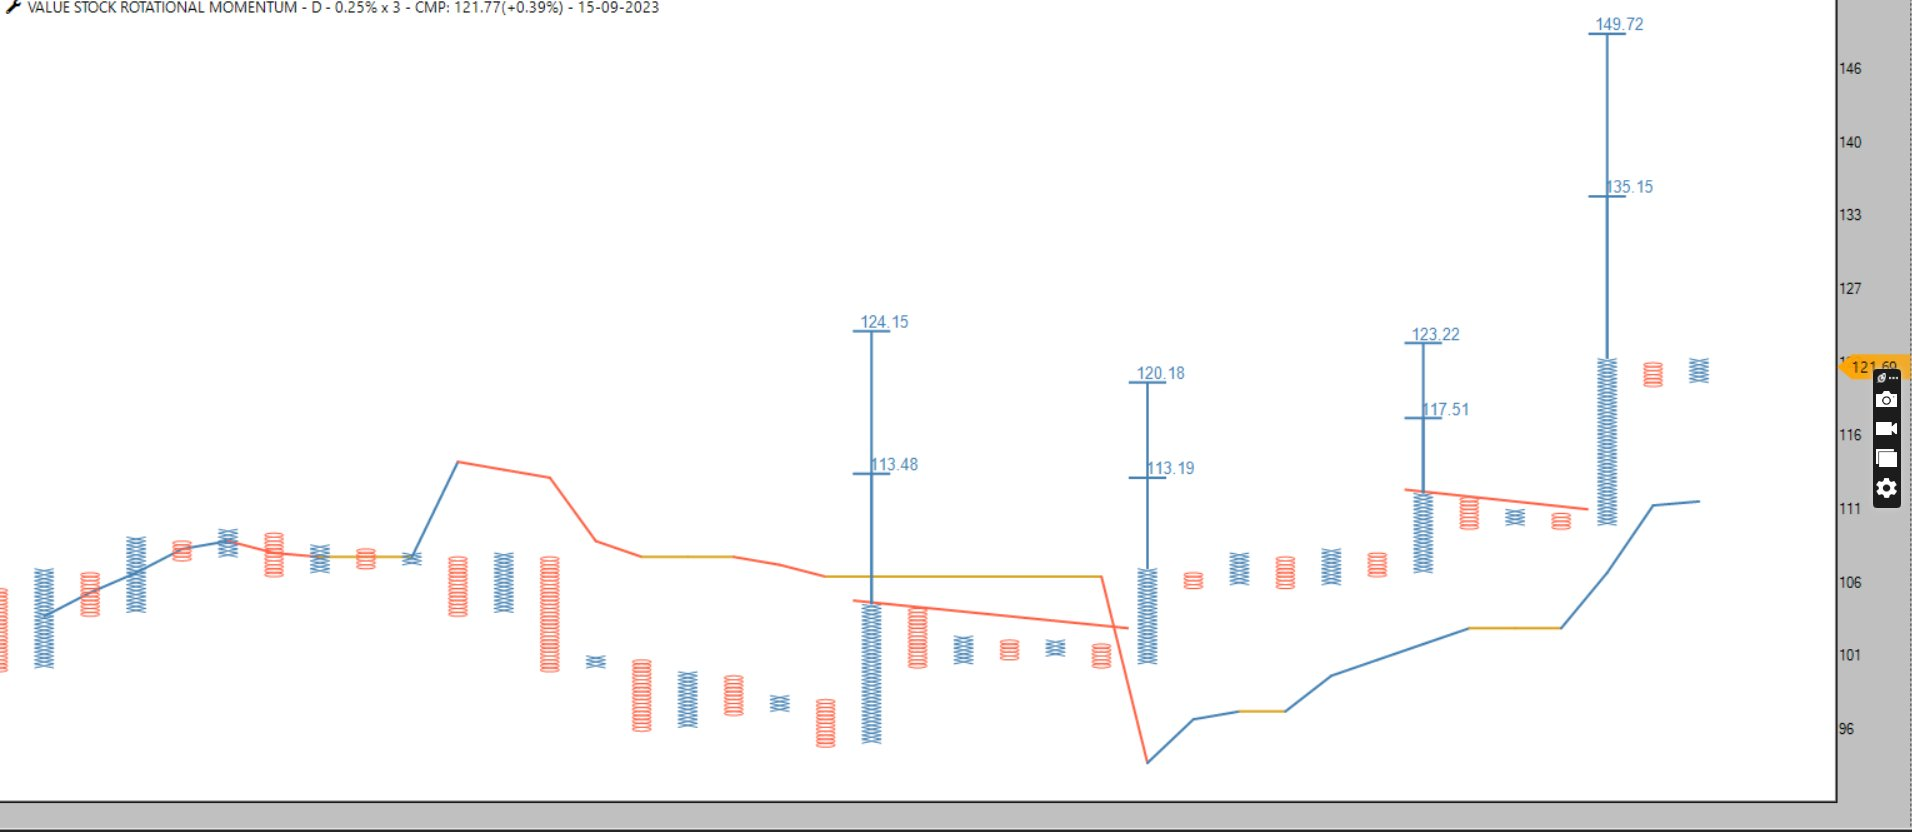
yes could be
Re balance Update 18/09/2023
Fronline Momentum
Exit Maruti Add TECHM
Focused Momentum
Exit Bajaj Holding Add ICICIPRULI
Value Dominator
Exit Bajaj Holding , ICRA,Maruti
Add NSLNISP,CCL,HCLTECH
Value Rotational
Exit Cipla,IPCALAB,Drreddy,Zyduslife
Add CDSL,CoalIndia,Hcltech,Petronet
Momentum Dominator
ExitVhel Add Cholafin
#AhmedabadNest #nseindia #StockMarketindia #momentum #portfolio
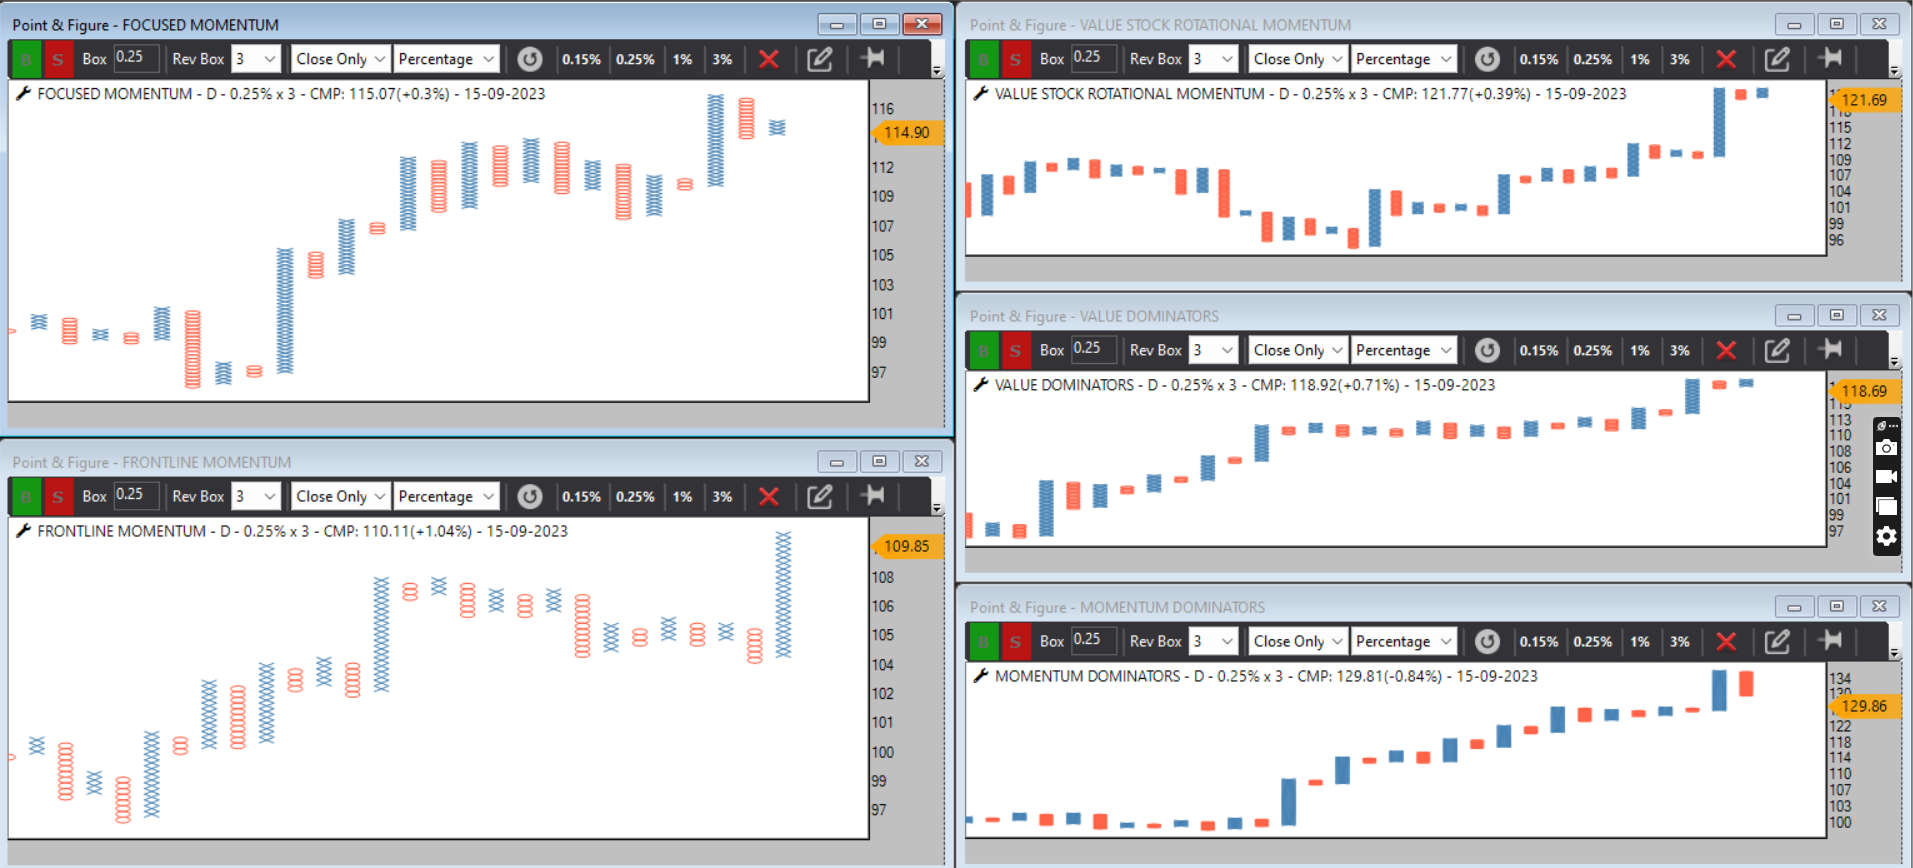
Momentum 15 Portfolio
Rotational Stock portfolio now in sell mode after stellar performance of 29%
Equity Curve Edge is the key
no update on this portfolio till it dosent gives buy signal
#AhmedabadNest #nseindia #StockMarketindia #momentum #portfolio
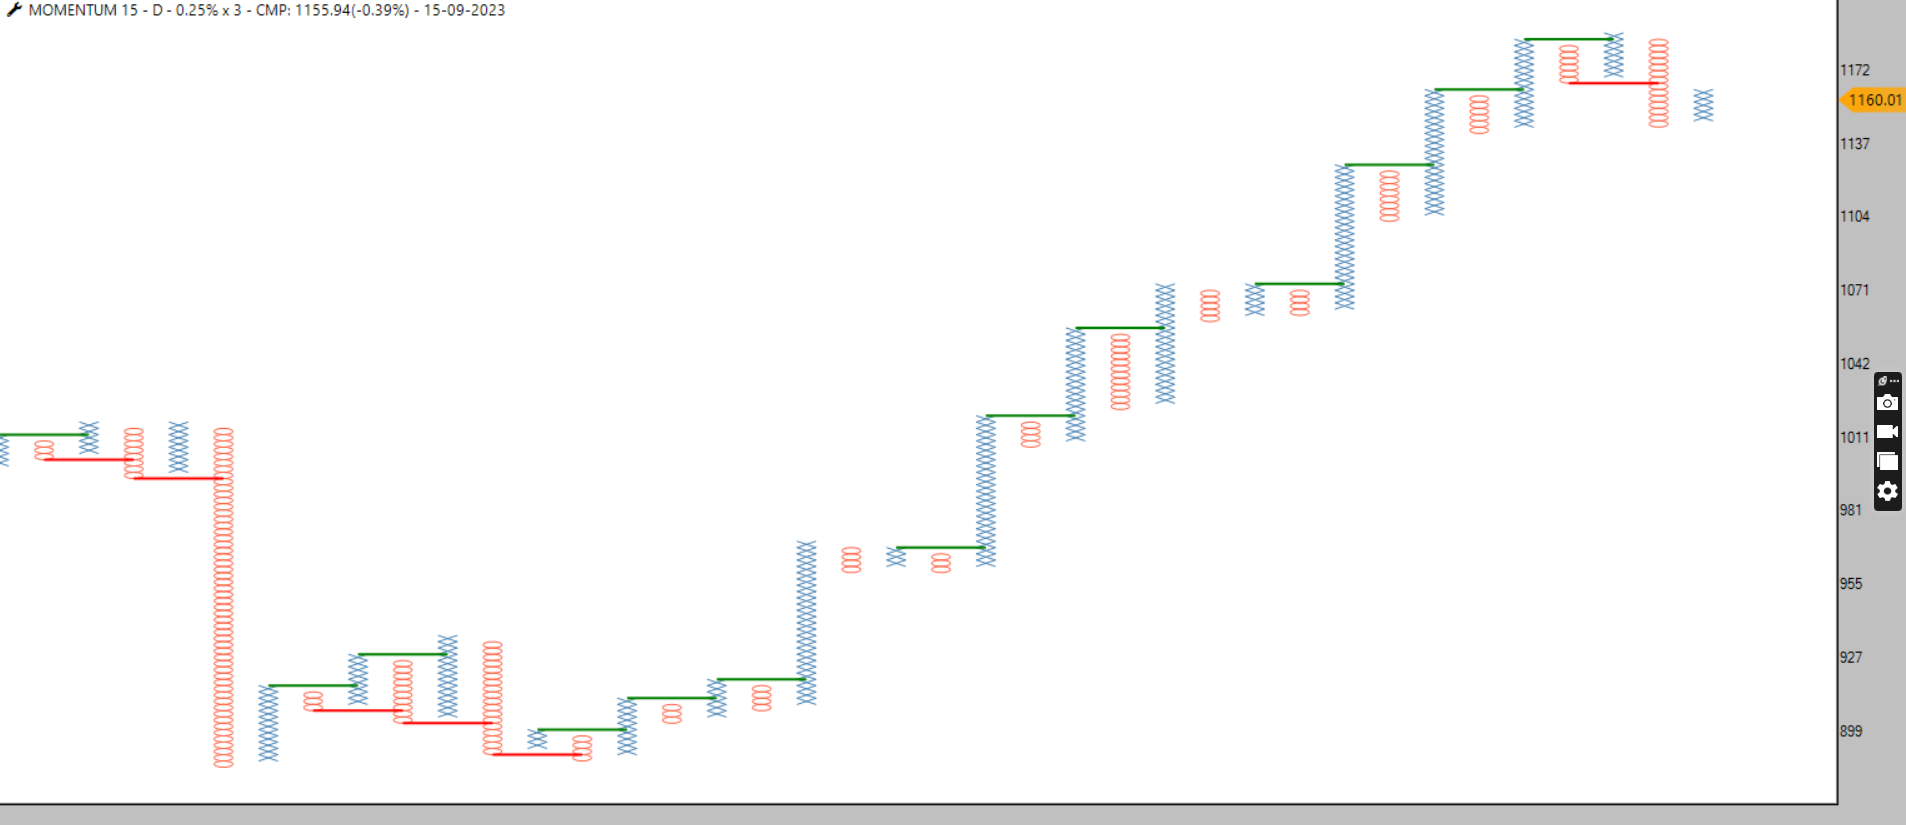
look for Ratio trend matrix
at start it was equal weighted but as & when it progress it changes its weightes
#Momentum #Dominators -Current year 32 % Return & From Entry it hit vertical count with 20 % Return
#AhmedabadNest #portfolio #nseindia #StockMarketindia

#FRONTLINE #Dominators Above 45 degree trendline-Bear trap-Open count looks strong performance from this stocks
#AhmedabadNest #portfolio #nseindia #StockMarket #india
TATAMOTORS ITC M&M MARUTI LT BAJAJ-AUTO ONGC NTPC LTIM DRREDDY
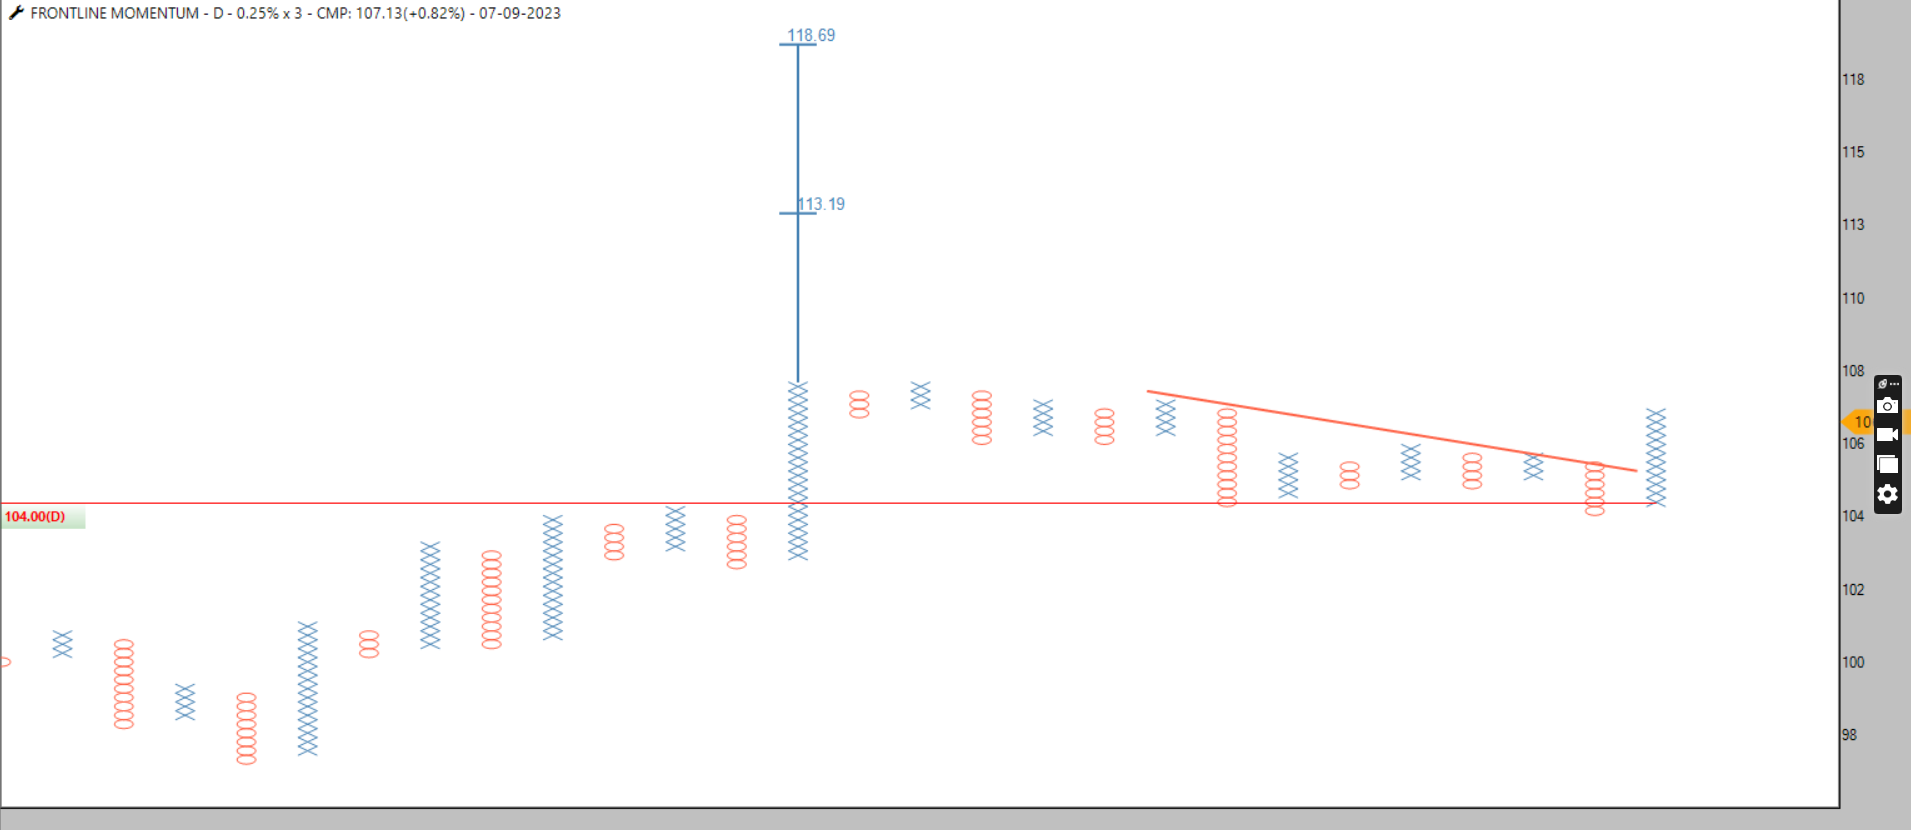
yes much needed
20 Stock for next 15 days
all are in strong bullish trend
one can find pattern/breakout in charting methods and time frame of their comfert
use this list for intraday/swing/positional trading
#AhmedabadNest #momentum #Bullish #Universe #nseindia #StockMarketindia
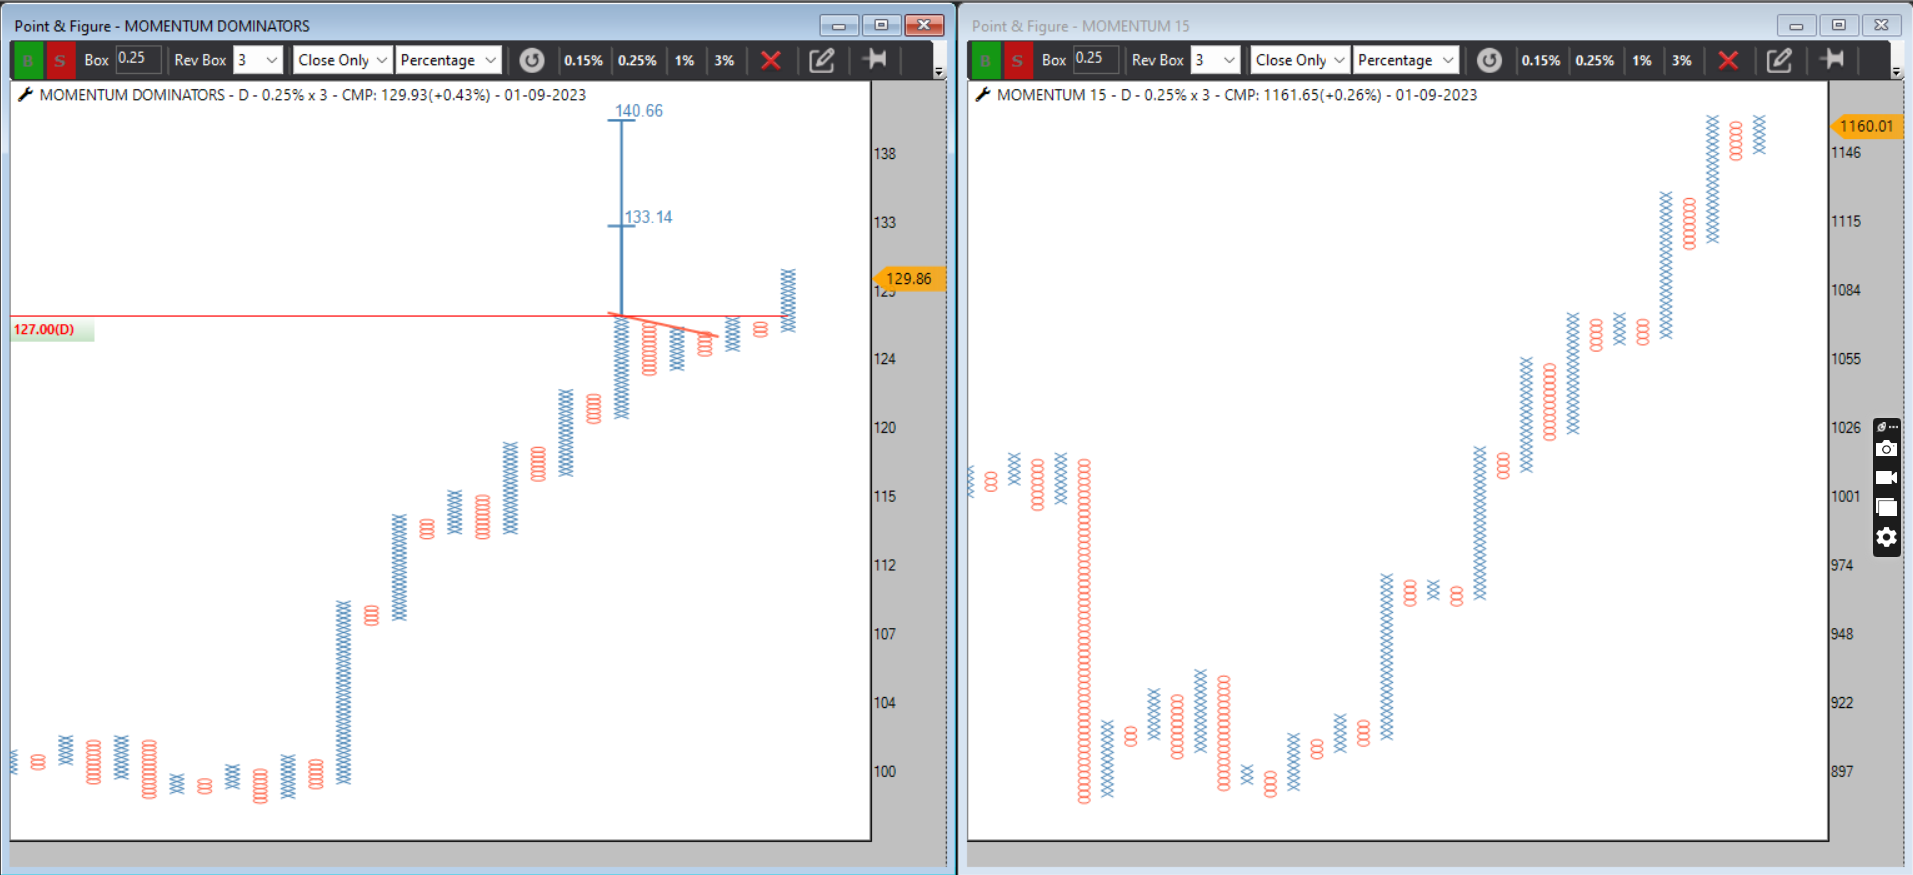
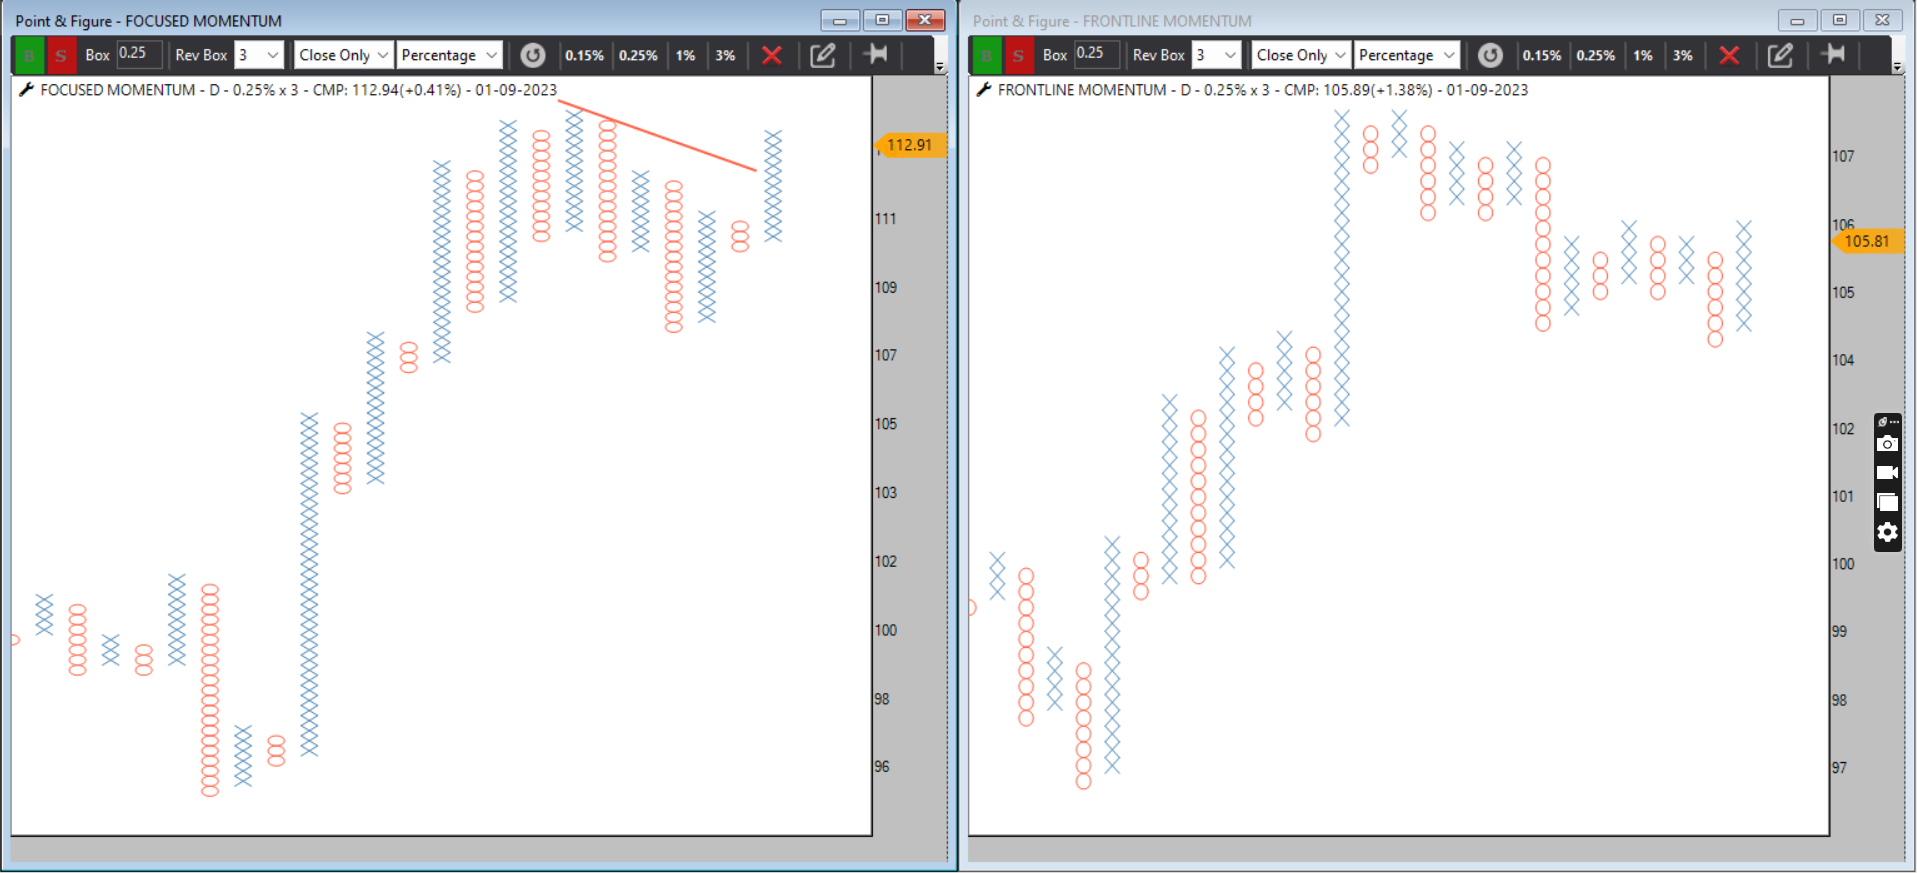
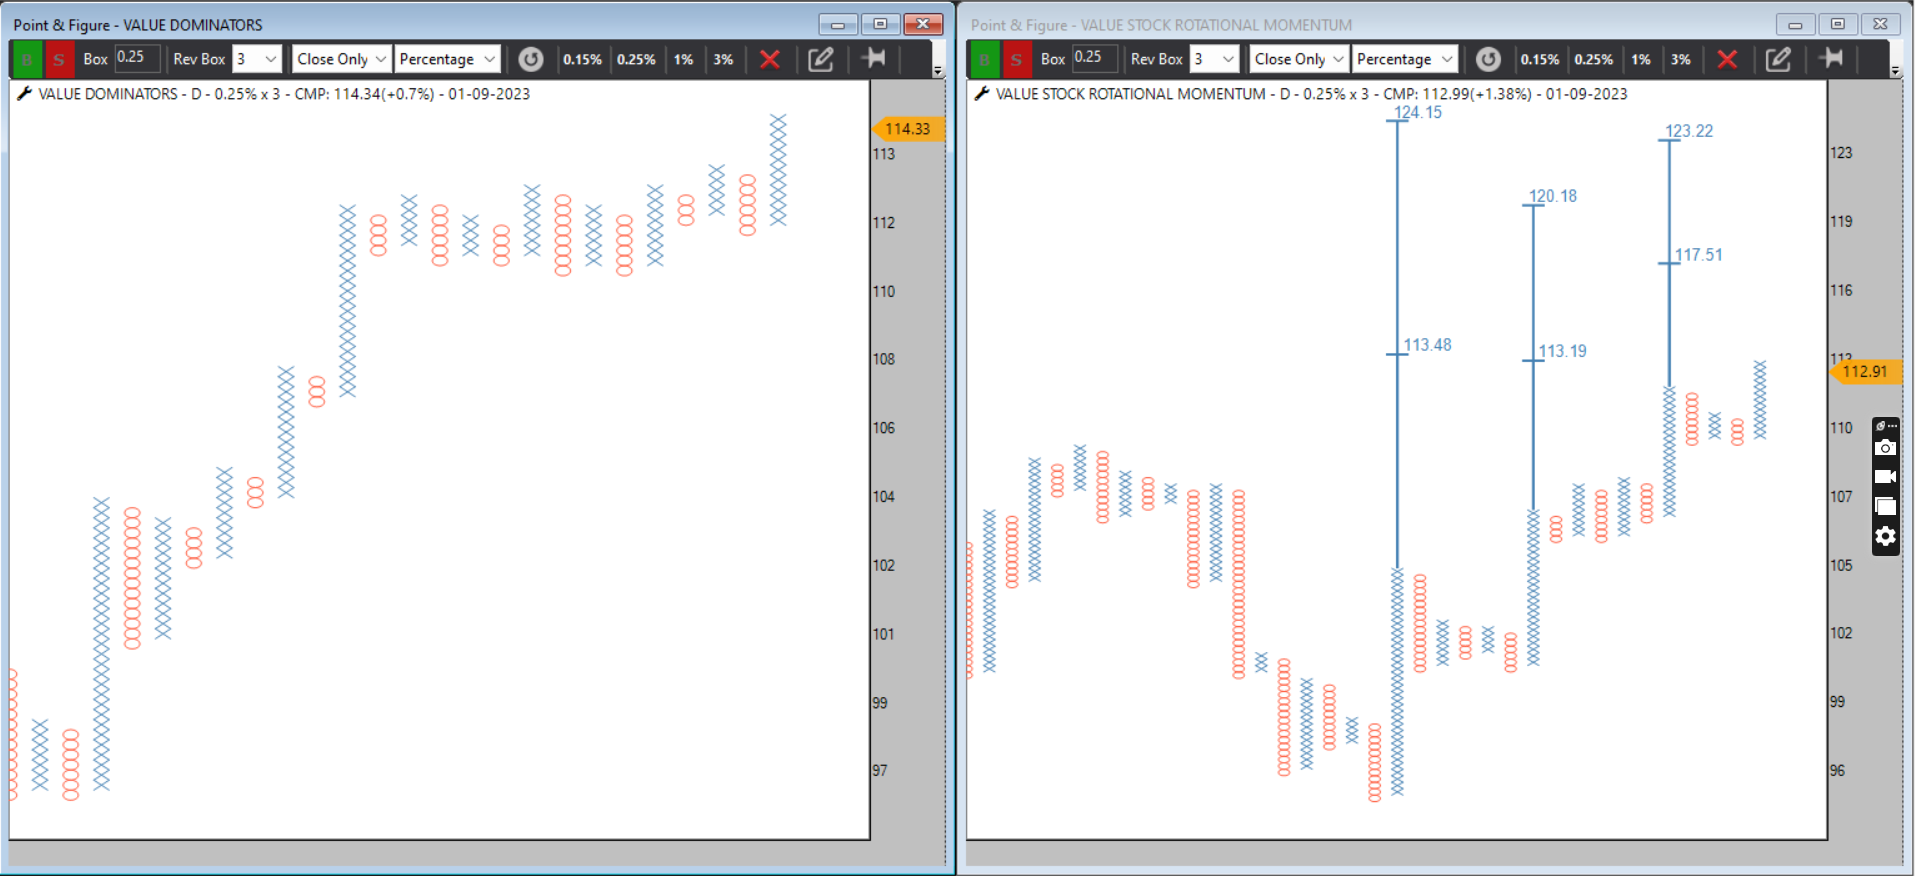
all my momentum back portfolio are in buy mode
Below is the list of stocks with their current weight for referance purpose
Re balancing activity at every 15 days -next re balance on 15/09/2023
Equity curve Trading Edge is the key
#AhmedabadNest #nseindia #StockMarket #analysis
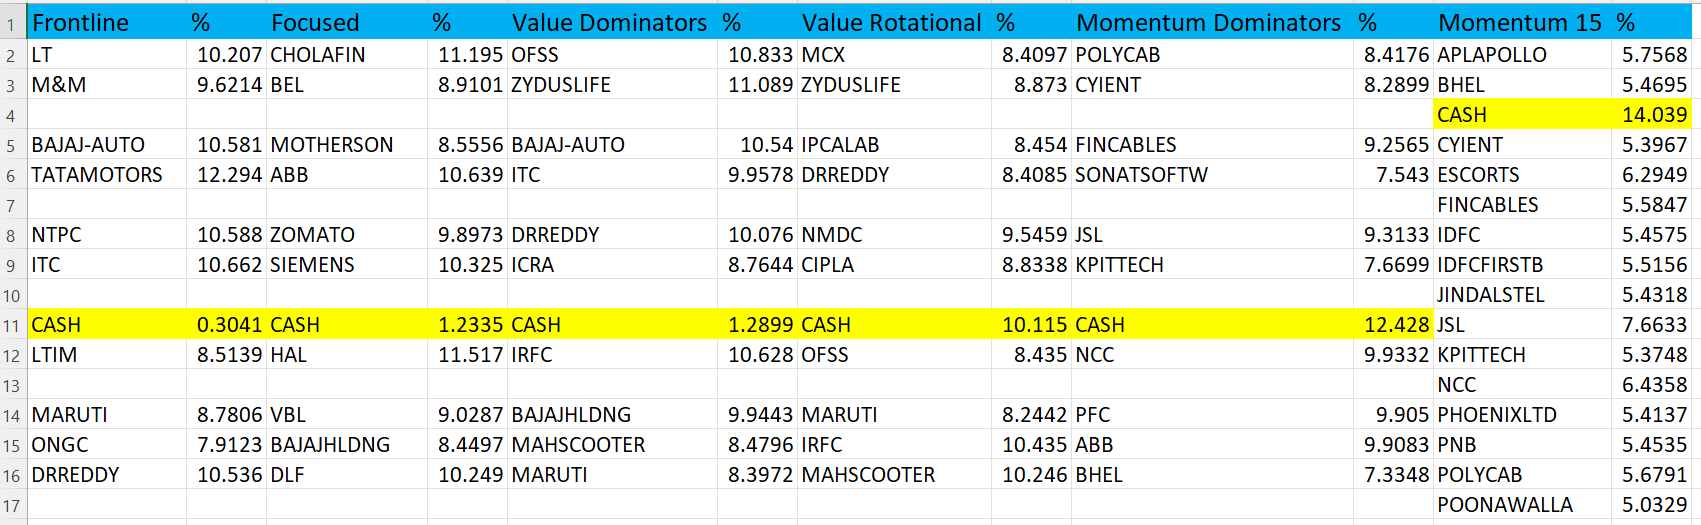
#nifty50
Bullish Scenario
on close above 19485-19500 keep sl 19250-19200 on closing basis ascending triangle can lead toward 20250
Dont play with Greed -Fear-Ego play with Price structure with favourable Risk rewards
#AhmedabadNest #nseindia #stockmarkets #analysis #pattern #bullish
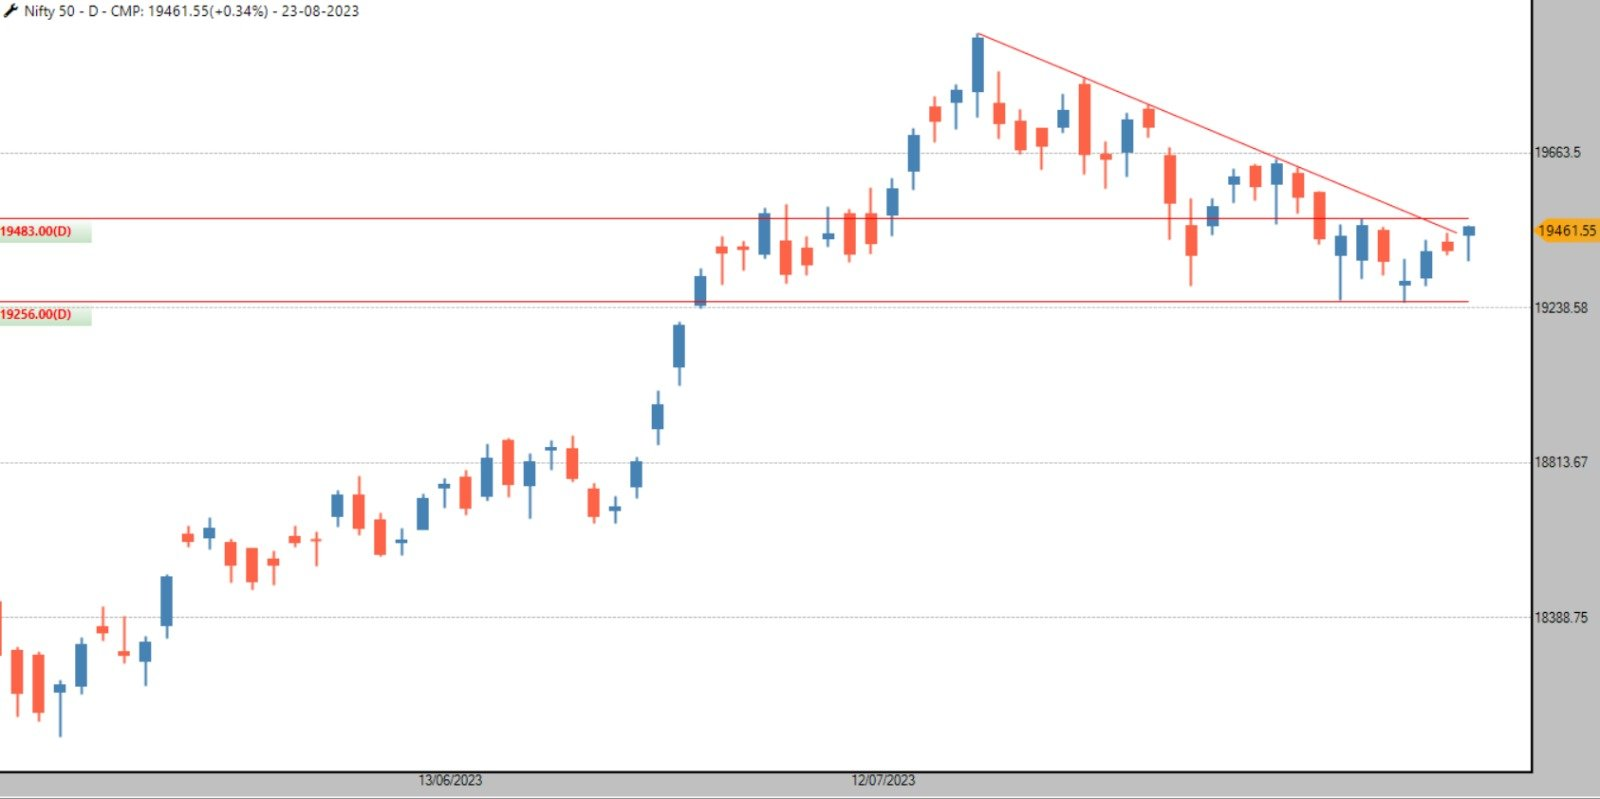
#Nifty #bullish or #bearish ?
Two pattern at same time
Bullish-close above 19600 will have ascending triangle breakout can lead to 20300 with sl 19300
Bearish-close below 19300 will activate Head & Shoulder pattern can lead towards 18600 sl 19500
Hope both #Bulls & #Bears camp happy now
without beaing biased to view play with levels
#AhmedabadNest #Nifty #analysis #technical #StockMarket #India #pattern

@AP @Prashant-Shah
Since mid of 2020 i am using the Definedge Desk Top & Zone when i joined AhmedabadNest ,last year when Launched Securities at the event of Ahmedabad slowly i shift to Definedge Securities for my Trading -specially Nifty Spread under the guidance of @AP sir
now Definedge has come with exiting Independence Day Offer with much cheaper price for DMAT account holder & the amount paid for software will be adjusted againt the brokerage which is win win for users like me -so i just renewed the Securities DeskTop & RZONE for one year
i again thank you @Prashant-Shah sir @Definedge Team for creating such good software /Study at much affordable Price
Thanks and Regards
NishshKumar Jaani
Re balance & Performance Update 14/08/2023
Nifty 500 -0.18 %
Momentum 15 + 3%
Exit IDFC
Add Cyient
Momentum Dominators +1.59 %
No re balance Required
Rest all other Portfolios are in sell mode so no Re balance Update
Edge is the key Equity Curve Trading
if you missed the list of stock then attaching in image
in case any query/question e mail on [email protected]
#AhmedabadNest #nseindia #StockMarketindia #DataAnalytics #trading #analysis
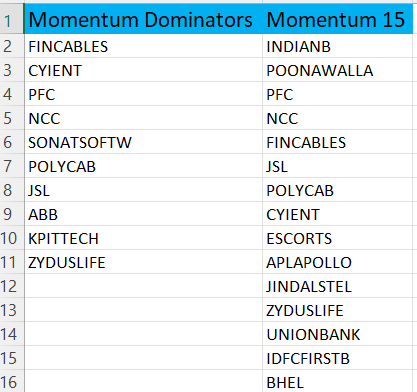
#nifty50
sharp correction below 19300 towards 18800-18700
choice is yours give it H&S / Rounding Top Pattern
why anticipating this move ? as my market timing model is in overbought zone and need some cool off
This correction will not affect larger structure infact this is just Thrawback to the breakout point which
in longer structure i am not in Bears camp
#AhmedabadNest #nseindia #pattern #analysis #StockMarketindia

Re balance & Peformance Update
Nifty 500 -0.34%
Value Rotational + 0.71
Exit HeroMoto/Maha Scooter
Add IRFC/ICRA
Momentum Dominators -1.37%
Exit EquitasBank/CholaFin
Add Kpittech/Zyduslife
Momentum 15 -1.1%
Exit PNB/EquitasBank
Add Poonawala/IDFCFIRSTB
Edge is the key Equity Curve Trading
if you missed the list of stock then attaching in image
in case any query/question e mail on [email protected]
#AhmedabadNest #nseindia #StockMarketindia #DataAnalytics #trading #analysis
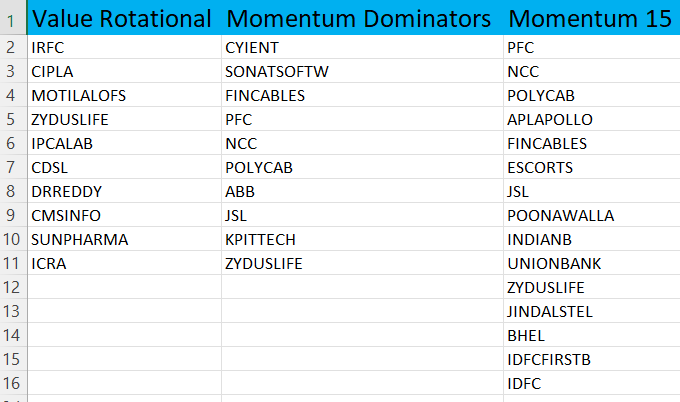
USDINR
Ascending Traingle formation
let it breakout up or downside that will give direction to indian equity market
#AhmedabadNest #USDINR #Currency #trading #india
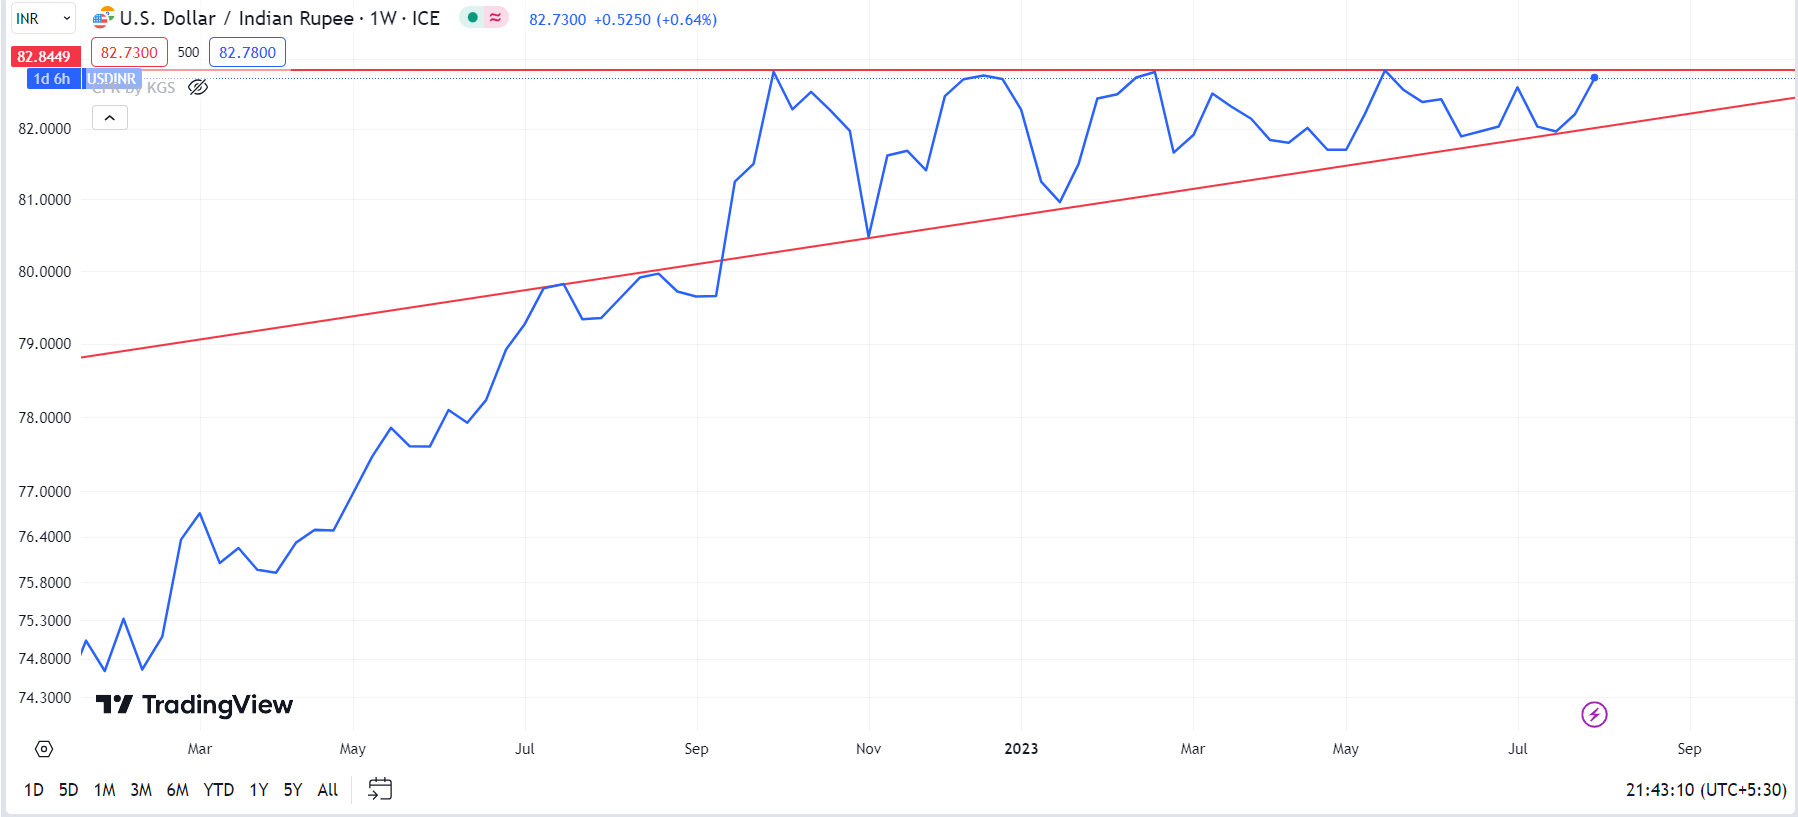
Focused Momentum Portfolio Update
After generating 12.44% return now this portfolio is giving Double Bottom sell signal
no further portfolio stocks will be shared till fresh buy signal comes
#AhmedabadNest #Focused #momentum #nseindia #stockmarkets
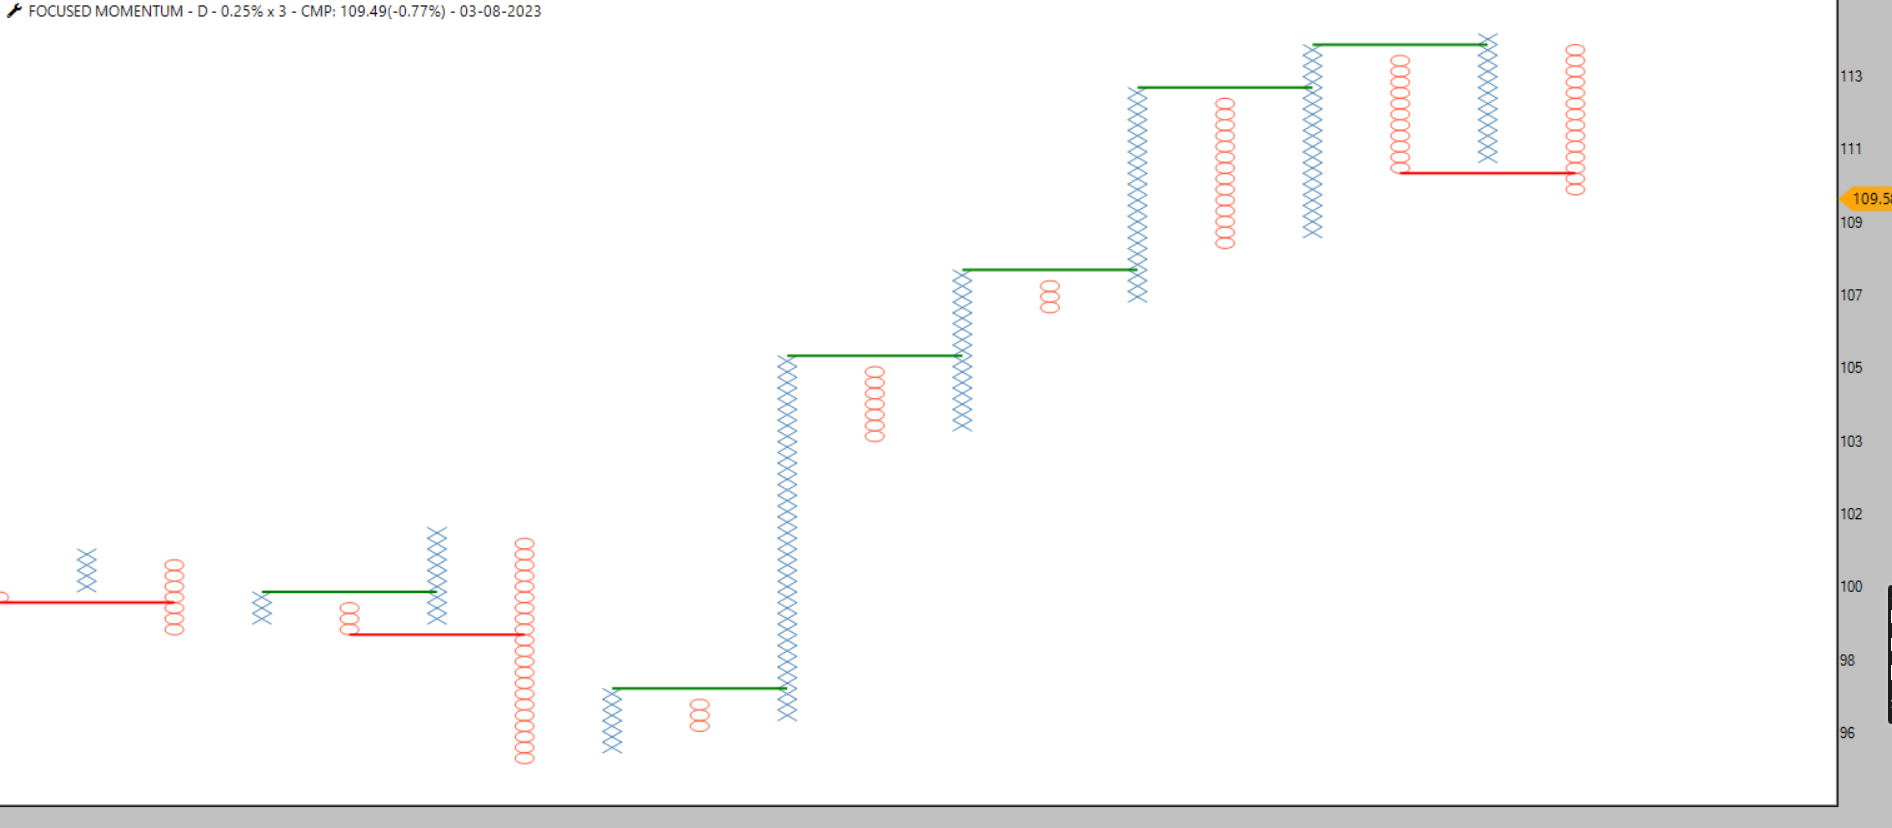
Value Dominators Portfolio Update
After DTB now in DBS so exit is the strategy
no portfolio stock will be shared till further breakout
#AhmedabadNest #ValueInvesting #dominators #portfolio #NSE #StockMarket #india
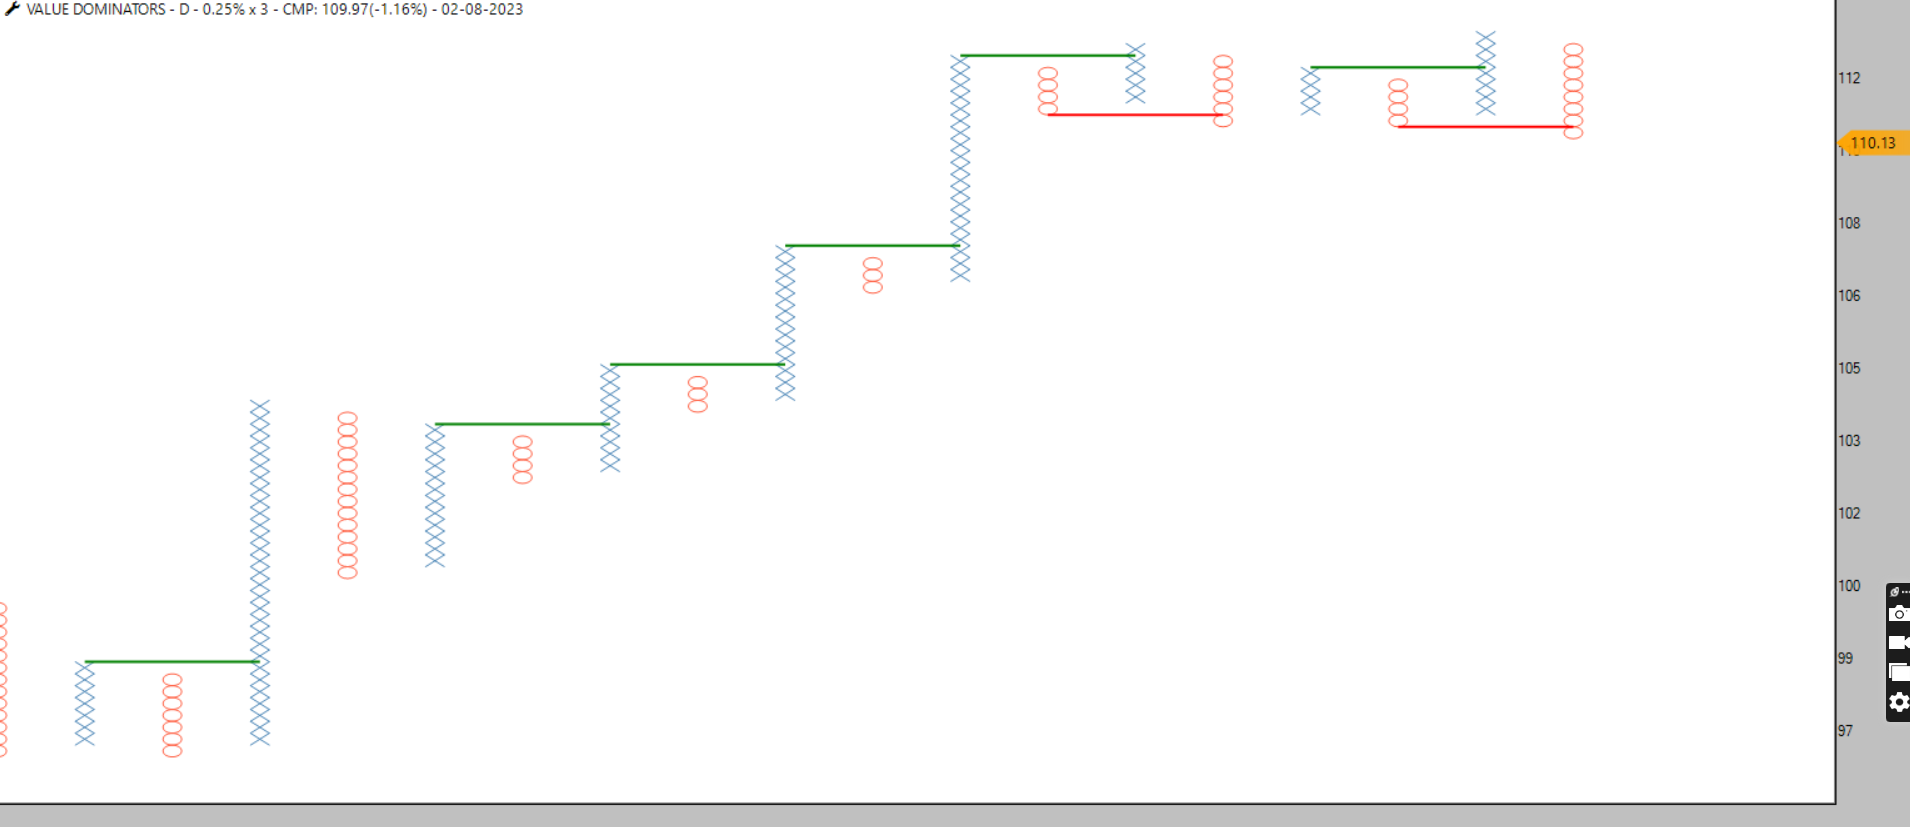
#Nifty
my market timing model is in overbought zone expecting correction towards 19200-18800 that will help to cool of the model and will give another opportunity to participate in next big rally
#AhmedabadNest #nseindia #StockMarket #India #analysis #correction #retracement
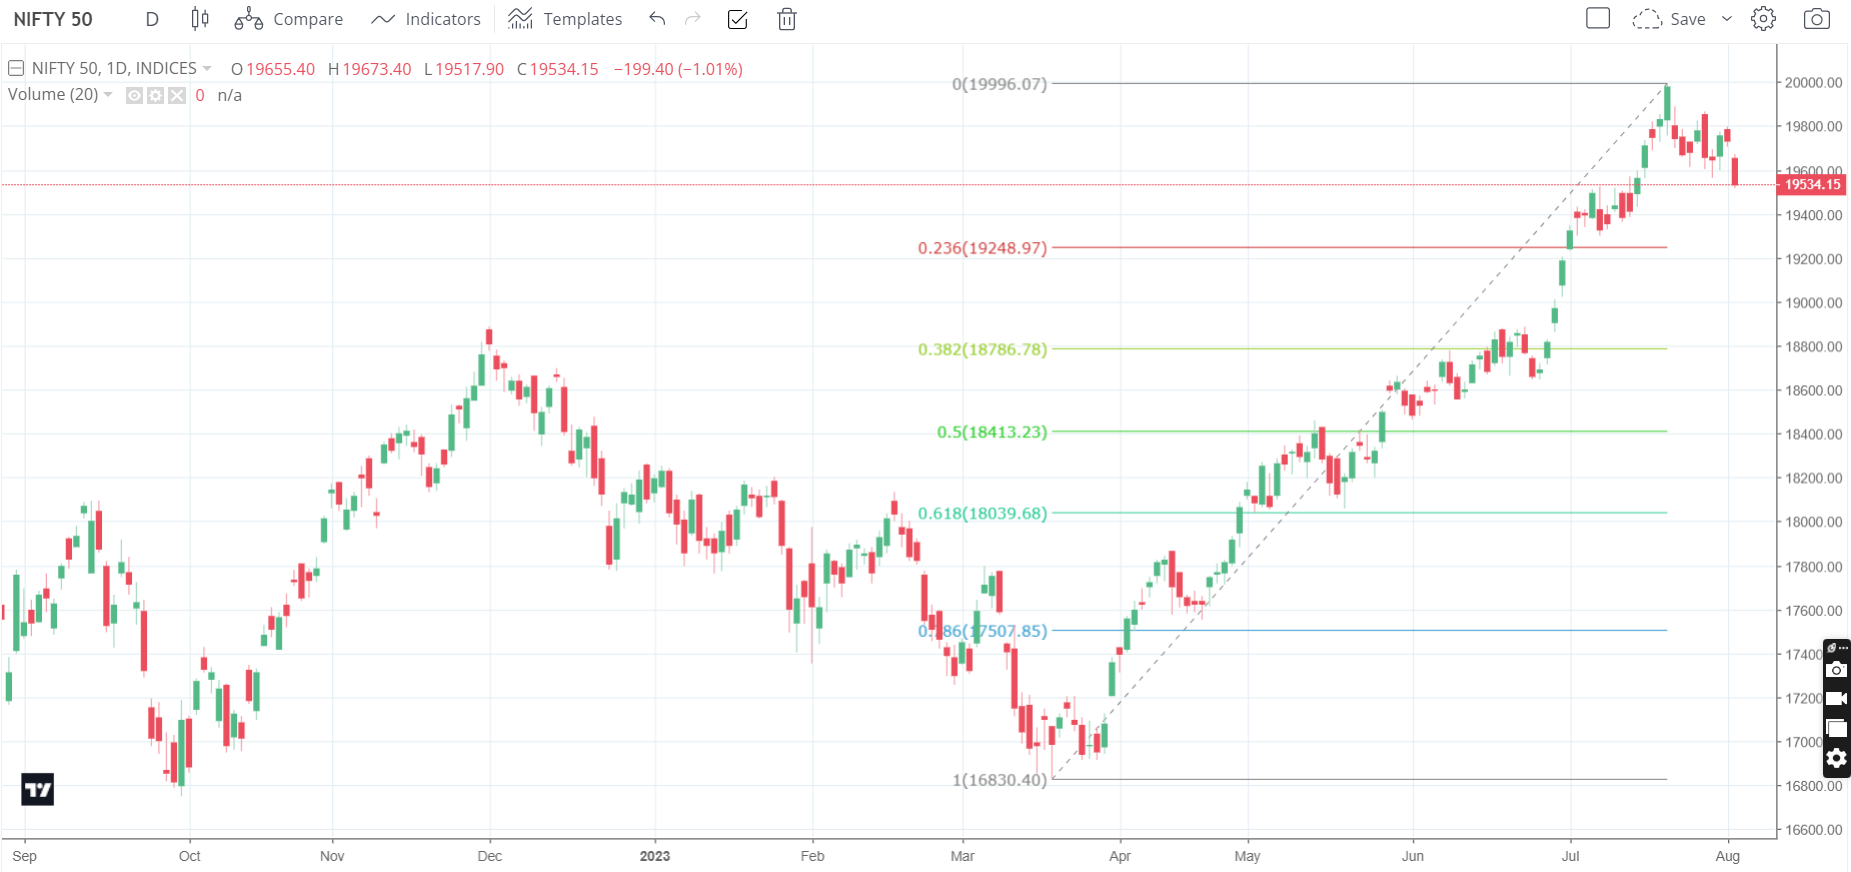
Booked out KOTAKALPHA BEES at 32.42 entry was at 26.15 on 25/4/2023 with gain of 24 %
#AhmedabadNest #nseindia #StockMarketindia
#Nifty
weekly charts with some channels
#AhmedabadNest #analysis #technical
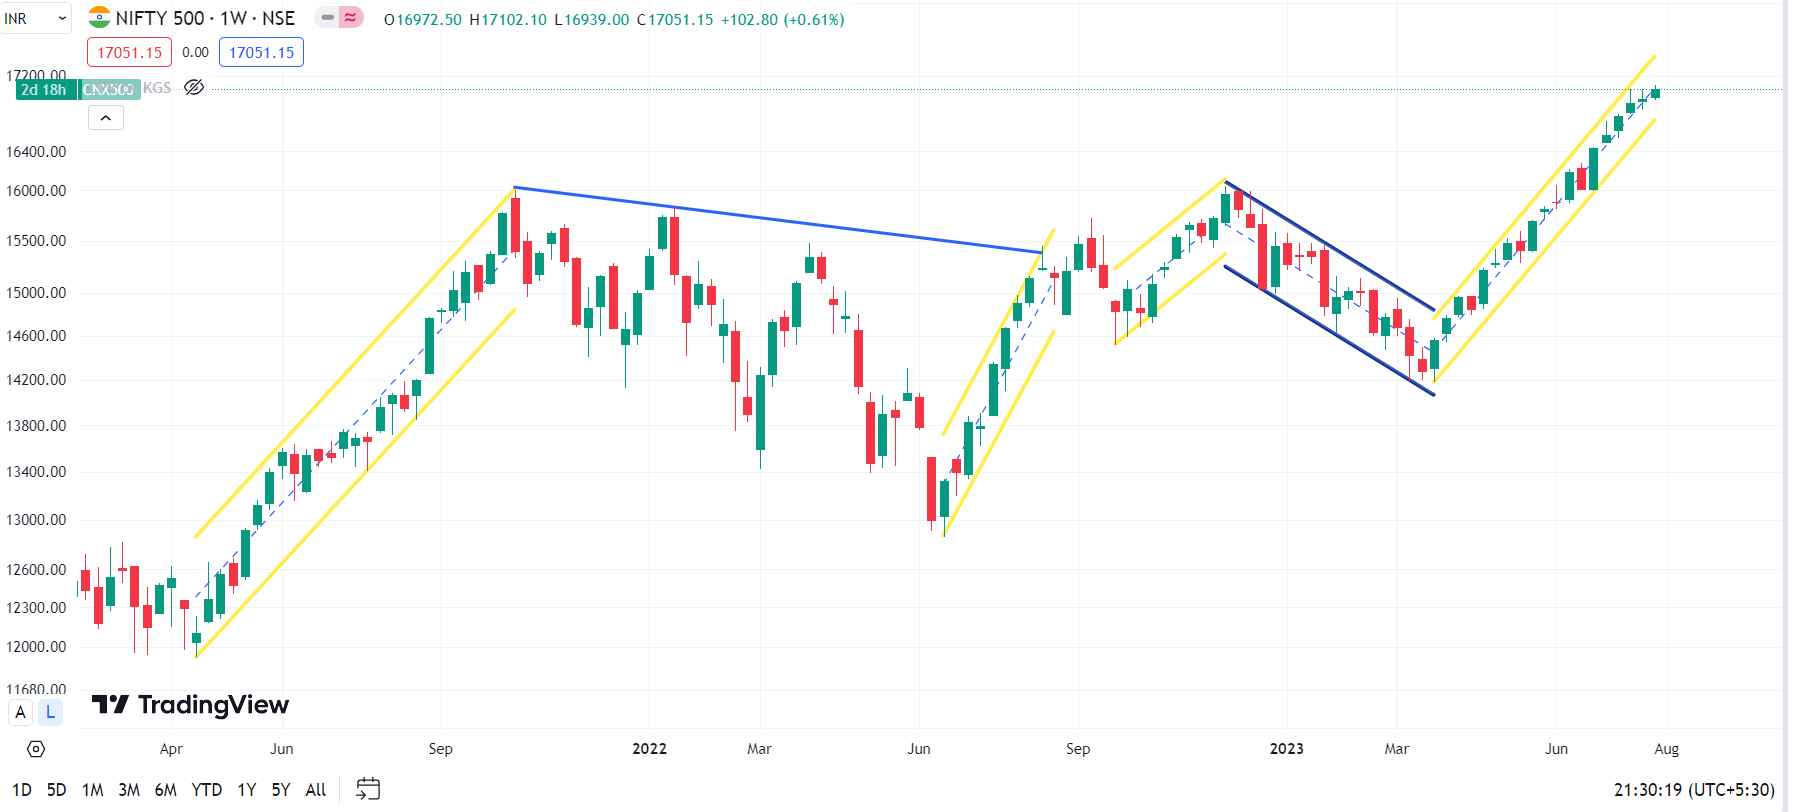
10 stock Equal Weighted #portfolio
For AUG 2023 to July 2024
No re balancing till JUly 2024
one can plot own chart on
Currently in DTB buy pattern with SL 3.20%
@in_tradingview
Amibroker to get own signals
#AhmedabadNest #NSE #StockMarket #trading
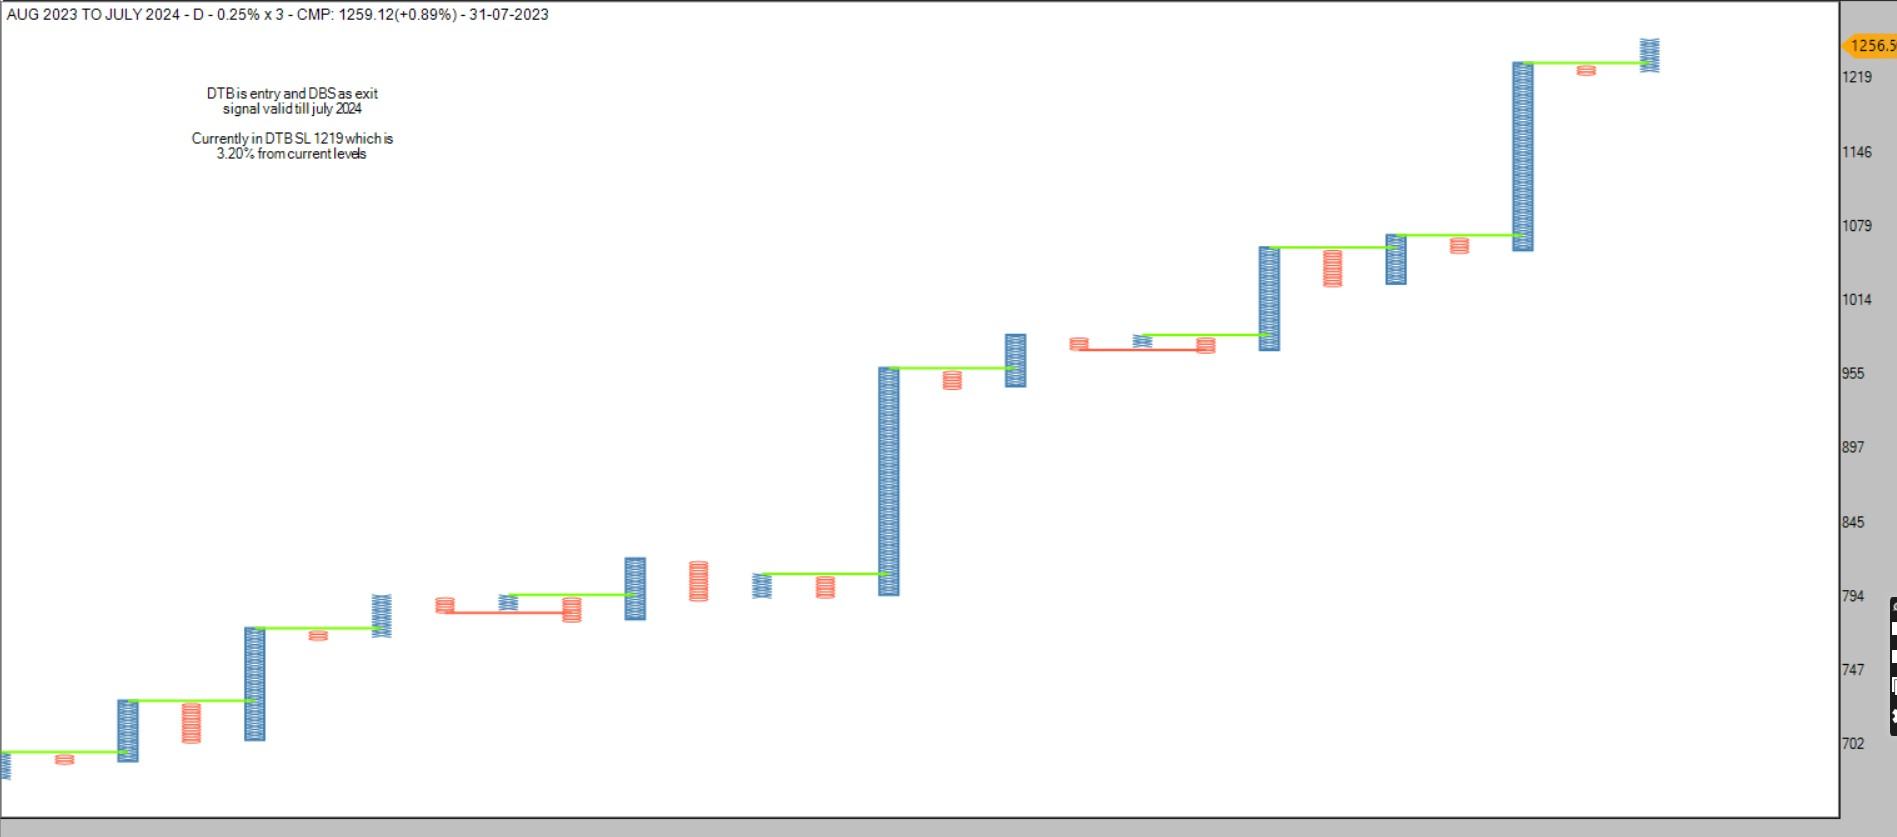
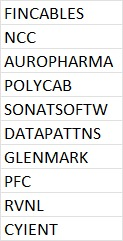
Nifty 500 +0.26%
Momentum Dominators + 3.8%
No Re Balance Required
Momentum 15 + 3.3%
Exit-M&M/CGPOWER
Add-AplApollo/Escorts
Focused Momentum + 2.25 %
Exit -IOC
Add-BEL
Value Rotational + 1.39%
Exit-UTIAMC/ITC/BAJ AUTO
Add-Cipla/Drreddy/IPCALAB
Edge is the key Equity Curve Trading
if you missed the list of stock then attaching in image
in case any query/question e mail on
[email protected]
#AhmedabadNest #nseindia #StockMarketindia #DataAnalytics #trading #analysis
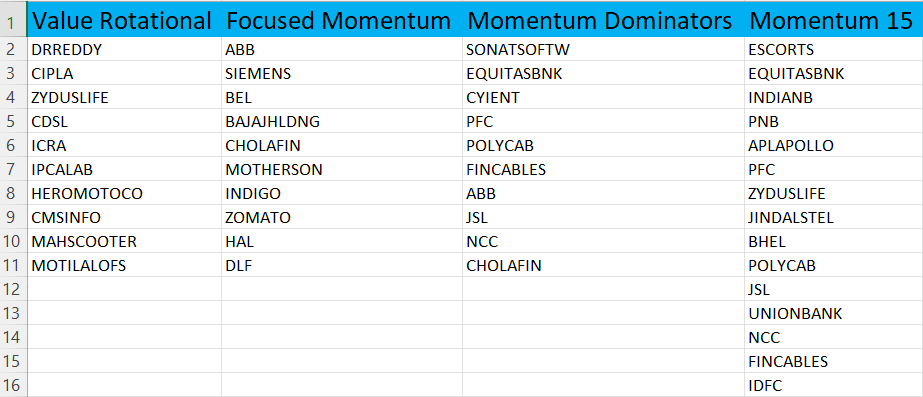
Value Dominators Portfolio
after generating 11.88% Returns given DBS exit signal now again giving fresh DTB buy signal
so sharing charts of that portfolio & Portfolio stock for referance
Idea is to trade basket of fundamentally strong stock with re balance and trailing mechanisam
#AhmedabadNest #value #dominators #portfolio #stockmarkets #India #nseindia
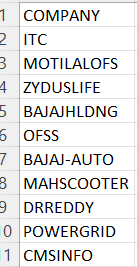
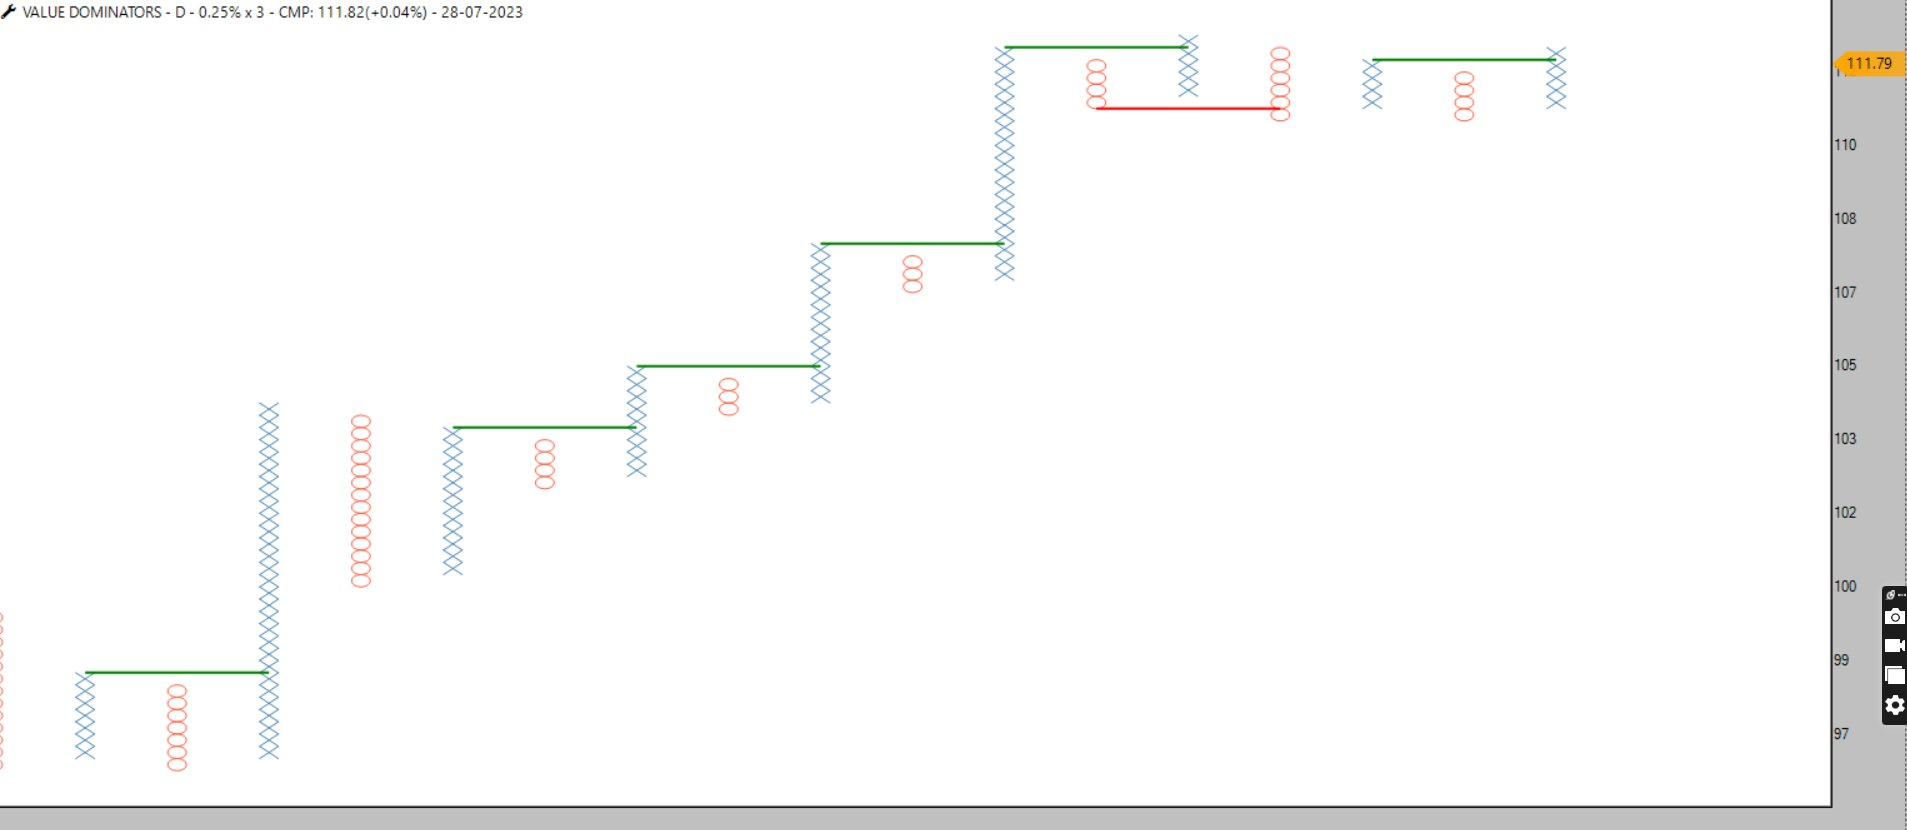
Thank you bhai
As you know i have made presentation on #VGM Concept which is to Ride momentum on Value Stock -Warren Buffett style -Parag Parikh Mutual Funds
Growth Stock-Peter lynch style-Motilal oswal Funds
now i like Hexashiled Frame work of stock selection so one can look to samco mutual funds Samco Flexicap fund
currently adding screenshot of stock one can look their factsheet everymonth after 10th to keep updating the list
read more about that concept at https://www.samcomf.com/hexaShield-tested-investments
Liknk of #VGM Prsentation https://www.youtube.com/watch?v=yUEdH9dlSHg&t=1838s
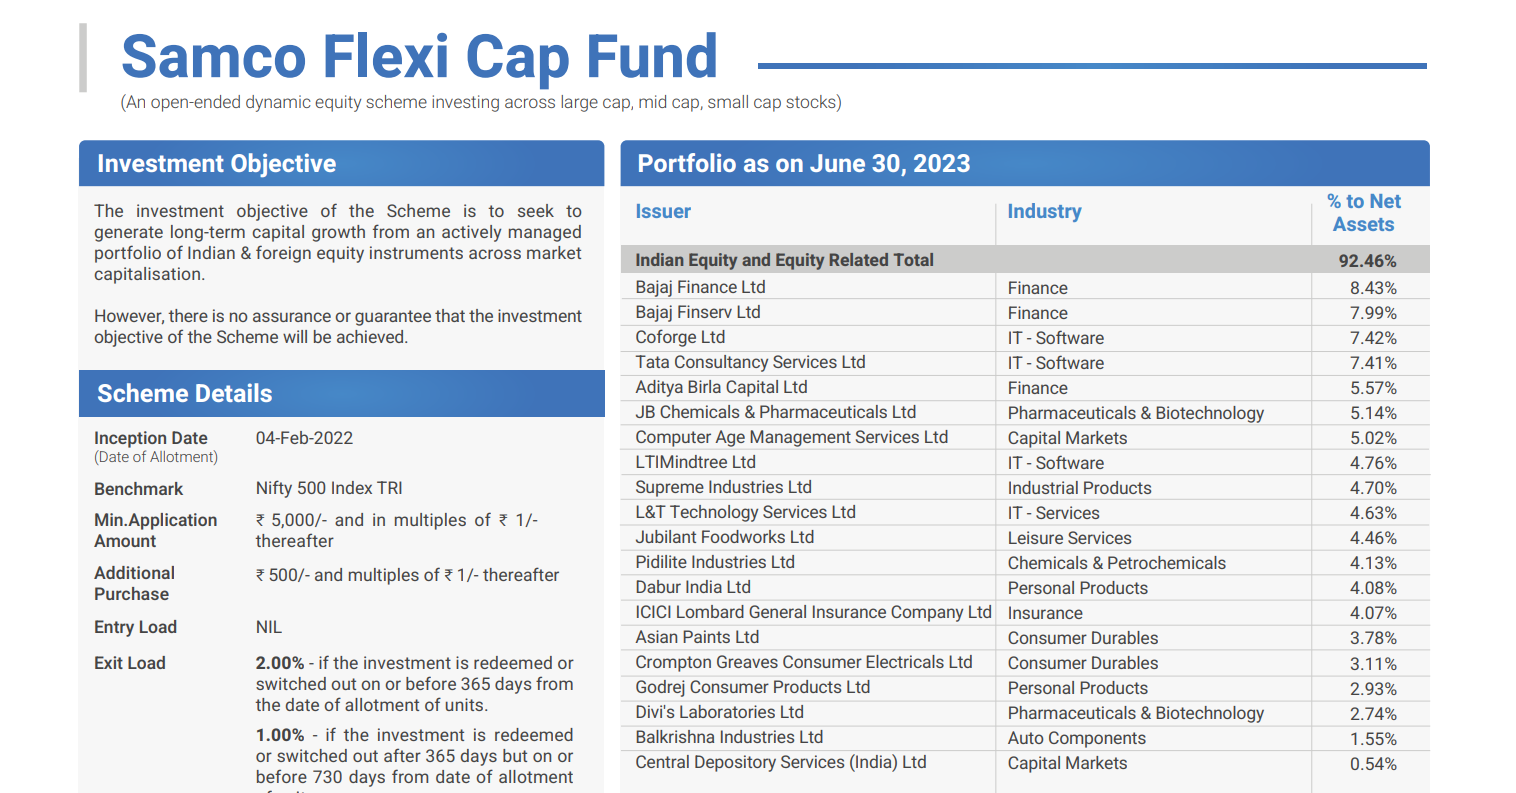
Add Time Stamp when stock match the FAST condition so we can use with look back period for back testing purpose andhow its performing
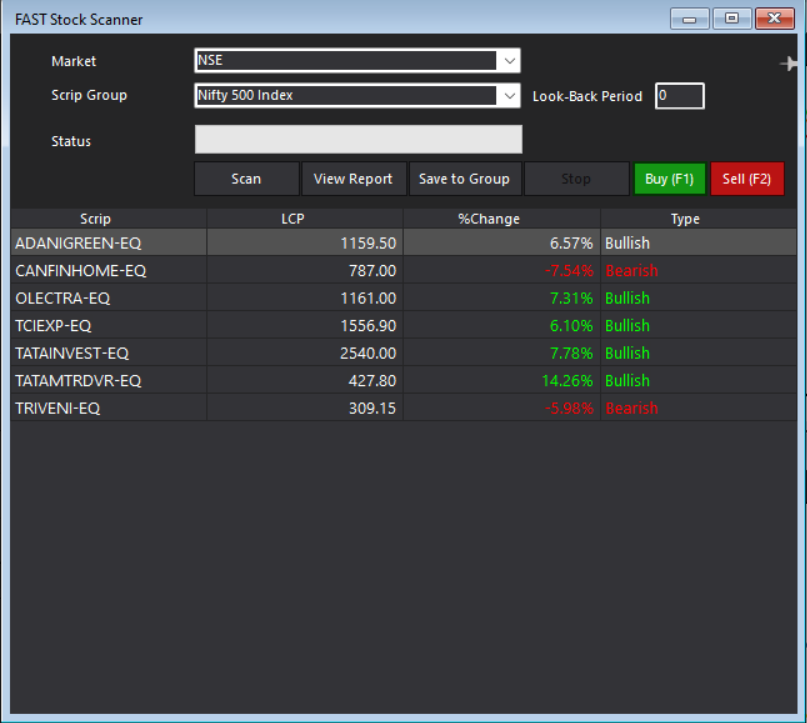
@Prashant-Shah @Definedge
Re Balance & Performance Update 24/07/2023
Nifty 500 +0.83 %
Focused Momentum -1.46%
Exit ICICIPRULI
Add-IOC
Momentum Dominators +0.99%
Exit L&TFH
Add-Polycab
Value Rotational -2%
Exit CCL/OFSS
Add-ITC/Bajaj Auto
Momentum 15 +0.99%
Exit L&TFH/IDFCFIRSTB/HAL/TIINDIA
Add Polycab/Fincables/Zyduslife/CGPOWER
Frontline momentum & Value Dominators exit alert given so no portfolio update
Edge is the key Equity Curve Trading
if you missed the list of stock then attaching in image
in case any query/question e mail on [email protected]
#AhmedabadNest #nseindia #StockMarketindia #DataAnalytics #trading #analysis
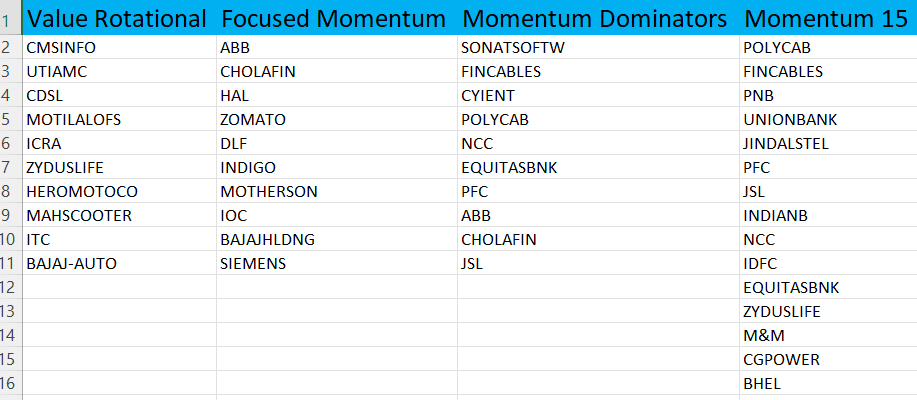
@Rajnandini Darkase google it how to create NAV -Net Asset Value
When my Short Term market Timing Model gives buy signal all money goes to Nifty Bees & when it gives sell signal all money goes to GOLD Bees
from 22/4/2023 model given buy signal so taken Nifty bees which is still in buy mode with Return of 13.5 %
in the same time aggrasive traders like me has bought KOTAKALPHA Bees which is yielding 21%
when tide turn will shift all money to Gold Bees
any query /question mail me on [email protected]
#AhmedabadNest #market #timing #model #nseindia #StockMarketindia #DataAnalytics #analysis
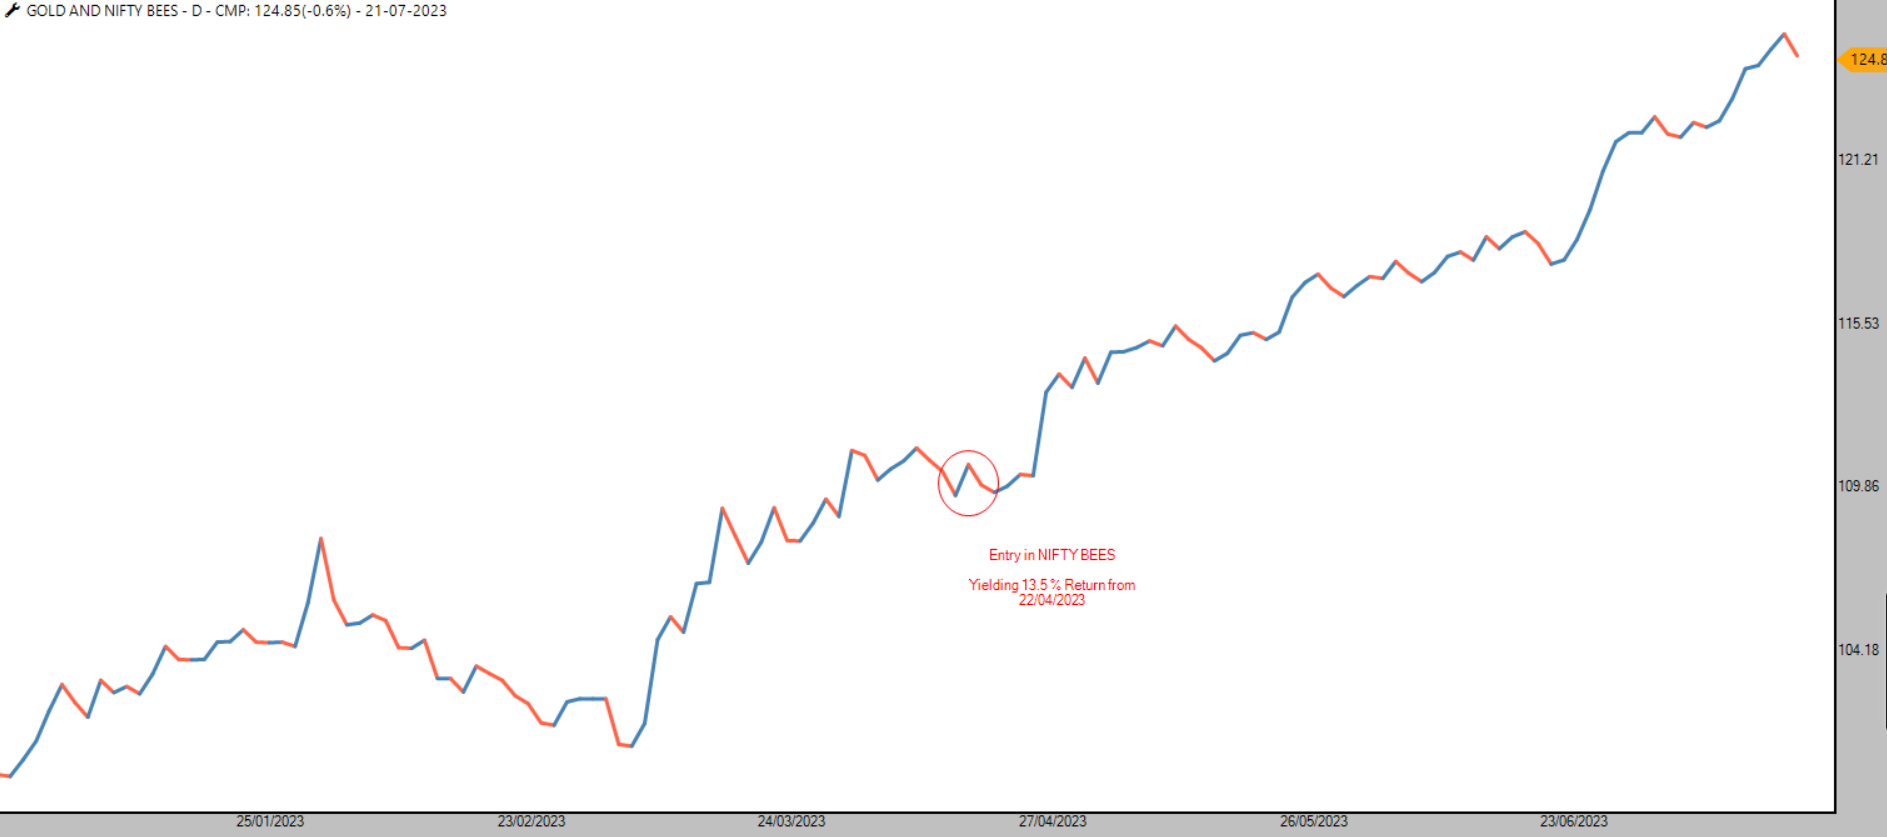
Update On my Market Timing Model 22/7/2023
This is for short Term View
Renko chart swing line has steeply gone up + in overbought zone so we are tightning the trail stop loss in all portfolios and in open position in long only approach
as and when the swing line get broken will aggrasively exit all position and will shift to GoldBees
How ever the long term structure as per the Model is in uptrend but time to time profit booking after good rally is required that is based on data analystic
any query /question mail me on [email protected]
#AhmedabadNest #market #timing #model #nseindia #StockMarketindia #DataAnalytics #analysis
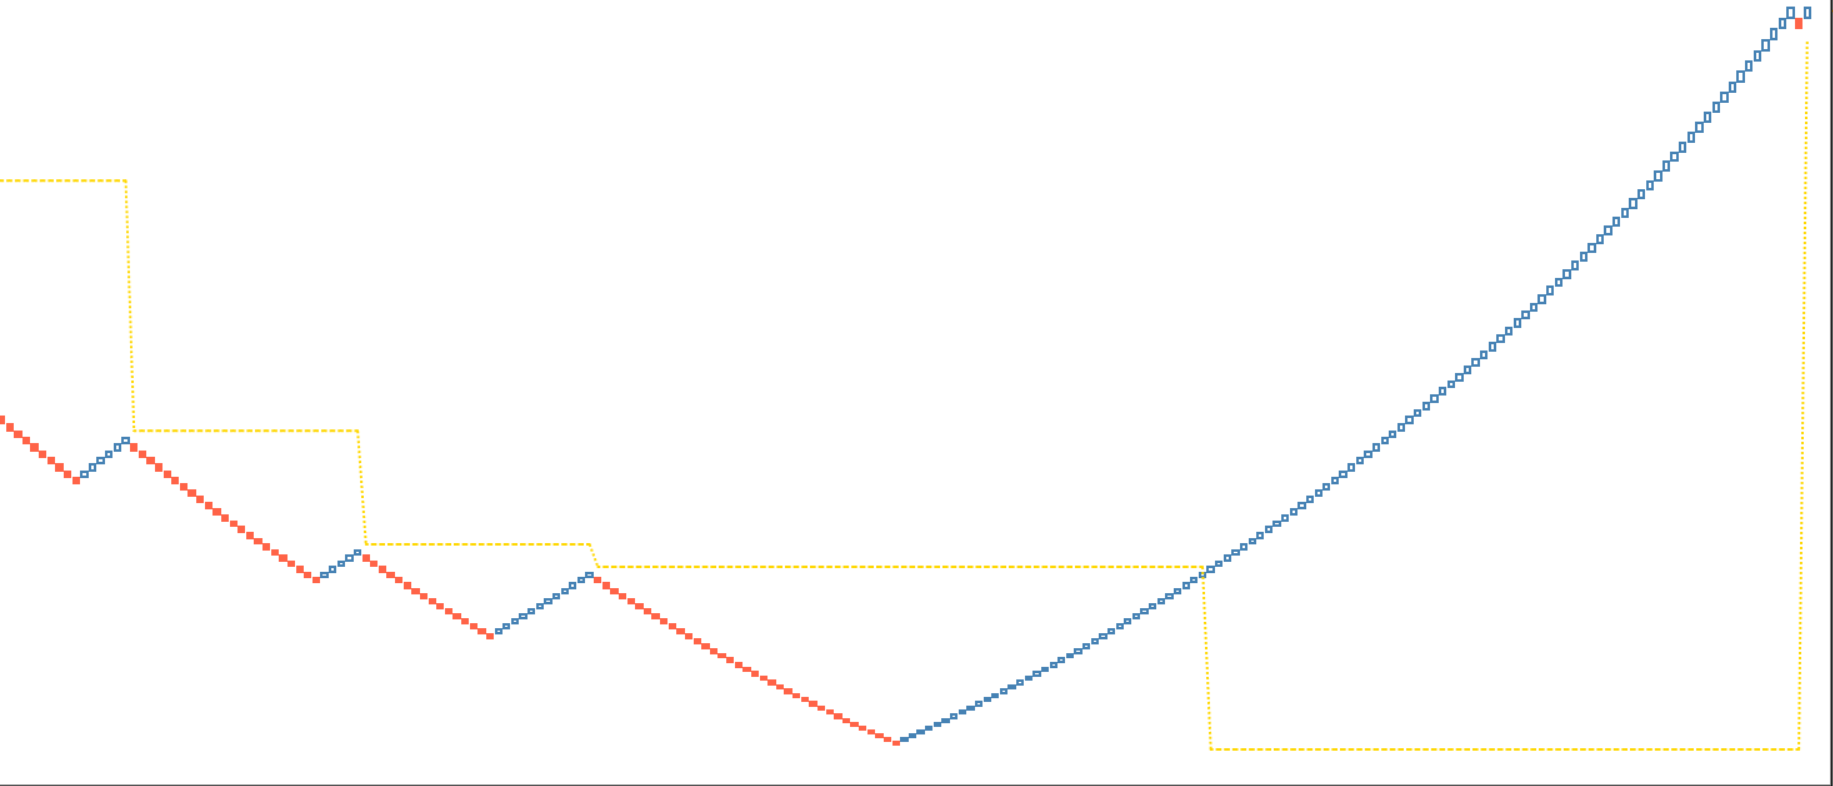
i understand your concern but i cant disclose the full details currently but yes time to time i will update so members can be on alert what i can say is that this is based on fundamental factors in case query/question mail me [email protected]
Important Indicator
which answer ..........
When to get in & get out at first hint of reversal
when to consider strong bullish & bearish reversal
When to remain vigilant against the flow /madness
When to think like warren buffett -when everyone is greedy be fearful & when everyone is fearful be greedy
when the indicator >100 look into your favourite charting method for reversal from bullish to bearish
when the indicator <100 look into your favourite charting method for reversal from bearish to bullish
will keep updating whenever required
#AhmedabadNest #nseindia #StockMarketindia #Indicator #reversal #analysis #Bullish #bearish #trends

PNB PFC JSL JINDALSTEL L&TFH M&M UNIONBANK IDFC NCC IDFCFIRSTB INDIANB HAL EQUITASBNK TIINDIA BHEL
#Momentum 15 #portfolio
Fresh Multi column Bullish Breakout
As long as it holds DBS as sl portfolio is bullish
Weekly Re balanced on Rotational Momentum Logic again sharing the portfolio stock list
Equity Curve Edge is the key
#AhmedabadNest #nseindia #StockMarketindia #trading #investing
PNB PFC JSL JINDALSTEL L&TFH M&M UNIONBANK IDFC NCC IDFCFIRSTB INDIANB HAL EQUITASBNK TIINDIA BHEL
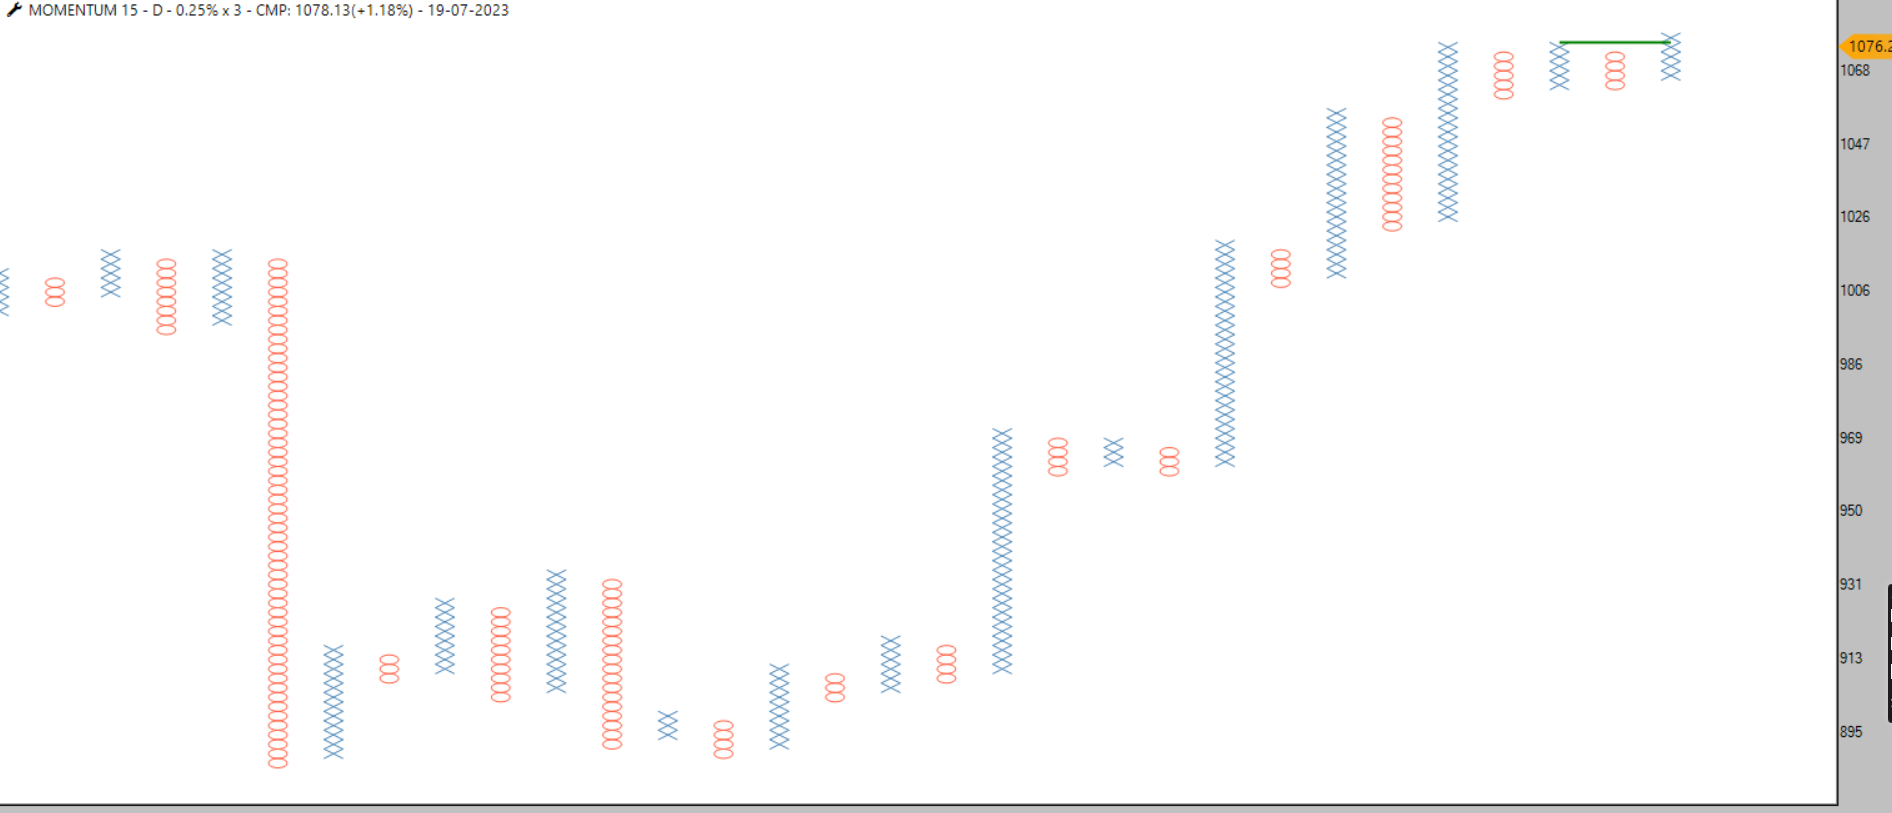
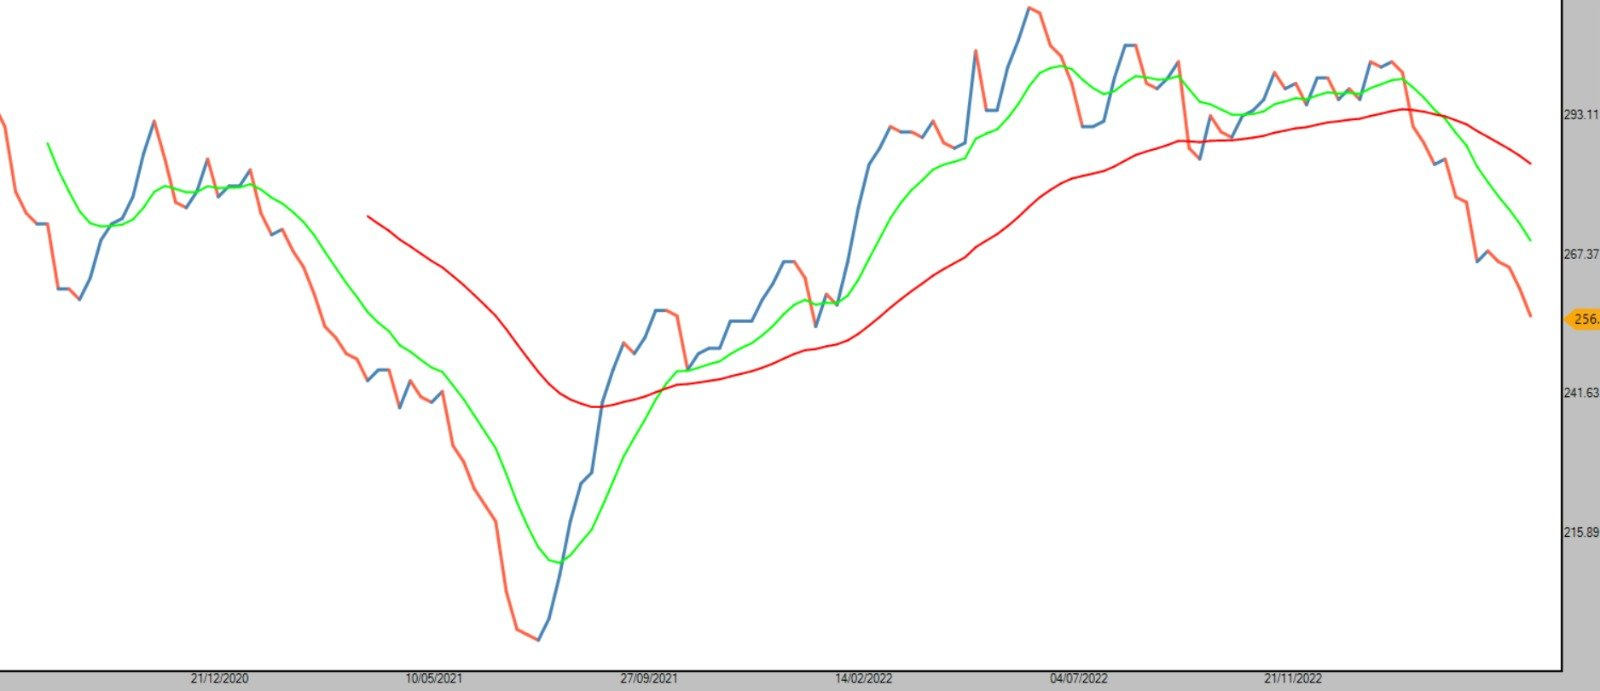
on twitter & definedge noiseless telegram i ahve updated on 24/3/2023 that mkt is going to hit bottom and it did
see various diversifed index generated return from 16.48 % to 27.76 %
one can participate market via ETFs & divicerified mutual funds
choice is your edge is the key
#AhmedabadNest #quant #DataAnalytics #NSE #StockMarketindia
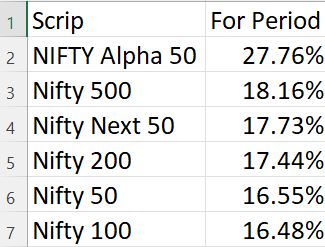
#ALERT
#Frontline #Momentum #portfolio
Given Double Bottom sell with 7% profit
Now till it dosent gives fresh buy signal will not share the stock of that portfolio
Equity curve Trading Edge is the key
#AhmedabadNest #NSE #StockMarket #india #analysis #quant #DataAnalytics
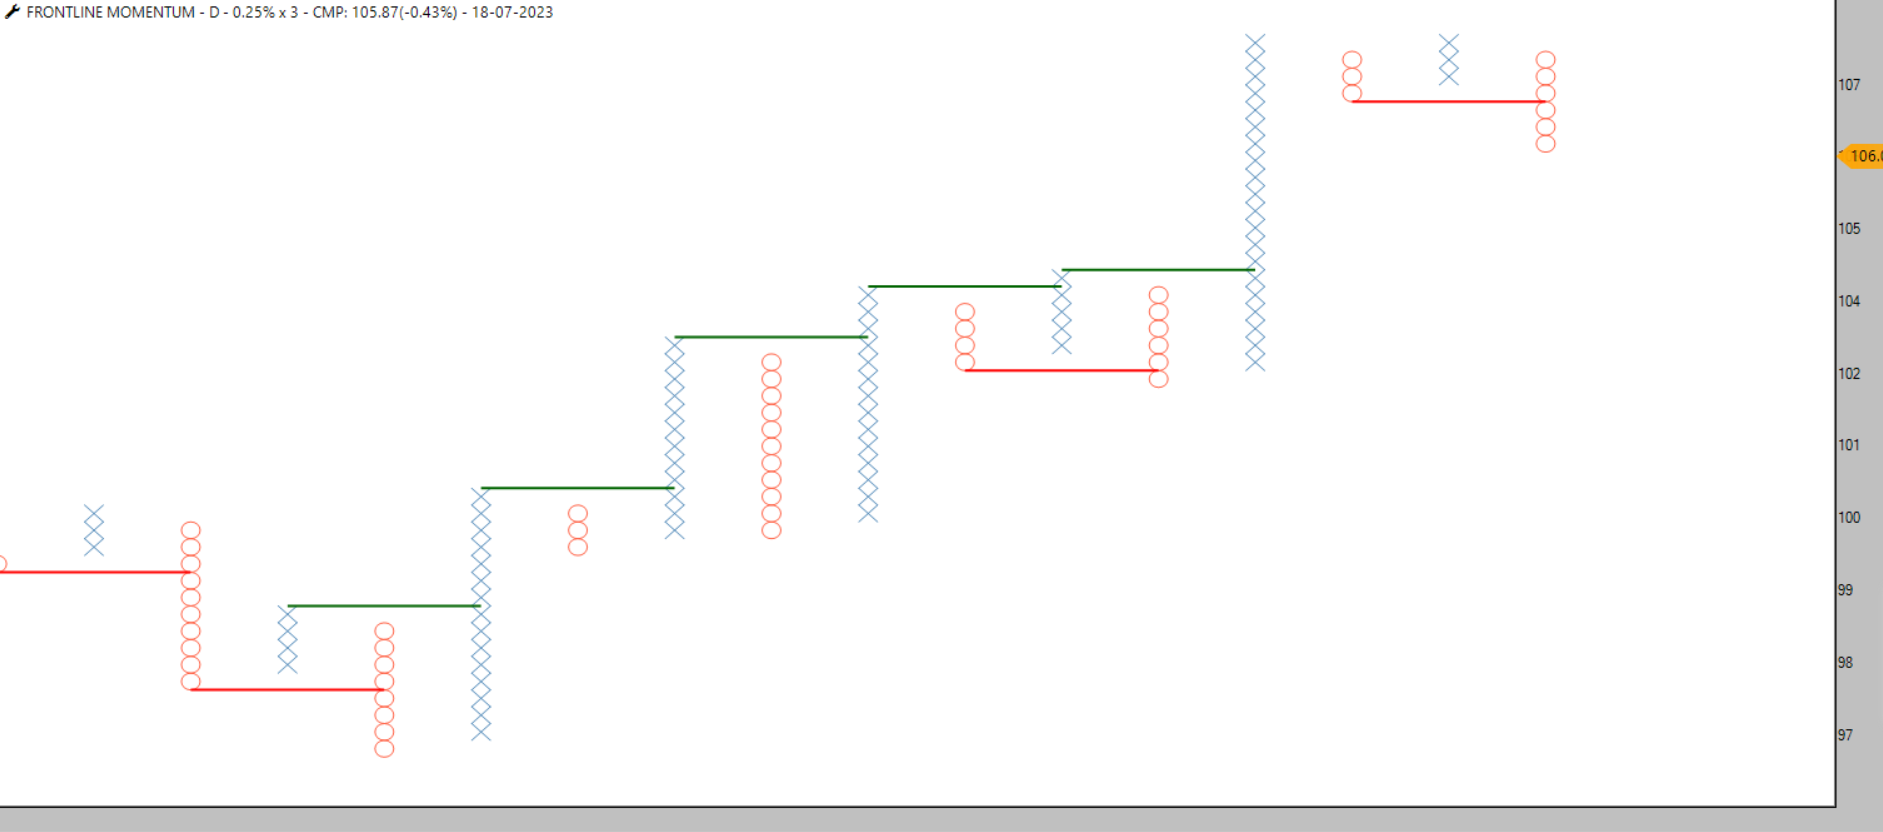
#ALERT
#Value #Dominator #portfolio
Achived count & now given Double Bottom sell signal with profit of 11.88%
now till it dosnt gives fresh buy signal will not share the stocks of that portfolio
Equity Curve Trading Edge is the key
#AhmedabadNest #NSE #StockMarket #INDIA #quant #DataAnalytics #analysis


Re balance & Performance Update 17/07/2023
Nifty 500 +1.21%
Frontline Momentum -1.18%
Exit PowerGrid/BPCL
Add TechM/hdfclife
Focused Momentum +0.52%
Exit-IOC/VBL
Add-Zomato/Motherson
Momentum Dominators + 1.36%
Exit-Kpittech
Add-L&TFH
Value Dominators +1.47%
Exit-PowerGrid
Add-ICRA
Momentum 15 +0.15%
Exit-Karurvysya/M&MFIN/Cholafin/BOB/Cyient
Add-UnionBank/NCC/IndianBank/EquitasBank/BHEL
Value Rotational +2.38%
No change-Stock Remain same
in case you missed full list of stock attached file
incase in query/question mail me [email protected]
Equity Curve Trading Edge is the key
#AhmedabadNest #momentum #portfolios #trading #BREAKOUTSTOCKS #quant #DataAnalytics #nseindia #StockMarketindia
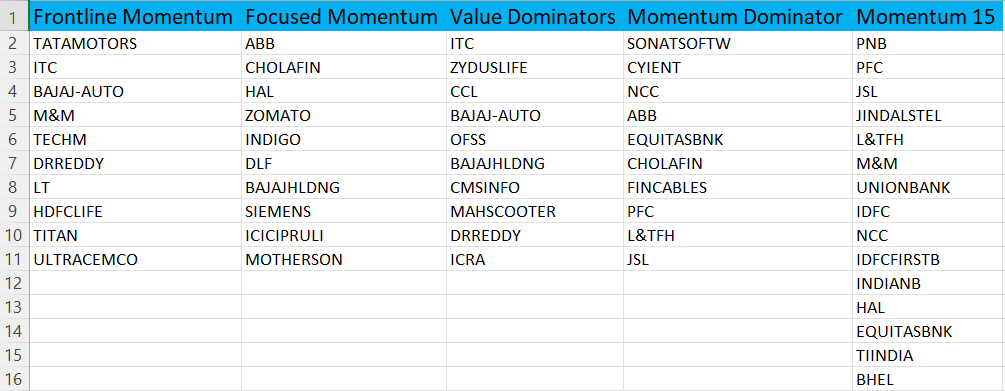
is Horny Bull Market Born ?
Chart Above MAST Indicator & +DMI above -DMI suggest me buy on dip/correction/retracement as long as MAST indicator is Green
when This happen you will see
Strong Positive Momentum
Momentum Strategy will work easily
Buy & Hold will work
Easy system will generate returns
Leverage/MTF Favourable Time for high risk takers
High P/E & High leverage stock rule the market
Cyclical/Aggrasive/Re rated stock moves faster
Fundamentally strong/sustainable stock slowdown in momentum/loose freenzy
penny stock moves
Take note-no bull market goes one way,will see indicators & Breadth overbought,they shift their ranges ,will see sharp retracemnets in price towards short & medium term moving averages,will see classic dow theory setup of Higher top Higher bottom that will help to trail stop losses ,seasonality will play its role time to time
Final Note-Find your setup-Follow charts-Have Proper Risk management & Position Sizing & in free time keep reading books like
Value investing & behavioural Finance by
@PPFAS
You ,Me & Trading by
@Prashantshah267
#AhmedabadNest #momentum #trading #StockMarketindia #nseindia #Quant #DataScience #analysis

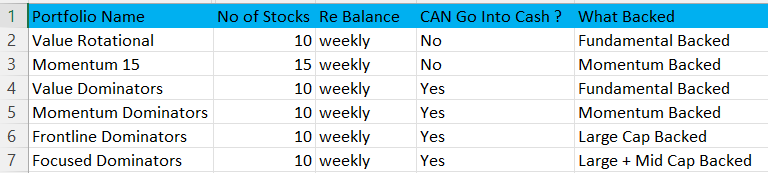
Weekly Rebalance & Performance Update for 10/07/2023
Nifty 500 + 0.82 %
Value Rotational + 2.31%
Exit Axis Bank & Bajaj-Auto
Add HeroMoto & ICRA
Value Dominators + 1.74%
No Entry & Exit stock Remains same
Frontline Momentum +2.23%
Exit Maruti
Add BPCL
Focused Momentum -0.21%
Exit Zomato/BEL/Godrejcp
Add-IOC-BajajHolding/VBL
Momentum Dominators +0.38%
Exit-HAL & LTFH
Add-JSL &NCC
Momentum 15 +0.82%
Exit -AplApollo/ABCap/Cummins/Zyduslife/ABB
Add-PNB/M&M/Jindalsteel/IDFC/Bankbaroda
in case you missed full list of stock attached file
incase in query/question mail me [email protected]
Equity Curve Trading Edge is the key
#AhmedabadNest #momentum #portfolios #trading #BREAKOUTSTOCKS #quant #DataAnalytics #nseindia #StockMarketindia
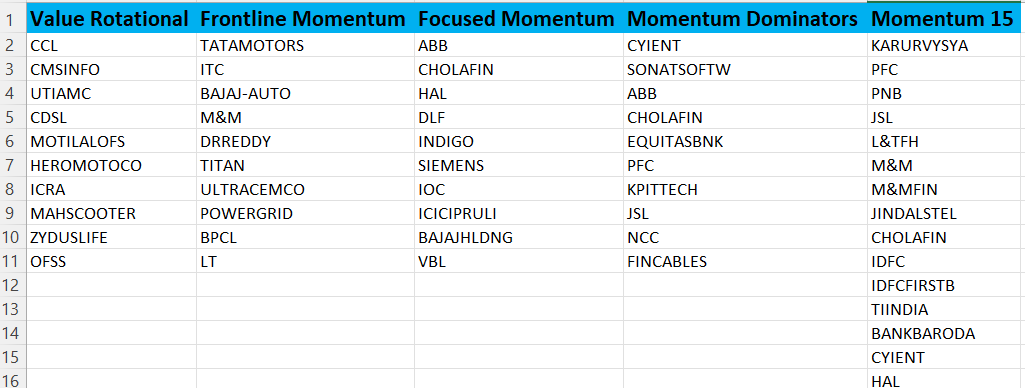
#PowerPortfolio
has made my coined SlingShot pattern now at final resistance of Trendline
need another 1% Rally in portfolio will result in breakout and at first count expecting rally of 31%
Equity Curve Trading Timing The market Edge is the key
#AhmedabadNest #nseindia #StockMarketindia #patterns #breakout #trading
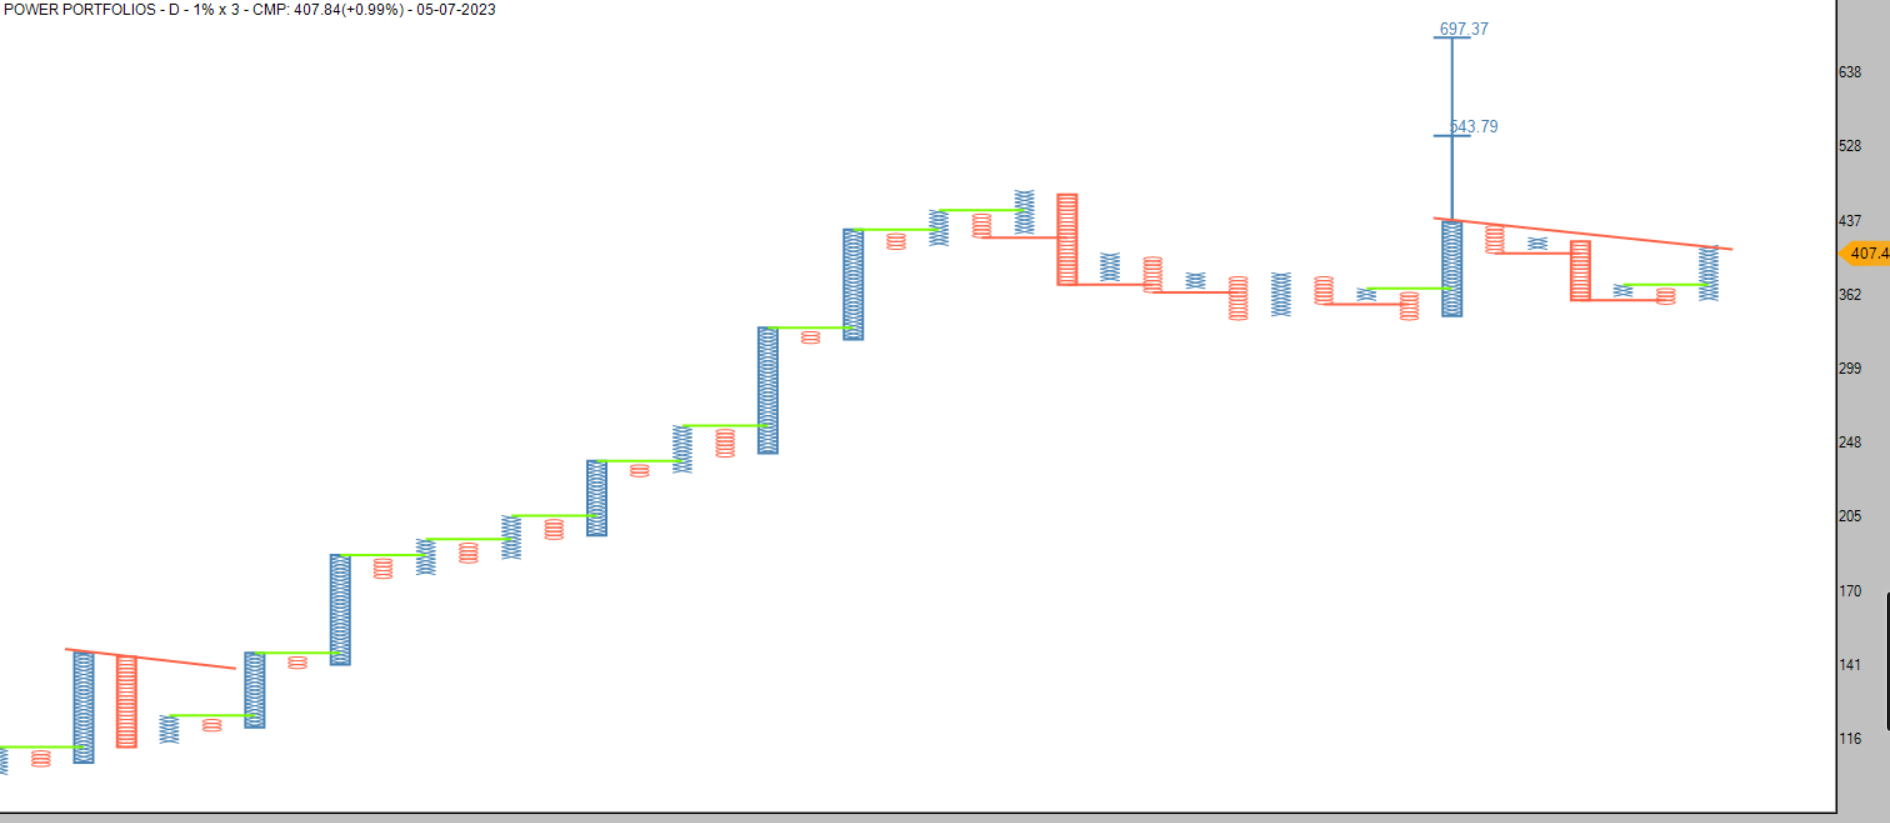
@Prashant Shah as look back period has 100 day limitation add look back date so can go to any period Thanks

yes its ETF
Importance of Market Timing
Taken KOTAKALPHA at 26.15 on 25/04/2023 as on today it is 30.80= 17.78 % Return
in same duraion Nifty 500 deliver 10.88 %
from 1st jan to Till date Nifty 500 deliver 7.28 %
so in both case market timing model has helped to generate Alpha Return in very short duration
now need follow thru above 45 degree bearish trendline to take this index to all time high
stay tune for more updates if any query/question mail me on [email protected]
#AhmedabadNest #nseindia #StockMarketindia #TradingSignals #analysis


#PowerPortfolio #Breakout
Anchor Follow Thru above Moving Average
Breakout From Bearish 45 Degree Trendline=Bullish
From current levels Double Bottom Sell is 3.5 % away while First count target is 12 % away
#AhmedabadNest #nseindia #StockMarketindia #trading

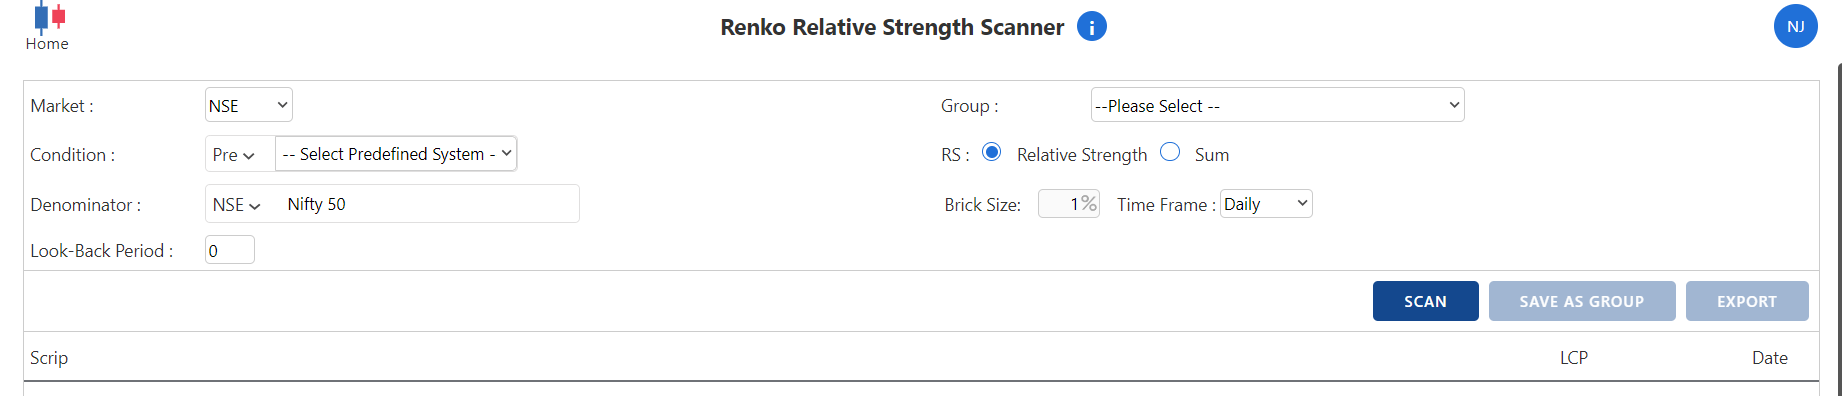
#portfolio #performance
After my market timing model generated buy signal
all generated positive returns
3 Generated Alpha Return are (Flying )
Momentum Dominators 18.56%
Momentum 15 17.97 %
Focused Momentum 15.80%
3 underperformed (Bearish Star)
Value Dominators 9.37 %
Value Stock Rotational 4.44%
Frontline Momentum 4.33%
Golden Nifty capactring Decent 9.58%
Equity Curve Trading-Edge is the key
have query/question mail me on [email protected]
@Prashantshah267
#AhmedabadNest #nseindia #StockMarketindia #trading
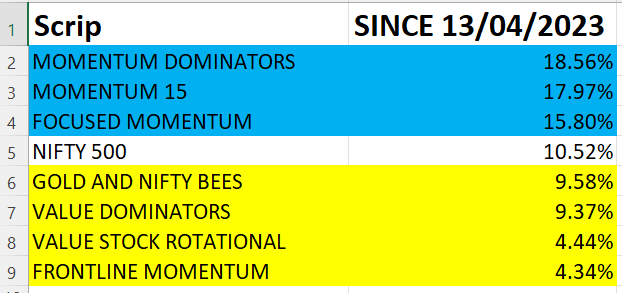
10 stock Equal Weighted #portfolio For July 2023 to Jun 2024
No re balancing till JUN 2024
i will update when breakout comes with SL -Probable target
all name mention in chart=> one can plot own chart on
@in_tradingview
Amibroker to get own signals #AhmedabadNest #NSE #StockMarket #trading
currently in column of O so will wait for Double Top Breakout then Double Bottom Sell as stop loss
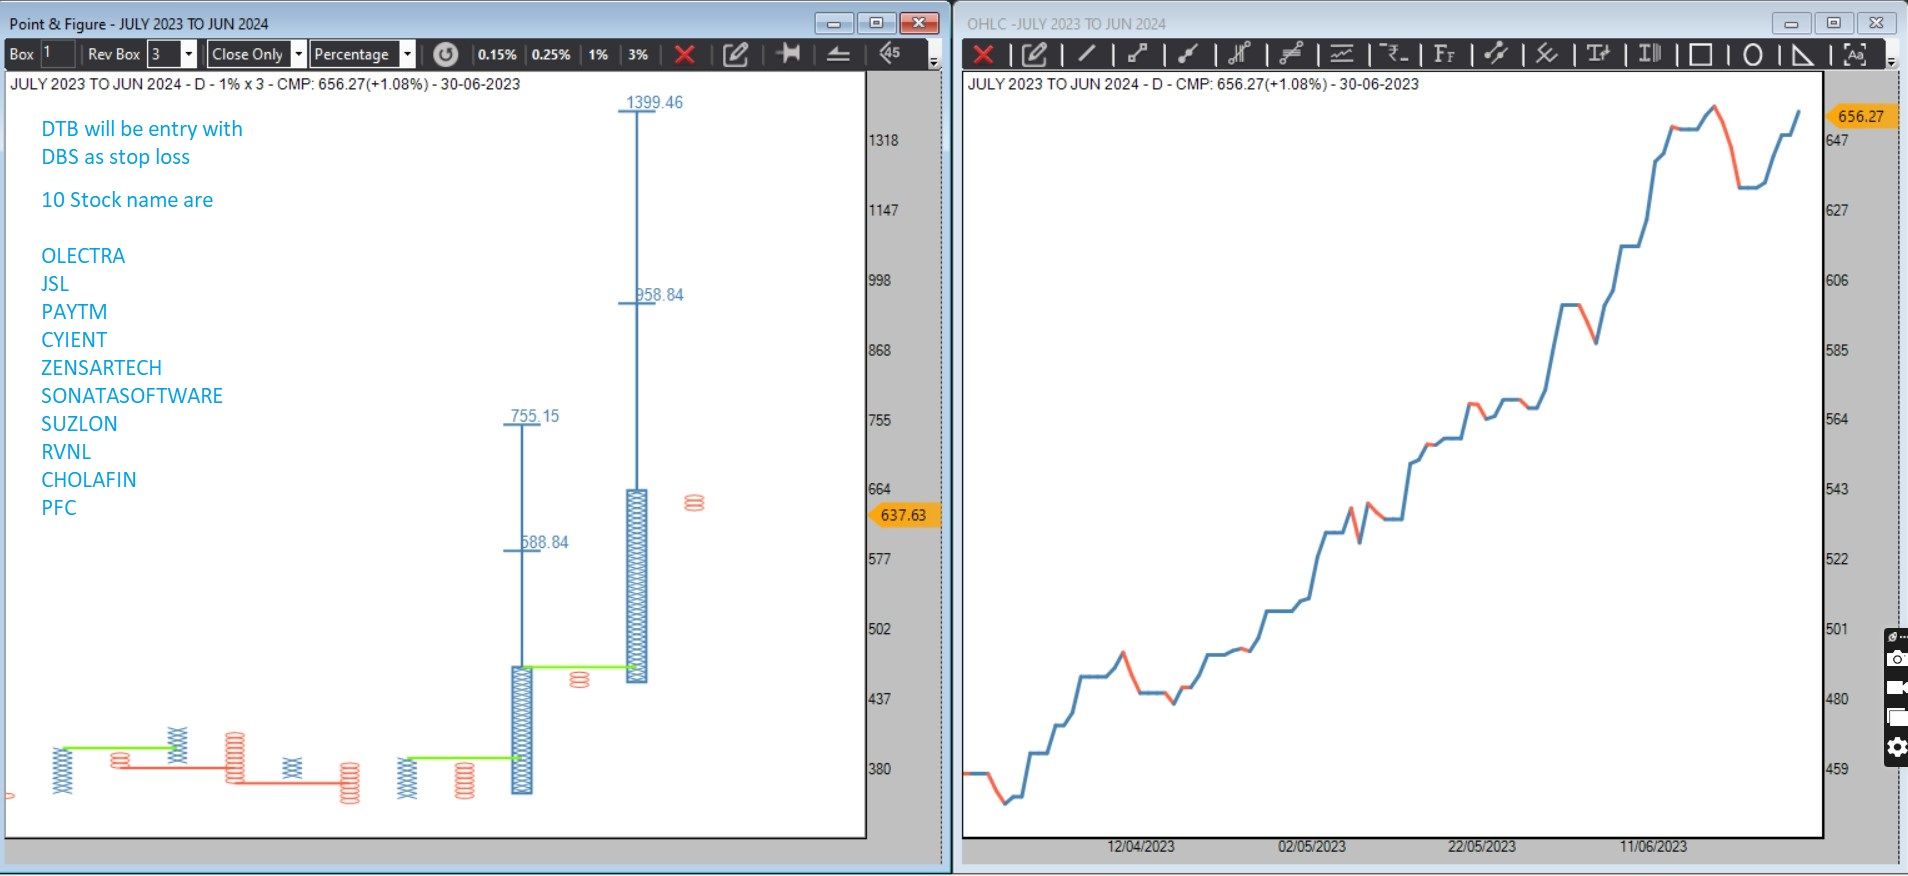
Weekly Re balance & PerformanceUpdate For 03/07/2023
Nifty 500 Up by 2.61 % in last week
Frontline Momentum + 2.75 %
Exit-Apollo Hospitals/NTPC
Add-Maruti/M&M
Focused Momentum +3.54%
Exit-BajajHoldings
Add-GodrejCP
Momentum Dominators +4.16%
Exit-Cgpower/ITC/Cummins/PolyCab
Add-Cyient/SonataSoftware/Fincables/EquitasBank
Value Dominators +2%
Exit-BalkrishnaInd
Add-CMSINFO
Value Rotational +2.69%
Exit-MCX/ITC/HeroMoto
Add-Zyduslife/UTI AMC/CDSL
Momentum 15 +3.44%
Exit-BEL/IDFC/ApolloTyre/TVS Motor/Phoenix
Add-AB Cap/Cyient/Cummins/JSL/Zyduslife
In case you missed full list of stock attached file
incase in query/question mail me [email protected]
Current Full list Updated
Equity Curve Trading
Edge is the key
#AhmedabadNest #momentum #portfolios #trading #BREAKOUTSTOCKS #quant #DataAnalytics #nseindia #StockMarketindia

try to get this from your side yes it is +DI & -DI but of which instrument
New Indicator
#Bull or #Bear
confuse over market phase ?
weather bullish or bearish ?
wants to ride the bullish momentum ?
simply my indicator will guide you
when Green line above Red line=>Bullish
When Red line above Green line=>Bearish
This is indicator where we relay on crossovers so it will have leg while generating signal but it will give good participation in market
query/question mail me on [email protected]
#AhmedabadNest #nseindia #analysis #StockMarketindia
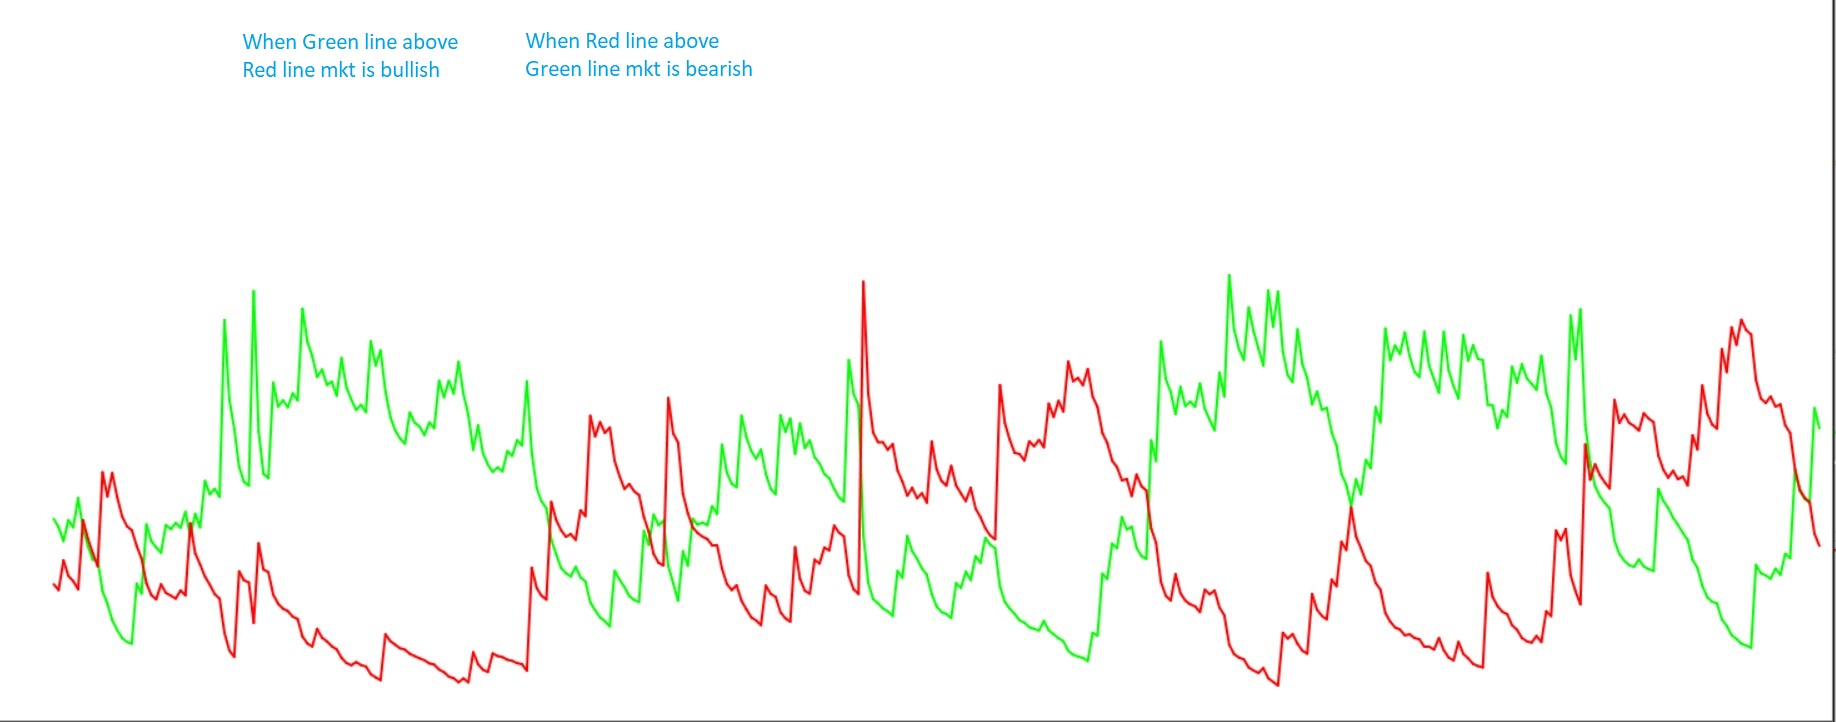
#Nifty 50
Ascending Triangle
Pattern has target of 22000 valid till lower blue trendline holds
yes market will have overbought zone on indicators and breadth & disparity on moving average that will give retracements that is common so there will be no one way rally towards target zone
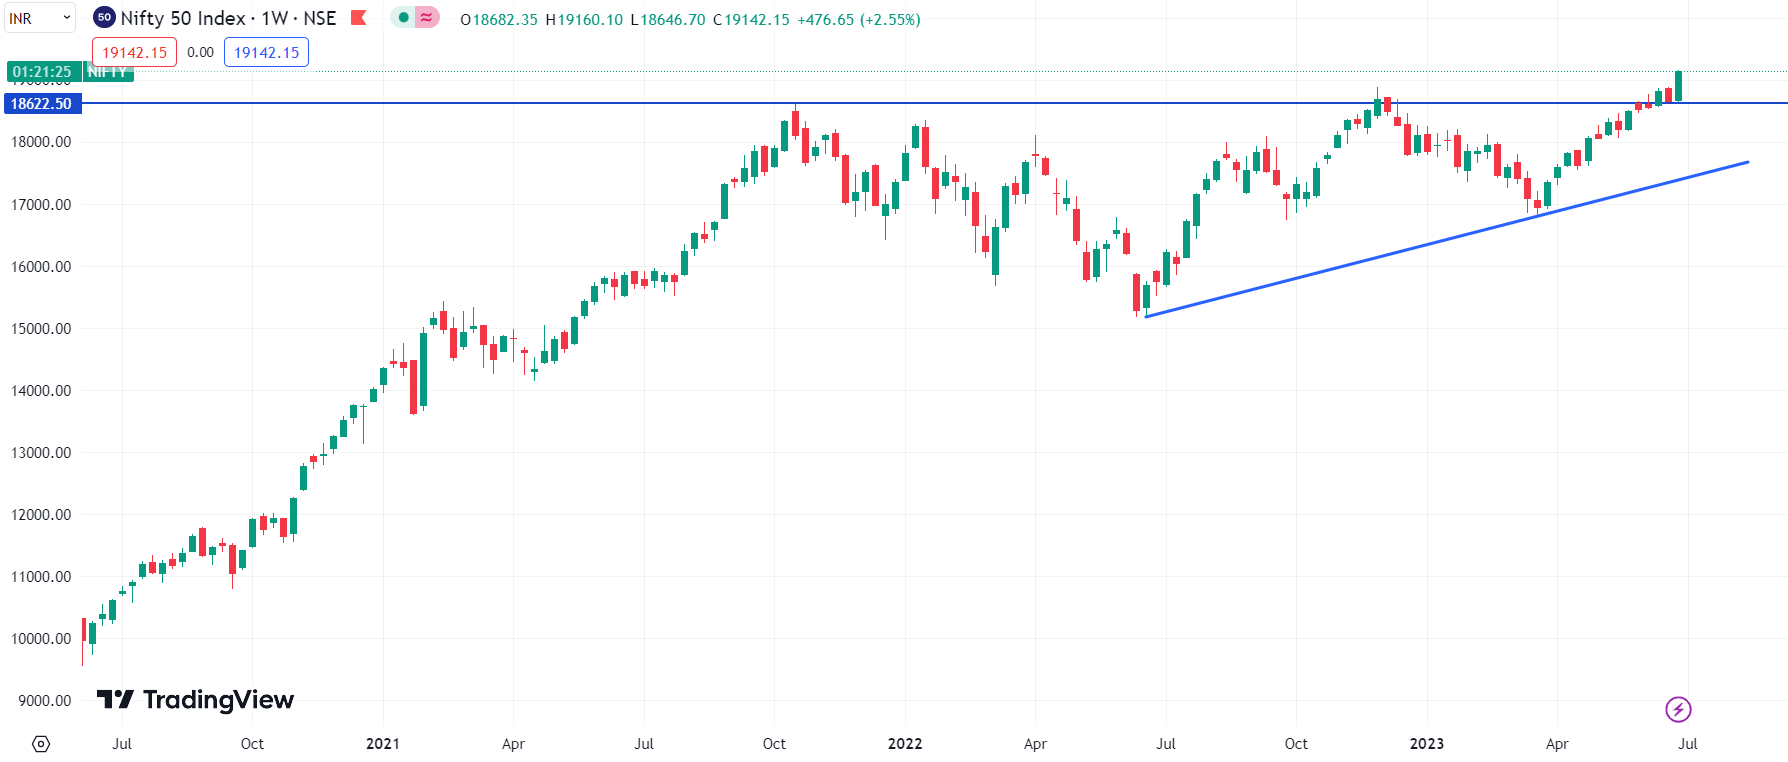
#AhmedabadNest #NSE #analysis #StockMarketindia #breakout
Fresh Double Top Buy Breakout in Portfolio
Value Dominators
Momentum Dominators
Frontline-Bear Trap Now DTB
All three has fresh DTB so trail stop loss rise again
will re balanced on weekly basis
Equity Curve Trading
Edge is the key
#AhmedabadNest #portfolio #momentm #value #frontline #Breakout #StockMarketindia
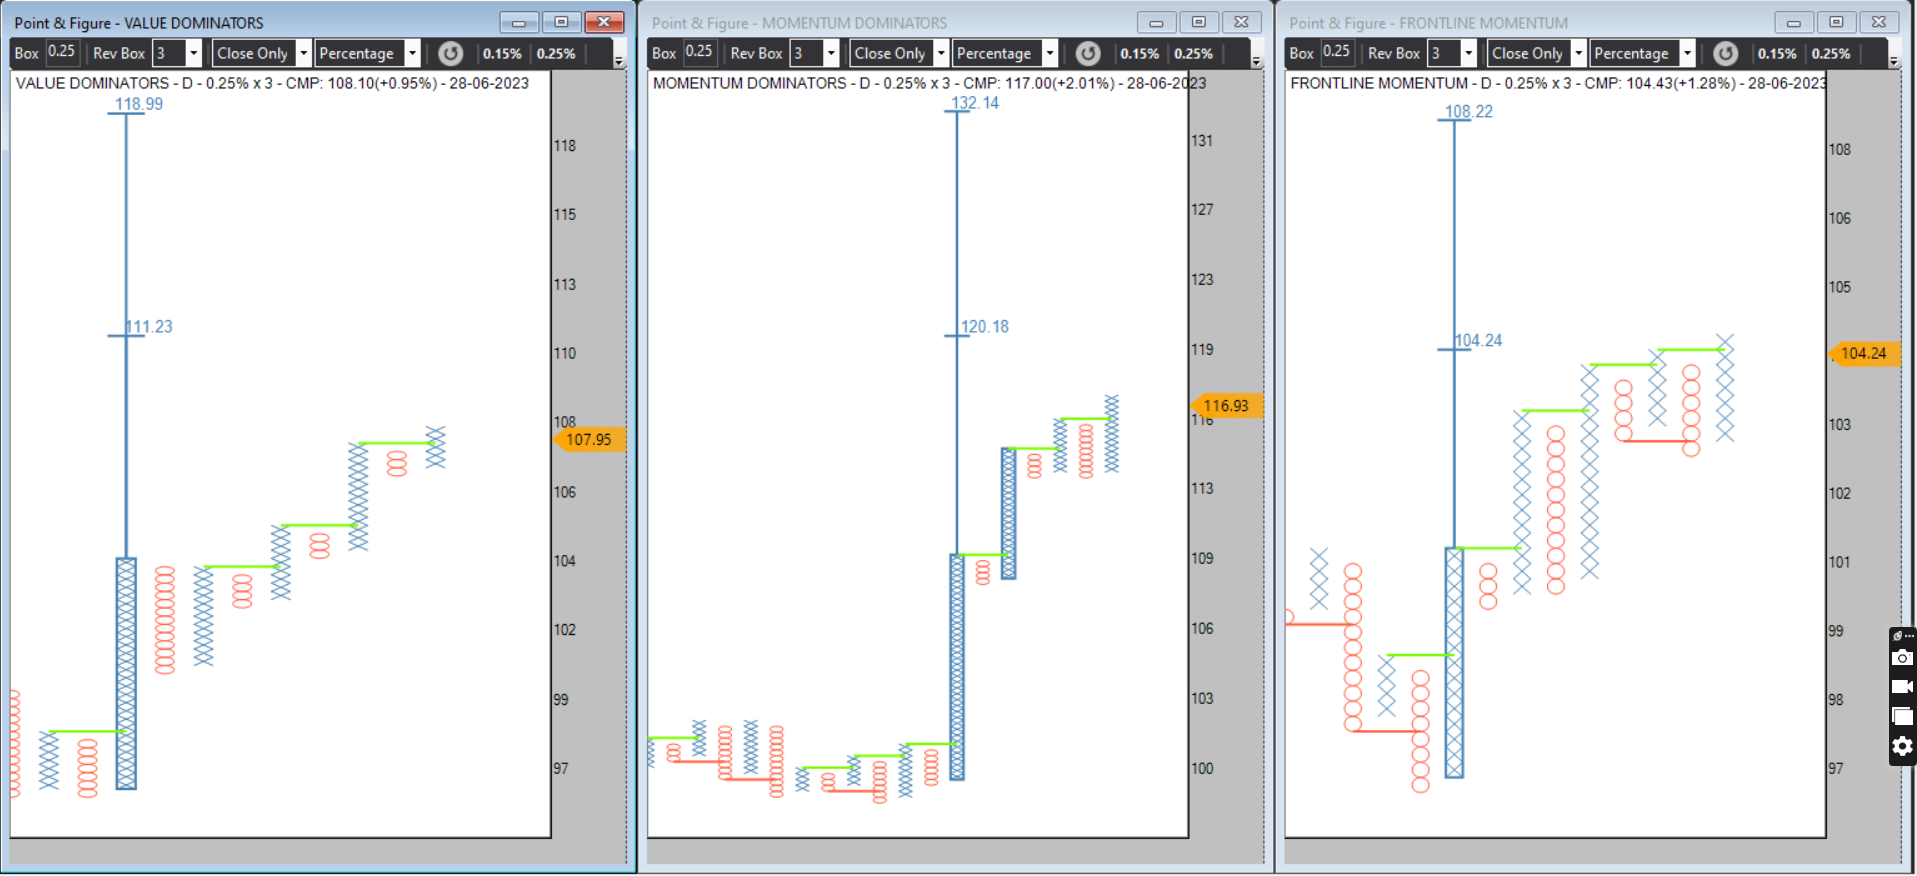
Portfolio breakout from my Coined SlingShot breakout
10 stock equal weighted which will be re balanced weekly basis and updated
current list is as below
CMSINFO MCX MAHSCOOTER CCL MOTILALOFS BAJAJ-AUTO ITC OFSS HEROMOTOCO AXISBANK
Bear Trap will have strong upside momentum as & when the exit comes will also update
#AhmedabadNest #nseindia #stockmarket #Momentum #portfolio
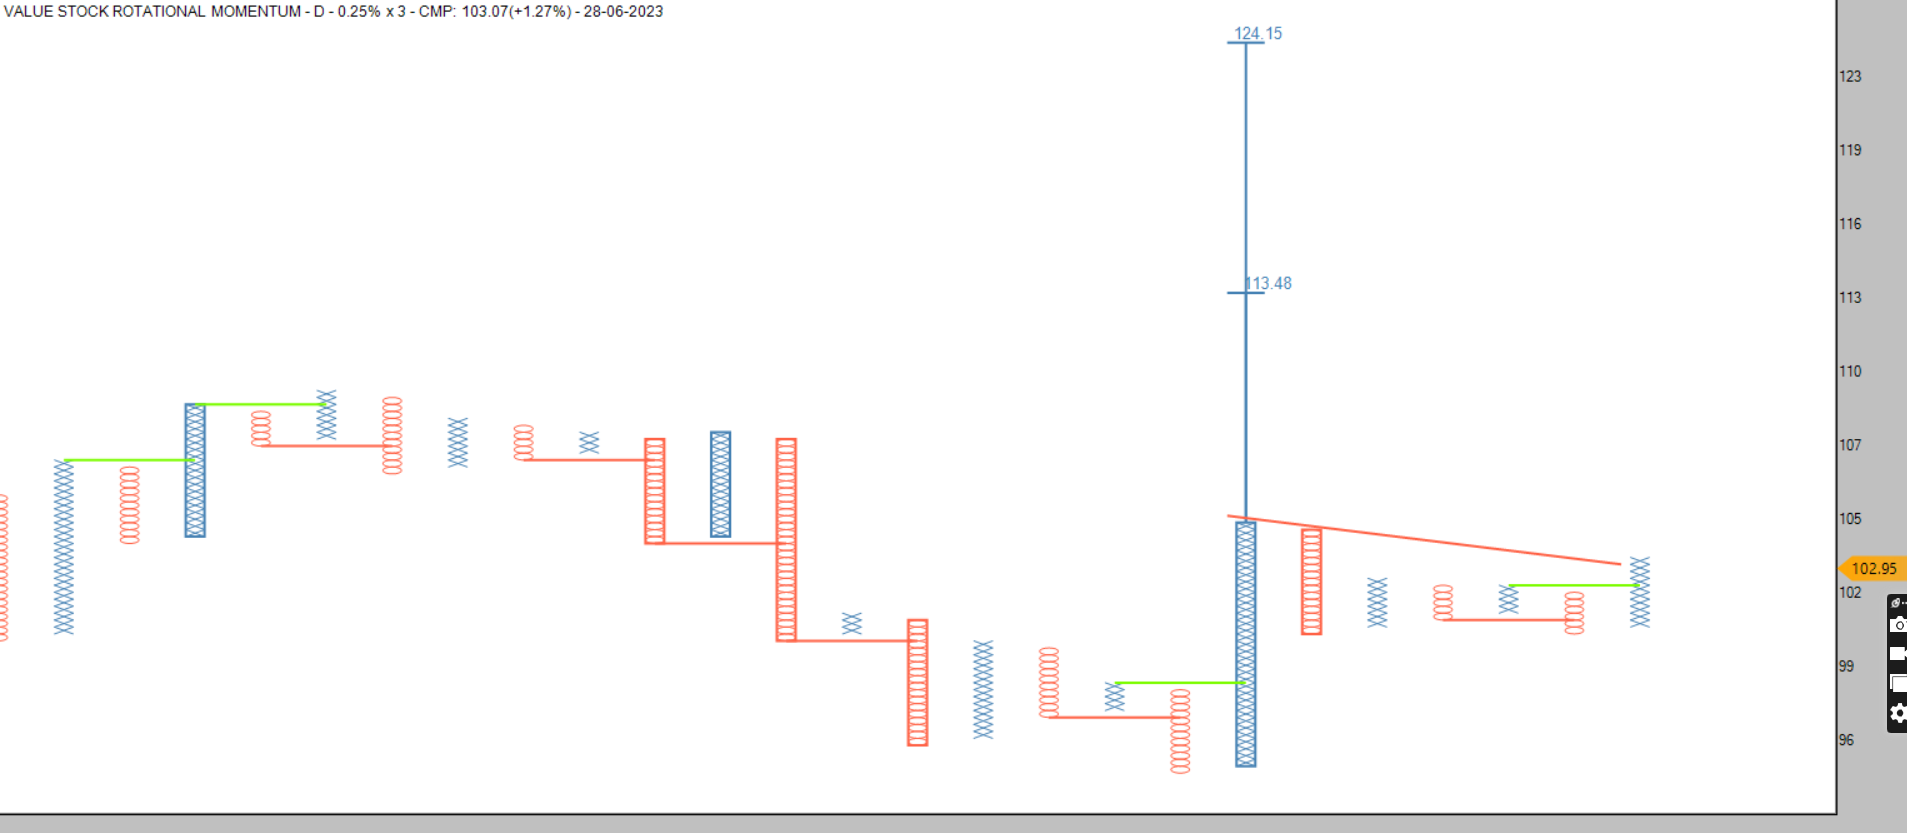
#Nifty
ALPHA 50
when my market timing model turn bullish taken KOTAKALPHA Bees now trailing stop loss at Double Bottom Sell
Risk from currnet levels is 2.5 % while at first count 20 % upside
#AhmedabadNest #nseindia #analysis #stockmarkets
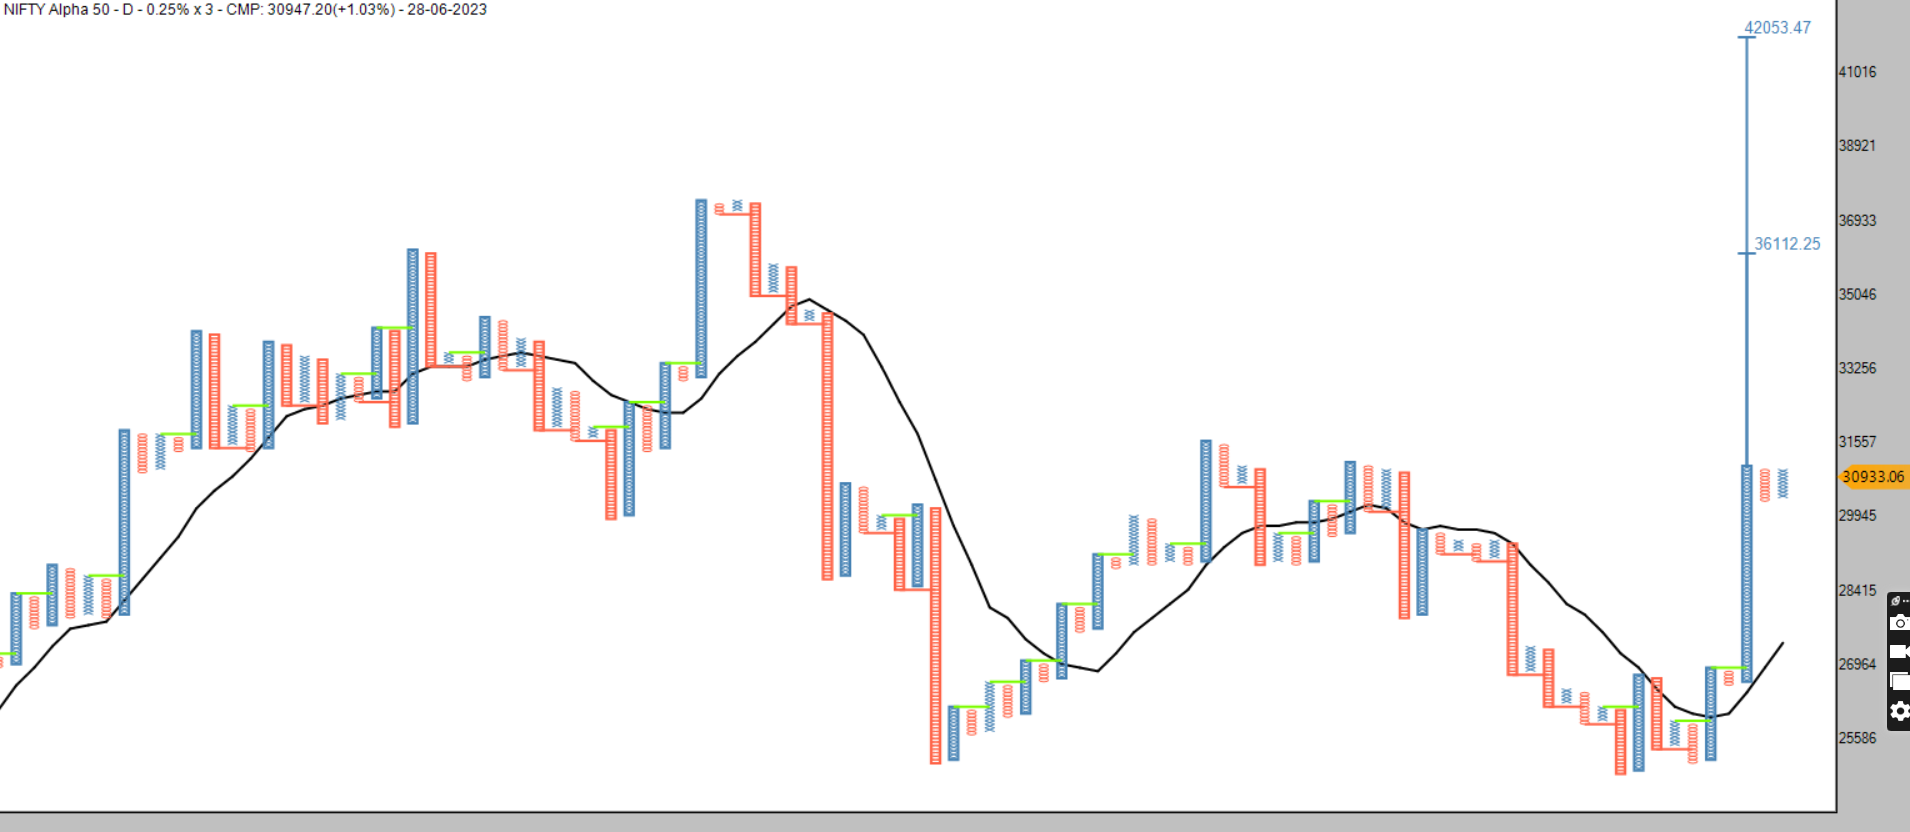
#PowerPortfolio
Positive Column Reversal happen today now Risk of 2 % in open position
if DTB with Anchor Follow thru happen will see 10 % Upside at first count
Due to regulatory norms i cant disclose the name of the stocks
Idea is Follow the
Process & Risk management
#AhmedabadNest #portfolio #trading #StockMarketindia #nseindia
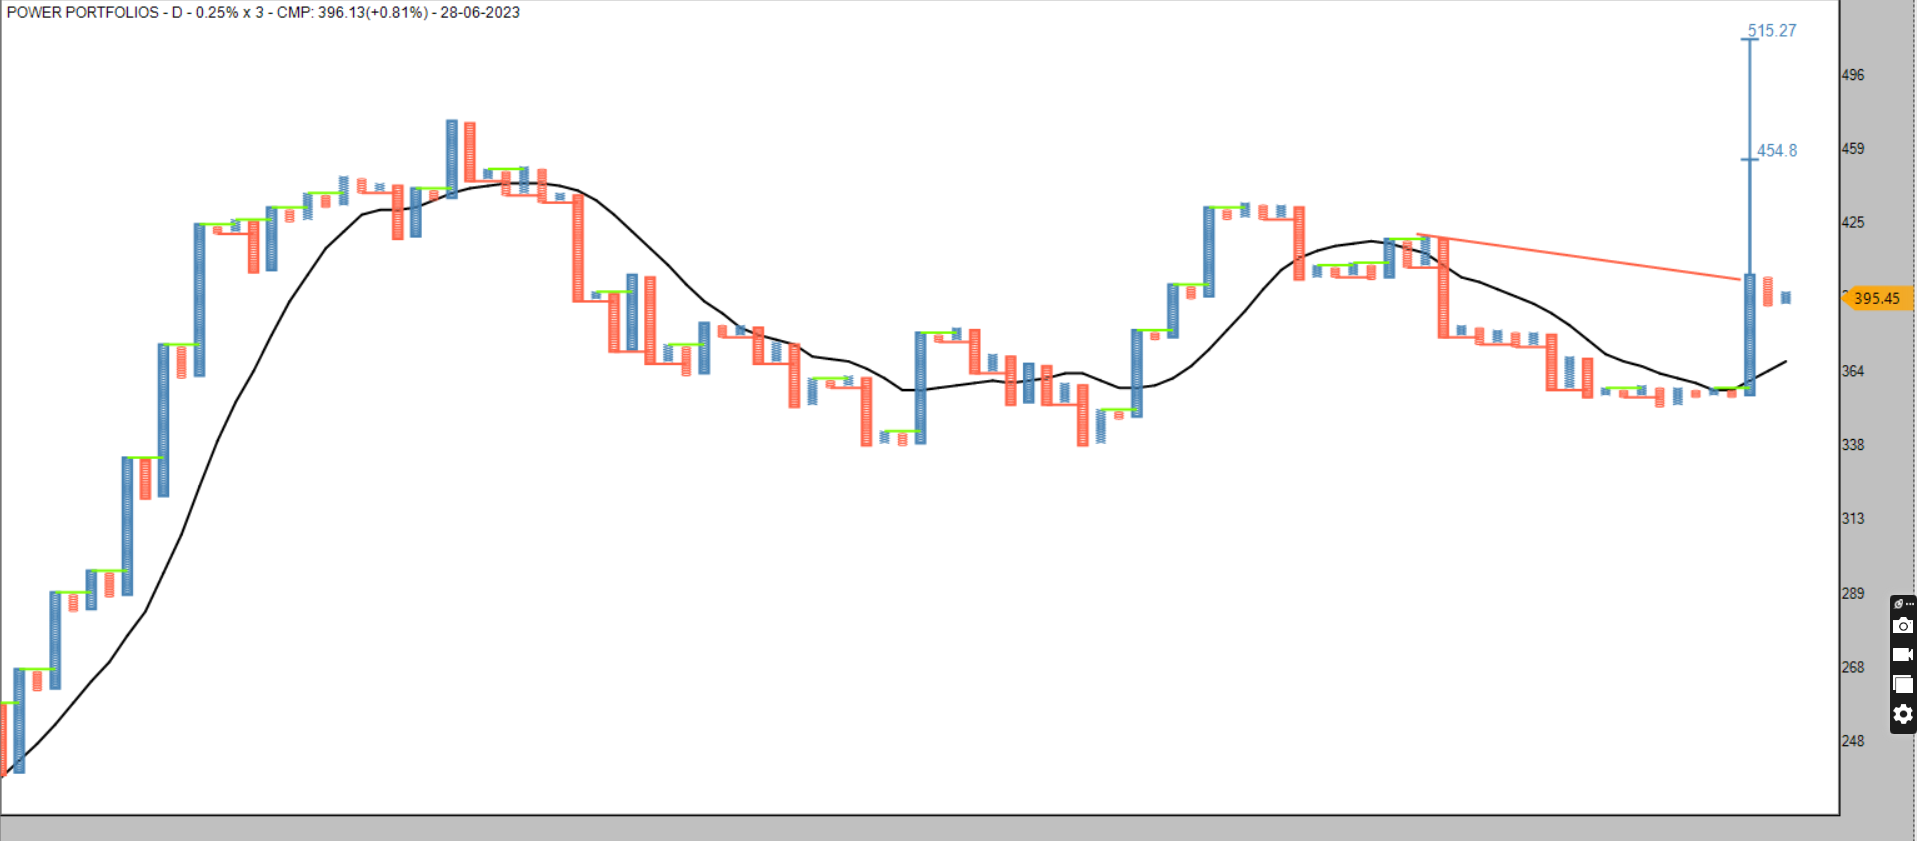
#nifty
weekly chart observation
at new 52 week high -trying to breakout from large consolidation
RSI-Range shift above 60
MACD-Bullish crossovers
overall structure looks bullish after long consolidation post covid rally
mkt preparing for another round of strong bullish trend
yes ofcourse breadth goes to overbought -becomes normal -leadership changes
pullback -Retracements are good to project upside and trail stop loss
focus on the setup-Risk management-Follow the process
#AhmedabadNest #nseindia #stockmarkets #analysis #BULLISH

Weekly Re balance Update for 26/06/2023
Frontline Dominators
Exit -Maruti-Bpcl
add-LT-NTPC
Focused Dominators
Exit-VBL-HAVELLS-GODRJECP
add-Indigo-icicipruli-bajaj holdings
Momentum Dominators
Exit-IDFCFIRSTB
add -Cummins
Value Dominators
Exit-Maruti
Add-Balkrishnaind
Momentum 15
Exit-IIFL-Indhotel
Add-Tiindia-M&MFIN
In case you missed full list of stock attached file
incase in query/question mail me [email protected]
Current Full list Updated
Equity Curve Trading
Edge is the key
#AhmedabadNest #momentum #portfolios #trading #BREAKOUTSTOCKS #quant #DataAnalytics #nseindia #StockMarketindia

#Momentum #portfolio Update
Focused
Momentum Dominators
Momentum 15
all three has good gain today turned into Negative Column Reversal
in continues Double Top Breakout pattern
Bullish as long as dosent gives Double Bottom sell signal
weekly re balance will be come on friday after mkt close
Equity curve Trading
Edge is the key
question/query mail me on [email protected]
#AhmedabadNest #trading #investing #nseindia #StockMarketindia

#nifty
Alpha 50 Index
much awaited correction is happening
Trendline support is important and follow thru upside breakout will be good that will help to
Project upside
Revise Stop loss
Pyramiding the position
Clarity on positive momentum
Holding KOTAKALPHA since 26.14
query/question Mail me on [email protected]
#ahmedabadNest #Momentum #trading #investing #analysis #StockMarketindia #nseindia

LONG TERM TURNAROUND PORTFOLIO-Series 1
Maximum 20 stocks structural up trending stocks
Stock will remain in portfolio for few months to years
Re balance will be done as & when required when stock fracture its long term trend/corporate governance issue etc
invest equal weighted amount
will update chart with SL -Entry-Probable Upside levels on various charting methods with concept like Relative Strength etc
CMP 102.69 SL 99.16 will constantly update revise SL -entry point etc
stock mention in image
for any query/question [email protected]
donot send how you select the stocks/whats the strategy etc
#AhmedabadNest #Momentuminvesting #portfolio #breakout #nseindia #StockMarketindia


to get this euphoric move need green line above red line -once that happen will update
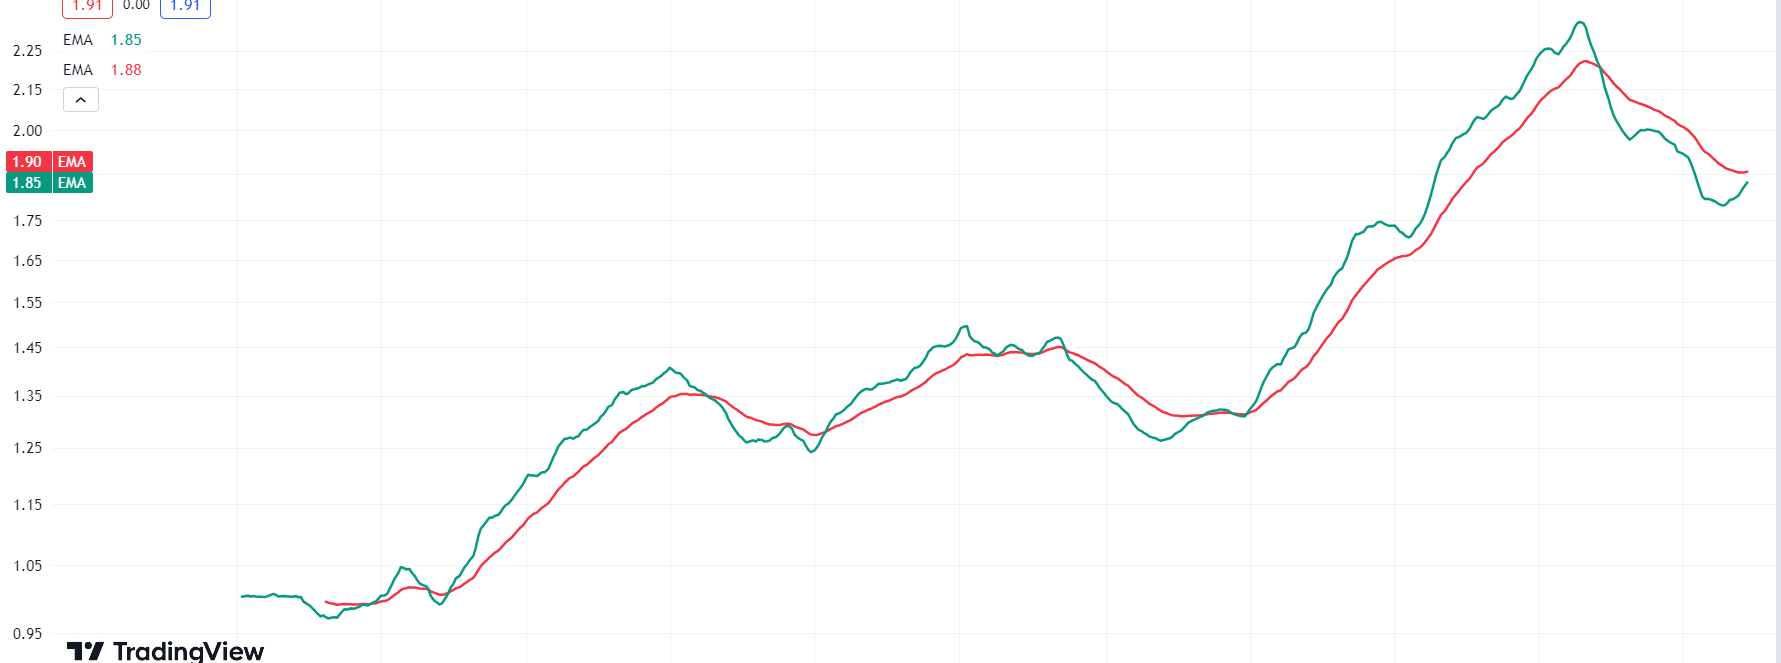
Mkt has enterd into overbought /Euphoric Zone
last time seen between 14/8/2020 to 26/11/2021 in this time nifty 500 Gain 59 %
Average Return was 4.21 % Per Month
Idea is to do momentum trading with Stop Loss & Risk Management
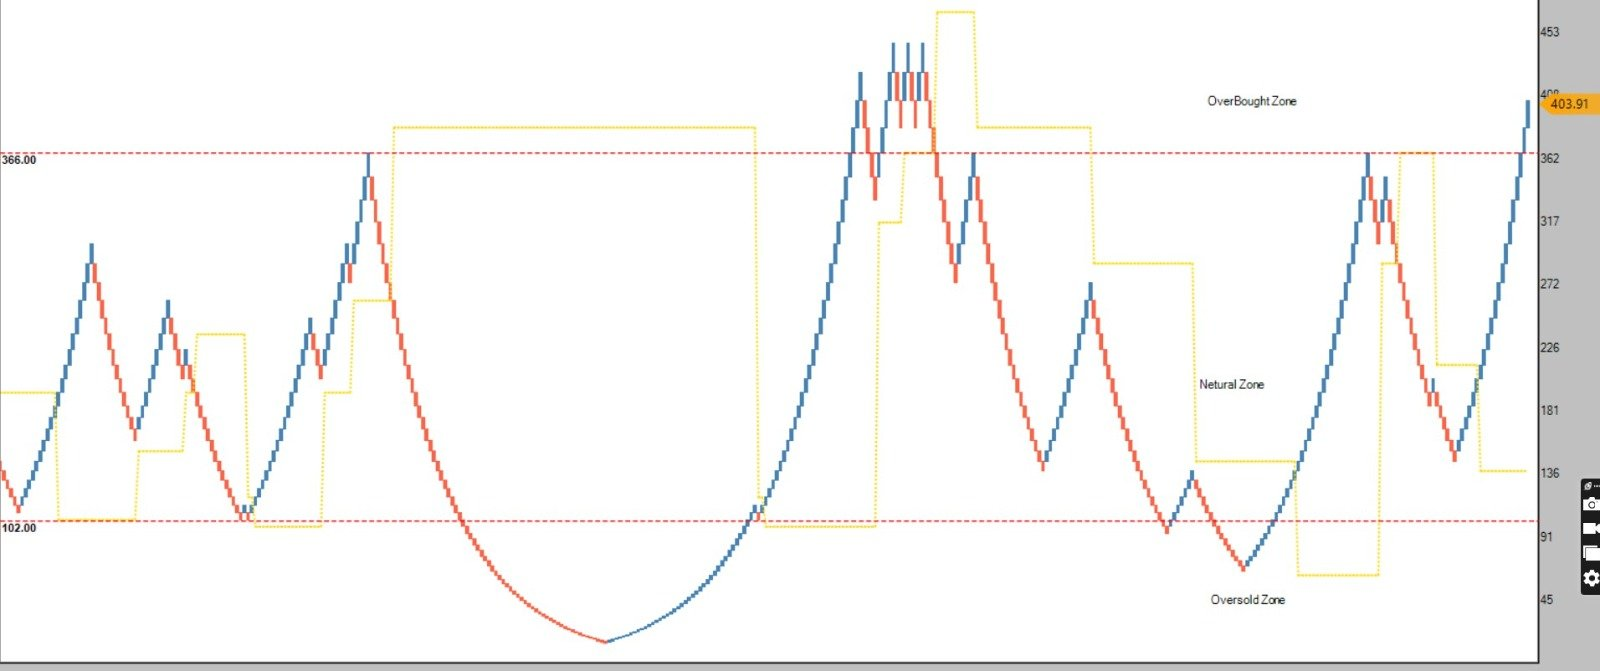
chart of all portfolios
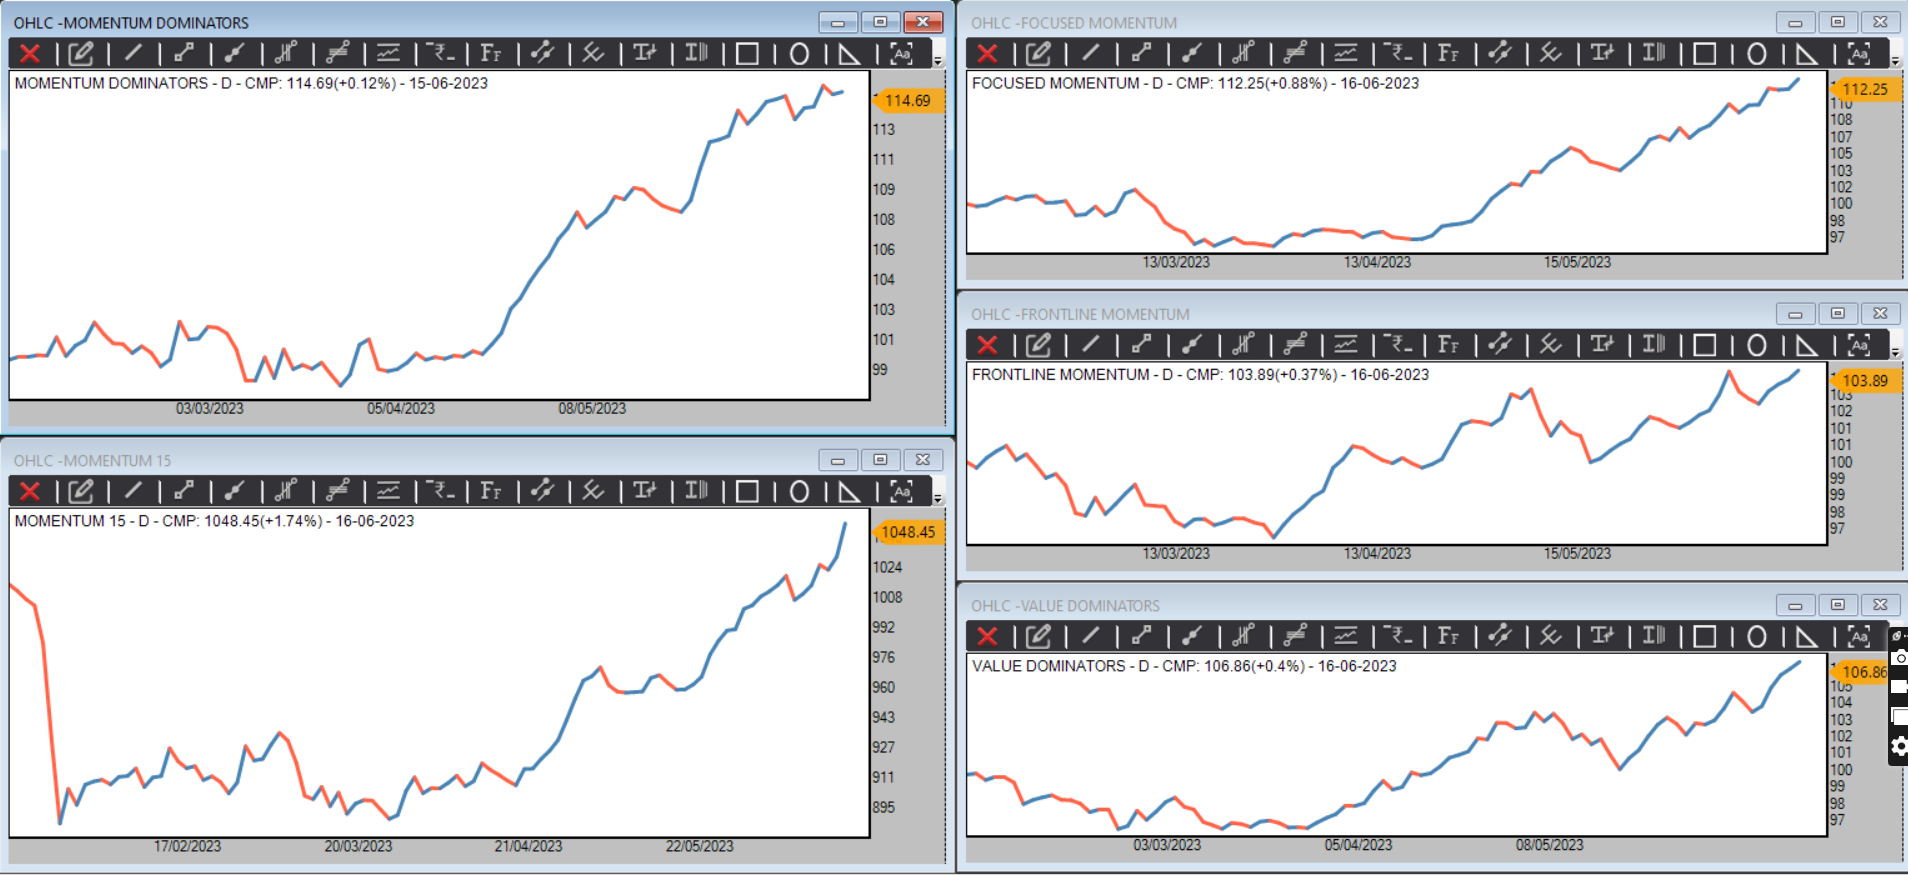
Weekly Re balance Update For Momentum Portfolios 19/06/2023
Momentum Dominators
Exit-Siemens/Cummins
Add-IDFCFIRSTB/L&TFH
Frontline Dominators
Exit-LT/EicherMotor
Add-Apollohosp/BPCL
Focused Momentum
Exit-Indigo
Add-Godrejcp
Momentum 15
Exit-Kpittech/CGpower/Polycab
Add-Aplapollo/L&TFH/IIFL
Current Full list Updated
Equity Curve Trading Edge is the key
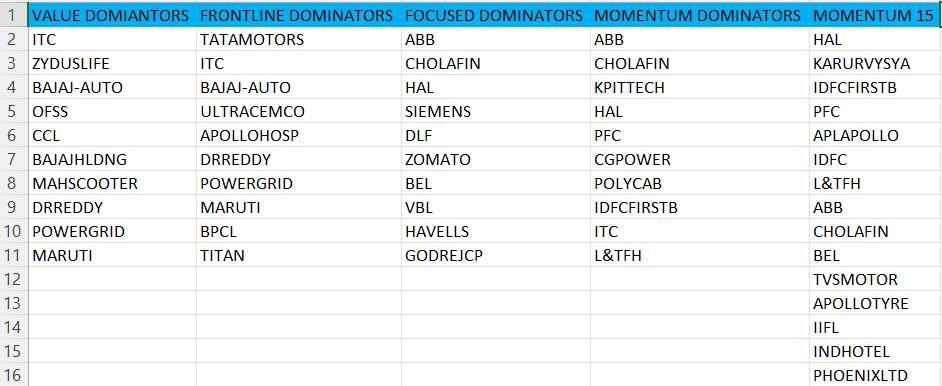
when using technical analysis we have clear entry exit and risk define process
as per indian mkt history first quarter is majoriy bed while last quarter is majority good
12 Stock equal weighted portfolio for 2023
Idea is create equal weighted portfolio in software use your favourite pattern to trade the entire portfolio
#AhmedabadNest
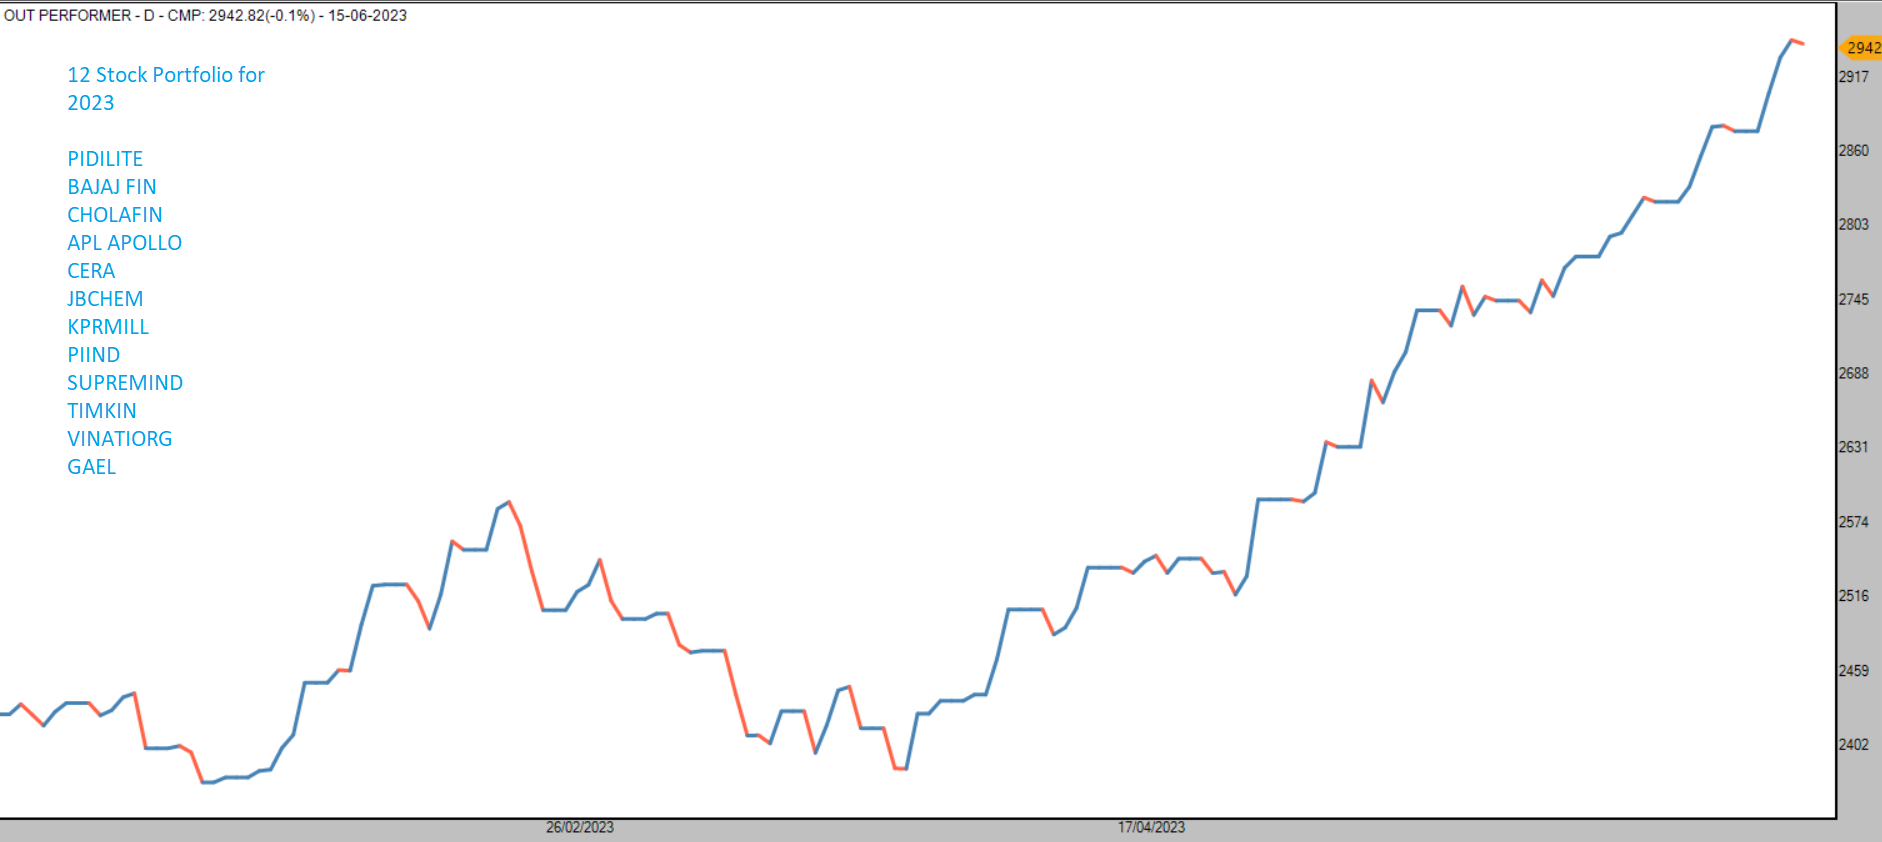
This is the big question -same difference in P&F TOI
Momentum 15
Momentum Dominators
Focused momentum
Value Dominators
all are at fresh breakout so revise counts and revise stop loss
all are weekly re balanced
for referance again name given
#AhmedabadNest #momentum #portfolios #trading #BREAKOUTSTOCKS #quant #DataAnalytics #nseindia #StockMarketindia