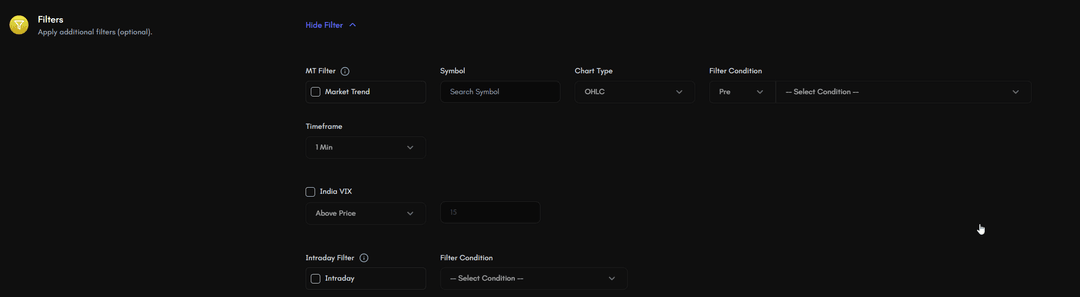
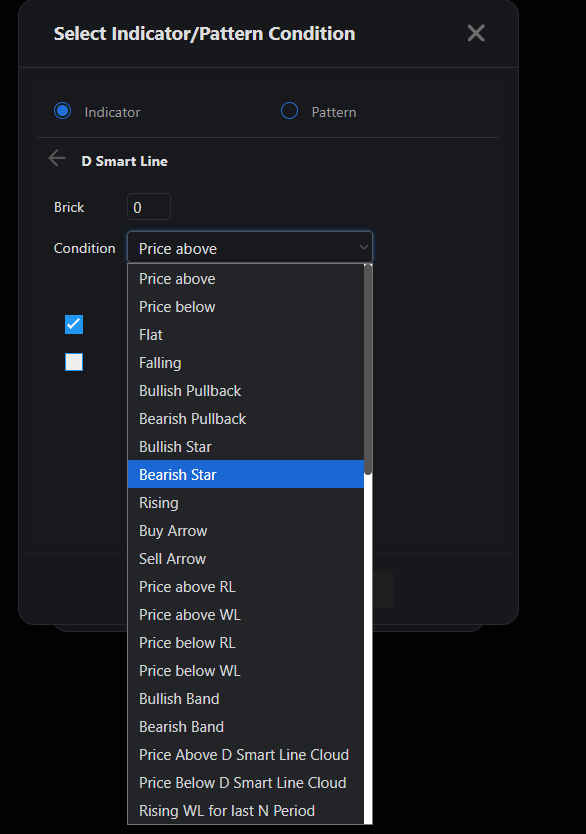
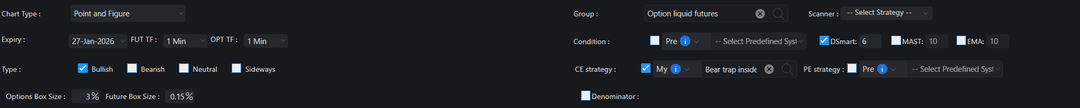
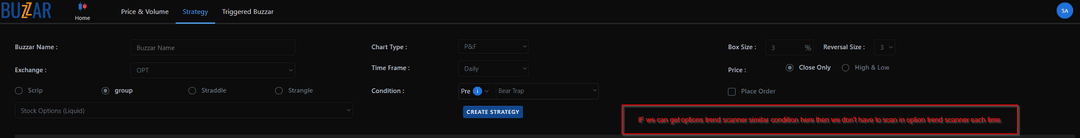
Can we get an option for daily chart under chart-based MT filter?
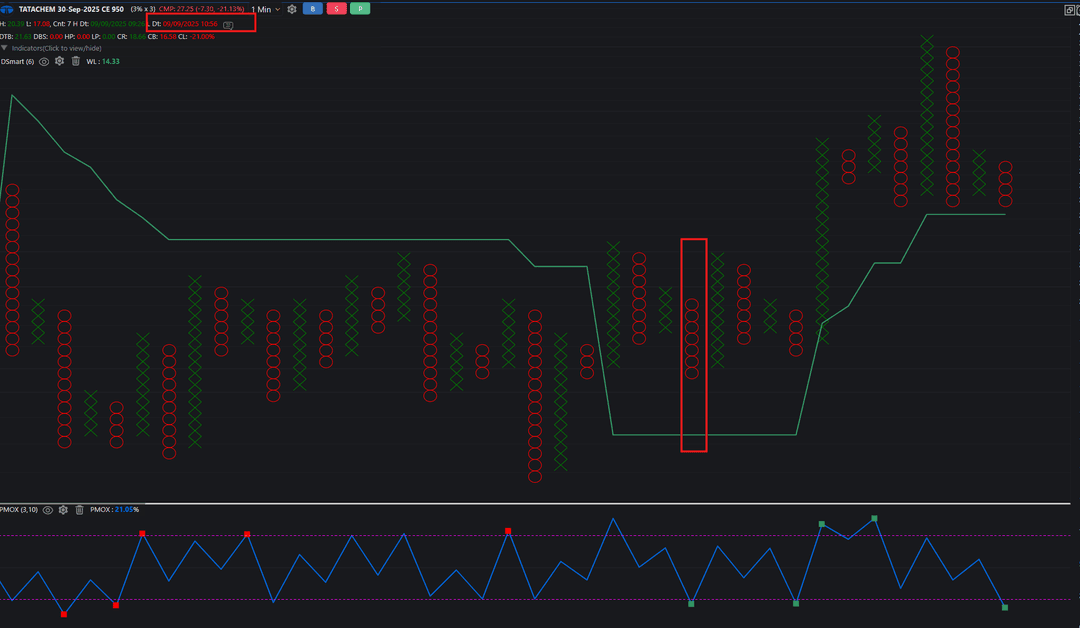
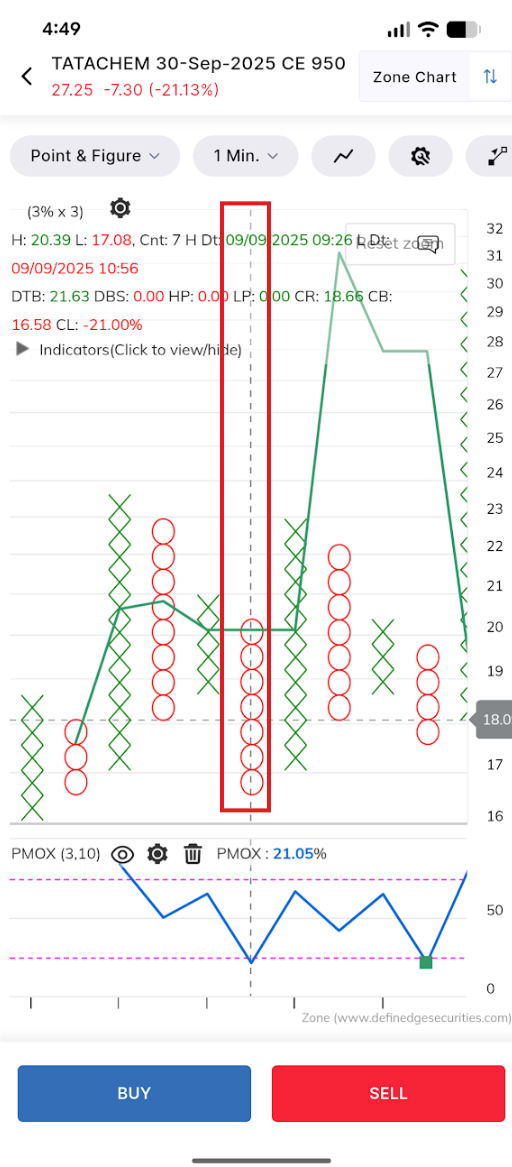
For example, if a pattern is matched in PE, then i want to filter like that underlying should also below d smart or DTS or last column 0 in daily timeframe. That is currently possible in underlying based option method.