@@Definedge-Experts - Could you please help understand how to use this indicator? what each period mean and the purpose of it?
V
Vinubhai Patel
Pro User
All Replies
-
-
Hi Team - @@Definedge-Experts, @Raju-Ranjan,
There appears to be a bug in momentum backtesting with the Relative Strength condition. Currently, it returns no qualifying stocks, despite previously identifying multiple matches under the same criteria.
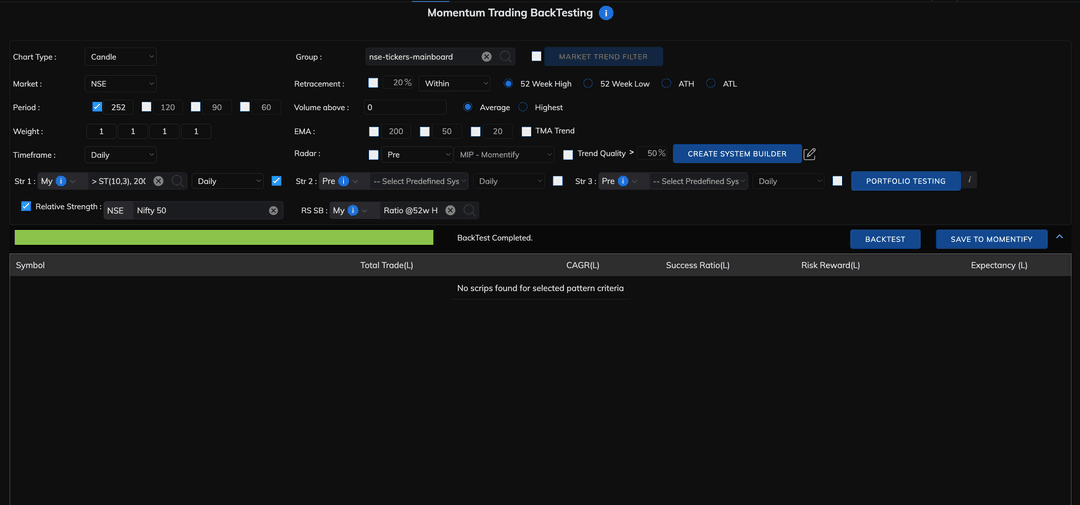
Could you please look into it?
Thank you!
-
Hi @@Definedge-Experts, @Raju-Ranjan,
Could you please explain the settings below or point me where can I find the explaination of these settings?
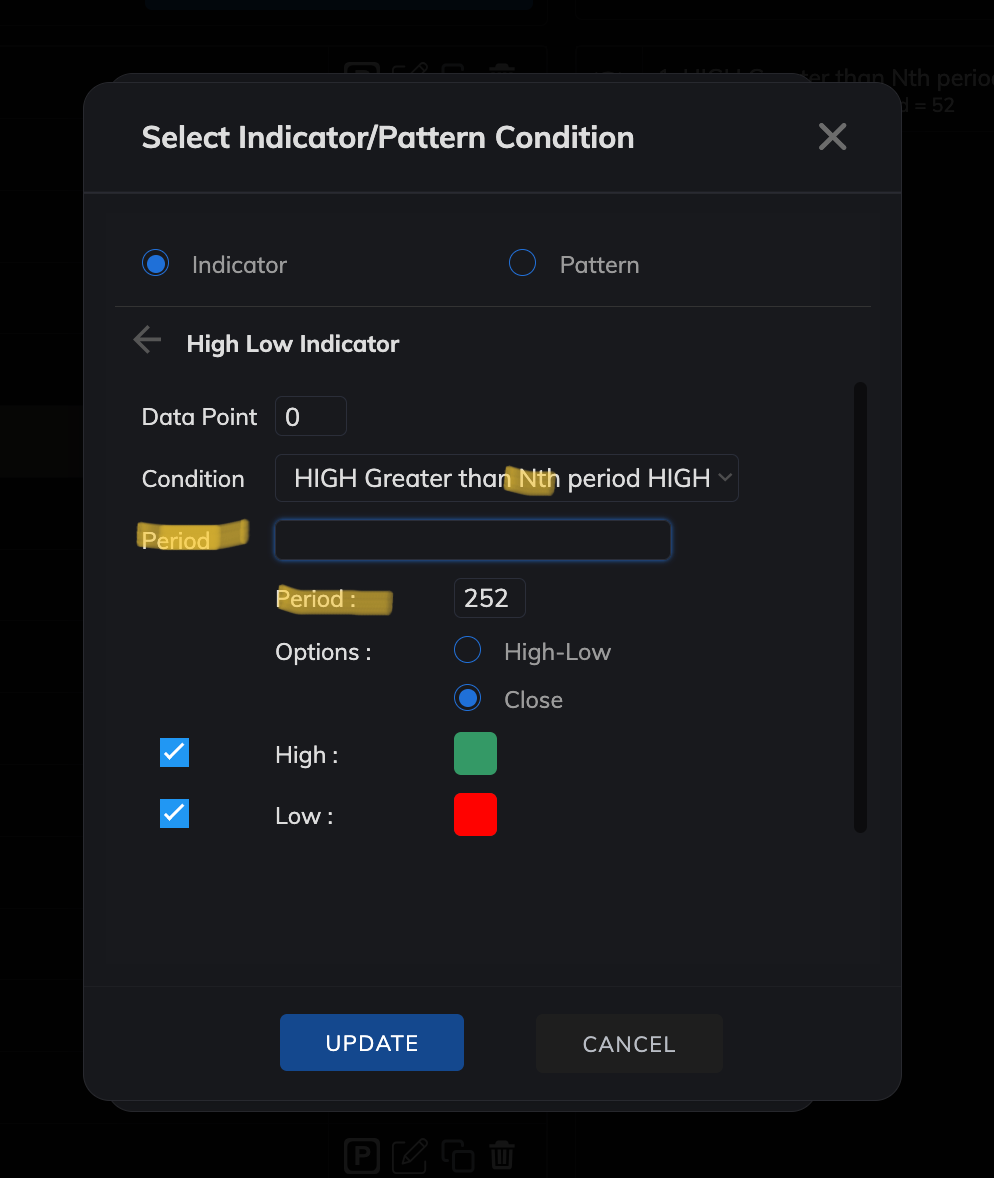
On a ratio chart system builder - we have high low indicator.
High Greater than Nth period high - Ideally it should mean - X candle high greater than Nth period high where we should only have 2 variable X and N However, We have Data Point which I believe defines X candle but then we have 2 inputs for Period. What does it entail?Definedge has plathora of such indicators which can be greatly useful however there is no documentation which makes it harder for user to find the right one and use them.
Looking forward to your response.
Thank you!
-
@Brijesh-Bhatia - It's all resolved now but from next time, I will upload the snapshot with timing.
It started working recently before 30-45 minutes ago.
Thank you, appreciate your help! -
Hi @Brijesh-Bhatia , @Definedge
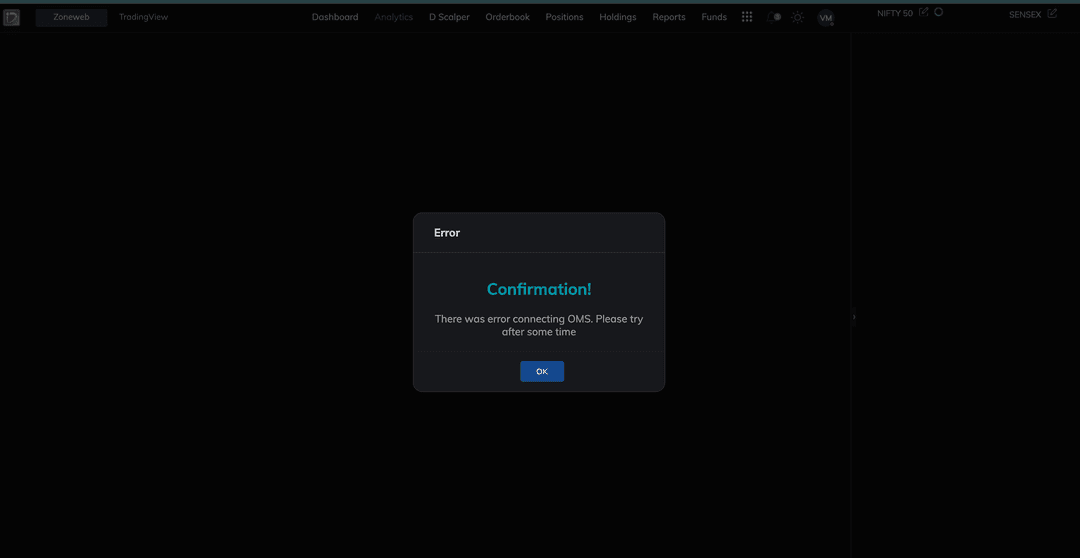
Experiencing the same issue again? Could you please look into it?
There was error connecting OMS. Please try after some time -
Hi,
Thanks for forwarding it to concerned department - could I please request if this will ever be considered and be implemented? If so could you please provide details on to which of the following features can be considered and implemented and by when?- Ratio Chart backtesting
- Adding RS criteria like RS @ 52w high, RS @ATH, RS alpha indicator > 0 into system builder for OHLC and point & figure etc..
-
That's where the mindset comes in. Process and Discipline determines who win the game of probability.
-
Hi @Brijesh-Bhatia,
Is there any indicator that can help with below?
Close > 100
and
Turnover = close x volume
turnover > 2crI can't seem to find any of the above - Anyway to achieve above?
Thanks
-
Hi Team,
What’s happening with the platform?
Day by day, the overall platform experience is getting worse. RZone - unable to access and showing There was error connecting to OMS since last few days. The mobile app chart often doesn’t load during market hours, and this has been happening for quite some time. Could you please share a timeframe for when these issues will be resolved?
Issues observed:
RZone: Unable to log in for the past few days.
Zone mobile app: Charts do not load during market hours. This issue has existed for a long time and needs urgent attention.
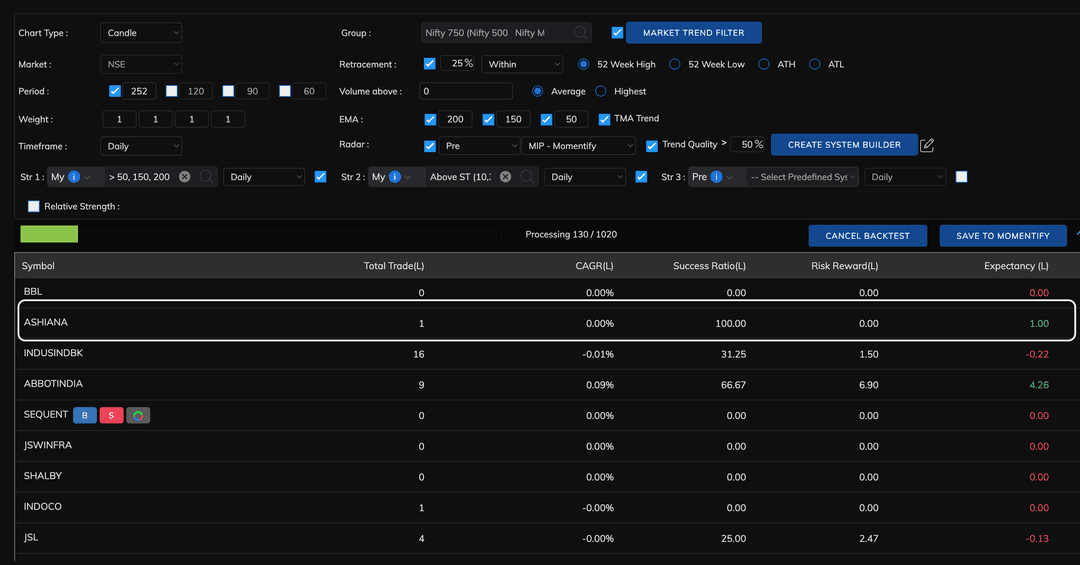
Backtesting: Results appear inaccurate — for example, the CAGR shown is clearly incorrect.
Could you please investigate and resolve these issues as soon as possible?
Thanks,

-
Hi @Prashant-Shah, @Brijesh-Bhatia,
Could you please add backtestig for Ratio Chart as well?
Along with that for Candlestick - If you can allow RS Alpha indicator scanner in System builder that would be great so that in backtesting we can have strategy with RS alpha as well. Currently, we have RS Alphha available on chart but not on the System builder for scanner in OHLC.
Thank you

-
Yes, lately It's been frustrating. Everyday, there are different issues - looks like it requires adequate regression testing before publishing the new version.
i.e CAGR calculation is broken. Success ratio is 100% but CAGR is 0
-
@Brijesh-Bhatia
I thought we execute trade through momentify so the system know which candle we entered the trade and so it can decide which candle low to exit onFor Supertrend, What I noticed is that - most of the time - supertrend turns green and then it does not cross the high of that candle on very next day and it may take from 1 day to few weeks or more - so we don't know the exact timeframe between it turned green and it crosses the high. Is there a way to achieve that? Thanks
-
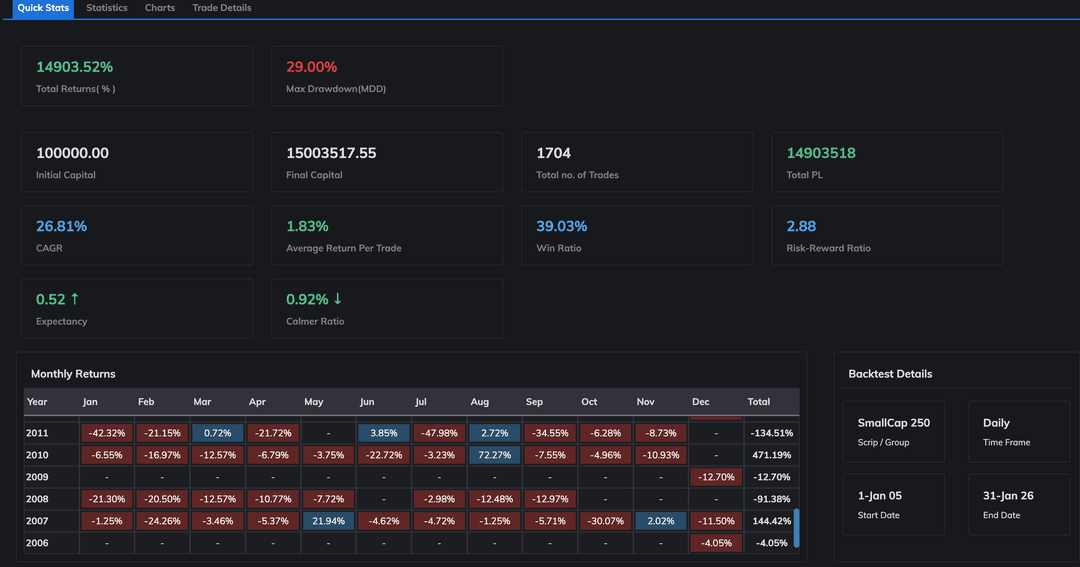
Another example:
Check the year 2010 - All the months in year 2010 have negative returns except Aug and Aug 2010 - the return is +72.27% then how come the total return is 471.19% in 2010? Please find the attached imaged
-
@Prashant-Shah
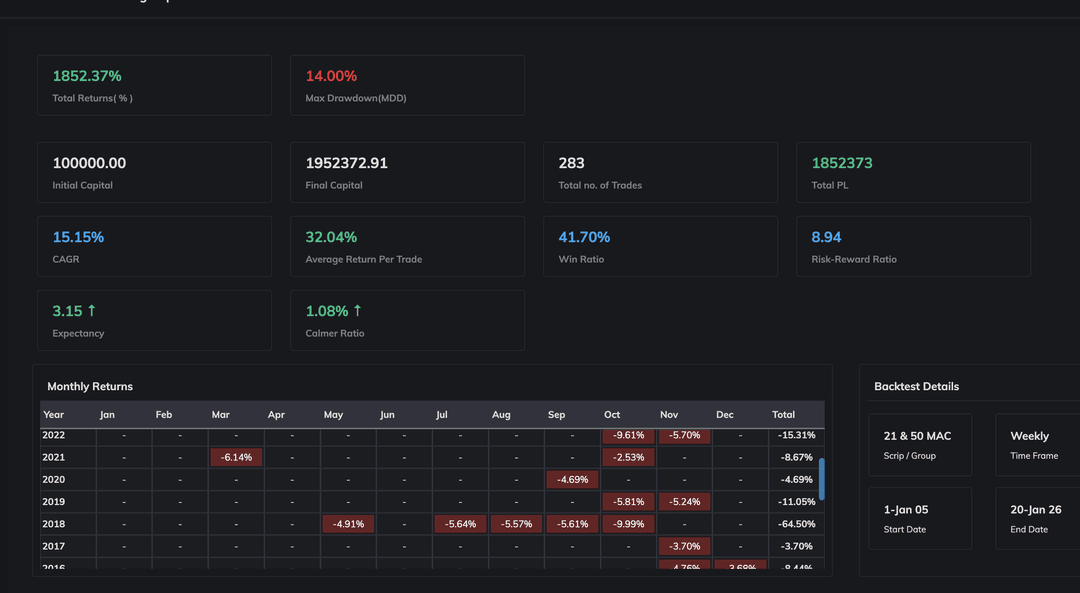
I have also came across issues with momentum trading back testing where the numbers does not add up and seem to be incorrect. ie. Monthly returns table shows negative percentage in all years total however CAGR is positive. CAGR can't be positive if we are getting negative return every year. Please look at the attached image. It's hard to understand which data are correct and which are not?

-
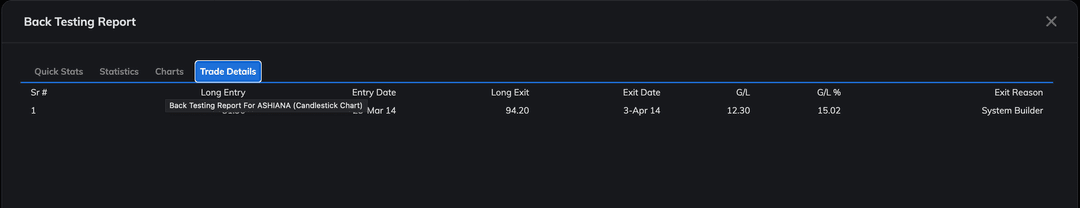
Hi @@Definedge-Experts - Some of the historical data does not seem right. ie.
i.e ALEMBICLTD - Backtesting shows the long entry on 10-Sep-13 @ 24.65 whereas the actual closing price on that day is 12.32. Which clearly shows that - split might have caused this issue. Can you please look into it and fix the data so that backtesting result is more accurate and skewed due to such issues?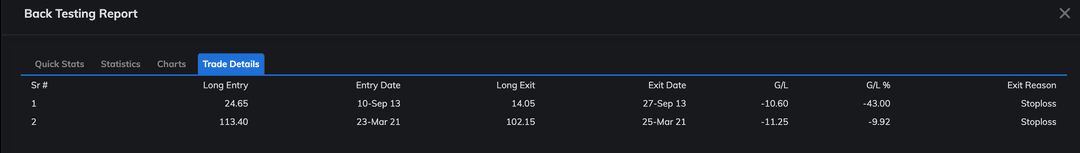
-
@Definedge @@Definedge-Experts
Any update on this? -
@Brijesh-Bhatia - appreciate your help
i.e. - If I created momentify strategy with some strategy and want to exit at the low of the buying candle - how do I create it in the system builder?
Similarly, how do I create a scanner in the system builder to filter the stocks based on following criteria:- Supertrend turned positive
- High of the above bar where the super trend turned positive/green is broken
As always - grateful to you and the team
-
Hi
Please let me know if you need any more information to debug further. Basically - It shows all yearly total returns as negetive but still shows CAGR of positive 15%Along with that Mobile app chart is obvious and I believe could be replicated very easily unless it is specific to user's mobile model/version.
Thank you for such great product and support.
-
Hi
The chart on mobile device does not load during market hours and it is almost impossible to get it working. At times it works after hours.
Along with that It seems like the numbers shown in monthly returns seems to be incorrect and not working as expected.
Could you please look into it and fix it ASAP?
-
Thank you @Prashantbahi - appreciate your quick response and such a great product.
-
Thanks for your quick response @Brijesh-Bhatia.
I have few other questions regarding the system builder if you can help with :How can I filter stocks with following criteria
1.
Supertrend turned positive
High of the above bar where the super trend turned positive/green is broken20 EMA is broken down
Low of the above bar where 20EMA is broken down is breachedHow can I exit on the breach of the low of the bar on which we have entered into the position?
Thanks
")
-
Hi,
I couldn't find any of the continuation patterns like Bull Flag, Pennant, Ascending Triangle, Rectangle - How can I scan stocks for such patterns?
Thanks
-
Hi,
How to backtest Master scanner and other pre built scanners like Darvas box scanner etc.. - as it would be important to backtest any strategy to make an informed decisions before using for trading or investment?
On Momentify, there is a button for backtesting - but it just takes user to RZone but there is no way to backtest the strategy - It seems like broken feature. Ideally, It should take user to particular backtest page and auto populate the criteria for backtesting.
Thanks,
-
Sure, if you can contact that would be greatly appreciated. you can contact me on my Whatsapp number which is available on the Account unless you want me share it here.
Thanks -
Hi,
How to test Master scanner?
On Momentify, there is a button for backtesting - but it just takes user to RZone but there is no way to backtest the strategy - It seems like broken feature. Ideally, It should take user to particular backtest page and auto populate the criteria for backtesting.
Thanks,
-
First of all thank you for such a nice ecosystem of tools.
I have few questions:
As there are plethora of Indicators and Patterns - Is there any documentation explaining what each of them does and how to use them?
If there a way to achieve something like: close below 10 EMA on weekly timeframe and on daily timeframe price goes below the low of last week => this is my exit criteria
Is there any way to backtest some of the smart screens like darvas or vcp etc..?
-
Hi @Prashant-Shah
Is it available now?
Understanding High Low Indicator settings
Momentum Trading BackTesting with Relative Strength condition - No stock qualifies
Understanding High Low Indicator settings
RZone Not working, Mobile app chart not working
RZone Not working, Mobile app chart not working
Feature Request - RS Alpha Scanner in OHLC System Builder and Backtesting Ratio Chart Strategies
Markets rarely announce opportunity loudly.
Volume indicator or turnover indicator
RZone Not working, Mobile app chart not working
Feature Request - RS Alpha Scanner in OHLC System Builder and Backtesting Ratio Chart Strategies
ISSUES AND BLOCKERS
Continuation Pattern
Serious Issue in Backtest Position Sizing Logic – Inflated CAGR Results
Serious Issue in Backtest Position Sizing Logic – Inflated CAGR Results
Historical data issue
Chart on mobile device and monthly returns in backtesting
Continuation Pattern
Chart on mobile device and monthly returns in backtesting
Chart on mobile device and monthly returns in backtesting
Backtesting Master scanner
Continuation Pattern
Continuation Pattern
Backtest Master scanner and other pre built scanner
Indicators and Patterns
Backtesting Master scanner
Indicators and Patterns
R Zone, system builder, arithmetic operations???