I also have the same wish. It is difficult to read the DTB / DBS levels at the top of the chart. It would be better visible in the right side or left side of the chart, in a separate window. Also, since this view is already available in Tradepoint Desktop, it should be easier to implement.
V
Vishal Shah
Pro User
All Replies
-
-
Hello team, can we access Tradingview on zone web or it is only available in Zone Mobile app?
-
Dear Team,
Please make a video or a blog on how to make use of this tool. Is it used for arriving at future fair value of the stock based on fundamental parameters? How to feed input into it and what logic to use for these inputs?
-
Dear Definedge Team,
Any update on the Tradingview integration on Zone Web?
-
Dear Definedge Team,
Any update on the Tradingview integration on Zone Web?
-
So I tried checking this. There is one scanner in Public which is called as '10 period high' which is not as per your exact requirements, but a lot of stocks appearing in it are showing Breakout. You can check it and may be check in 'Patterns' section - there may be some other pattern which matches your exact requirement.
-
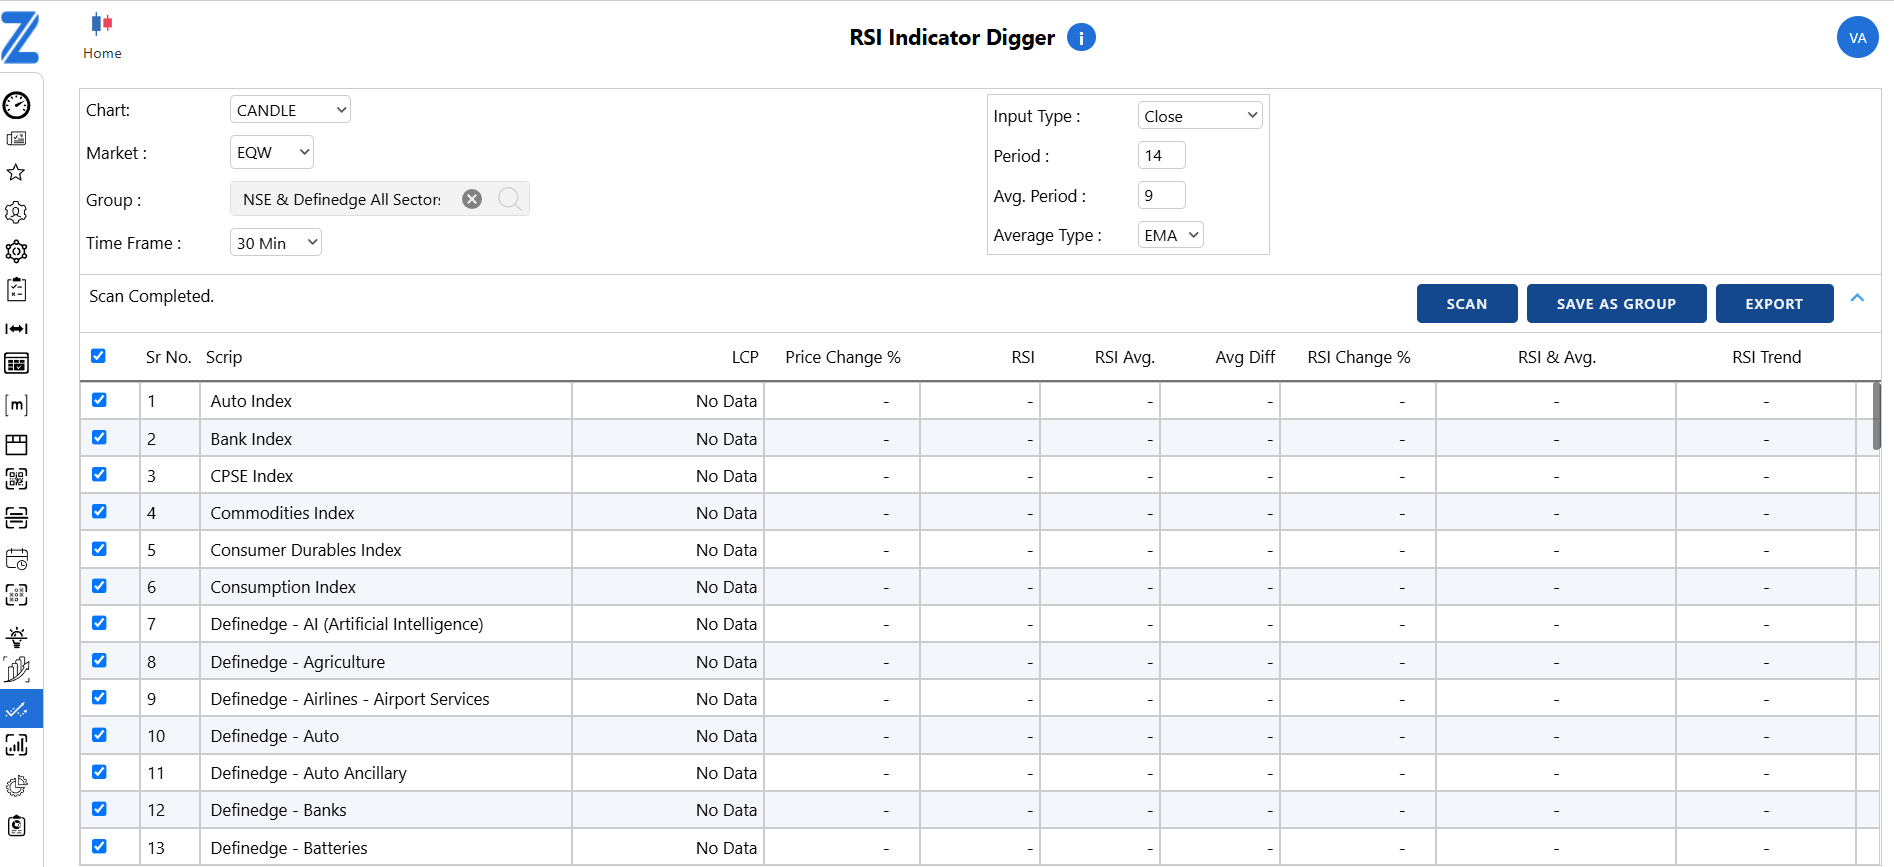
Dear Team,
There seems to be some error as the prices/indicator details are not getting populated in the Intraday time frame in EQW segment.
-
Dear Definedge Team,
As Prashant Shah ji mentioned in his last Youtube Q&A, Tradingview for Zoneweb is already in works and was likely to be released soon. Could you please clarify by when it will be available for use?
-
I think it is available on Opstra.
-
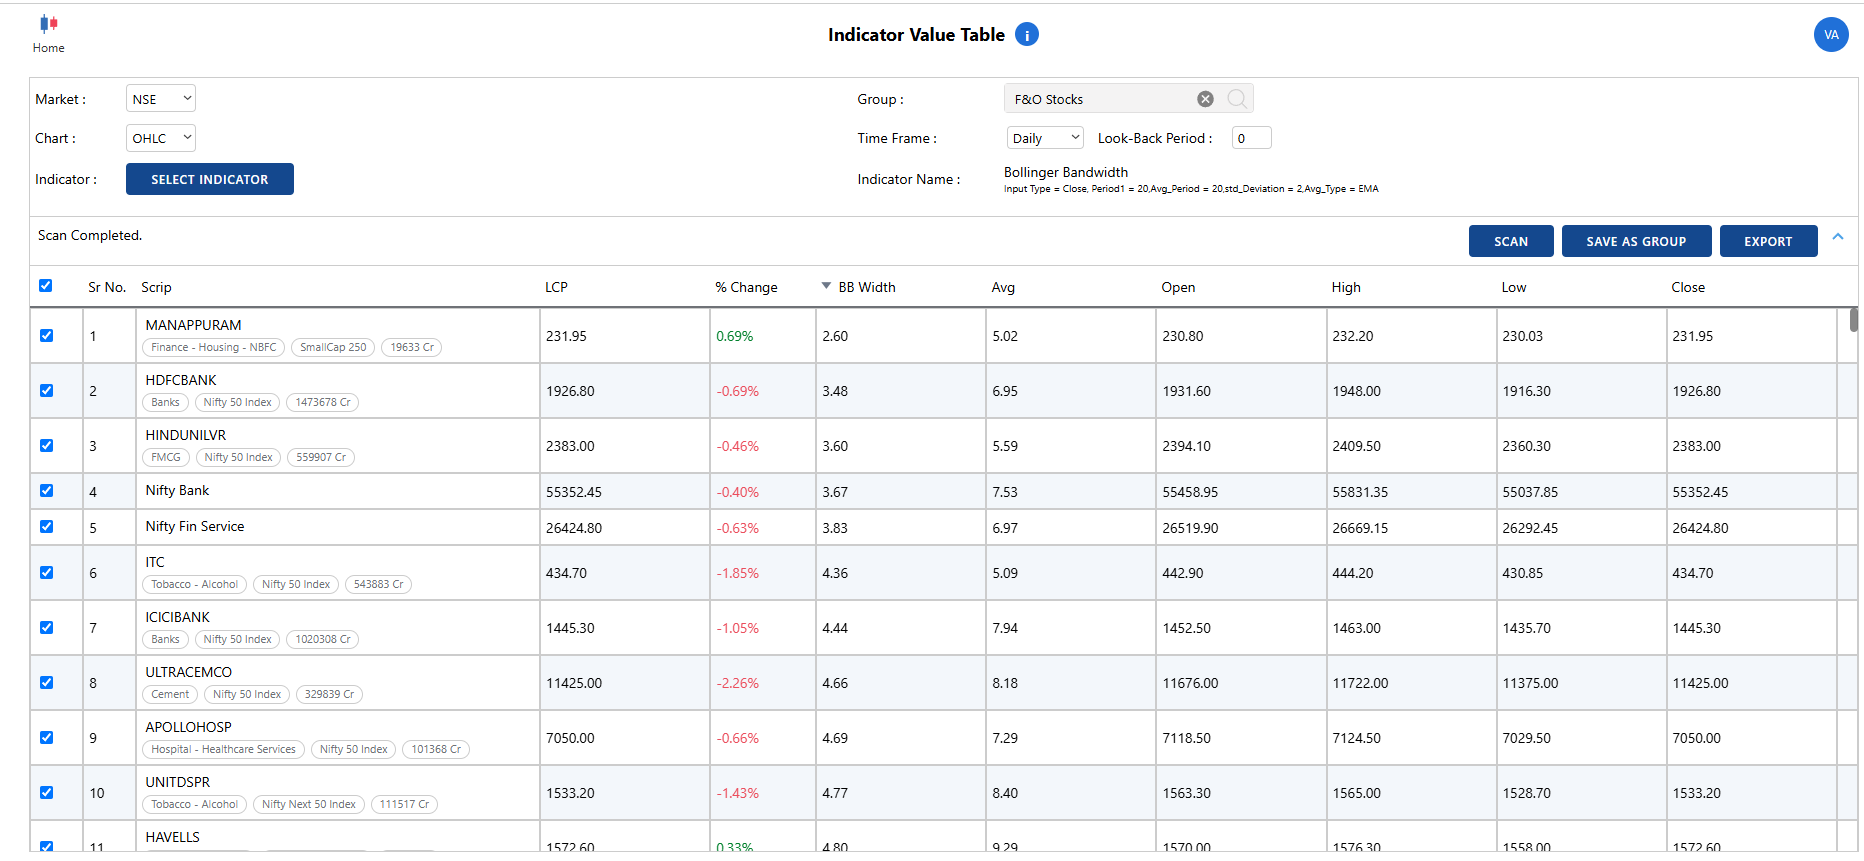
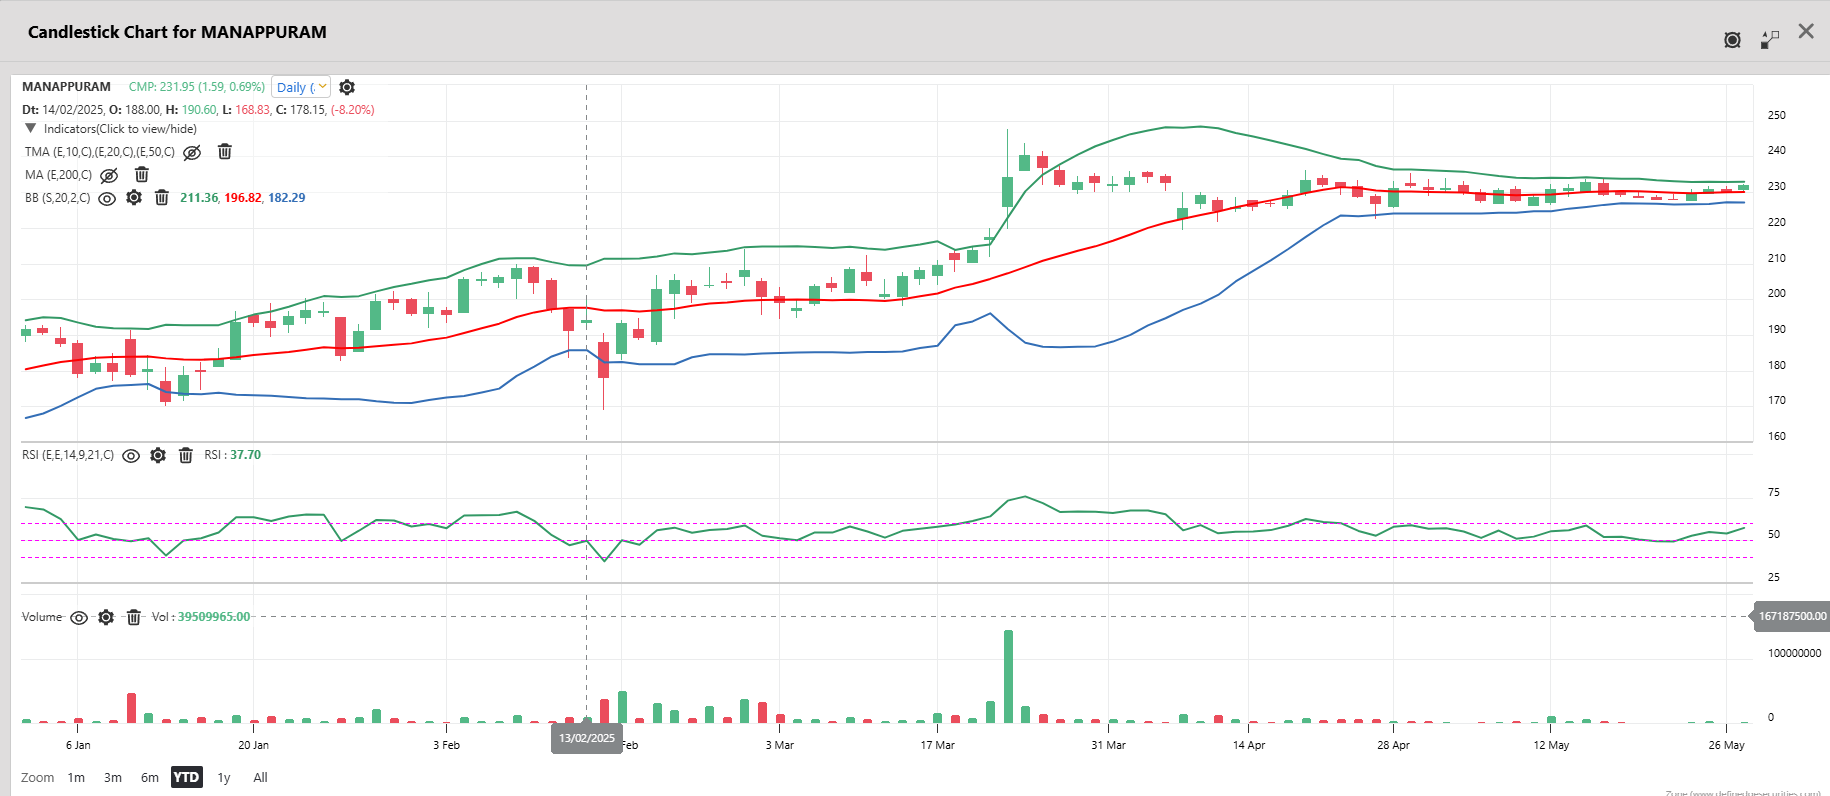
Hi,
You can use RZone > Table > Indicator Value Table > Select Bollinger Bandwidth as the desired Indicator > Select Group (I have selected F&O Stocks in this example) > Sort stocks based on BB Width from lower value to higher value. This will give you stocks with narrowest width (Tight Squeeze) to widest width. For example Manappuram Finance is showing a Tight BB Squeeze.
-
Yes, please consider this as I have the same request. Please enable this selection of default period, change default period for various use cases so that charting can be fast.
For example, in Tradingview, once we have opened a chart for Company 'A' and it opened with a default 60 days of data and we adjusted this chart to see let's say 223 days of data. Then the next chart that we click, let's say Company 'B' chart - it automatically opens with 223 days of data and does not open with 60 days of data by default. There is no need to select 223 days or such other time period every time, because the next chart we click automatically adjusts to period setting of the current chart we are viewing. Now let's say we open Charts for 'C', 'D' and 'E' similar way and it all starts with 223 days of data. Let's say we adjust the chart period of 'E' chart to 129 days of data just by zooming in a little. Now, if we click 'F' company chart, it will open with 129 days of data directly and not the default 60 or 223 days of data. The default period it is selecting is based on the last chart viewed. I hope I was able to explain this simply. There must be some logic behind this which once you figure out, it will be easy to role out this feature in Zone charts. Request you to please consider this change. I had earlier also requested for this type of setting.
-
Hello Team, plotting Year, Month at least and some significant dates on Noiseless charts will make it more visually appealing and easy to read. For example, at present, in a PNF chart, we need to keep pointing our cursor on one particular column, then look at the data on the top left menu to understand which are the days, how many days it took to build that column. We also need to check one earlier column and one next column to get the feel of the time. It will be much more simpler if the dates are plotted on x axis or if it is not possible to build in chart then some indicator which can give info about date on bottom of the chart. Please consider this feature request.
-
Need a MKLH video from Raju sir and AP sir especially in these uncertain times.
-
Hello team, can you please take this request up for the next monthly update?
-
@Yogesh-Varhadpande Thanks for sharing these details.
-
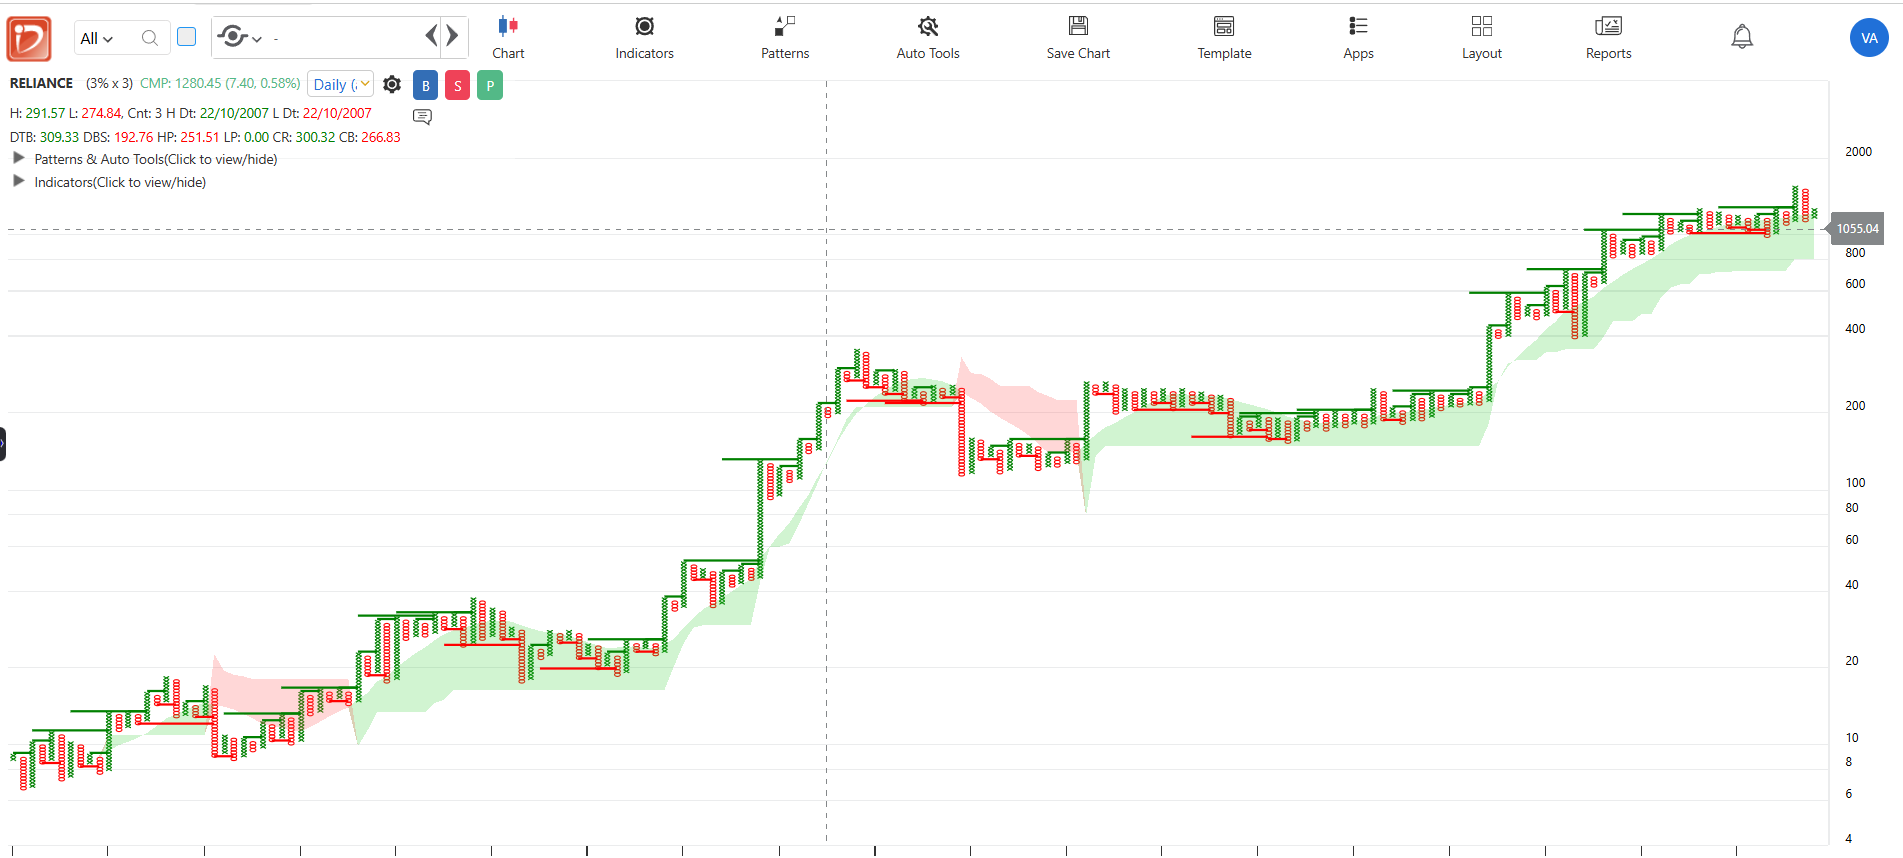
Hi Team,
I have watched many videos where the experts are advising to trade based on 1 Min Timeframe PNF Chart. However, the actual chart based on 1 Min Timeframe is so small with very limited data. For comparison, Reliance Daily Chart with 3% * 3 configuration shows data from till 1995. Whereas Reliance 1 Min Chart with 3% * 3 configuration shows data only from 27 Dec 2024 and is of only three columns. In fact, all intra-day time frame charts shows data only from 27 Dec 2024. So roughly it is 3 months data? Please clarify is this data issue and only Zone Web related problem or this same issue is there on Tradepoint also. Please add more data, if it is possible.
Charts shown for reference.

-
CB is Continuation Box, signifying the price when the next box in the existing column will be made.
-
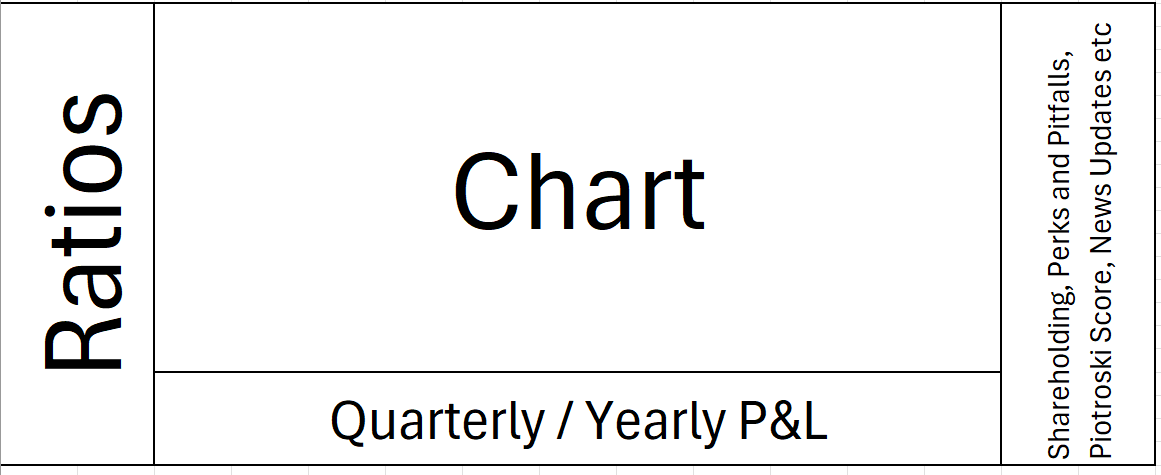
Presently, the fundamental details of a stock can be accessed in Zone Web chart by clicking on the side of the watchlist.
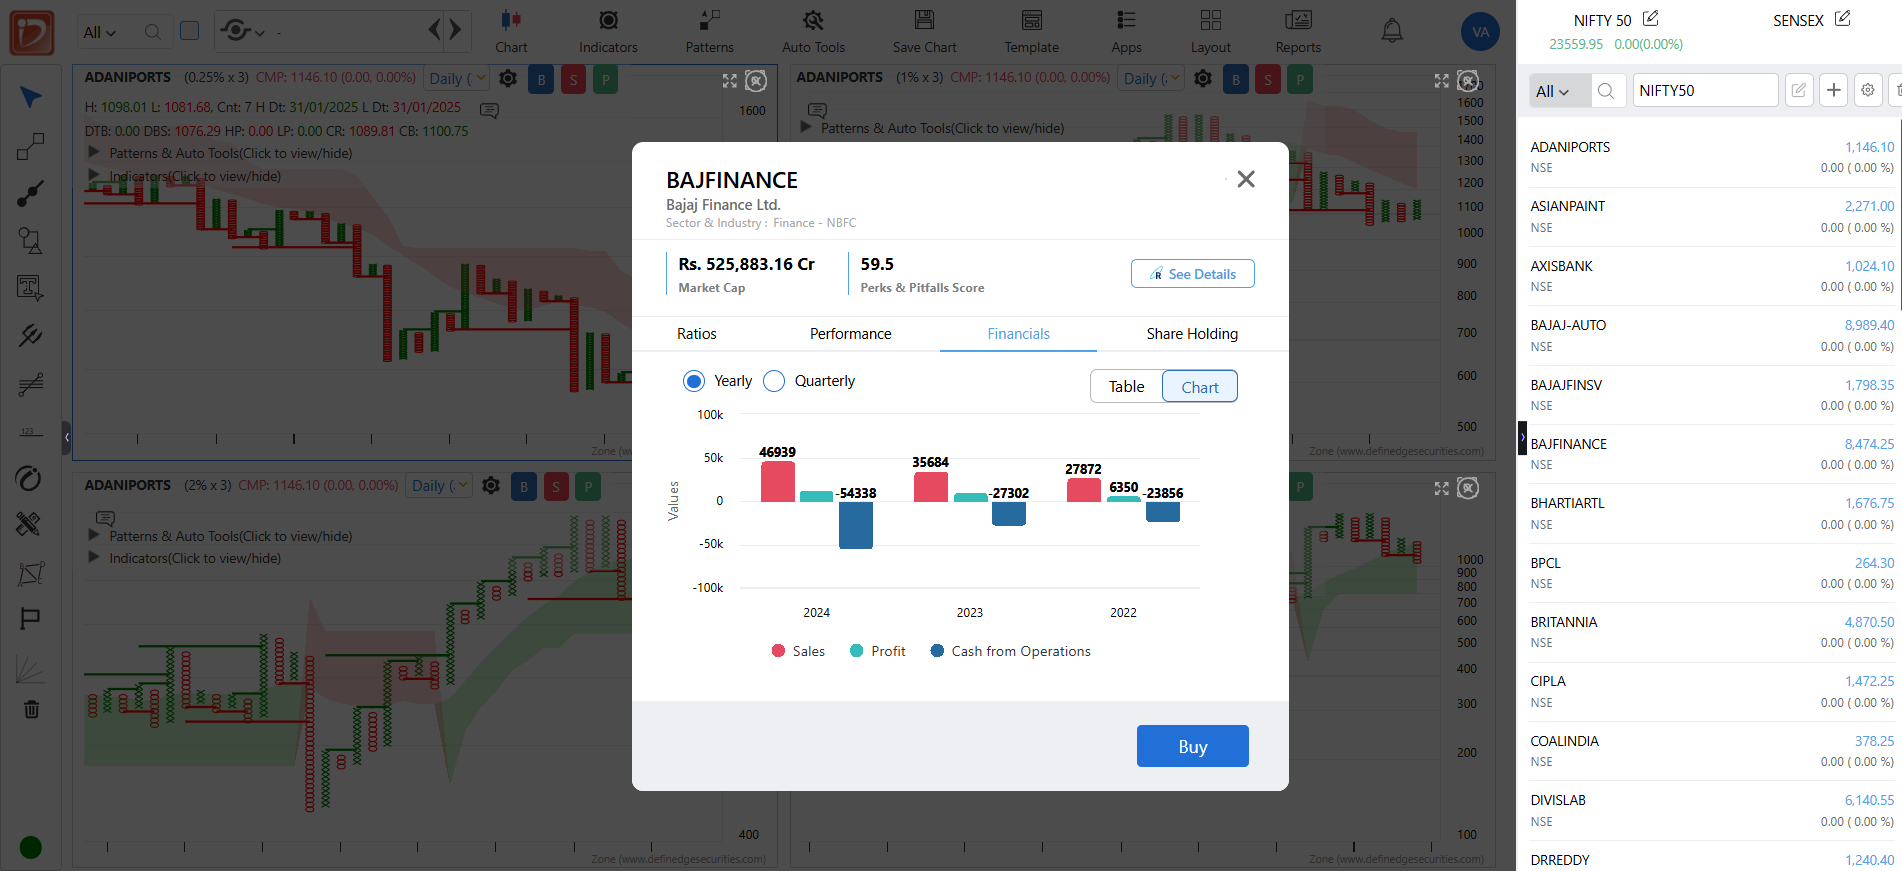
Is it possible to create a dashboard where we can see the chart and the fundamental data in one place without having to click for it each time? This could make scrolling through charts fast.
-
Hi Team,
Are Rzone Pro and Zone Web Pro one and the same? I have Rzone Pro subscription. Rzone is for scanning and Zone web is for charting. Is there anything else in Zone Web Pro version?
-
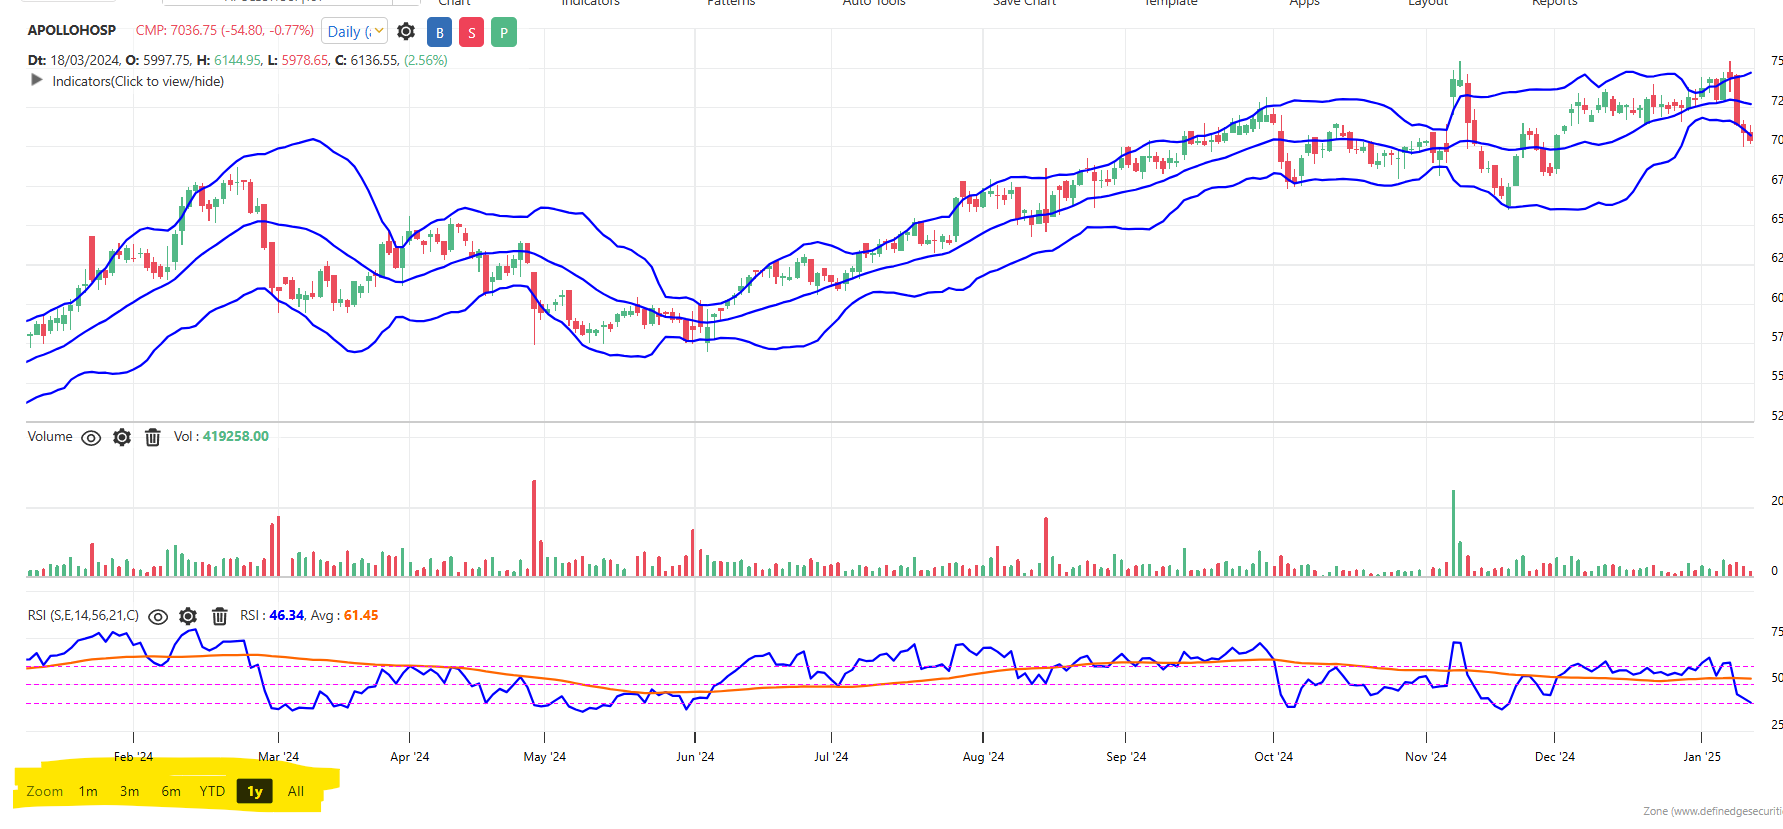
At present, there are some default chart period settings available on the bottom left corner of the Zone Chart platform - 1M, 3M, 6M, YTD, 1Yr. These all are there for only Daily time frame. These settings are not available for a 5 Minute chart - like 1D, 1W, 10 Days, 1M, 2M etc options should be there for Intra Day Chart and 3Y, 5Y, 8Y, 10Y, All etc options should be there for Weekly and Monthly Charts.
-
Dear Team,
I just noticed in the new features for Tradepoint Desktop version, Auto Count for Candlestick Chart has been launched and includes Short Term, Medium Term and Long Term counts. This is really an exceptional tool, in house developed by Definedge team, and could help in the trading/investment decisions.
Could you please explain the logic of how the Count is calculated? Is it based on Fibonacci extension or Pivot points? Or some other logic behind this tool? I reckon this tool will also be made available in Zone Web in the coming weeks?
-
Dear Team,
Is it possible to create a Relative Strength Alpha Indicator on PNF & Renko Charts? Currently the Ratio / RS charts are available but is it possible to provide a RS Alpha indicator for PNF and Renko wherein we can select the underlying index for comparison?
-
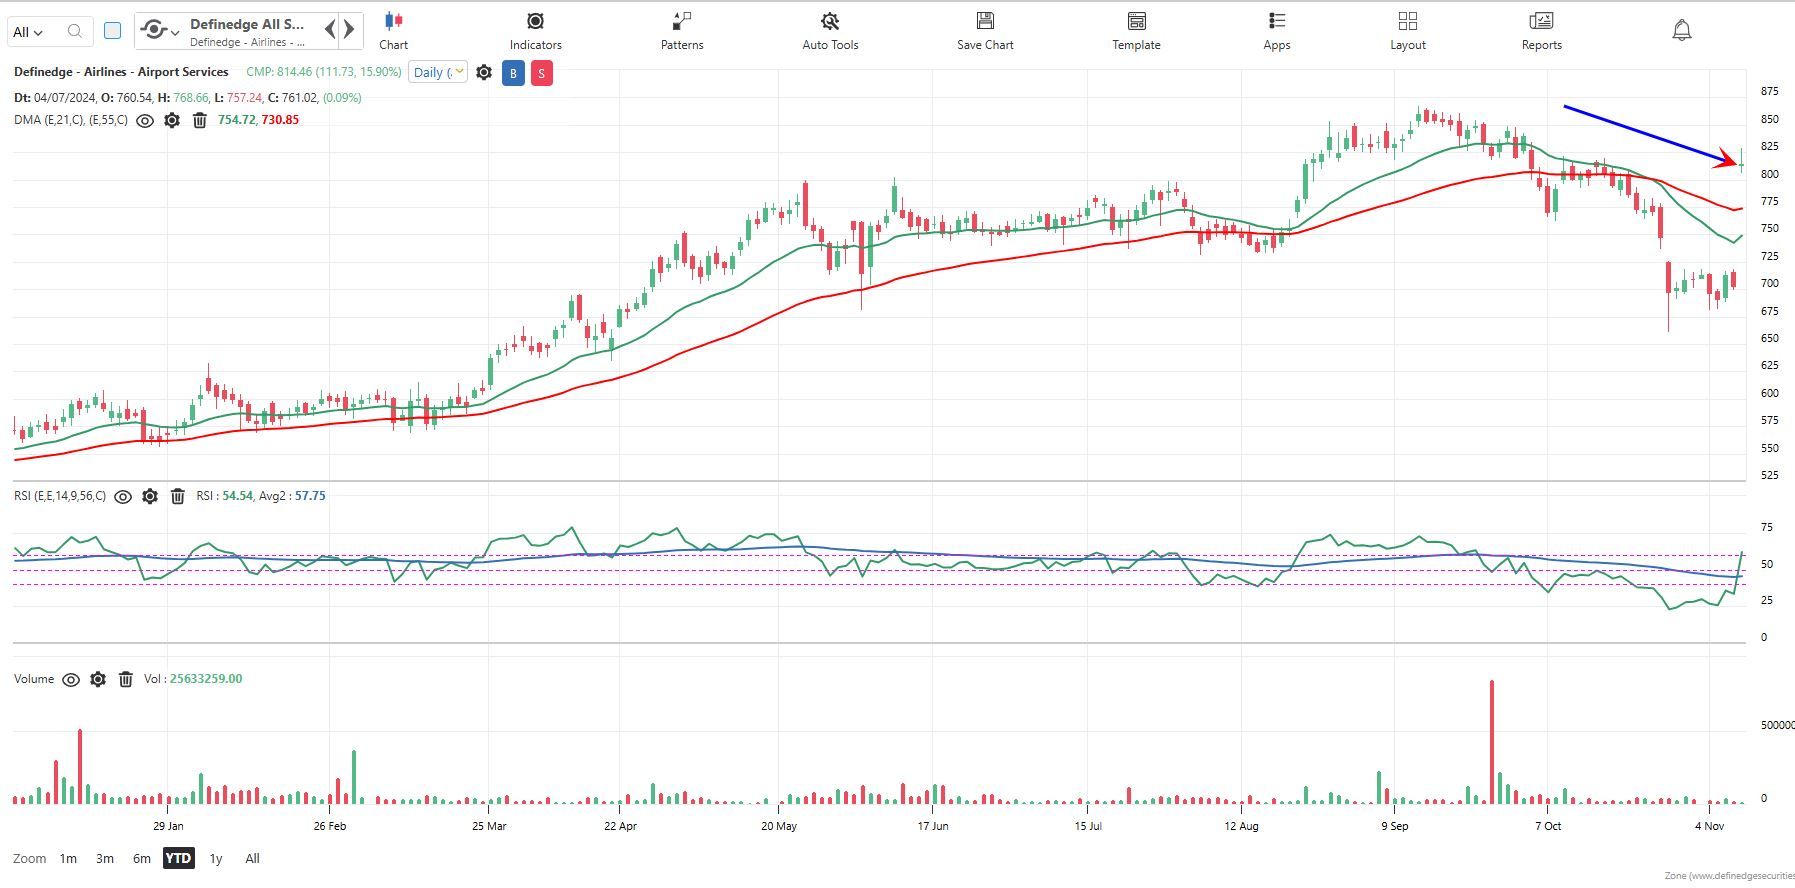
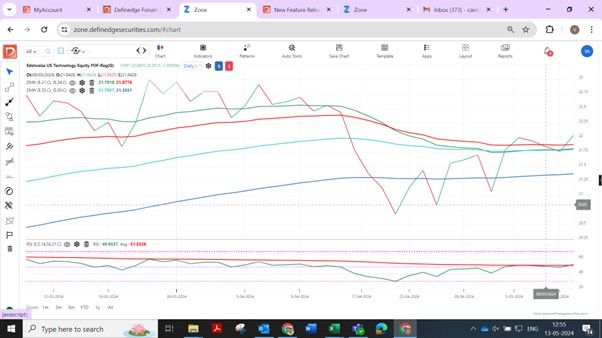
There seems to be a gap up jump in price on 08/11/2024 in Definedge Airlines - Airport Services chart but when checking the individual stocks in the Definedge sector, no such gains are visible in any of the constituents due to which such jump would be possible. Is this an error?
-
Dear Team,
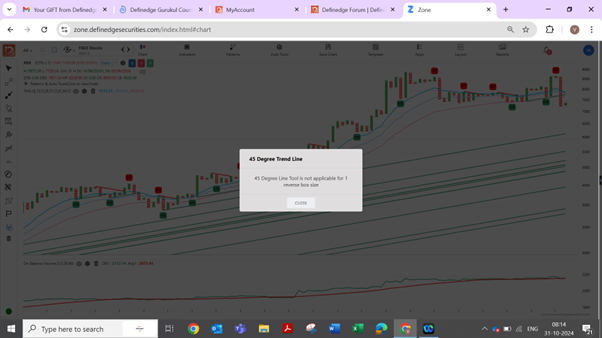
While using the PnF 1 box Reversal chart, when I apply Auto 45 Lines, it is getting applied but if I try to plot a 45 Degree Trendline manually, it is showing error that this tool is not applicable on 1 Reverse box chart. Please resolve this since even the 1 reverse box gets plotted either above or below the current box & column in the next column. So the same logic should apply in this chart as it applies to a 3 Box Reversal chart.
-
Dear Team,
I saw recently a lot of new scanners are added in the Tradepoint desktop. Request you to update if Tradingview Integration is still in the works or we will keep Zone web only as charting. I understand that problem may be due to Tradingview does not allow P&F and Renko charts in Intraday time frames, whereas Zone Web allows it even on 1 Minute timeframe.
-
Hi Team,
can you please let me know of the scanner as per above query? -
Hi Team,
You have created a Cup & Handle screener and Head & Shoulder scanner based on P&F charting. In similar way, is it possible to create a falling channel scanner in P&F?
-
Hi Team,
Is there any scanner through which we can see stocks that have made a mutli year breakout? How many year breakout or how many months breakout?
-
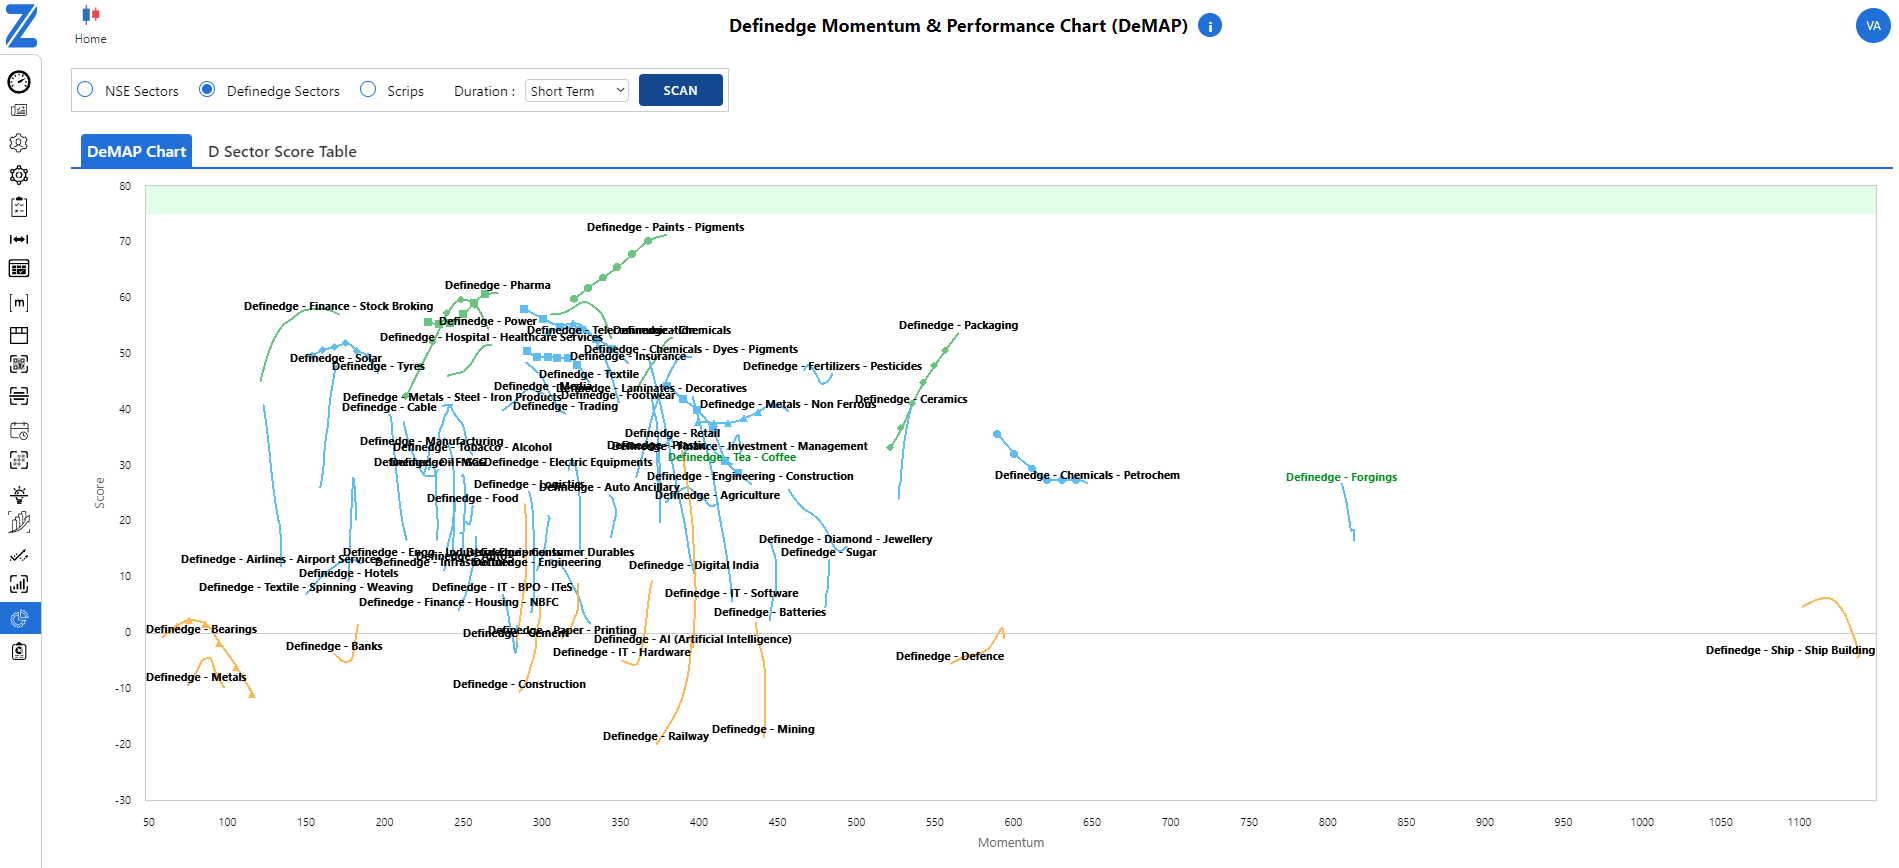
I see that some new feature has been added to D-Sector called DeMAP chart. Kindly guide us as to how to read this chart. Is it possible to make a brief video on this?
-
Hi Team,
At present, it seems Zone Mobile has more readymade scanners as compared to R Zone web. It gives flexibility to roam through various scanners, for P&F, Renko, Candlestick and even indicator based scanners. We're able to select the particular group to which to apply these scanners. It is very seamless and fast as compared R Zone web version. I know R Zone web also has some of the Ready Reports available, however, the number of ready reports is limited. Request you to make R Zone web also as robust and extensive as Zone Mobile. Yes, I understand that R Zone Web has many scanners, but it is not as easily accessible.
-
Thanks....this was helpful. Breadth chart in Rzone is quite exhaustive, but difficult to understand how to use it better. This will work as a guide.
-
@Neha Pandey Noted. Thanks!
-
Dear Team,
Would it be possible to give a timeline by which Tradingview charts will be ready for use by the subscribers? Will we be able to access the Groups / Watchlists of Zone on Tradingview also? Indicators of Zone will also be available on Tradingview?
-
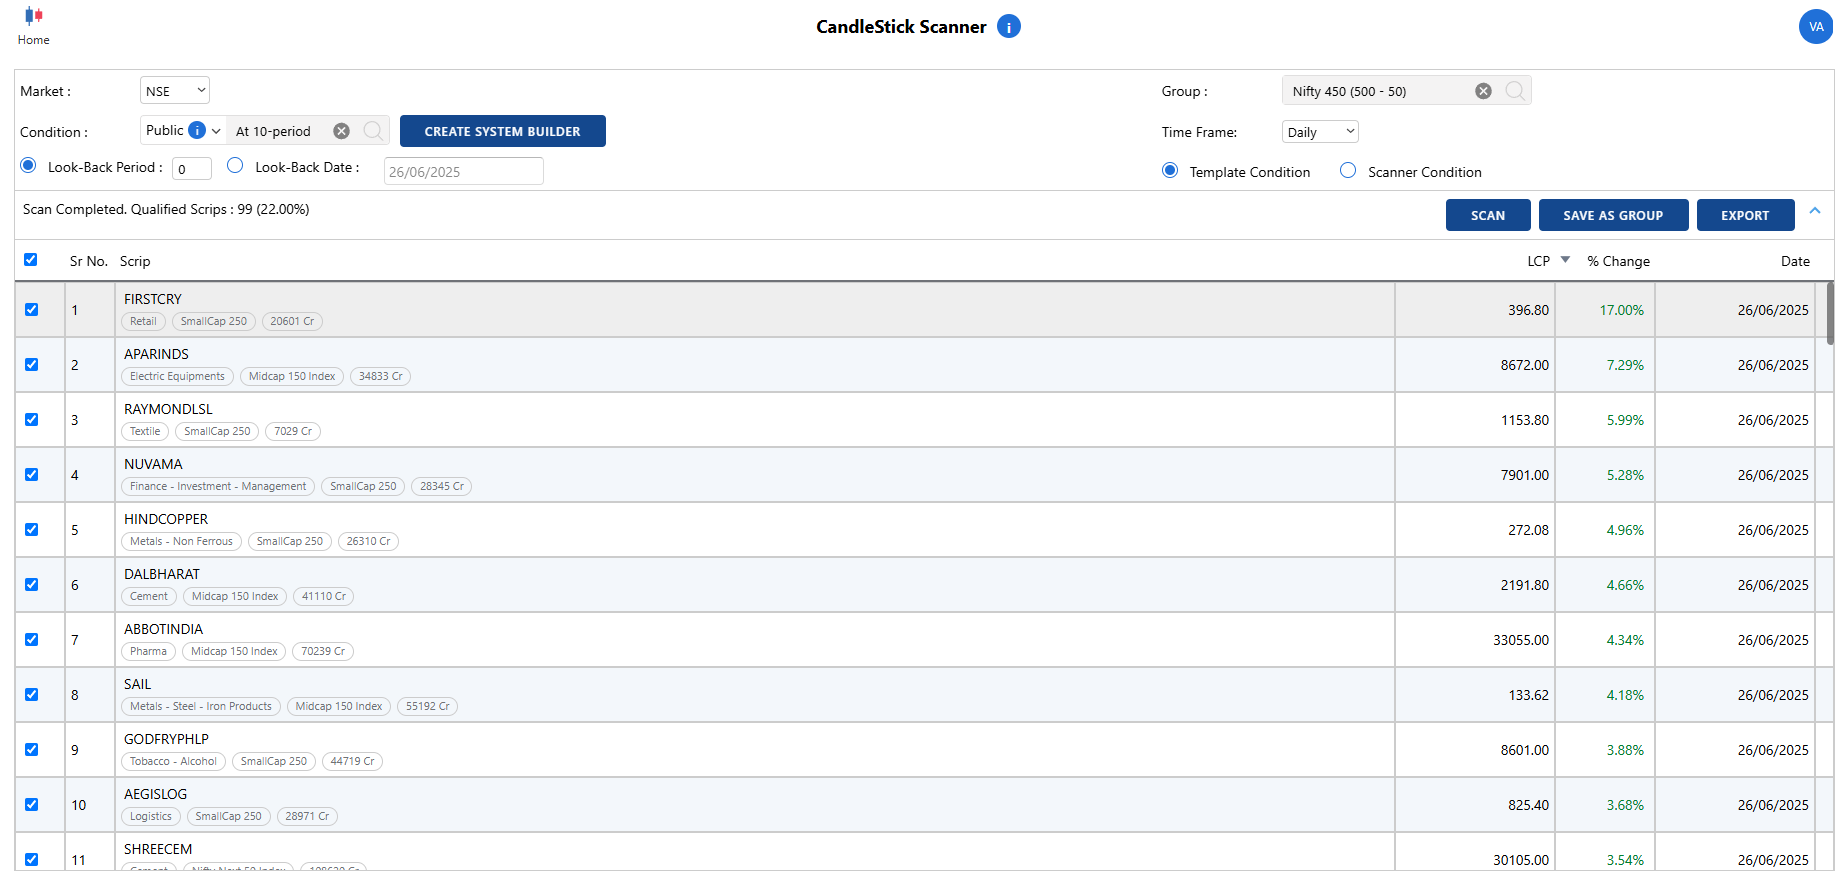
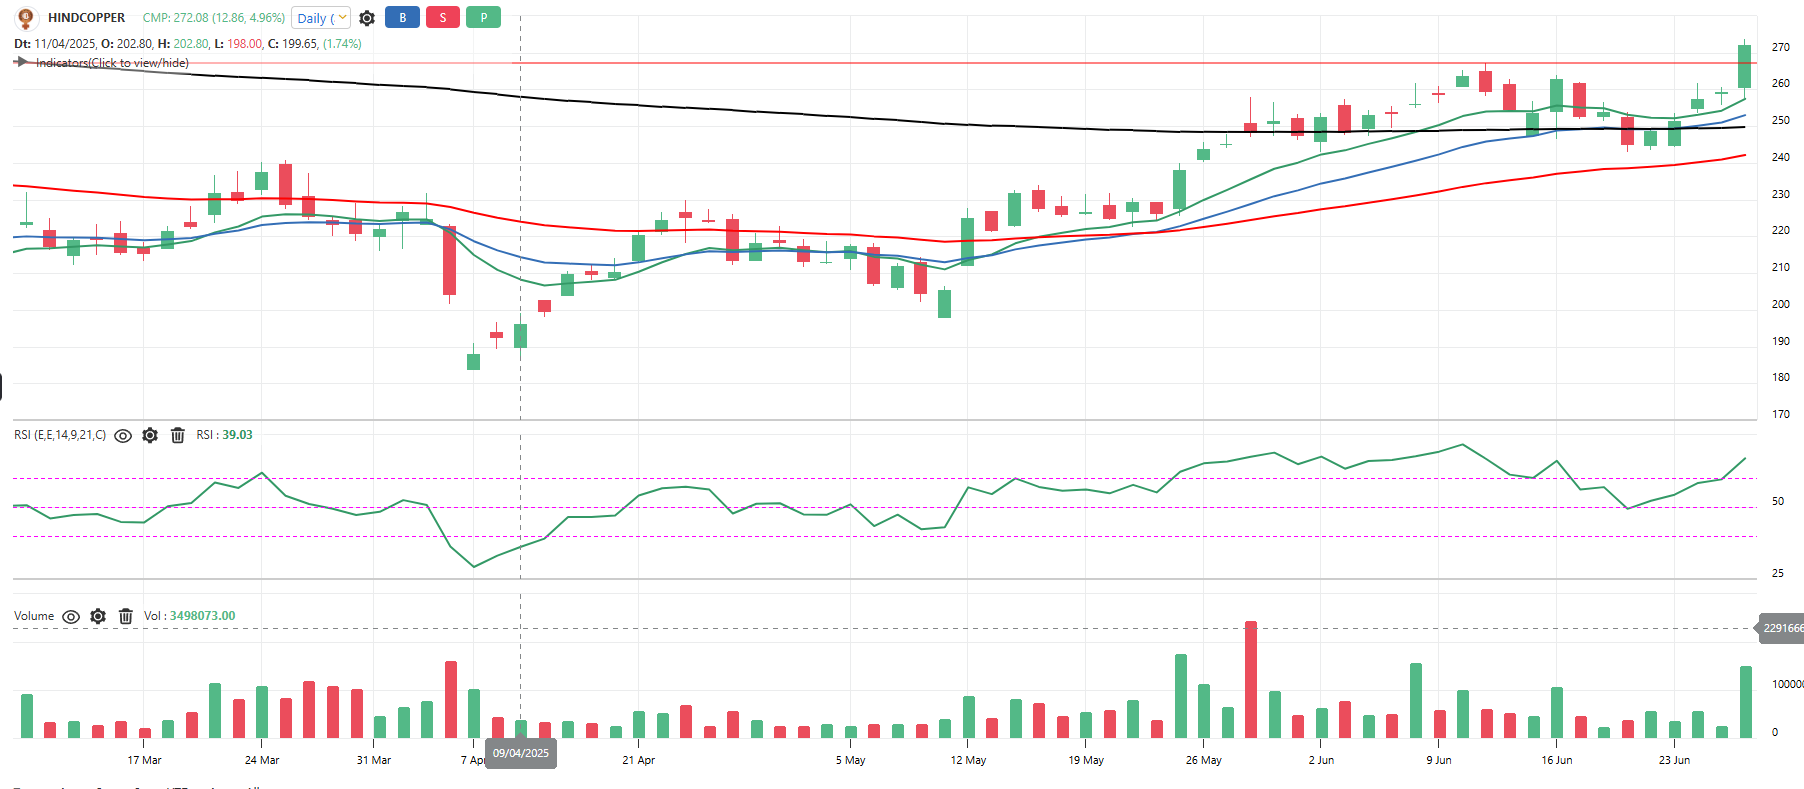
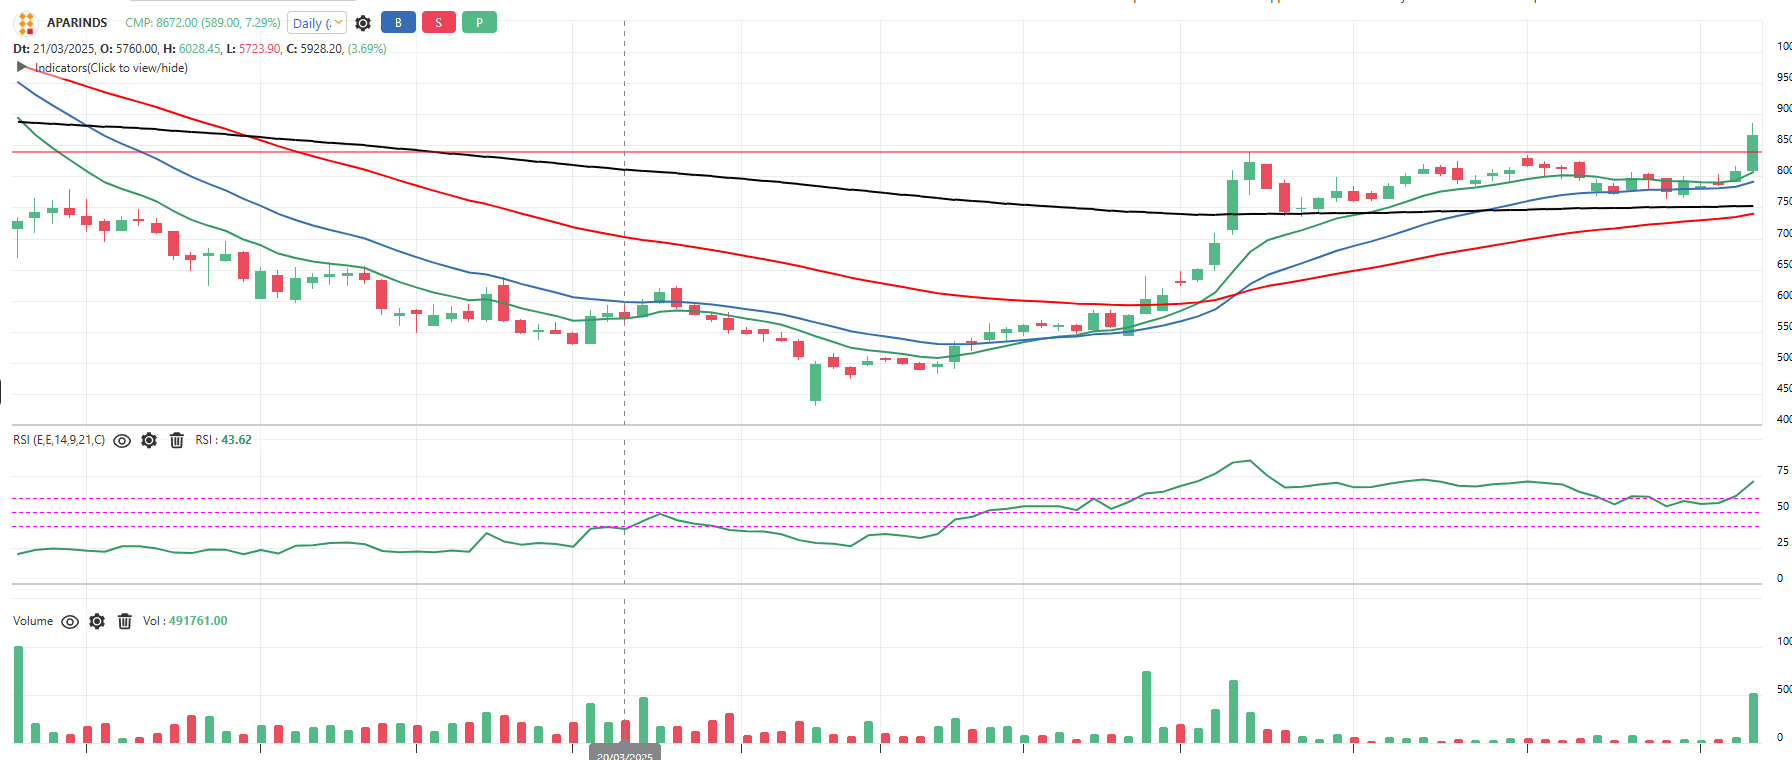
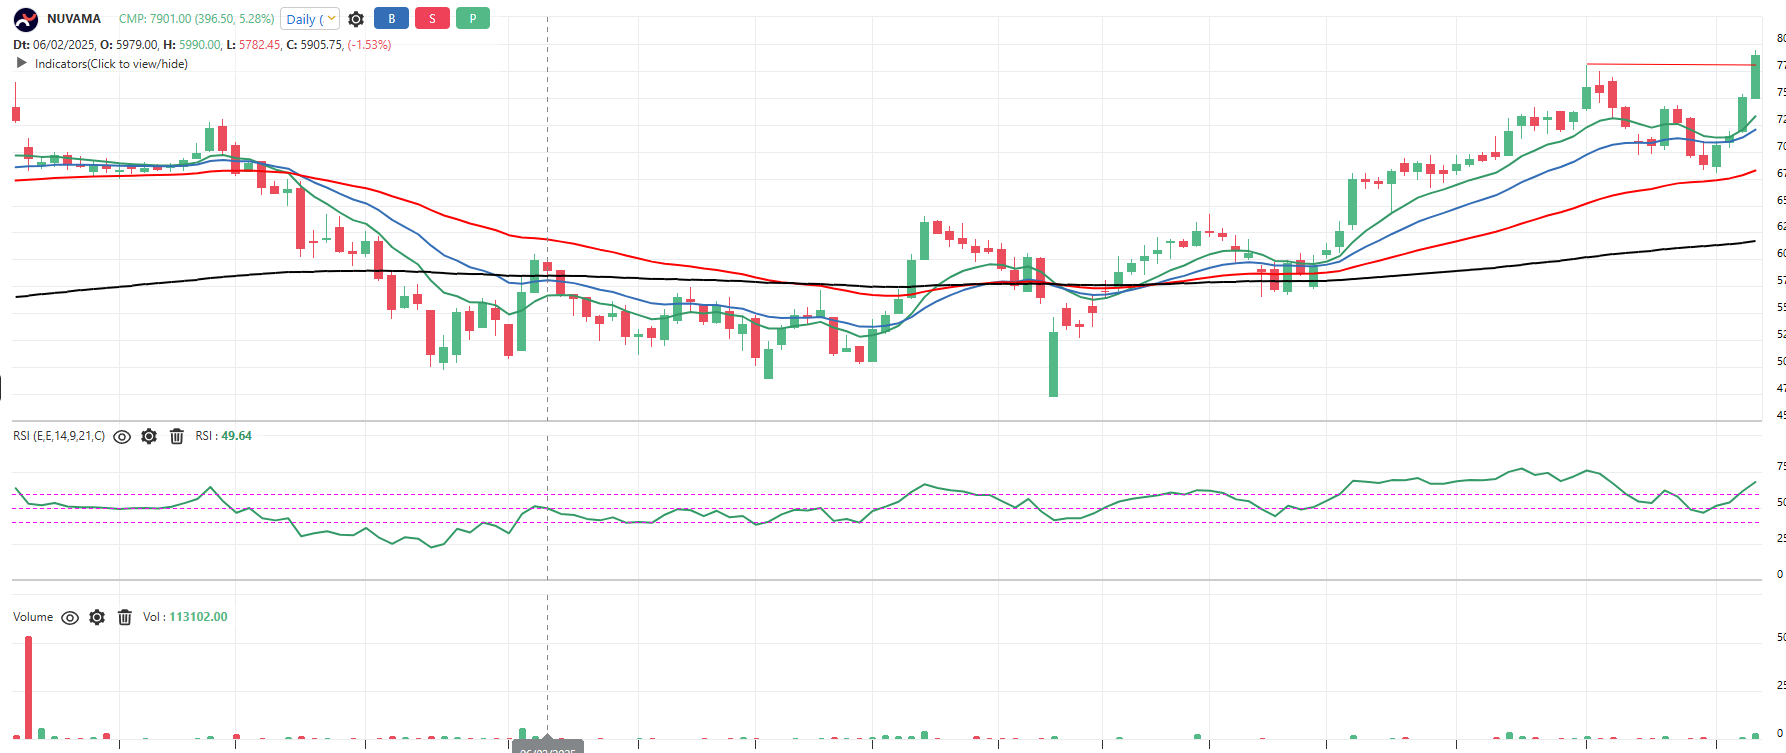
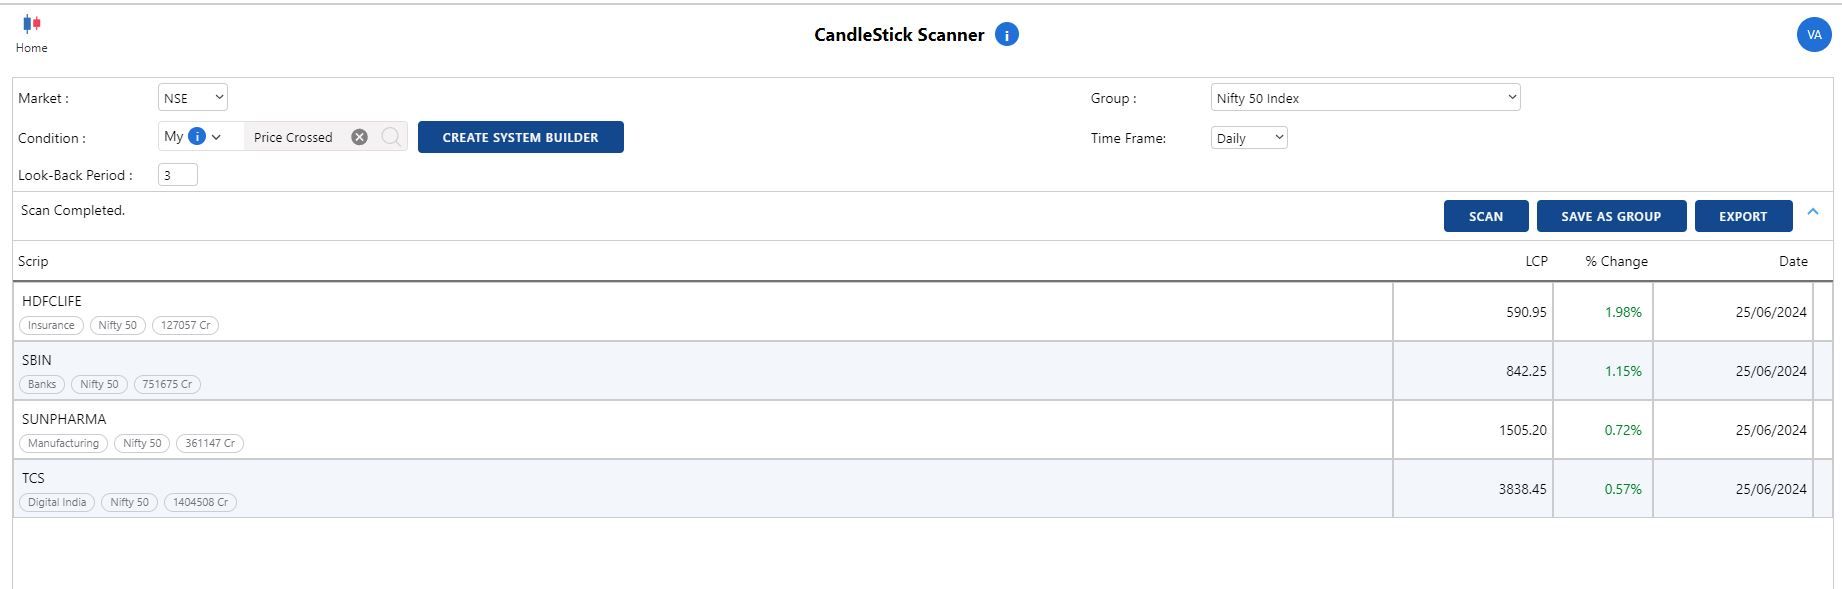
Here, I've tried to build the scanner
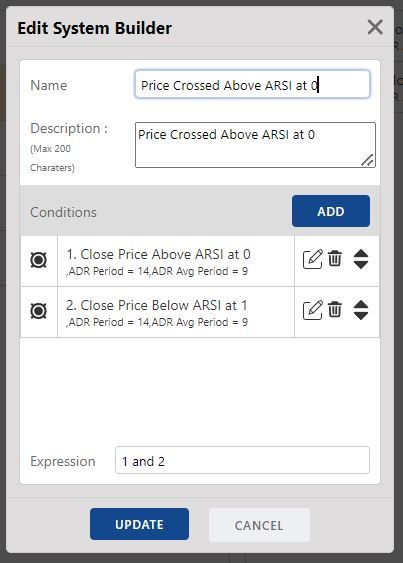
Results on Nifty 50 today
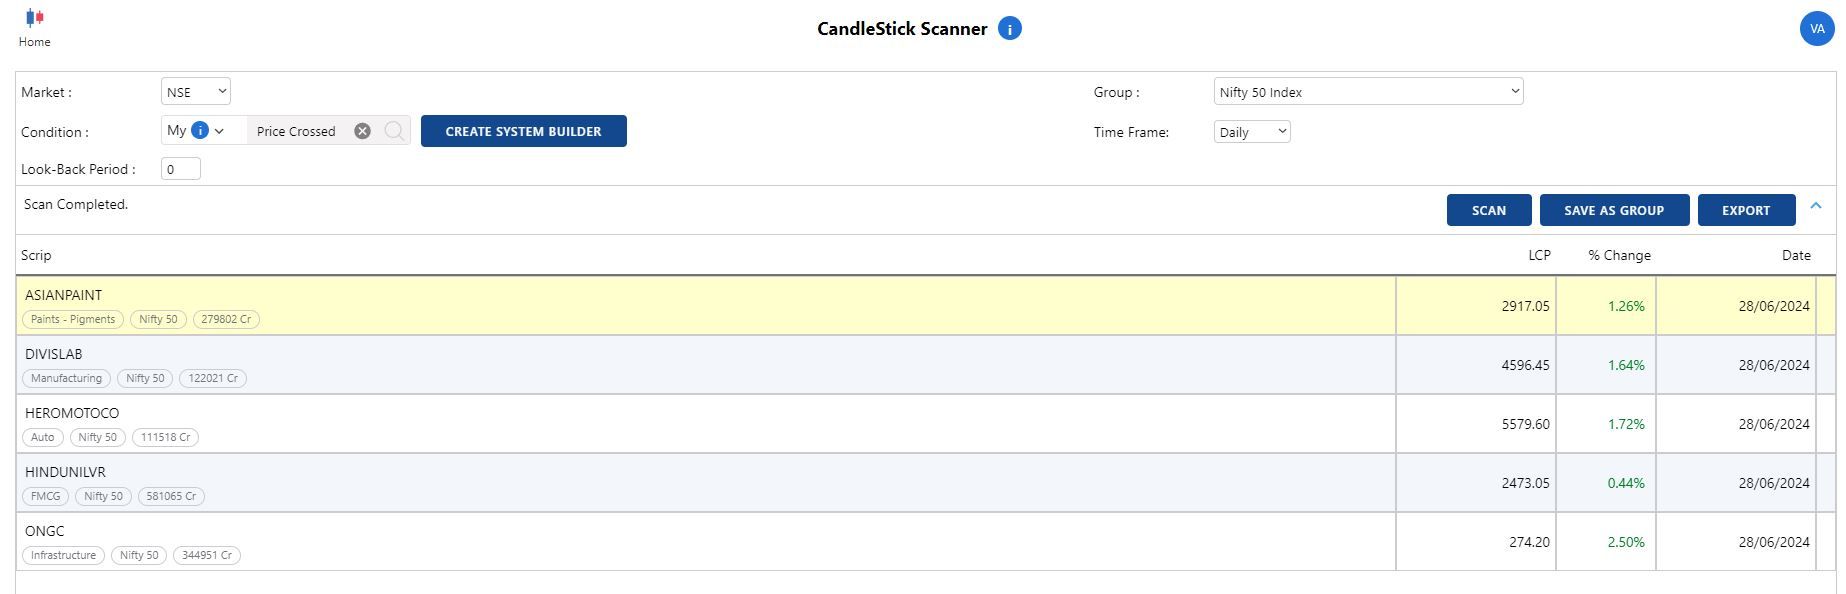
Results on Nifty 50 at Lookback Period of 3. You can change the lookback period to 1, 2, 3 etc to get the results for Price crossed above ARSI on that day.
-
How to access Public System Builder scans published by other users?
When I select Public condition in a Price scan, no scans are appearing. How do I access these scans? -
@Brijesh Bhatia Hi Brijesh Sir, yes, my query is solved, I am getting the desired results. Thank you
")
-
Sorry for commenting on this post but, in Rzone, where we have feature of RSI above value 60, it provides all stocks that are above value 60, but what I want is the stocks where RSI has crossed above 60 on this day or on '0' period. Which is what a 'Cross Above' feature would do...meaning it was below 60 yesterday, and today it has crossed above 60. Similar 'Cross Above' feature is also required in case of Moving Average, Supertrend, Upper Bollinger Band etc. Can a general 'Cross Above' feature be added to the scans?
-
@RUSHABH VORA Noted. I will try this scanner, thanks!
-
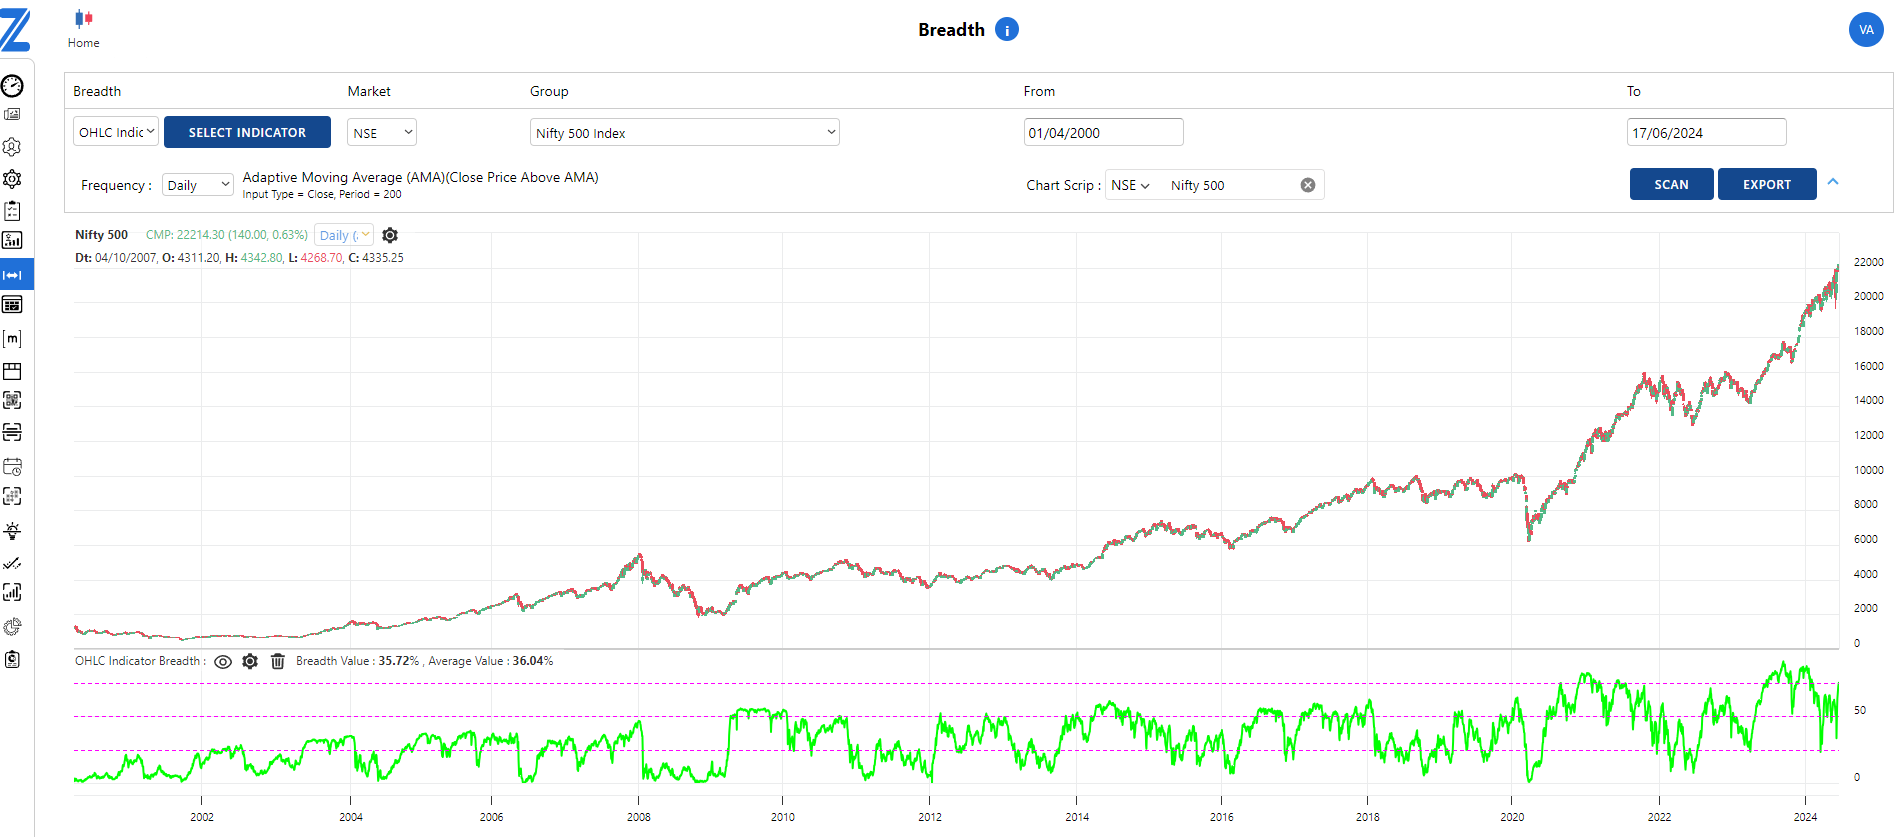
Dear Team,
Breadth Chart is a nice analysis tool, however, the standard 3 month look back period is too short for determining market stages. There is an option to manually select the date range, but if we select a longer period (I selected from 01/04/2000 to till date), entire period chart is shown in a single frame. So request you to provide a movable chart for ease of analysis instead of a static chart. For reference, Breadth Chart of Nifty 500 with OHLC indicator Close of AMA 200 is shown here.
-
Dear Team,
How do we find the stocks where there is a 45 Degree Trendline Breakout in P&F chart? What is the name of the price pattern in the scanner? Is it Descending Triangle Breakout? Or something else?
Regards
-
Yes, got it. Thank you @Santosh-Bahl and @Brijesh-Bhatia for this explanation.
-
How do I set a default chart template of Candlestick type chart? Whenever I use a scanner to identify stocks, and click on the stock name, it opens a basic chart with no indicators. But if I want to open the chart with my chosen indicators or a template, how do I set this up in Zone Web / R Zone? I have seen videos of Mr Kaushik Akiwatkar, where the stock chart opens with his selected template. Please help me with this.
-
Dear Team,
On the updates page, under coming soon section, there is a mention of partnership with Tradingview. Just want to check by when is this likely to be operational and the extent of this. Whether it is relating to charting, scanning, data related etc., if you can throw some light on it.
Regards
-
Dear Team,
Could you please do one video showing how to use the D Sector and especially D Sector & Breadth Matrix? Plus what is Relative Rotation Graphs? I understand that RRG charts also have these 4 quadrants but they show the movement of the sectors from one quadrant to another from time to time. For example, if we scan for long term, Nifty Auto is in the Strong Sector and Strong Participation. Is it possible to see how Nifty Auto has stayed over the last 1 year? If it was in this quadrant throughout the last 1 year, or it has shifted from one place to another in past 1 year? Does it provide clarity on which sector is potentially breaking out?
-
Dear Team,
In P&F and Renko charts provided in Zone web, if we want to see the dates, we need to see in the header where open and close prices are mentioned which makes analysis a little difficult. Here, X-Axis or Horizontal Axis actually represents the time, or the date on which the column or box occurred. Hence, request you to add 'Date' in the X axis so as to easily understand the chart, and we don't have to keep looking for dates on the top column which is not easy for visualization.
-
Thanks for this. What are the other methods for this using candlestick? Can we use this scanner and then trade stocks based on candlestick? Also, since it doesn't consider returns in a period, it means we can get stocks at good entry points instead of stocks that may have already run a lot?
-
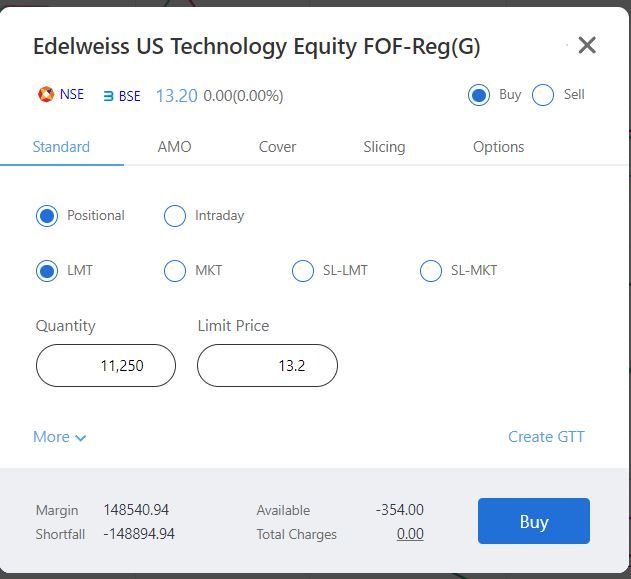
The chart shows price at around Rs. 22 whereas while making a buy order, the price is showing at Rs 13. Order window is automatically taking units as 11,250.
-
May be try to reduce the zoom size a little bit, it is just below the Candlestick & P&F Bull Pull Scanner.
-
Hi,
So there are multiple screeners in RZone with their own unique features. There are some reports like Breadth Chart, Seasonality and D Sector which can give broad idea about indices and sectors. I get lost in the multiple screeners. So is it possible to create a Personal Dashboard where we can keep our favorite screeners and reports, and no need to freshly run these scanners again. Sort of like what Ready Reports offers, but a user can define what all he wants to see in his Dashboard. It could be Advance / Decline chart of Nifty 500, Breadth Chart (OHLC indicator) of Nifty 500, Ultimate P& matrix results of select universe etc. Rzone is feature rich but I can't use it to its full potential because I need to keep searching for what I want to search for. If I can get my favorite screener results in one place, in one page, without having to run the scanner....it would be of great value. For example > Chartink has Atlas Dashboard. It can be personally customized as much as you want.
-
Yes plus there are some features which are there on Tradepoint but not in Rzone like Total Open Interest, which is available in Tradepoint and Opstra, but not in Rzone/Zoneweb. But Prashant ji has mentioned that they will bring in the TOI in Zone too.
Plus I saw in Coming Soon tab of Product Updates that Definedge has partnered with Tradingview. I don't know by when this partnership will be effective and to what extent, but this seems exciting to me.
-
@Ashok Prasun Yes, I am using Chartink already for that. Was just checking if possible to do in Rzone too. Multiple time frame system builder is an option, but still not as simple as Chartink.
-
-
Can we have a +/- button in the chart to zoom in and zoom out of the chart? Presently, I am aware that the keyboard buttons of + and - can be used to zoom in and out, however, if a button is provided at the bottom of the screen so we can press it through the use of mouse, which could be useful.
-
Automatic Zoom ins. When we open a new chart, it automatically is zoomed in to reflect 41 candles on the daily chart including the current candle. If we adjust the chart to our use, let's say which shows 105 candles and thereafter we open another stock's chart, then again it will open with 41 candles only. This makes quick review of the charts difficult. Hence, request your assistance in making charts more dynamic for a quick glance.
-
No space on right side. The latest candle is on the right most side of the chart, which is correct but there is no space after the latest candle. Request allowing scrolling to the right even after the latest candle has been plotted.
-
Change %. Change % of every candle should be reflected on the information bar where Open, High, Low, Close details are given. Suppose my cursor is on a candle of 12th December 2023, then I require the details of open, high, low, close and even change % of 12 December 2023.
-
-
Hi, my trading set-ups are based on indicator values. There is Indicator Value table and Multi Indicator Value table in RZone, however, I want a Multi Time Frame Indicator Value Table. For example, a Bullish Template will look a little like this:-
RSI Above 60 in Weekly
RSI Above 60 in Daily
RSI Above 40 in Hourly
Price above 20 SMA in Weekly
Price above 20 SMA in Daily
Price above 20 SMA in HourlyAnd a bearish Template will look a little like this:-
RSI Below 40 in Weekly
RSI Below 40 in Daily
RSI Below 60 in Hourly
Price below 20 SMA in Weekly
Price below 20 SMA in Daily
Price below 20 SMA in HourlyCan you please look into this possibility?
-
Hi I have the same query. Commentary box on RHS seems easy to grasp especially in Pnf charts. In the daily Market Update video by Raju sir, the same is visible in Tradepoint desktop, but how to apply this setting on Zone Web?
-
Hi can you please check if Change % is possible to add in the line where values for Open, High, Low and Close are given?
-
Dear Team,
As per my understanding, if the Stock Option is In the Money, it needs to be physically settled. However, if one has adopted an Options Strategy, let's say Bull Call Spread, where one Call has been bought and another Call has been sold, in that case, how does the settlement take place? If one of the Call is ITM and another is OTM, only ITM call will have to be settled? Can you recommend a good material / video where these details of how the options / futures legs will be settled are provided?
-
Hi team,
could you please update on this request? -
Hi, can we get recording of this webinar, as self will be in office at this time.
-
- In candlestick charts, when the cursor is on a particular candle, we can see the open, high, low and close of the candle. How do we enable Change% in this view?
- Can Financial Indicators like Quarterly EPS / Quarterly PAT / PE Ratio / Price to Book Value be plotted on the weekly or monthly candlestick chart?
- Is there a RSI Divergence scanner in Rzone?
-
Whenever we move the cursor near to one candle, we can see what was the O, H, L and C of that particular candle, however, we are not able to see change% of that candle. Request you to let me know how to activate the Change% in the Chart statistics.
ZONE WEB
Tradingview Integration
Radar - DCF & Reverse DCF Tool - How to use it?
Tradingview Integration
Tradingview Integration
Swing breakout pattern in candlestick chart.
Indicator Digger - RSI - Intraday Timeframe
Tradingview Integration
Hello, where can we find historical option charts?
Bollinger Band
Candlestick Chart period setting choice
Please add Date in the X axis of P&F and Renko Charts
Need a MKLH video from Raju sir and AP sir
Chart Period Settings
Zone Web PNF Charts on 1 Min Timeframe
Zone Web PNF Charts on 1 Min Timeframe
Query : values showed on chart
Zone Web Dashboard with Chart and Fundamentals in one place
Rzone Pro and Zone Web Pro
Chart Period Settings
Auto Count for Candlestick Chart
Relative Strength Alpha Indicator on PNF & Renko Charts
Why the sudden jump in Definedge Airlines - Airport Services Price?
PnF 1 Reverse Chart - Auto 45 Lines working but 45 Extended Line not working
Tradingview Integration
Mutli Year Breakout Today Scanner
Falling Channel Breakout Scanner
Mutli Year Breakout Today Scanner
DeMAP Chart
Rzone and Zone Mobile
Sector Momentum Analysis
How to access Public System Builder scans published by other users?
Tradingview Integration
how to create system builder for identifying
How to access Public System Builder scans published by other users?
I want to Scan candlestick chart when RSI(14) Crossover & Crossunder any certain number
I want to Scan candlestick chart when RSI(14) Crossover & Crossunder any certain number
P&F Price Scanner - 45 Degree Trendline Breakout
Breadth Chart
P&F Price Scanner - 45 Degree Trendline Breakout
How to set a Default Chart Template in Zone Web / R Zone?
How to set a Default Chart Template in Zone Web / R Zone?
Tradingview Integration
D Sector & Breadth Matrix
Please add Date in the X axis of P&F and Renko Charts
Top-down approach: Effective Sector analysis and Stock analysis using RZone & TradePoint
Edelweiss US Technology Fund Price Discrepancy
Smart scanners list not showing momentum scanner
Personal Dashboard
Futility of using two softwares "Rzone" and "Trade point desktop"
Indicator Value Table
Candlestick Charts
Indicator Value Table
zone web screen set up
Change % in Candlestick Charts
Options Query
Chart Related Suggestions
Friday Webinar
Chart Related Suggestions
Change % in Candlestick Charts