Q&A Thread: Donchian Channel
-
@RAGUNATH_AG Correct. Check 3rd point.
-
@Ravi Shinde Correct. Check 3rd point.
-
-
Converging pattern. Price or time consolidation pattern.
-
Price consolidation pattern.
-
Big Range candle. It is interesting to note that this pattern is not possible on P&F or Renko charts with Donchian channels.
-
20-brick high and 20-brick low. Not a 20-period high - low. A single brick can have multiple sessions or multiple sessions can have a single brick.
-
-
Think:
-
Can we use the 240-period Donchian channel to scan stocks for a 240-day high?
-
What is the bullish and bearish zone in the Donchian channel?
-
If we look for an upper band Donchian channel breakout on the Renko chart, is it similar to a multi-brick high pattern?
-
-
- Yes
- Above the Middle band below the upper band called bullish zone vice versa.
- Yes
-
- No, it will be around 50 wk high as it would consider trading days only excluding holidays
- Bullish is over upper band and bearish below lower band
3.yes, as we are using in DON 28 brick high
-
- no, 240 PERIOD means 240 bricks
- Price is in bullish zone if Both Bands are Rising and Price remains above the middle band. Exact Opposite for Bearish Zone.
- Upper Band Breakout will not be exactly similar to a Multi brick High more of a bear trap. For multi brick high precondition is flat bands.
-
- No. The price can be anywhere between the upper and lower bands. Not necessarily showing 240 day high at the last candle.
- Price is bullish if it is above middle band and vice versa.
- No as it will be a breakout above mentioned no of bricks which can be below previous top.
-
Q - What does it mean when the upper band is falling and the lower band is rising on the candlestick chart?
A - Low RisingQ - What does it mean when the distance between the Donchian channel bands is reduced on the Renko chart?
A - Range ContractionQ - What does it mean when Donchian channel bands are expanding on candlestick charts?
A - Range ExpansionQ - 20-period on the candlestick chart means 20-day high. What does it show when we plot the 20-period Donchian channel on the Renko chart?
A - Does not make any difference as RENKO has nothing to do with time; price is only the factor where the Brick is painted. -
One question regarding the parameter of DON 28; why 28 was chosen and when is the option or the asset more effective;
a) price range break from FLAT DONCHAIN Bands?
b) price falling and then after that when we see the upper band rising and then the breakout of that in price?
c) trending price and then we see the breakout of the Upper Band?
d) A new low is marked in price and the upper band is flat and then we see the price breaking the upper band?If the logic behind and concept is made clear then I guess taking trades would be more effective as option pricing is more dicey and not like any other asset.
kindly share your experience in trading with the Donchain (DON Strategy) and your input on which scenario is much better to trade.
RST666
-
@RAGUNATH_AG Wonderful
-
Very nice.
- That's why I said 240-period. Trading holidays are fine. You can use 260 period Donchian channel. If you want to scan stocks at 52-week high, you can plot 52-period Donchian channel on Weekly candlestick chart. Stock is making a 52-week high when the 52-period Donchian channel is rising on the weekly chart.
-
- My question was on candlestick chart. Sorry, I did not mention it.
- Nice. Breakout after flat bands can be a multi-brick pattern breakout, right?
-
- Right. When 240-period Donchian channel is rising, that means price is making 240-period high. So, Donchian channels cannel can be used for identifying stocks for that condition.
- Right, breakout can be below previous top, but when upper band starts rising after flat bands, it is a kind of multi-brick formation.
-
Answers:
- Can we use the 240-period Donchian channel to scan stocks for a 240-day high?
Yes. When the upper band rises, the stock is making a 240-day high.
- What is the bullish and bearish zone in the Donchian channel?
Price above the middle band is a bullish zone and price below the middle band is a bearish zone. If it’s a 20-day Donchian channel, the middle band is the average of high and low of the last 20 bars. It is like a moving average.
When price is between a moving average and a 20-day high, it’s a bullish zone. When price is between a moving average and a 20-day low, it’s a bearish zone. It is my theory and I think it is logical.
- If we look for an upper band Donchian channel breakout on the Renko chart, is it similar to a multi-brick high pattern?
Yes, it is. When a 20-brick Donchian channel is rising for the first time, it is like a multi-brick breakout pattern. Bricks may not be at a similar level, and it is not necessarily a 20-brick pattern always but it is a multi-brick breakout pattern when a Donchian channel rises for the first time after being flat.
-
@Rahulsinh G. Thakore
Great.- Low rising and high is falling.
- There is a significant difference. Price is at a 20-brick high, not 20-day high.
-
Let’s not focus only on that strategy otherwise this will become a discussion about strategy.
However, understand that Donchian channels are very useful on Renko chart. The whole logic and dynamics of the indicator changes when we plot it on the Renko chart.
Renko bricks divide price into fixed size boxes (bricks). 20-brick high shows that price is at high of last fixed size 20 boxes. 20 is taken for example. It can be 28 or 40 or any other number.
Answer to your queries:
a) price range break from FLAT DONCHAIN Bands?
Breakout after flat Donchian bands shows Price Consolidation Pattern breakout. Remember, there is no time involved in the Renko charts, hence it is a price consolidation breakout pattern. This element makes the pattern completely different from that plotted on the candlestick charts.
b) price falling and then after that when we see the upper band rising and then the breakout of that in price?
Yes. It shows new bullish range breakout. It is like a bullish reversal breakout.
c) trending price and then we see the breakout of the Upper Band?
Good question. It is a continuation breakout. Price is in an uptrend, new highs are being formed and there is another breakout after a shallow retracement.
d) A new low is marked in price and the upper band is flat and then we see the price breaking the upper band?
The pattern is similar to a bear trap or a bullish reversal pattern.
You can read reversal and continuation patterns on the Renko chart when you follow the Donchian channel breakout pattern.
-
Now when you know and read about the Donchain channel indicator. Check Donchian channel indicator columns in the Indicator digger.
Observe, Band difference, Middle Band Change percentage, Trend of bands and Price position columns.
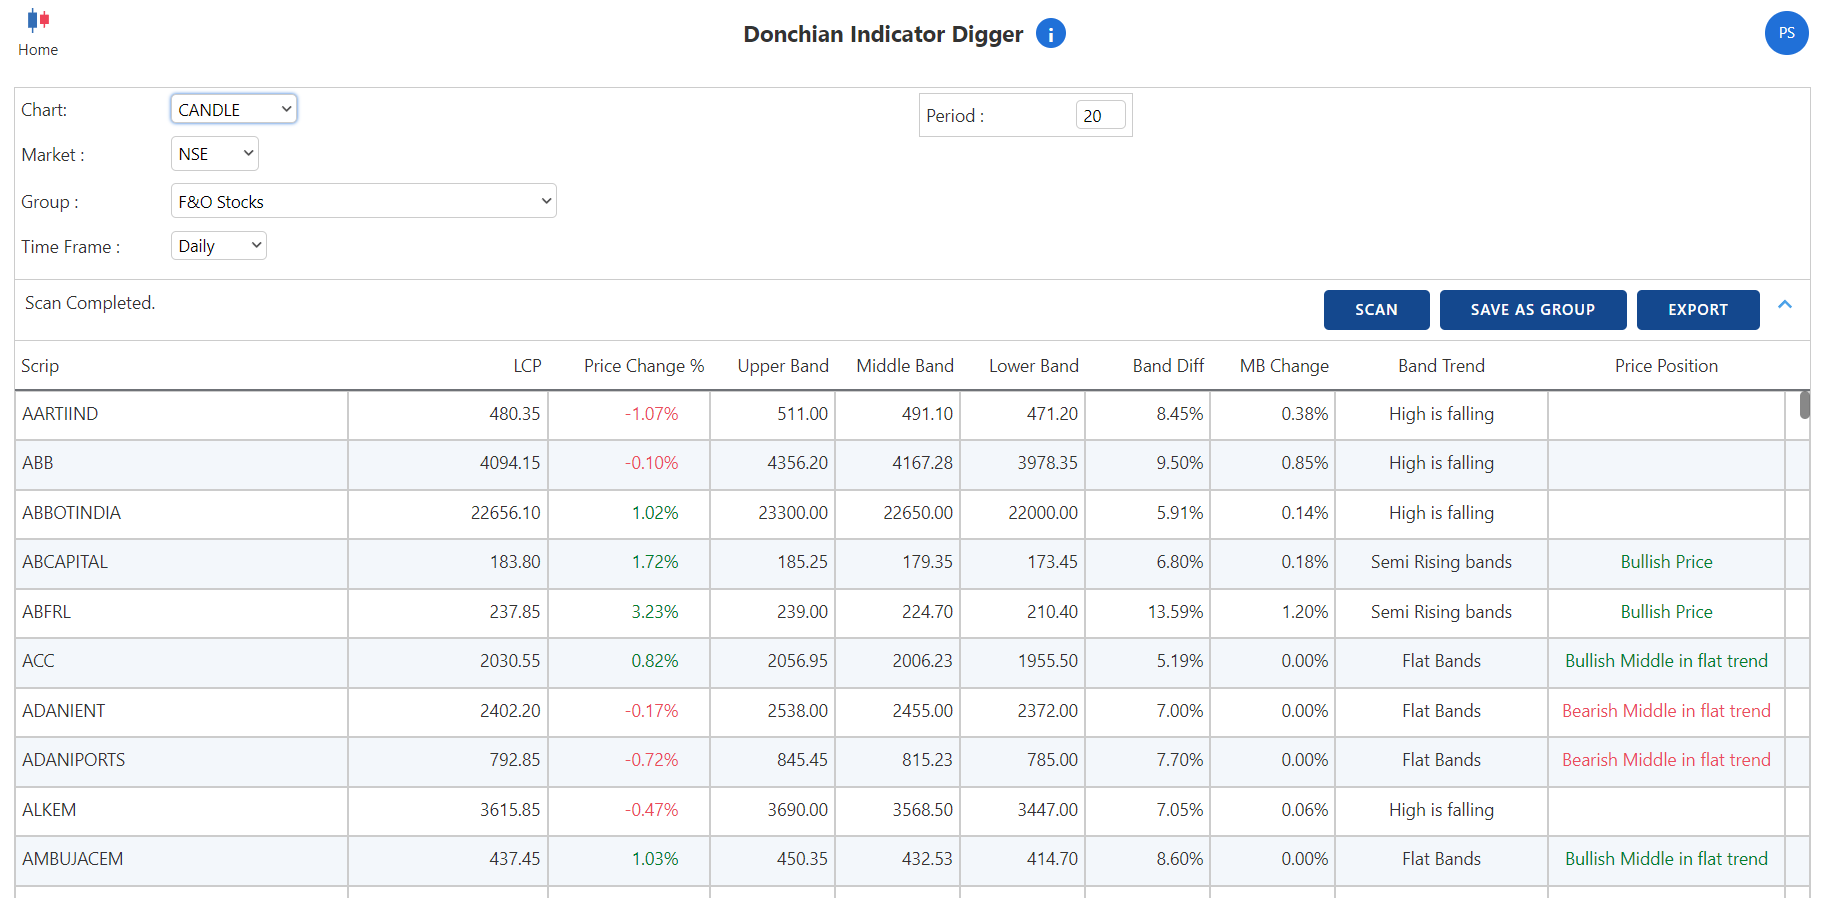
When band difference is high, the range is far. When band difference is low, it is a tight range scenario. When the middle band is rising, the trend is strong.
-
thanks for enlightening me on the indicator and good explanation, I will follow this and dig deep into it.
god bless you -
@Rahulsinh G. Thakore Thanks. I am going to add some more points in this thread.