This could be the case for few more of the scrips in this scan
How do we go about this sir ?
Pro User
This could be the case for few more of the scrips in this scan
How do we go about this sir ?
@Brijesh-Bhatia I have a query / Zydus I checked the chart and its actually been a buy since quite long w/o an exit. Current entry in buy list is just on the basis of RSI moving up from below 55.
Any way we can eliminate this recurrance as even Donchain has not given an exit and neither RSI. Original entry was at 559 odds and no exit since then.
Stocks for 3rd Oct Weekly buy on Laidback scan
Can @Brijesh-Bhatia check exits pls and post a list
Sunpharma shows up / the low of the stock is the lower band on Donchain
Thats an exit ?
Also RTNINDIA comes into exit but I see the RSI is above 50 and Donchain has not been touched at all - can u see where the prob is in the result pls.
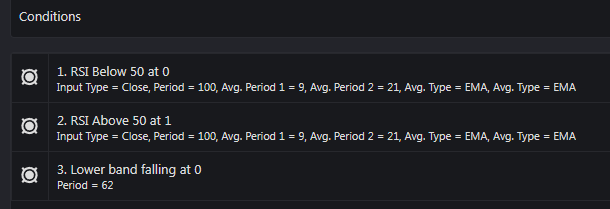
Am using this as exit criteria but few stocks are having RSI abvoe 50 still showing exits.
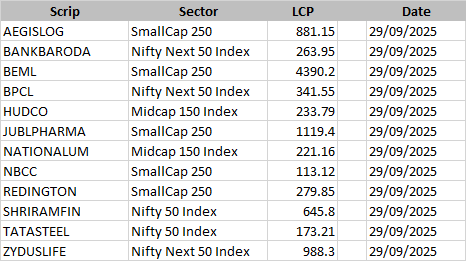
Scrips for Buy Criteria scanned on 28-09-2025
https://www.youtube.com/watch?v=opYHnfDP6l8
This is the Laidback Strategy as discussed 1st in 2022.
Yes, thank you.
HDFCBANK 0.25X3X1min chart - Stock has not followed through after 2nd TBS - which is one good thing, then made a positive pattern DTB and now at/near to resistance of 45 deg TL - cmp 1421F, TL at 1430F
Any move above 1430F would enable to stock to move to horizontal resistance and upper 45 deg TL resistance between 1480-1490 Futs levels
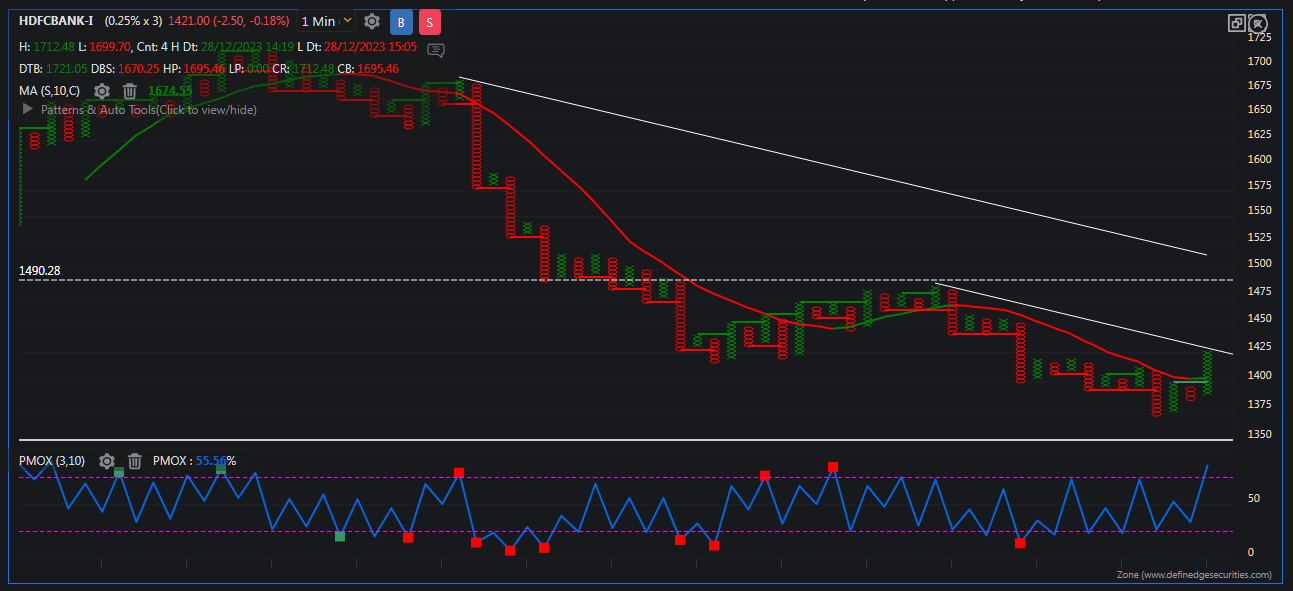
One can also look on EOD charts with Fib ratio retracement, if i remember correctly 23.8% is at 1468F and 38% at 1514F
So in general its confluence of values as KK @Krishna-Kumar says all roads lead to rome --- keeping that in mind, play to buy the dips or trail along till tgts hit or stomach full ....
I am using Win 7.
The last time Desktop TP updated itself, I could not use it because it wanted NET Framework to upgrade to some version which will instal only on Win 10 and not lower
How do I work around this and get Desktop TP installed, up and running
Please help
(reason to post on forum is that other users can use help from here leter in case thing works out and not need to pester/disturn the team time and again)
If there is a post here earlier, re the same issue, kindly point me to the same.
Thanks
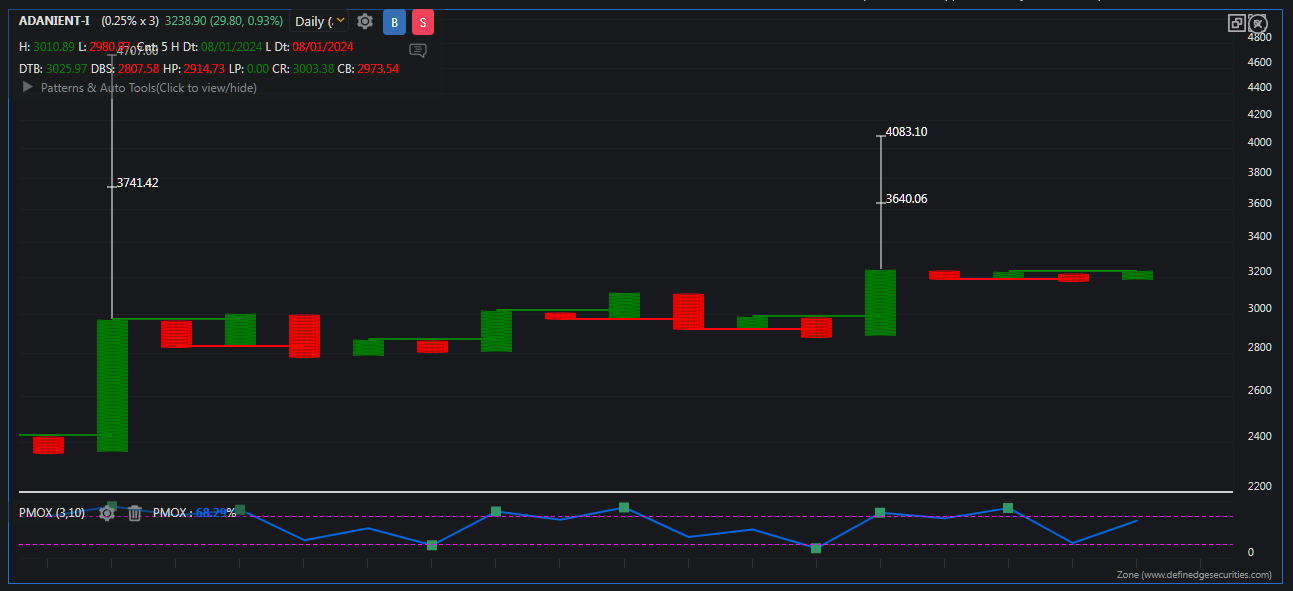
Adani Enterprises on EOD 0.25x3 has now broken out and the pattern looks good for a powerful move to ensue imo
Here have a look
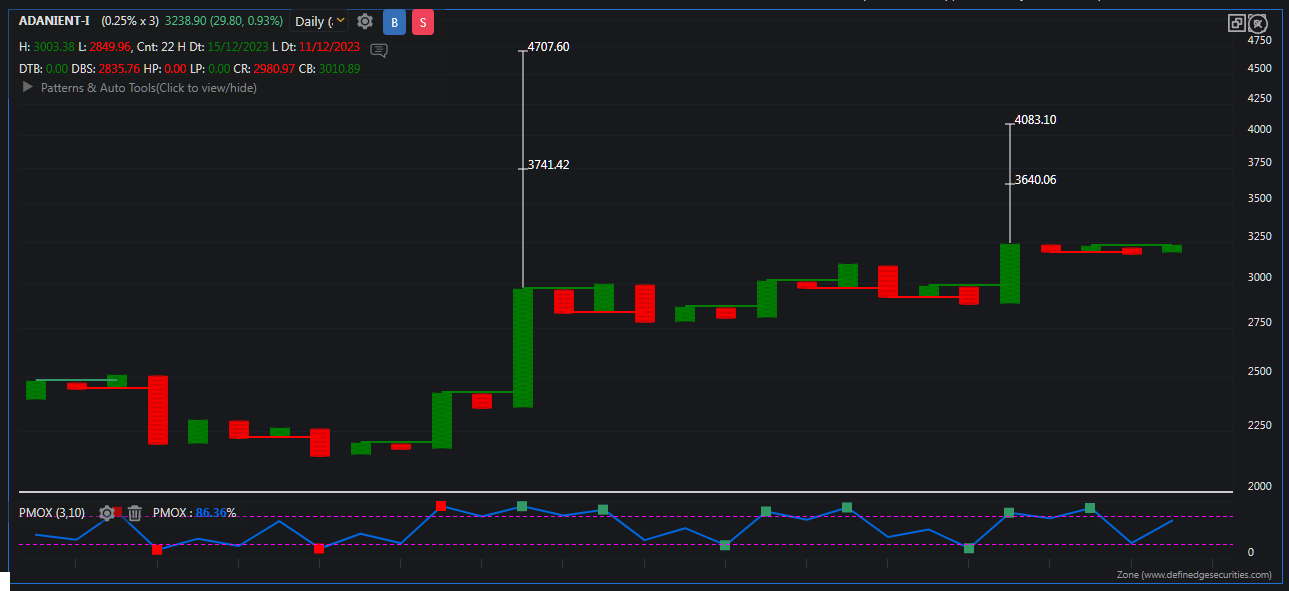
One can plan longs with affordable stops in Cash Delivery or if one has the capacity for leverage then in Futs as per own risk factor
Dear Team
In the image below see that the vertical counts cannot be seen due to the opacity of the Scrip Details Block, that Block is needed but sometimes it hurts, not just the VC, sometimes prev swing high levels are hidden, specially in option charts the starting points of the chart are hidden behind this block.
To overcome, we have to compress the chart to have a look, as done in below chart
.
But, its not possible to have a good/favourable view in ALL charts we browse thru everyday.
Is it possible to HIDE this block as and when needed to just have a clear look, like how we can hit some indicators/patterns etc by just clicking on the EYE SYMBOL of that particular indicator/pattern.
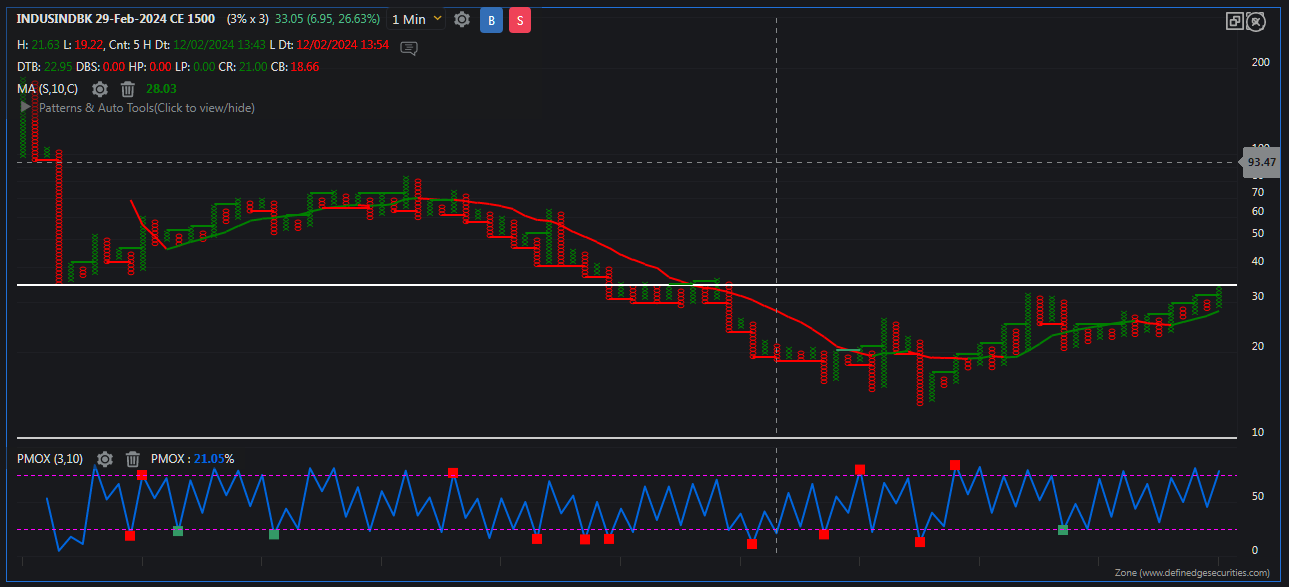
Looking at the 1500CE, as suggested above to buy at 30/32 is now at 34/35 - one can go long above 36 (confirmed breakout) for tgts 48 and 75-82 and maybe even higher than 100
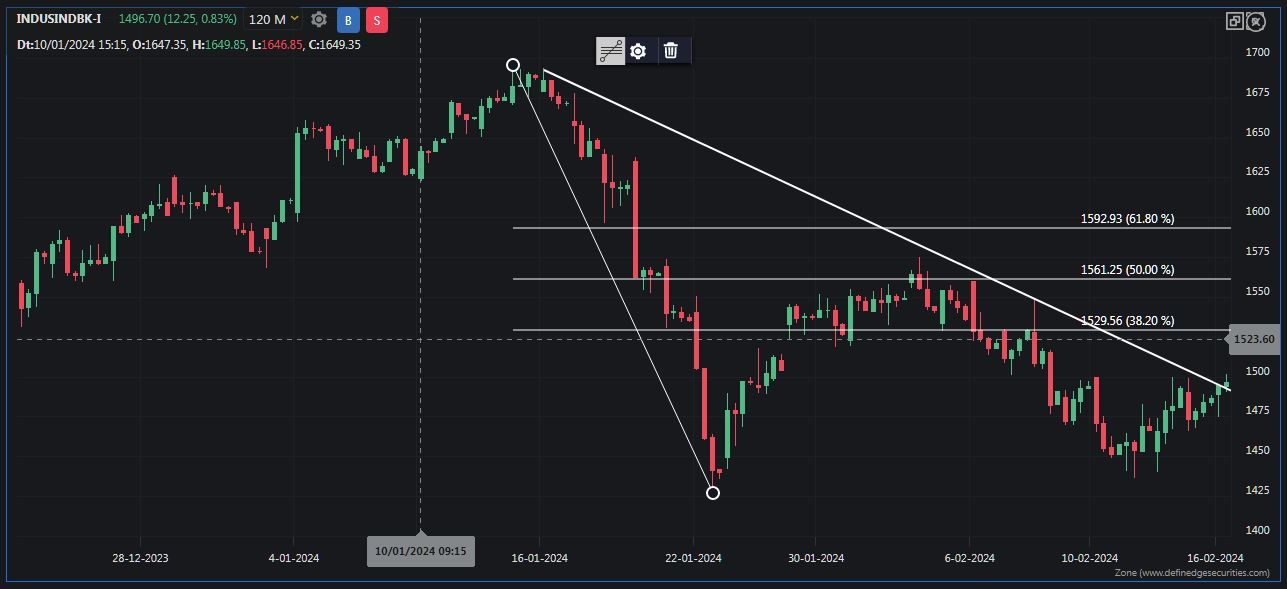
IndusInd Bank- cash chart - Bullish Dragon Breakout - expected 130 rs move, currently at 23.xx% retracement level acting as resistance, can take trading positions via CE 1500 at 30/32 odds now