• Recent
  • Categories
  • 0 Unread 0
  • Popular
  • Tags
  • More
    • Guidelines
    • Disclaimer
  • Users
Skins
  • Light
  • Default
  • Cerulean
  • Cosmo
  • Flatly
  • Journal
  • Litera
  • Lumen
  • Lux
  • Materia
  • Minty
  • Morph
  • Pulse
  • Quartz
  • Sandstone
  • Simplex
  • Sketchy
  • Spacelab
  • United
  • Yeti
  • Zephyr
  • Dark
  • Cyborg
  • Darkly
  • Slate
  • Solar
  • Superhero
  • Vapor
Collapse
Definedge Forum Logo

Power Portfolio RS & Price Analysis

Scheduled Pinned Locked Moved Knowledge Sharing
5 Posts 2 Posters 177 Views
    • Oldest to Newest
    • Newest to Oldest
    • Most Votes
Reply
  • Reply as topic
Log in to reply
This topic has been deleted. Only users with topic management privileges can see it.
  • N Offline
    N Offline
    Nishshkumar Jaani,CFTe

    Pro User

    wrote on last edited by
    #1

    Power Portfolio RS & Price Analysis

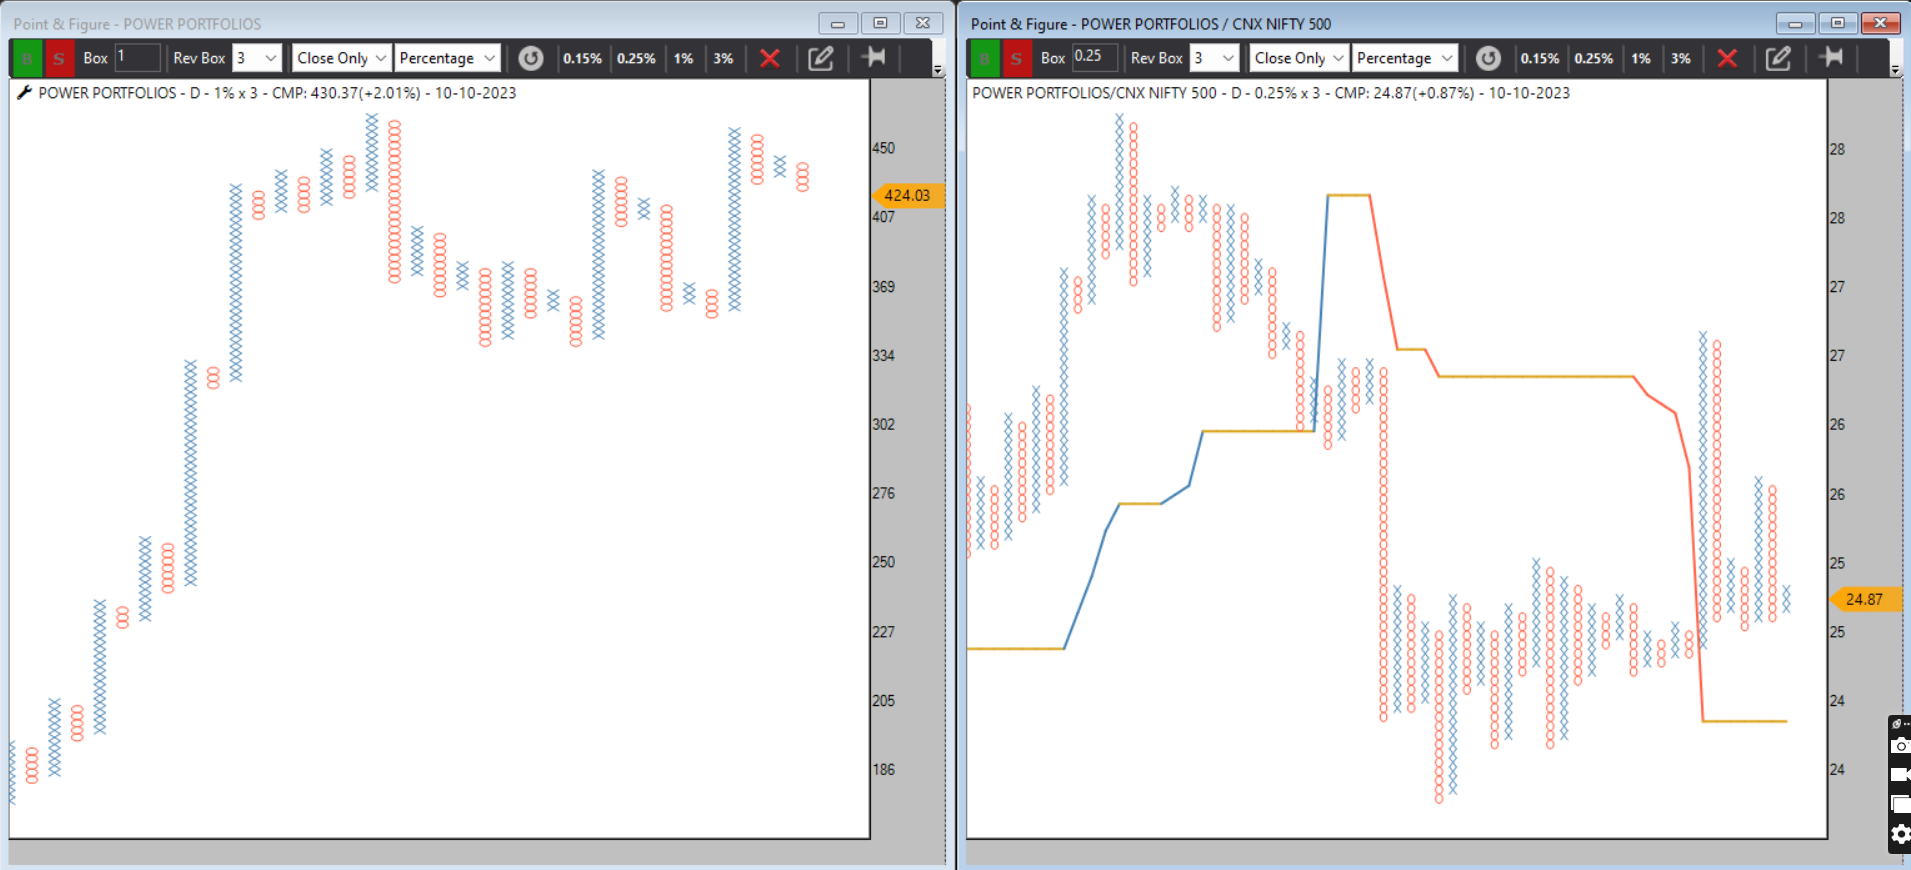
    Left side chart is of Price chart which is in Double Bottom sell after anchor column so probably forming bullish ABC

    Right side chart is Relative Strength chart against Nifty 500 which is above super trend means its relatively strong

    as long as price chart dosent give buy signal no commitment into the market

    Equity curve Trading

    Edge is the key

    #AhmedabadNest #power #portfolio #stockmarkets #nseindia #analysis
    310d0557-a431-4445-9bea-f12dbb202391-image.png

    1 Reply Last reply
    1
  • S Offline
    S Offline
    Shashank Jain

    Pro User

    wrote on last edited by
    #2

    How to plot portfolio in P&F, my portfolio has different weightage of different stocks , any help or trick ?

    N 1 Reply Last reply
    0
  • N Offline
    N Offline
    Nishshkumar Jaani,CFTe

    Pro User

    wrote on last edited by
    #3

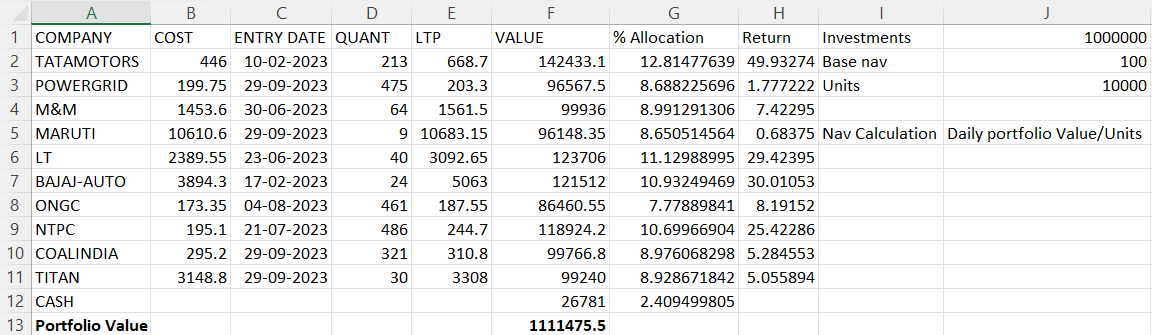
    for that on daily basis u need to maintain its NAV like mutual fund does consider cash addition/deletion/stock entry exit etc in xl sheet or 365 refer attached photo
    image.png

    1 Reply Last reply
    0
  • N Offline
    N Offline
    Nishshkumar Jaani,CFTe

    Pro User

    wrote on last edited by
    #4

    my re balance is on every 15 days so on add or exit stock with my pre defined rules with cash allocation as well -as per your allocation /entry exit rule u can maintain them and take daily NAV data into CSV file and save in my market folder then u can plot your charts according to your allocation

    1 Reply Last reply
    0
  • N Offline
    N Offline
    Nishshkumar Jaani,CFTe

    Pro User

    replied to Shashank Jain on last edited by
    #5

    @Shashank Jain This i have request to @Prashant-Shah sir when we meet at ahmedabad this year to allow with user define weighted portfolio charts

    1 Reply Last reply
    0


Recent Posts

  • V
    REBALANCING
  • DefinedgeD
    Friday webinar
  • A
    Master Momentum Trading
  • manzandu123@gmail.comM
    Daily Setup 09th MAY 2025 (MKLH)
  • A
    Market Trend Filter | MAST Value
  • Login

  • Login or register to search.
  • Blog
  • Youtube Videos
  • Refresh
  • First post
    Last post
0
  • Recent
  • Categories
  • Unread 0
  • Popular
  • Tags
  • More
    • Guidelines
    • Disclaimer
  • Users
  • Login

  • Login or register to search.
  • Blog
  • Youtube Videos
  • Refresh