Brijesh Bhatia
Pro User
All Replies
-
@Kamal Arora Do check Laidback stock which I keep sharing every week.
-
I have been regularly sharing insights about the Laidback Strategy on our forum. I would like to revisit an important example that underscores the power of sticking with a well-defined trading system.
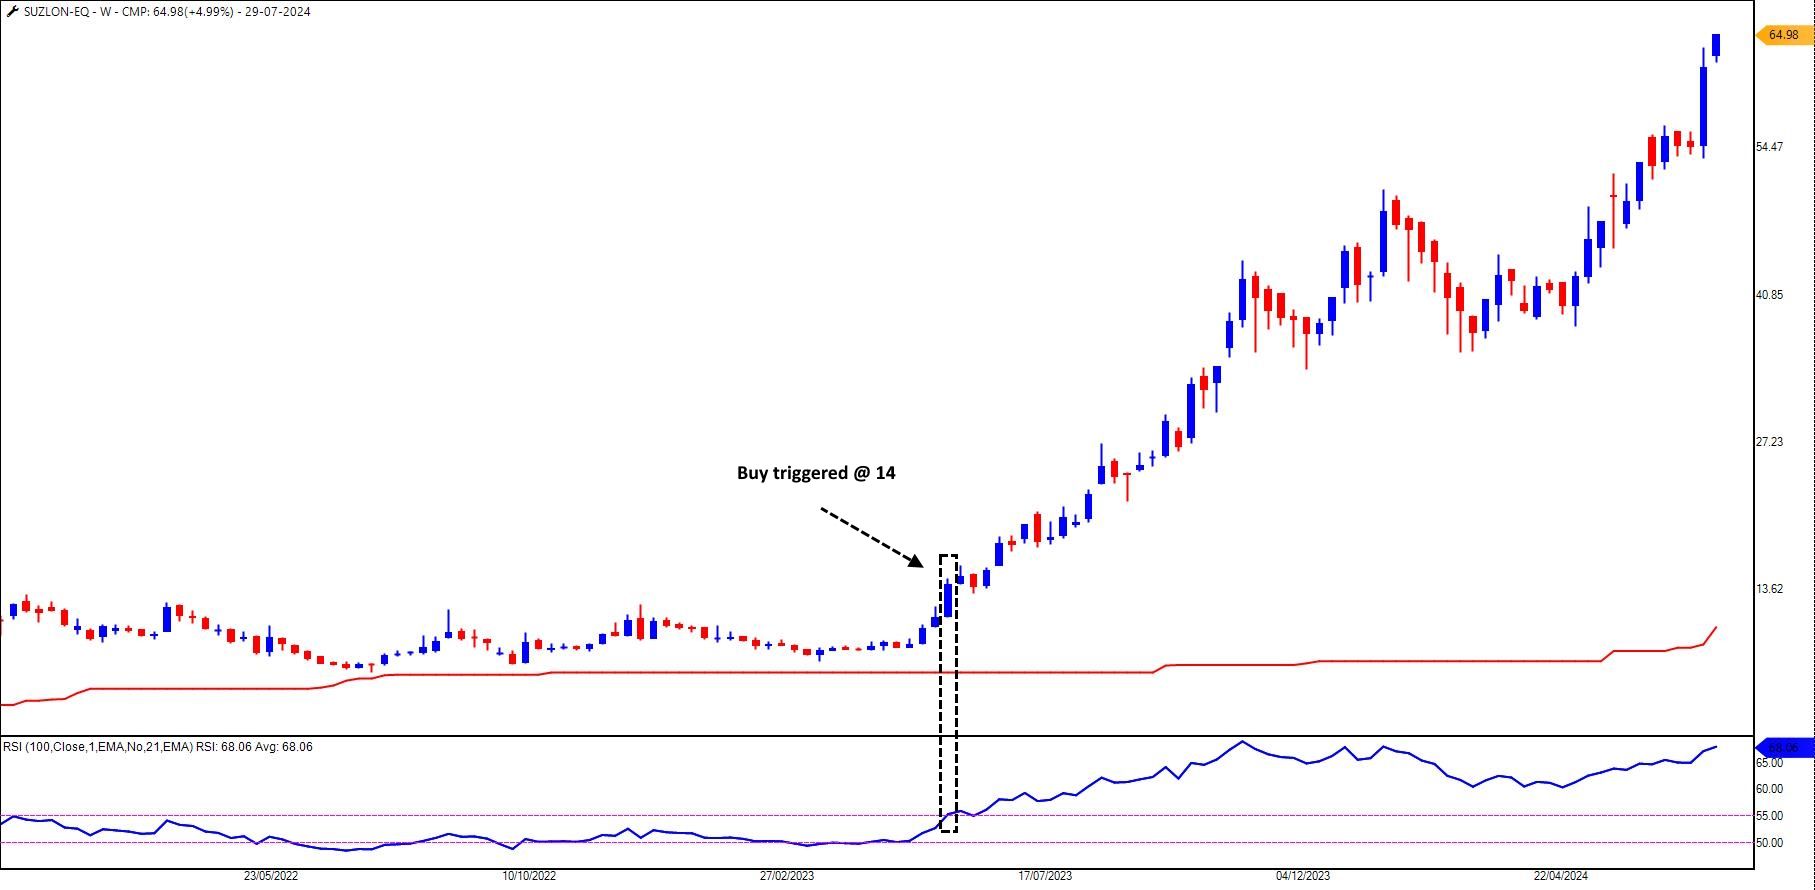
Last year, I authored an article discussing how Suzlon Energy Ltd. triggered a buy signal in the Laidback Strategy after 15 years at a price of Rs. 14. Fast forward to today, Suzlon is trading at Rs. 64.98 and still going strong, marking an impressive increase of over four times in just a year. Read here
The primary purpose of this note is to underscore the critical importance of patience and consistency in following a trading system. Many traders often get disheartened or lose faith in their strategies when immediate results are not evident. However, as Suzlon's example illustrates, a well-crafted strategy can yield significant returns, potentially even fourfold, if given the time to mature through various market phases.
Here are some key takeaways from this experience:
-
Patience is Key: The Laidback Strategy identified a buying opportunity in Suzlon after a long period of dormancy. This underscores the importance of waiting for the right conditions and signals, even if it takes years.
-
Trust the System: The remarkable growth in Suzlon's stock price over a year, from Rs. 14 to Rs. 64.98, demonstrates the power of a systematic approach. Had we not adhered to the strategy, we might have missed out on this substantial gain. This should reassure you of the effectiveness of a well-defined trading system.
-
Market Phases: Every trading system will encounter different market phases, from bullish to bearish trends. Observing how your system performs across these varying conditions is crucial to truly understand its potential and limitations.
-
Conviction Through Experience: The real test of a trading system's efficacy comes through prolonged usage. Until you've applied your system for an extended period and seen how it navigates different market environments, you won't fully grasp its strengths and weaknesses.
Below is Suzlon's chart, highlighting its significant rise from Rs. 14 to Rs. 64.98, as identified by the Laidback Strategy.
The Suzlon example should serve as a reminder and motivation to all of us to stay committed to our trading strategies. Consistency and a long-term perspective are essential in reaping the benefits of a well-designed trading system.
Are you thinking of Yes Bank and Idea whether they are a buy in Laidback?

-
-
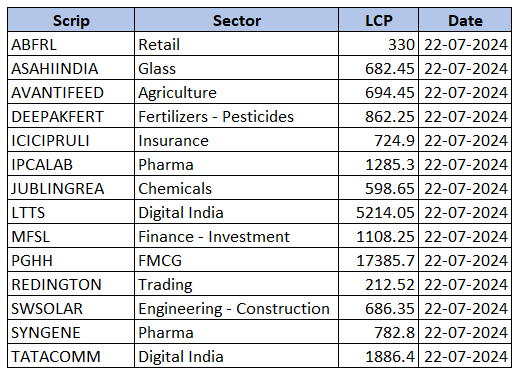
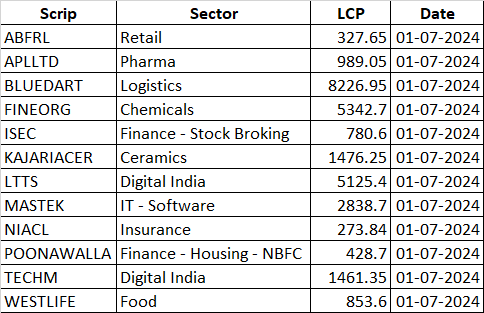
Stocklist - 27th July 2024
-
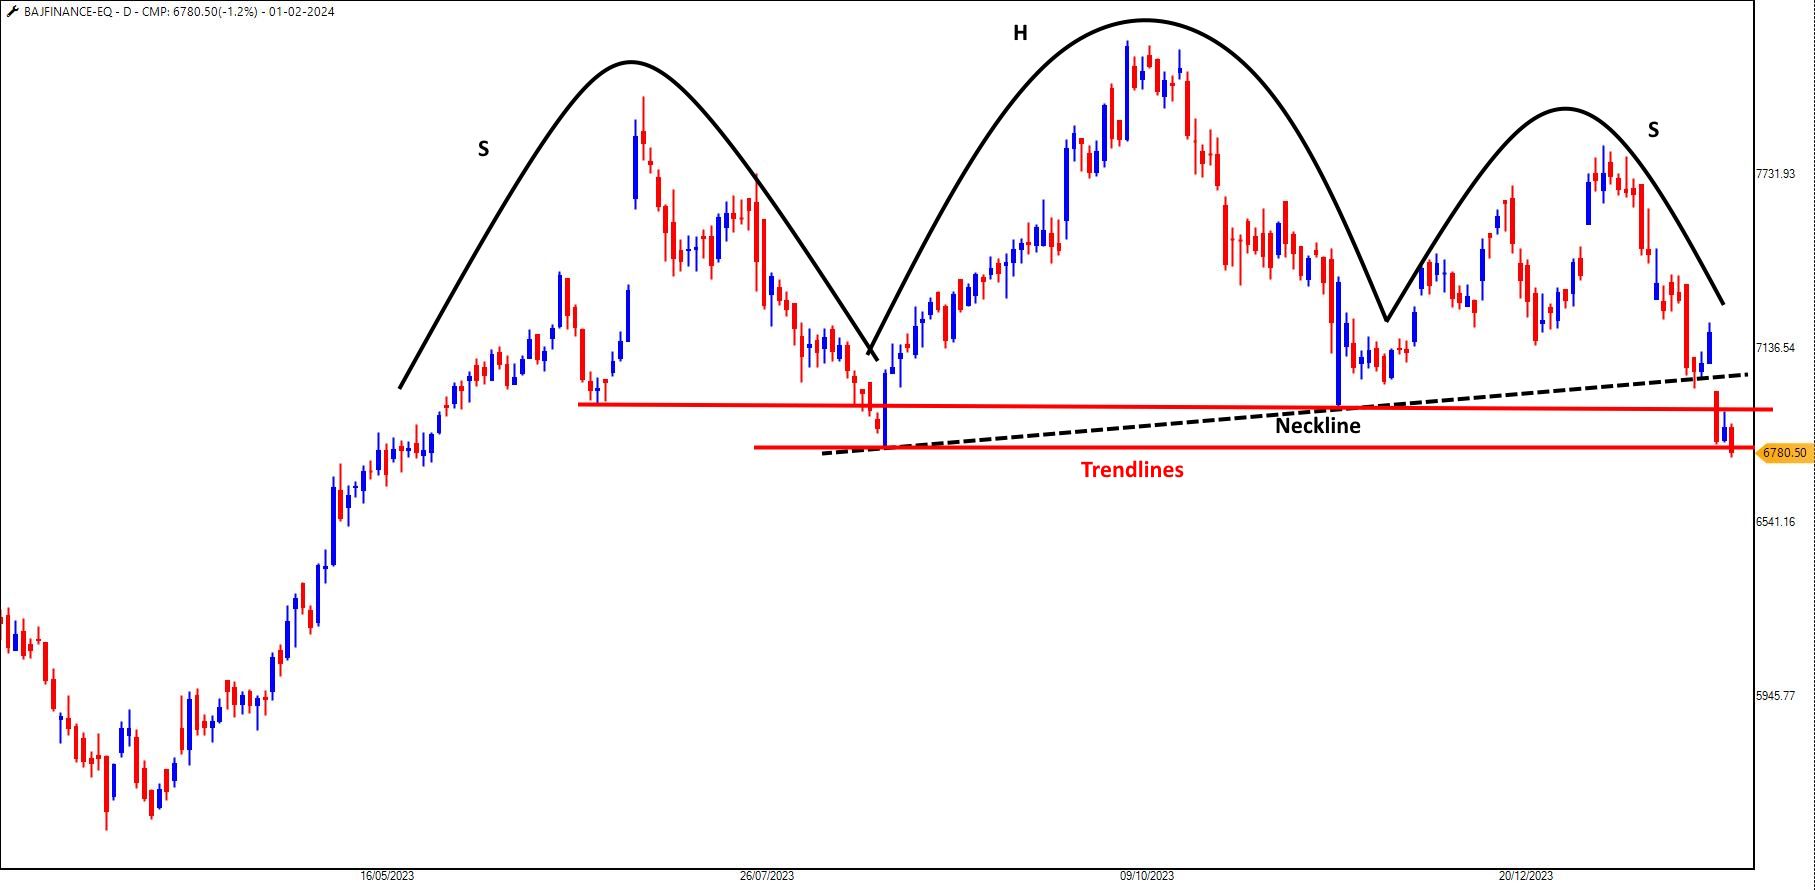
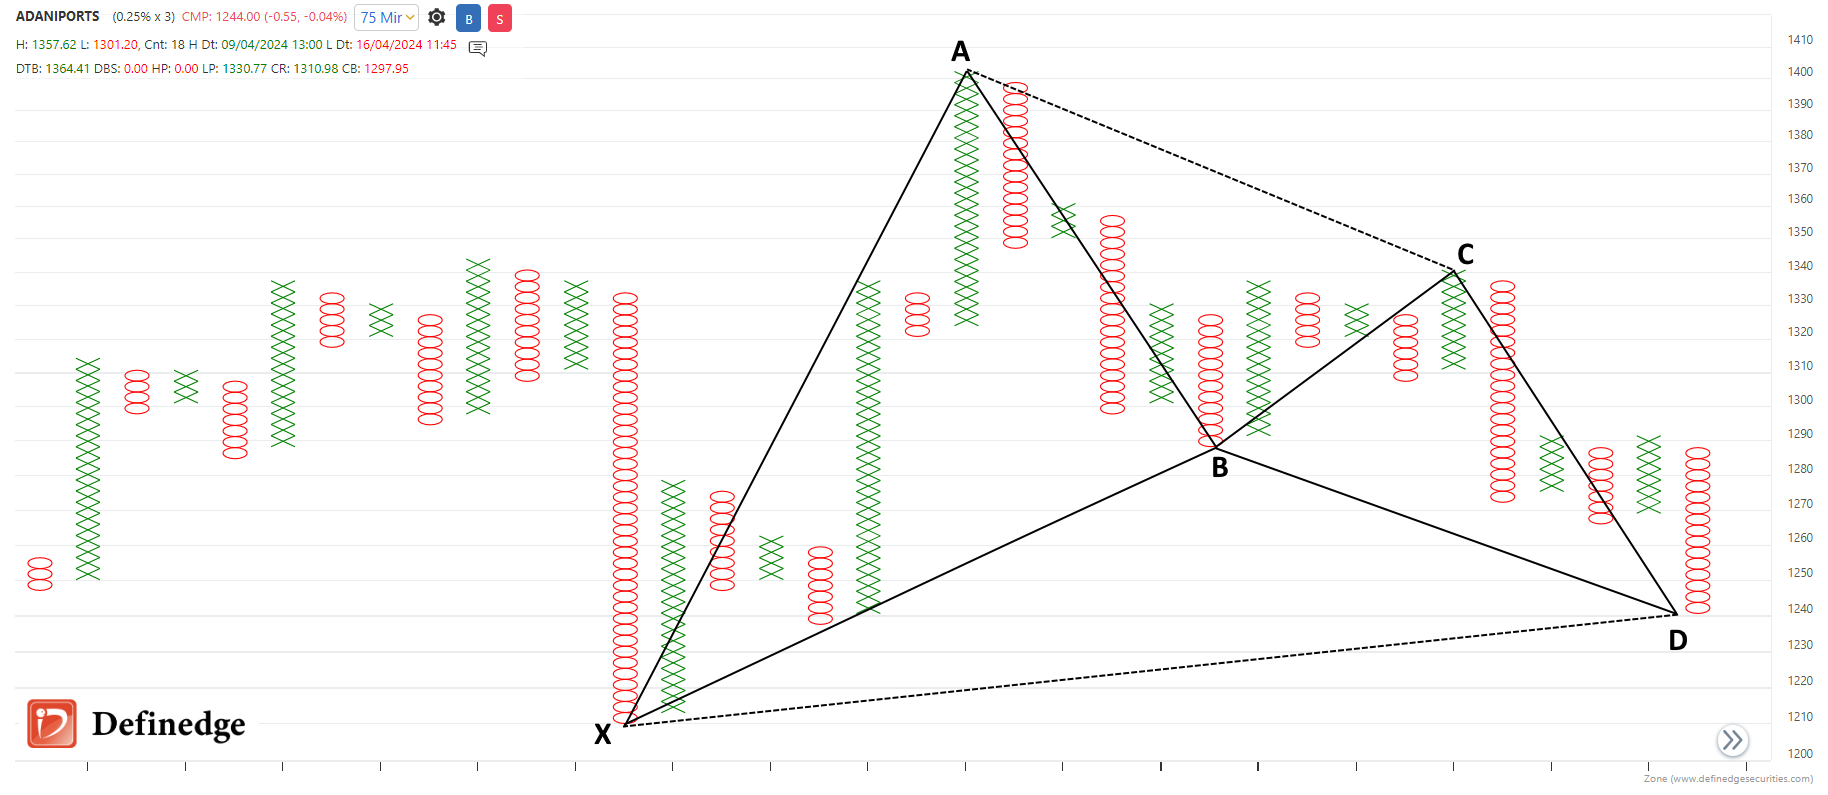
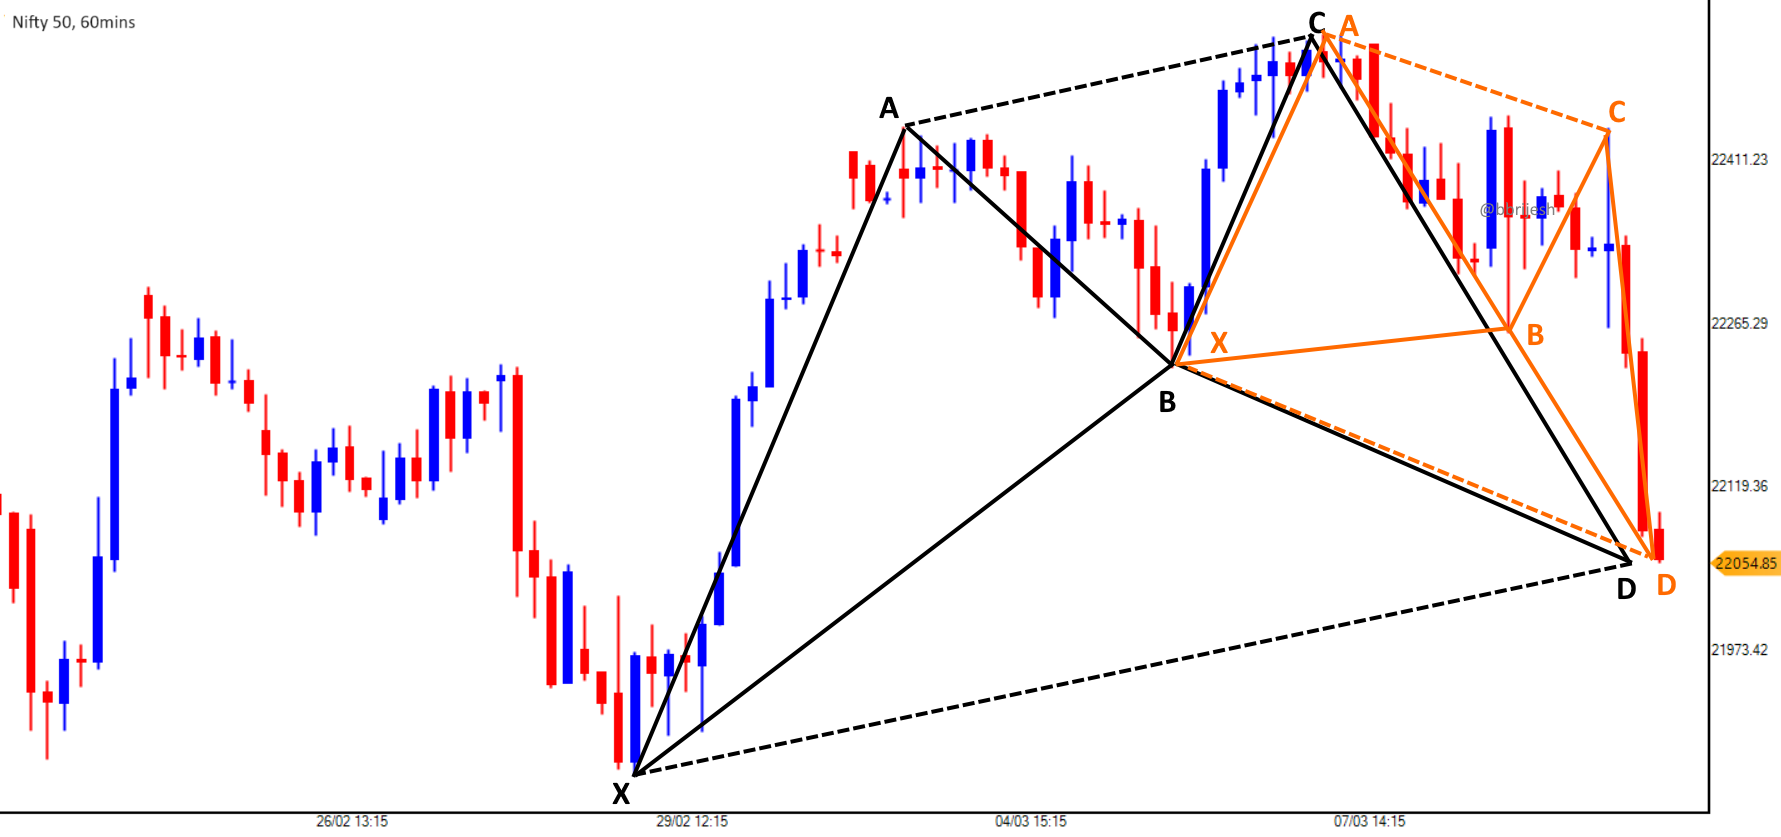
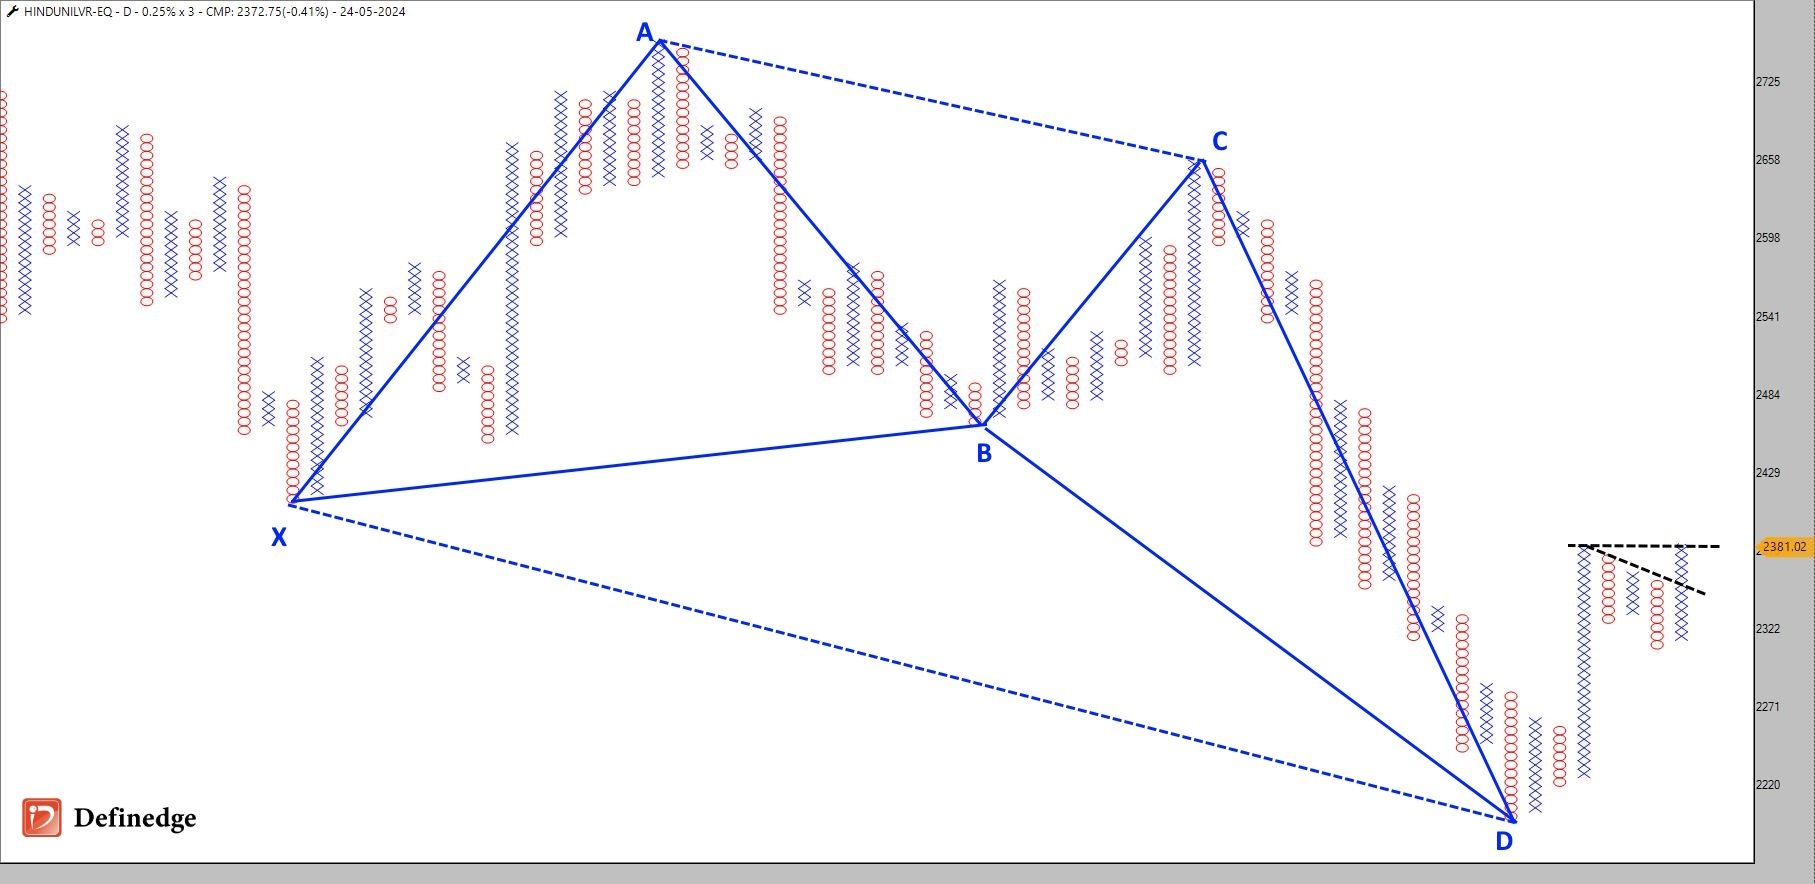
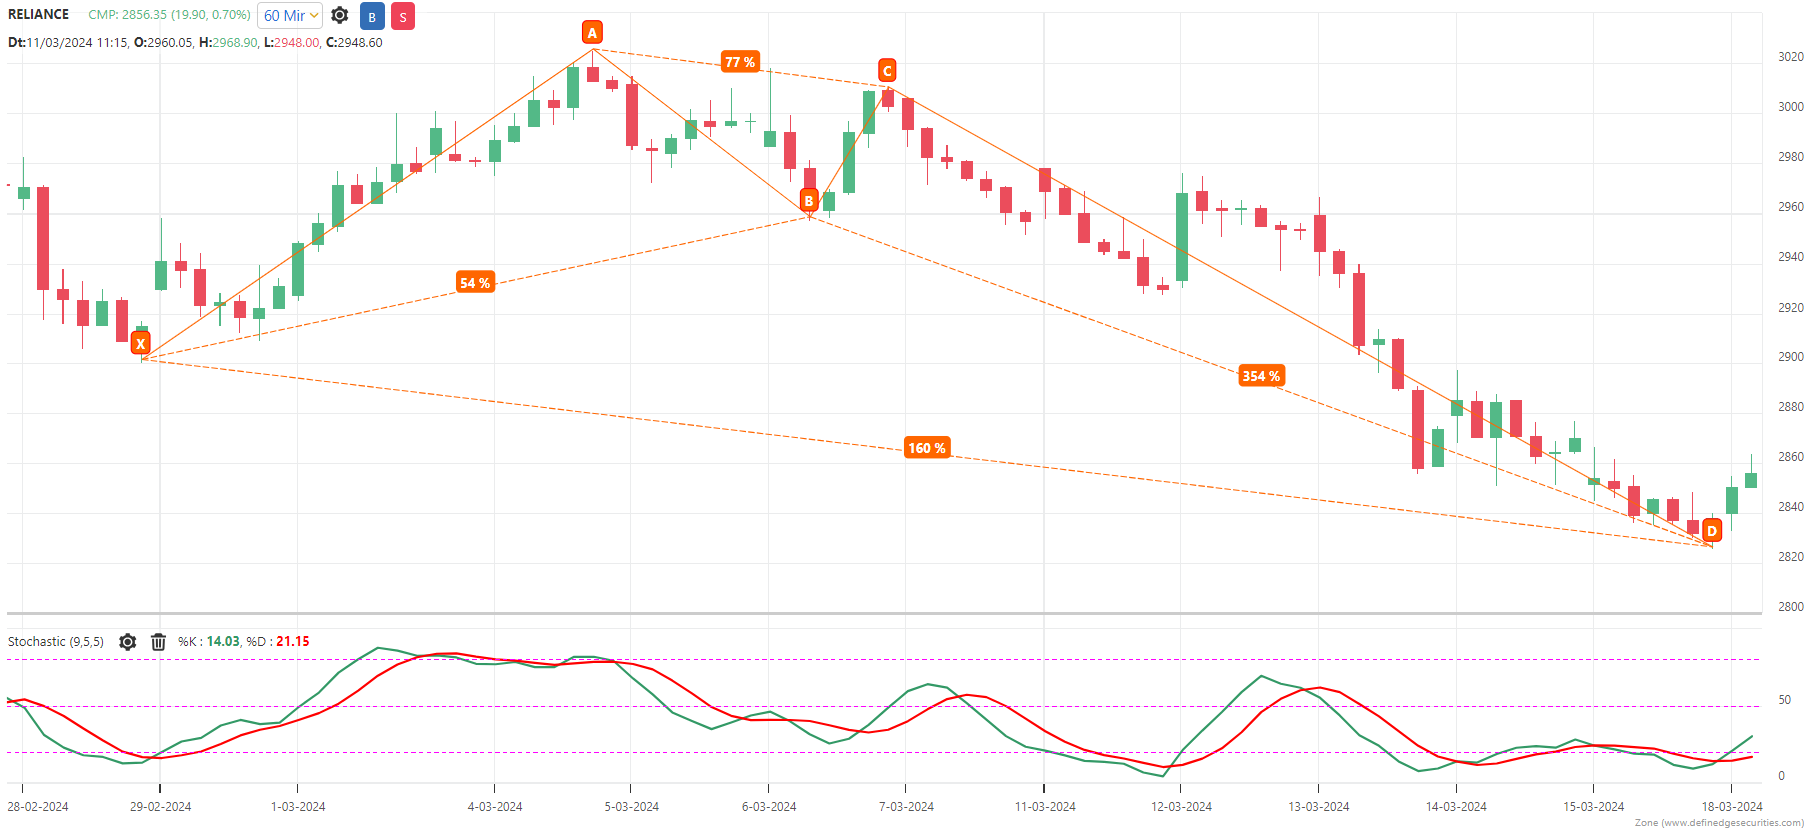
The Bearish Gartley - PRZ @ 24,650-24,750
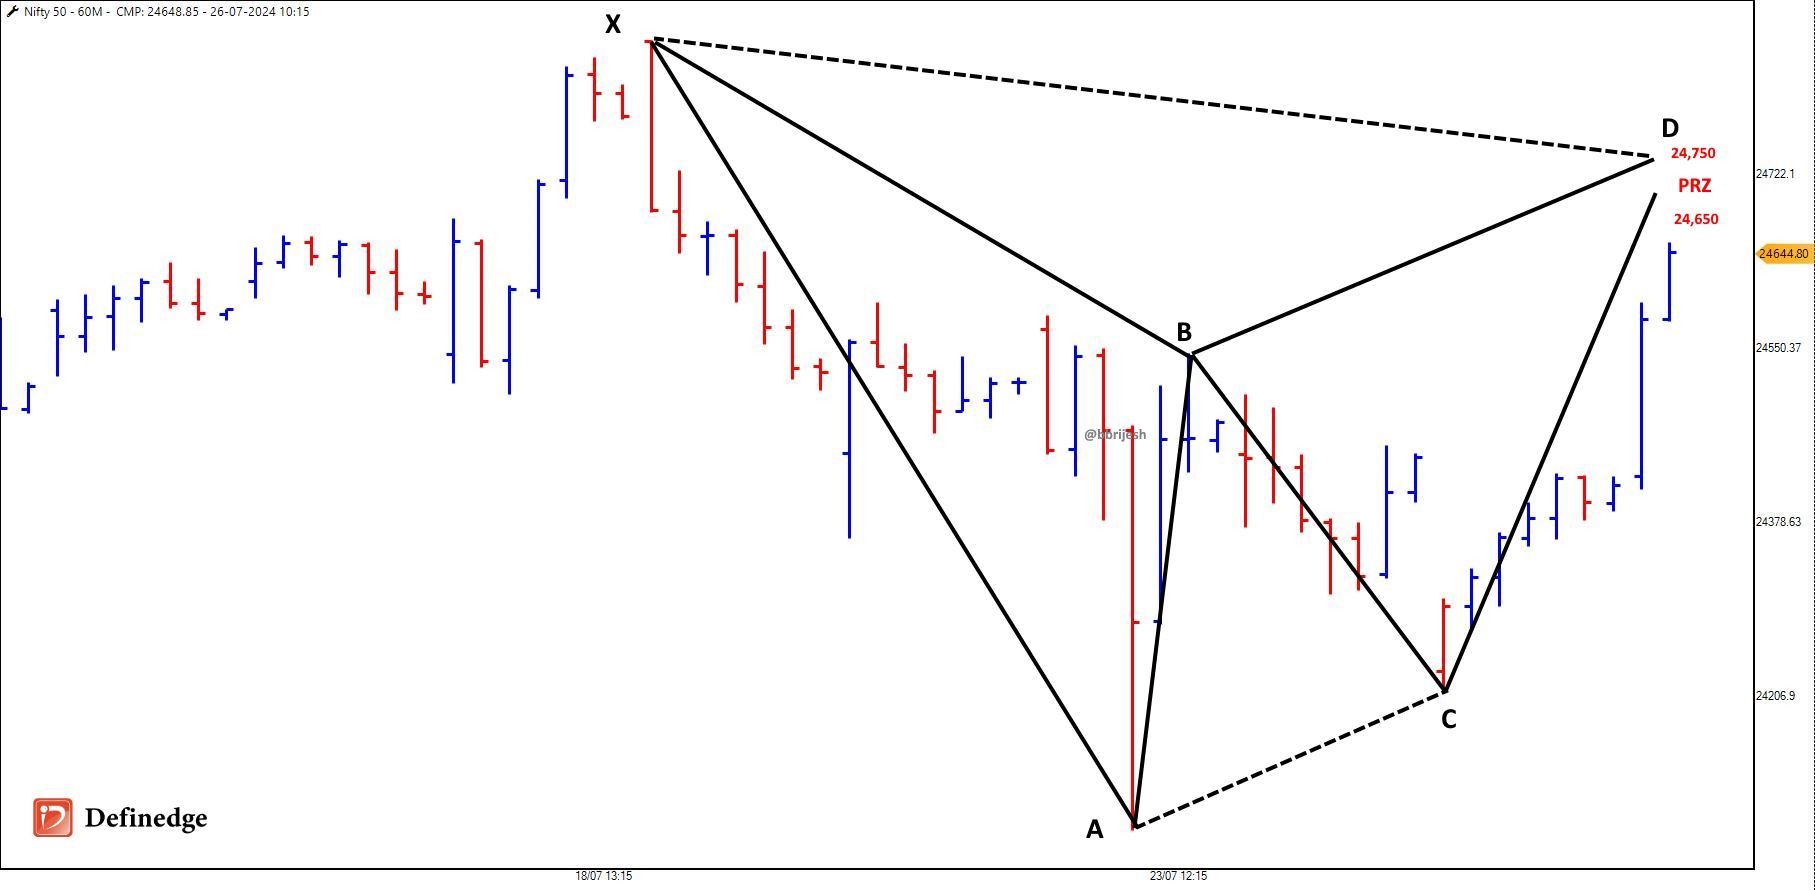
Pattern Negate above 24,900
-
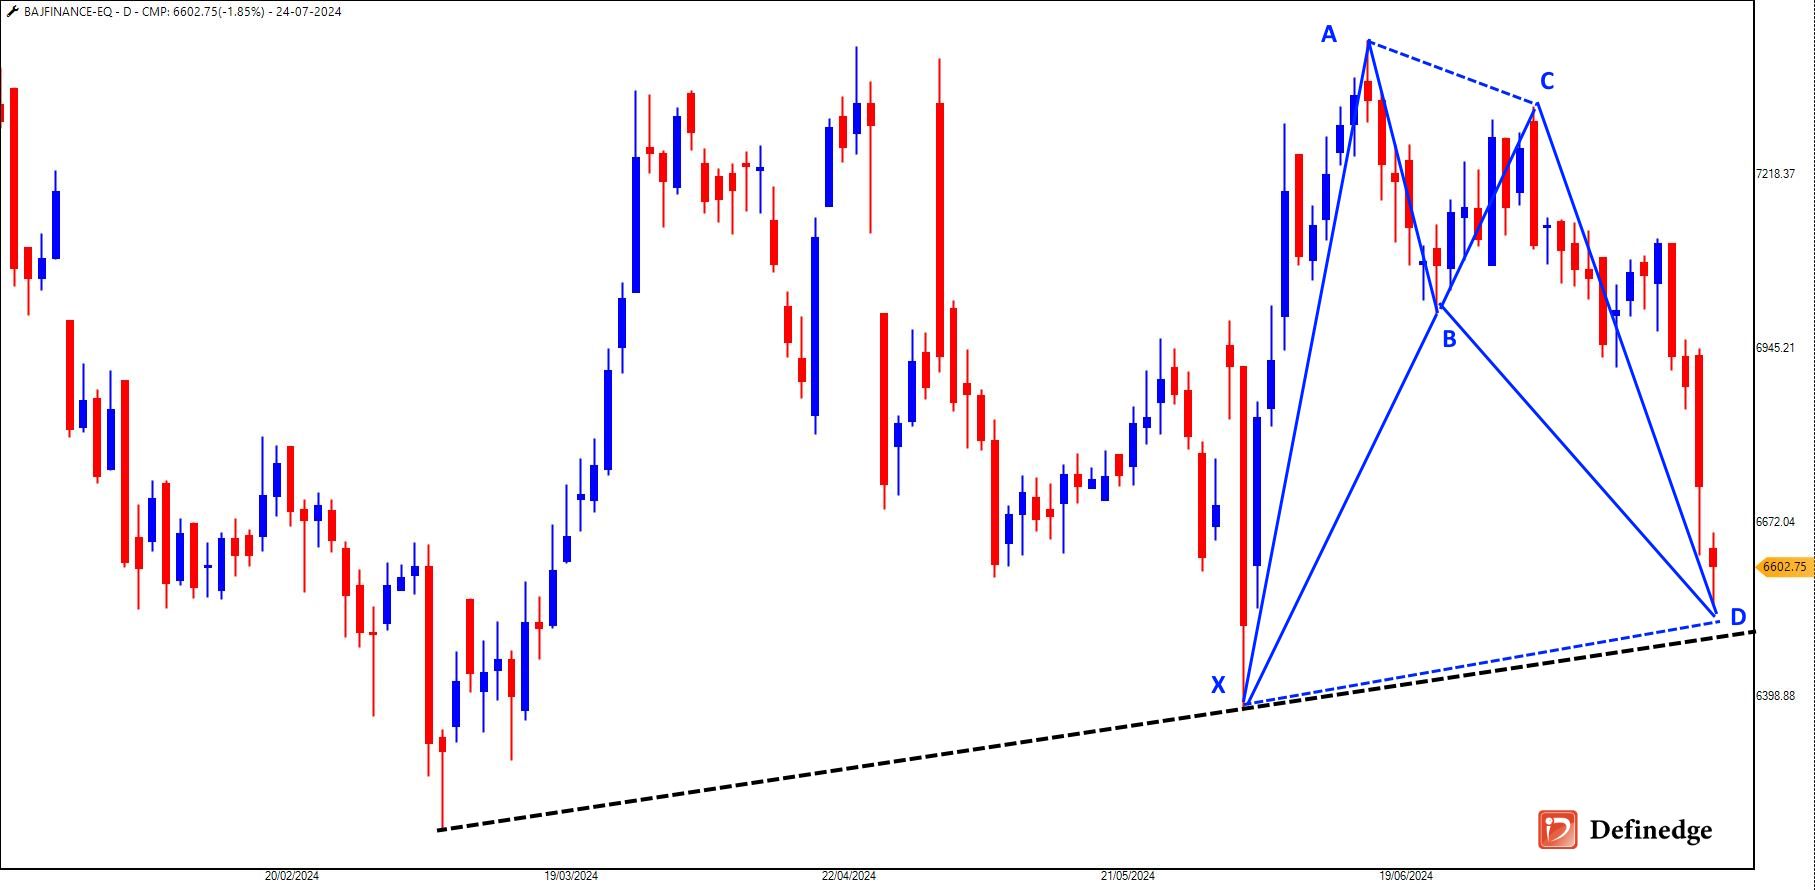
@Brijesh Bhatia BanjFin 6,600 to 6,750+
If you have enrolled for the Harmonic Trading Pattern Course, don't miss the Q&A tomorrow at 10 am.

-
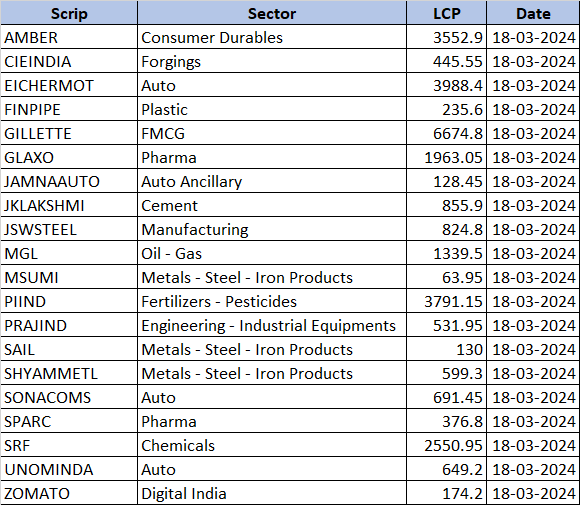
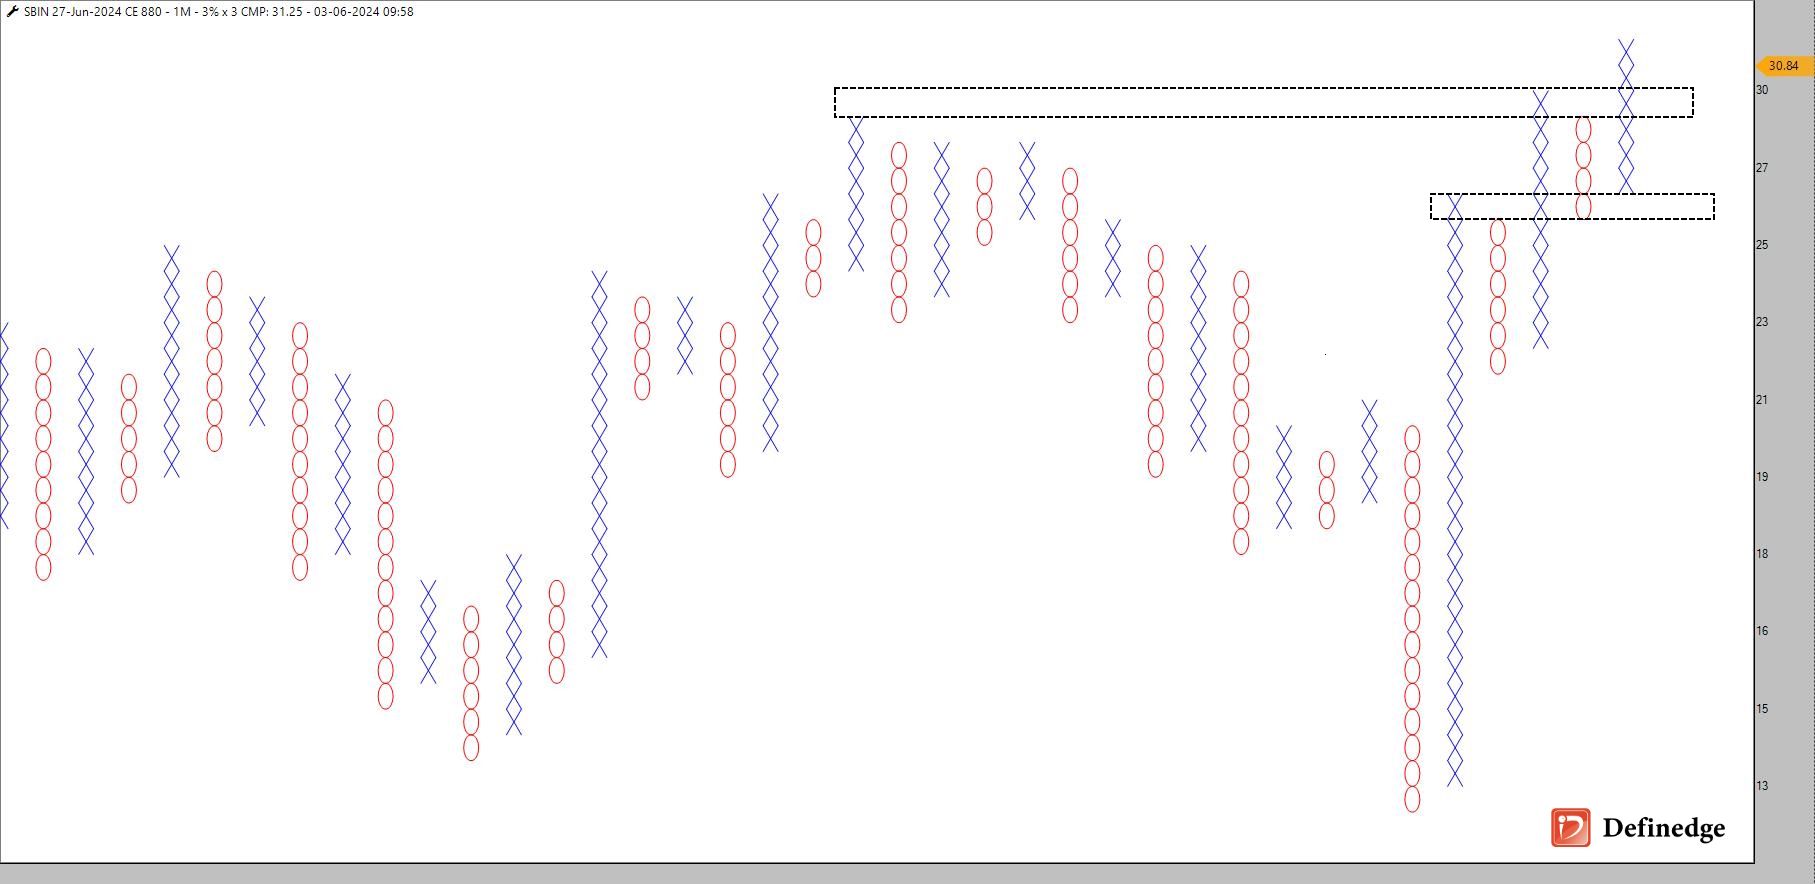
A follow-through buy or sell signal confirms the significant patterns that were previously triggered.
To aid traders in identifying these follow-through signals, Definedge employs a specialised scanner in RZONE. This scanner displays a list of stocks generating bullish or bearish follow-through signals.
Click here to learn How to use Scanner
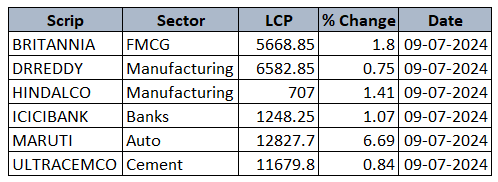
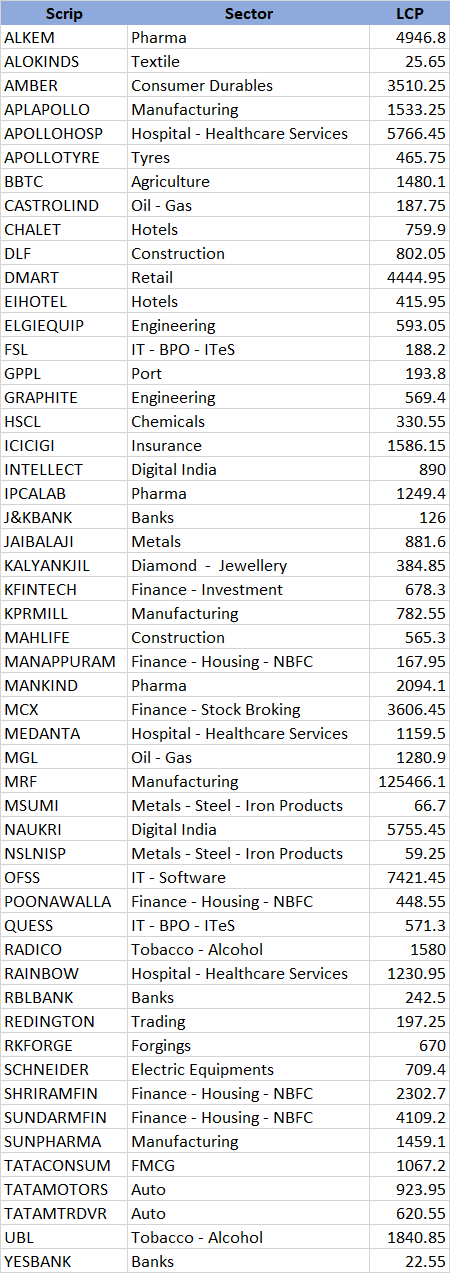
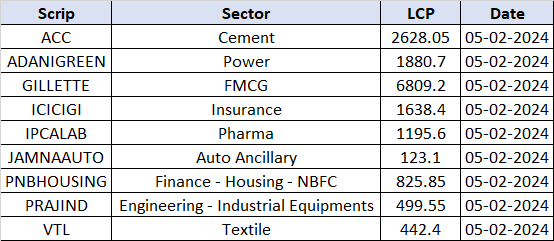
Here is the list of the F&O stocks ahead of Union Budget 2024.
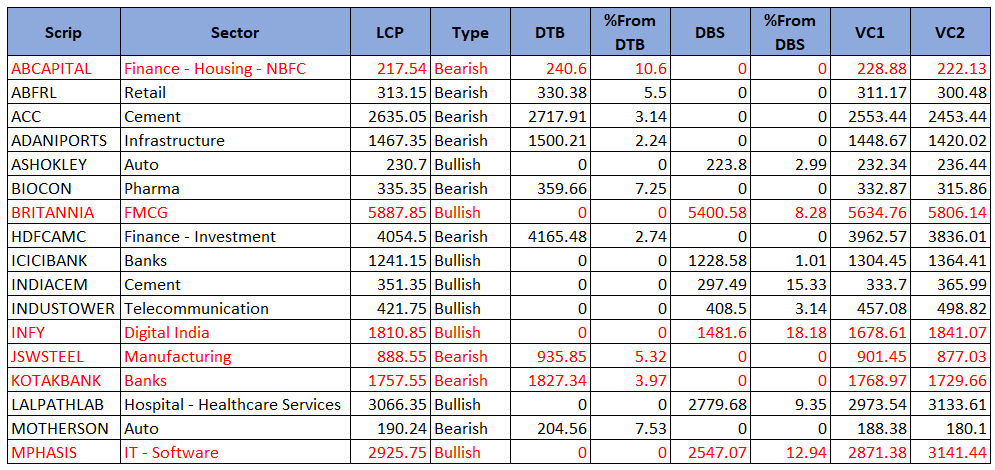
*The stocks marked in red have met VC1 or VC2 -
Here it is:
Step 1: Create System
Step 2: Open Multi-timeframe Scanner > Candlestick Scanner
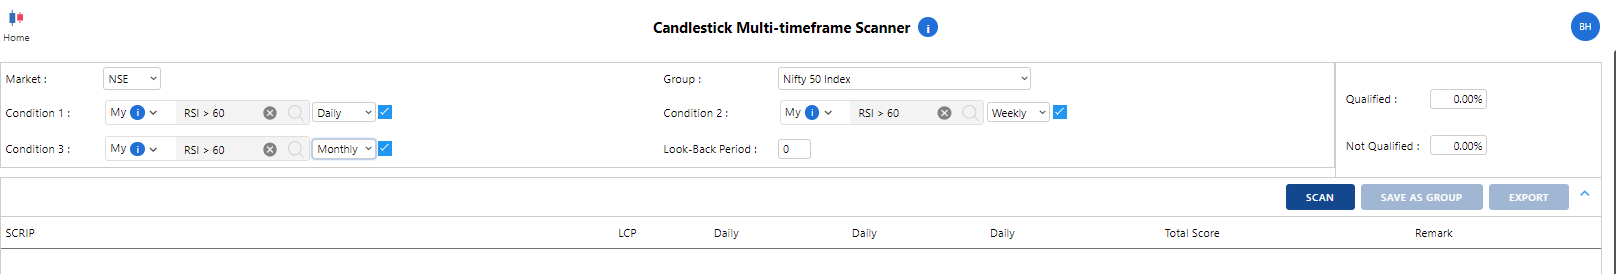
Step 3: Select Group and click on Scan. Check the Qualified stocks.
-
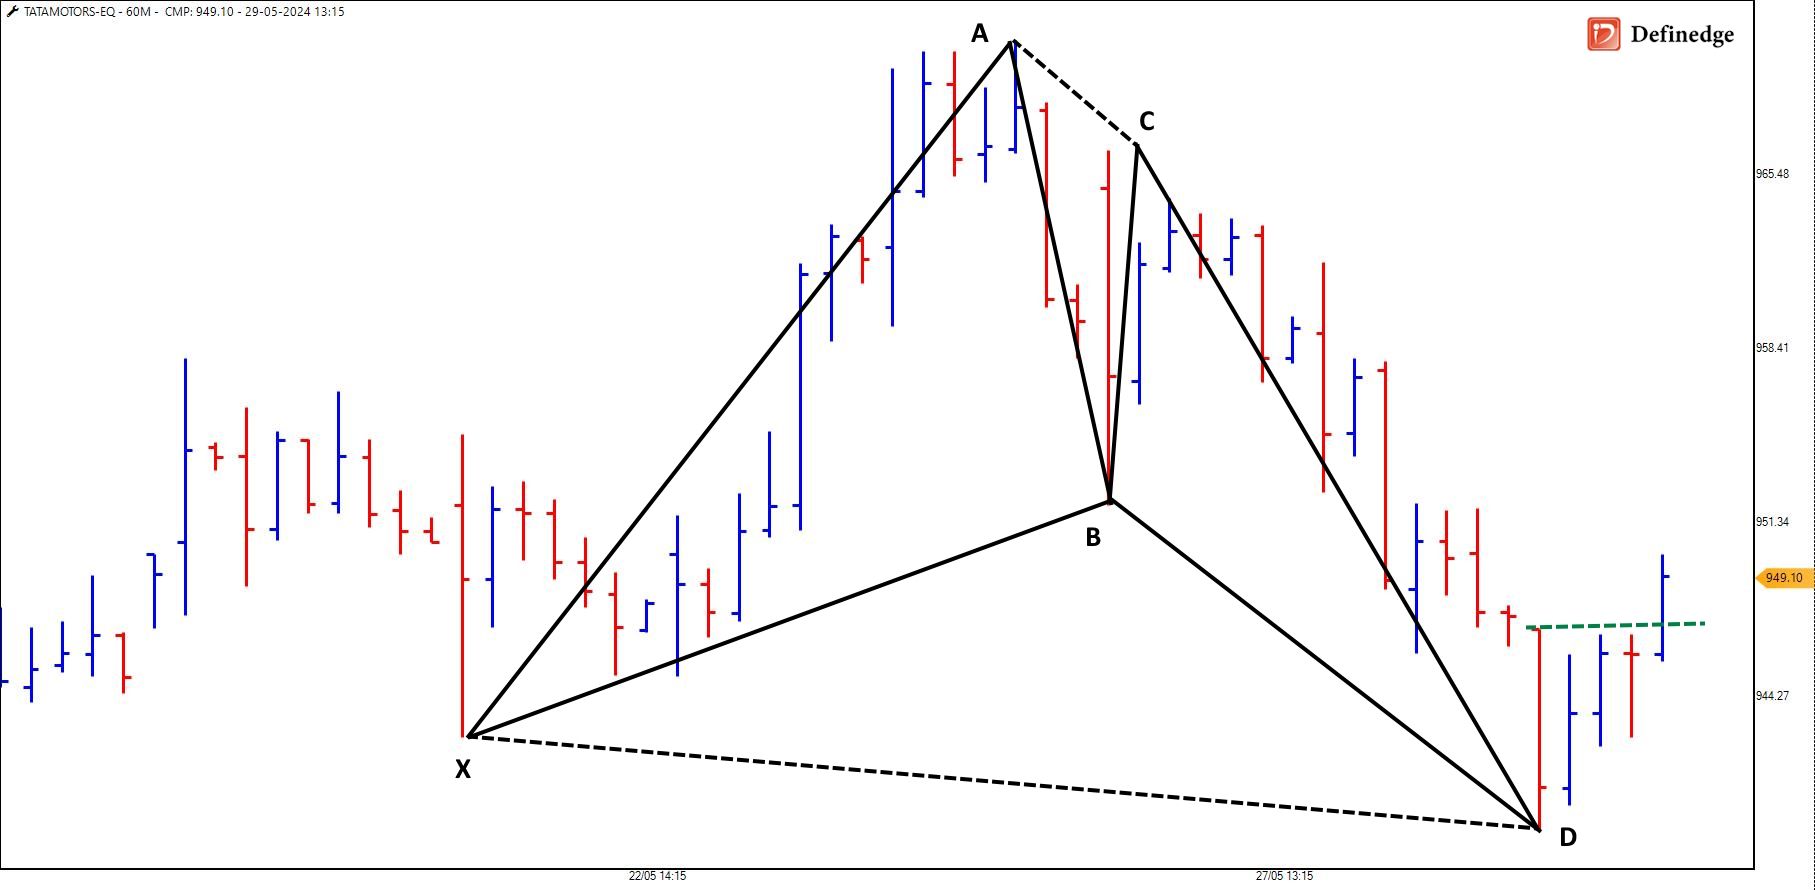
Pharma stocks are trending bullish but the bearish harmonic on the stock indicates the pause to the momentum.
The bears may capitalize the reversal and look for short-on-rise opportunity while the bulls can be in the game on the break of 7,035.
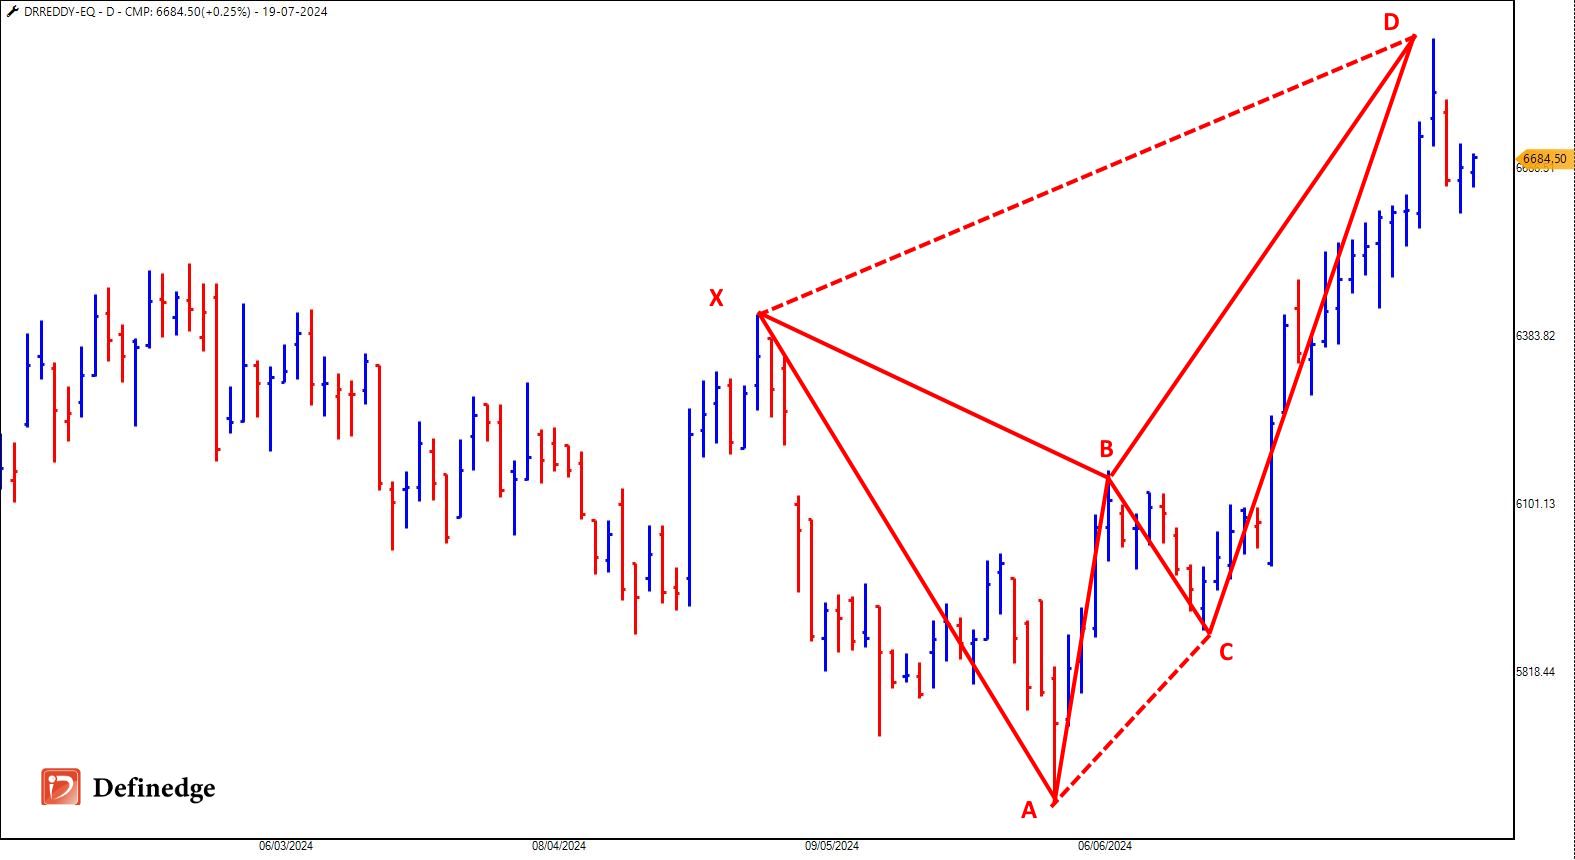
To enroll for Harmonic Course, Click here
-
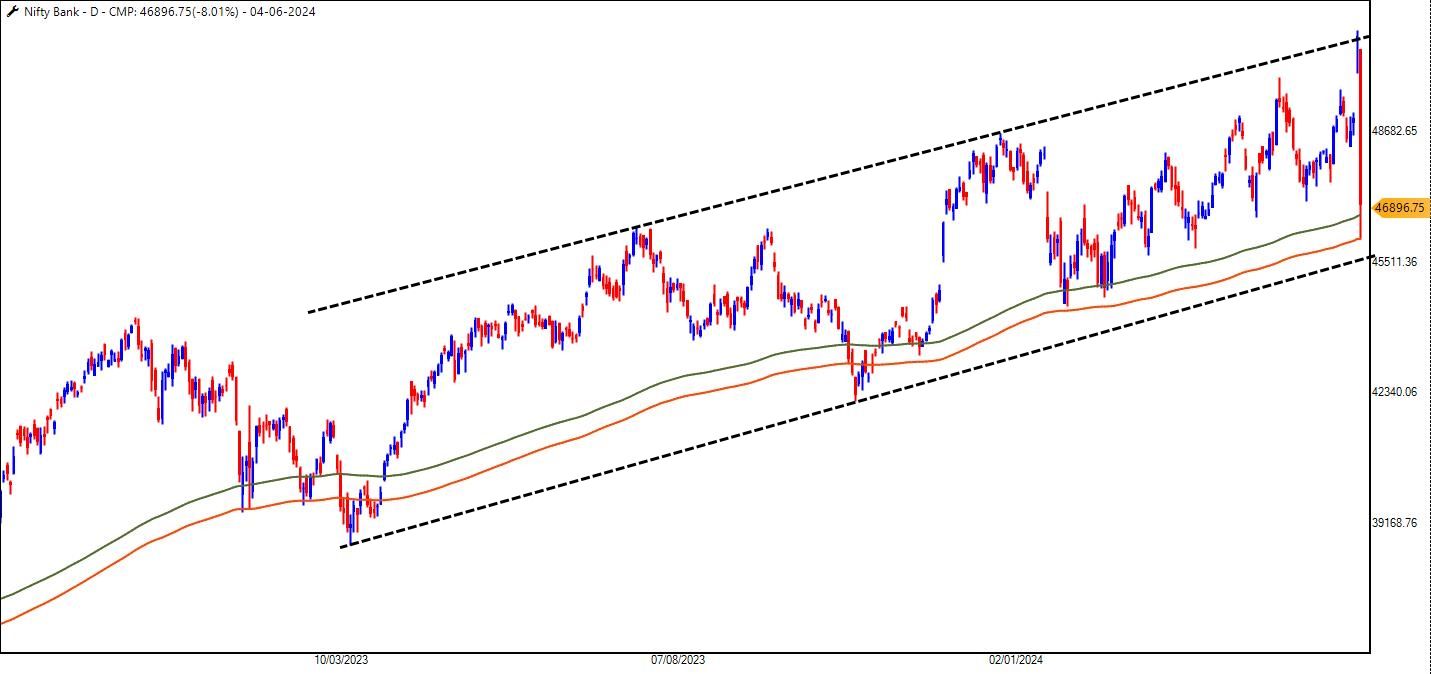
It's been 10 days, and Bank Nifty continues to trade within the range.
For the same period, the US Bank Index is up over 5%.
-
@MITESH SHAH Check the above screenshot.
-
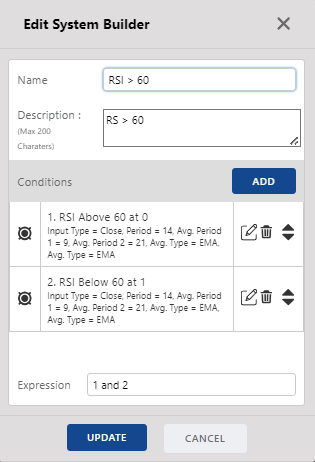
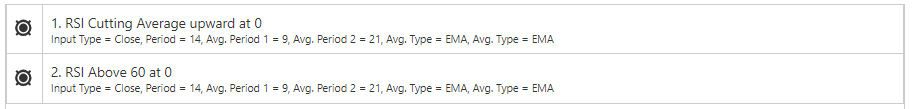
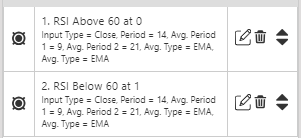
Will filter stocks that has RSI above 60 at current candle.
-
Will filter stocks that had RSI below 60 on T-1 day.
So effectively, the stock which crossed RSI above 60 will appear in scanner.
-
-
-
@Harjjap Singh Ssaini Can you write in detail about the indicator plz
-
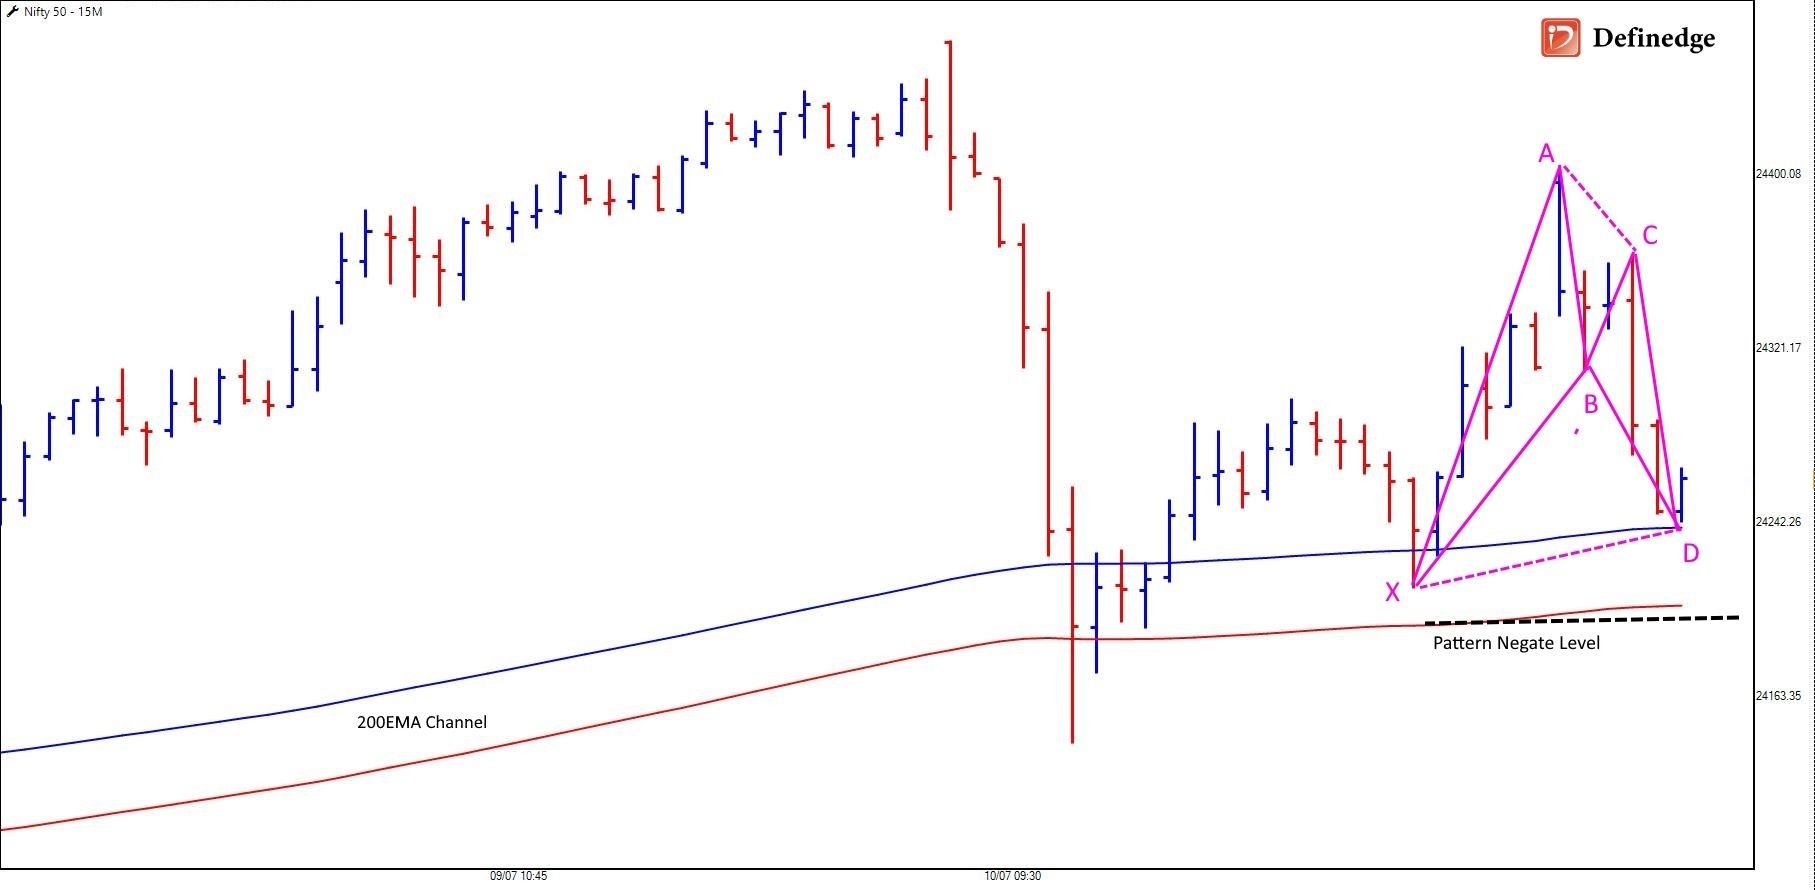
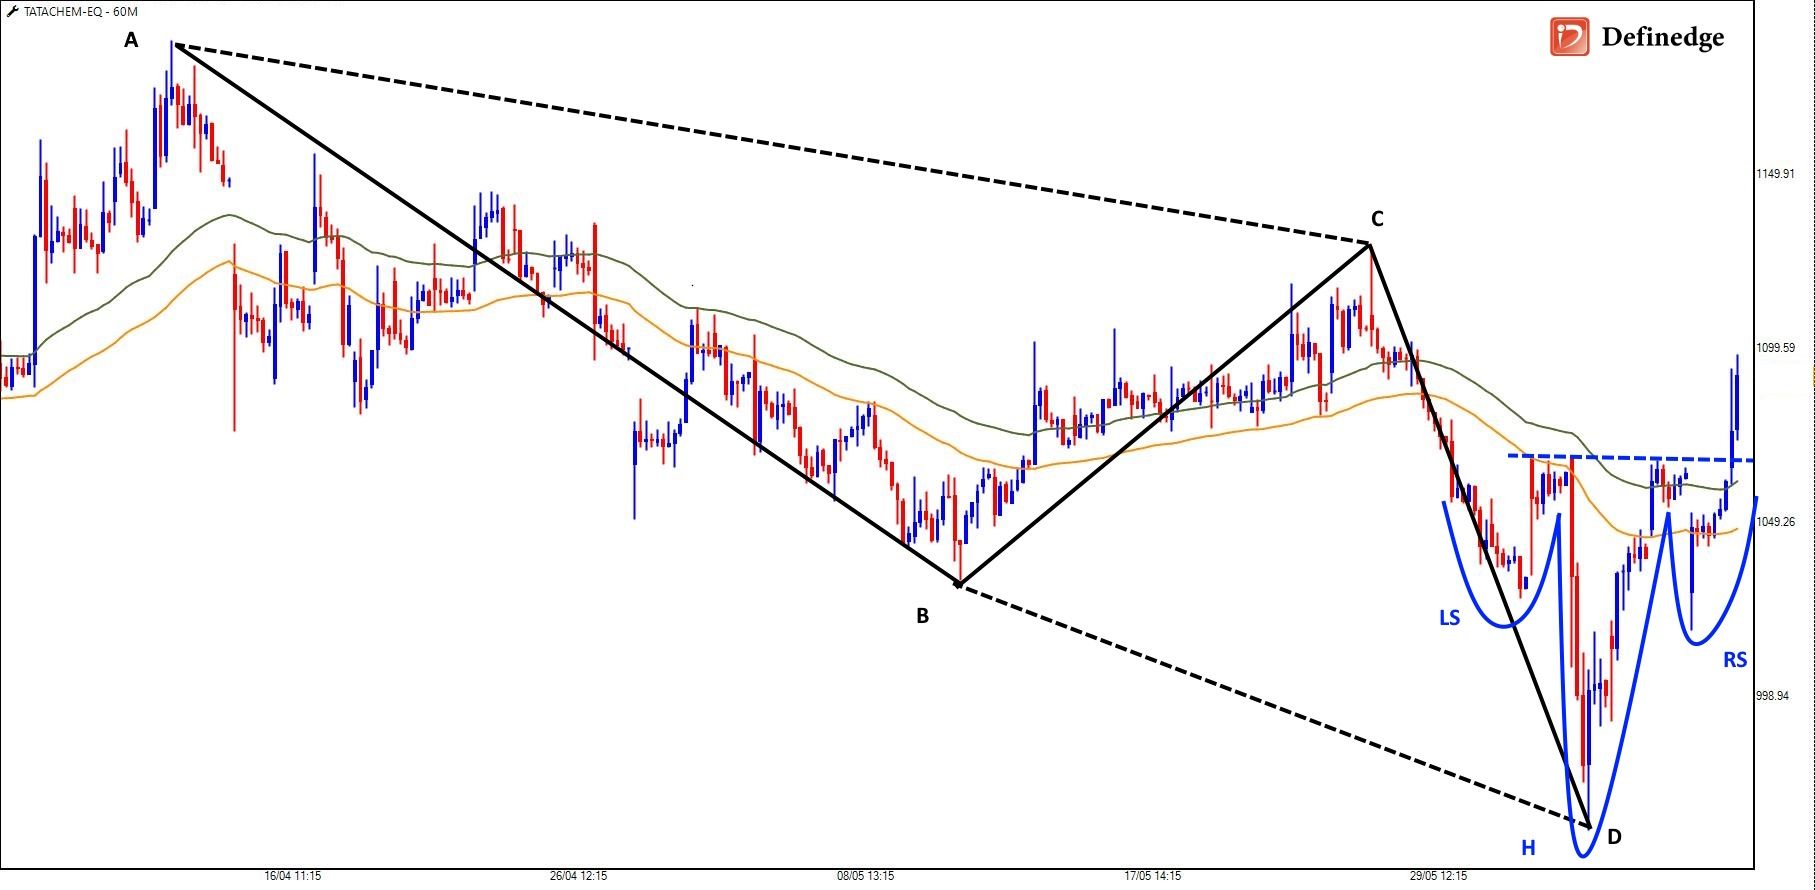
The Bullish Bat Harmonic Pattern is visible on the Nifty 15mins (Spot) chart. The 200EMA Channel is placed below the reversal levels indicating the support zone.
As the giant HDFC Bank and Reliance are leading the fall in the first hour today, the risk is higher in the reversal setup. Hence, the stop-loss is a must for the setup, which is 24,170. (CMP-24250)
-
Strategy Video:
https://www.youtube.com/watch?v=6P9AWXH1H5c&t=28s -
How about a strategy with a bullish stock trend and higher volumes that push the price higher?
I have created a system based on Trend and Volumes - Volume Weighted Trend Rider (VWTR),
Here is the list of stocks from Nifty50 as of yesterday.
Should I record a video on this strategy?
-
In the digital era, where convenience and accessibility are paramount, Zone Mobile App presents a cutting-edge solution that empowers users with the ability to access ready-to-use scanners with just a few simple clicks on their mobile devices.
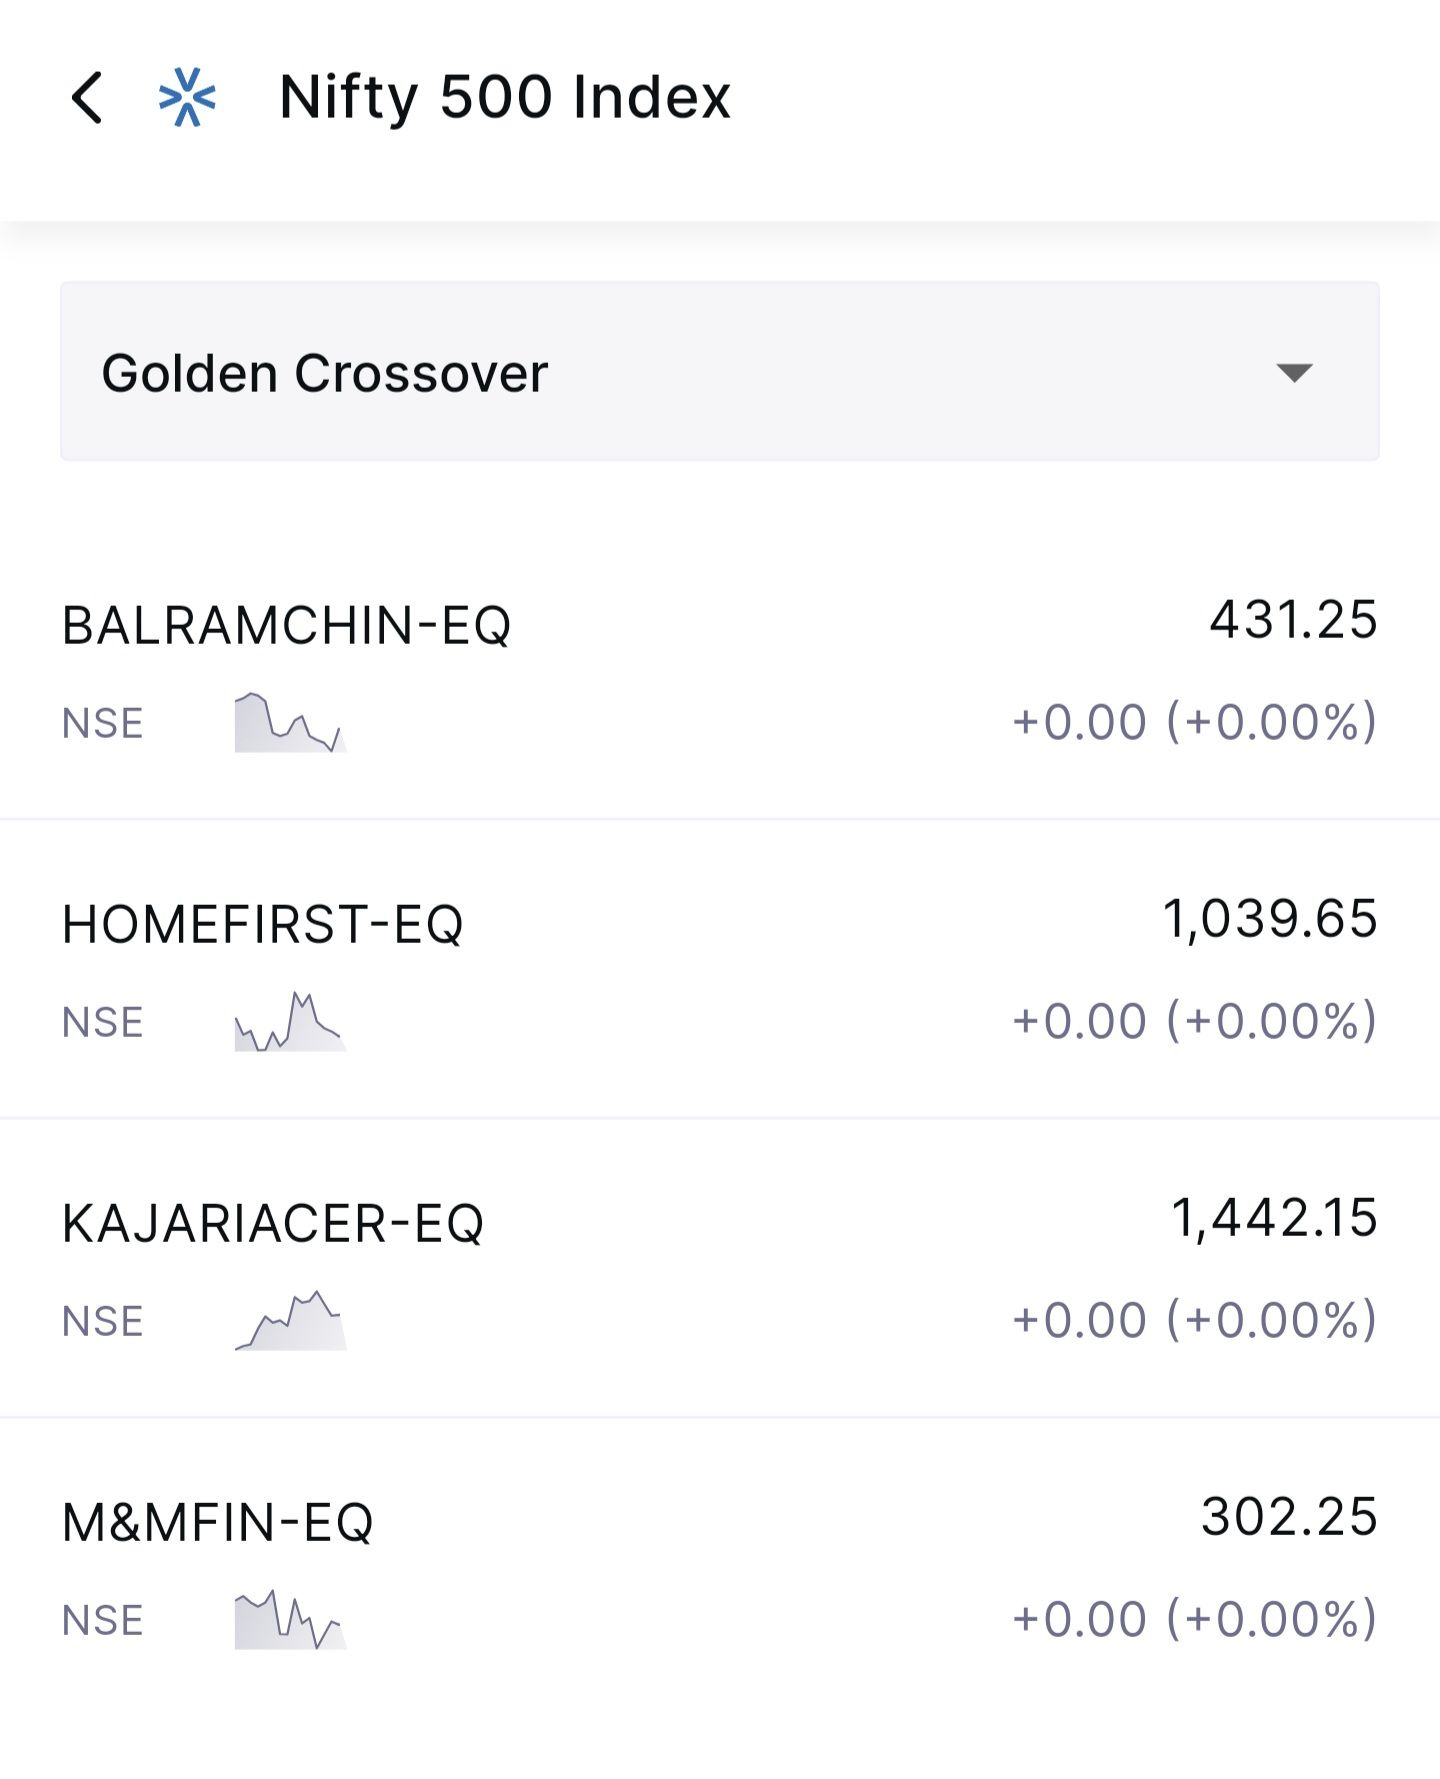
One such scanner is Golden-Cross.
The Golden Cross is a popular technical analysis pattern that occurs when a short-term moving average crosses above a long-term moving average, signaling a potential shift from a bearish to a bullish market trend. Typically, the 50-day moving average crossing above the 200-day moving average is used to identify a Golden Cross. This pattern is seen as a strong bullish signal, indicating that the stock's price is gaining upward momentum. Traders can comsider this a sign to enter or increase positions, anticipating continued price growth.
The Golden Cross is widely followed in various markets, including stocks, commodities, and forex, due to its historical reliability in predicting upward market movements.
On Zone Mobile App, you can check the stock's that qualifies this pattern.
-
Your query will be answered. Watch this video:
https://www.youtube.com/watch?v=2dzubtUxp9o -
Stocklist 6th July 2024
-
Both are different.
You can find Probable ABC Bullish/Bearish in scanner.
-
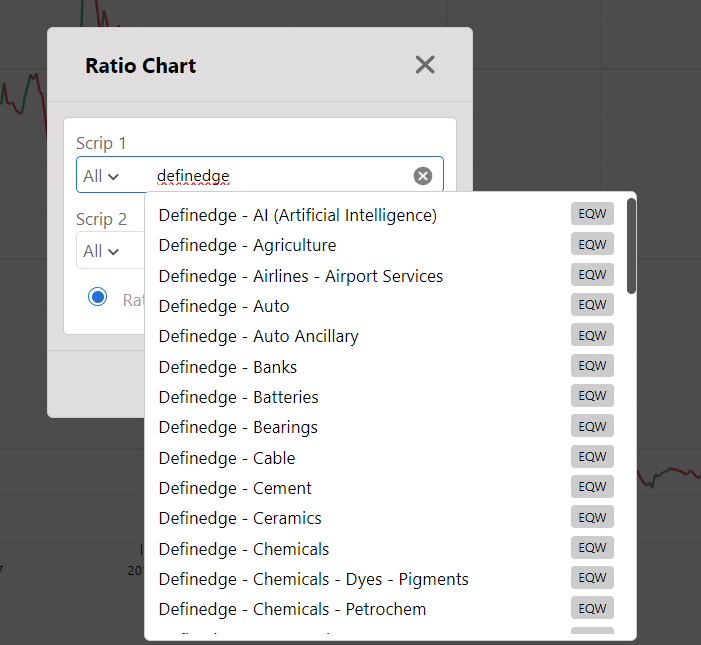
Open Ratio Chart and write Definedge, you will get the list of Definedge EQW index. Check below:
-
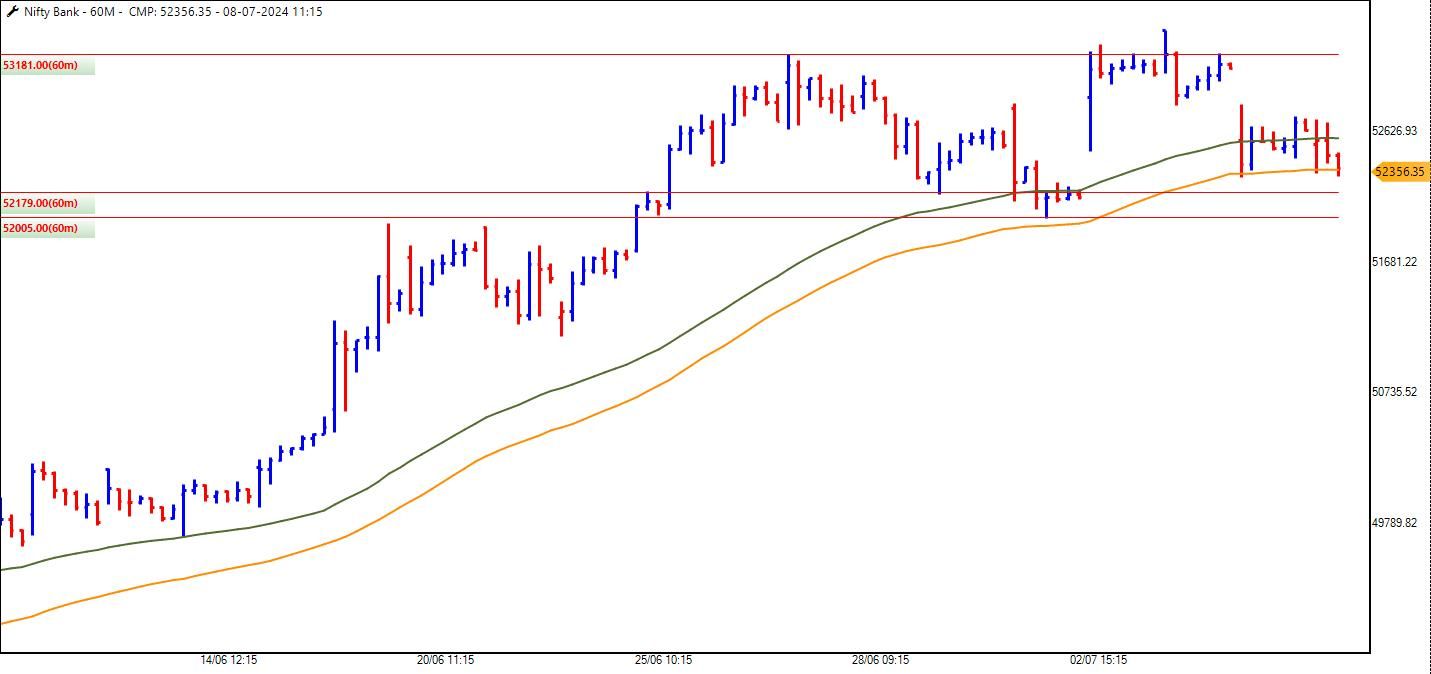
The Bank Nifty has been oscillating between 52,000 and 53,000 over the past few trading days, following its recent high of 53,301. This period of consolidation reflects a tug-of-war between the bulls and the bears, leaving traders on edge as they await a decisive move.
A closer look at the index's constituents reveals that HDFC Bank has been a significant drag, pulling the index lower. In contrast, ICICI Bank and Axis Bank have contributed positively, attempting to counterbalance HDFC Bank's impact. Given HDFC Bank's substantial weight in the index, its performance heavily influences the overall movement of the Bank Nifty.
The technical chart of Bank Nifty indicates a critical support zone between 52,000 and 52,180. A break below this level would likely hand the advantage to the bears, signalling a potential downturn and invalidating the recent high of 53,301 as a false breakout. On the other hand, maintaining support above this zone could keep the bulls hopeful for another attempt to breach the recent highs.
Options traders might find a strangle short strategy appealing while the index remains confined within this range. This strategy could be profitable if the Bank Nifty continues to hover between 52,000 and 53,000. However, trending traders should remain patient, acting only when there is a clear breakout on either side of this range to capture the next directional move.
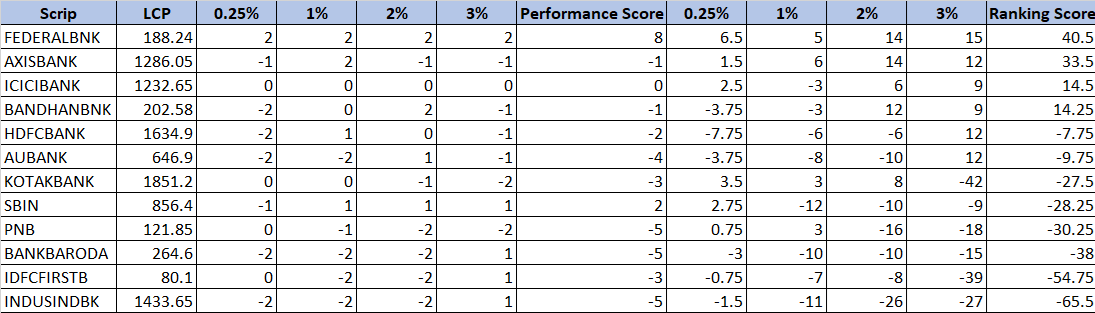
Federal Bank leads the table on the RS Matrix, followed by Axis Bank and ICICI Bank.
-
@Prashant Vaikunthe Thanks for following us

-
Since the pandemic-induced market in 2020, PSU banks have been on a remarkable run, consistently outperforming their private counterparts. The ratio chart of the Nifty Private Bank Index to the Nifty PSU Bank Index peaked in 2020, signalling a significant advantage for PSU banks over private banks during this period. Among the underperformers was the behemoth, HDFC Bank, which struggled to keep pace.
However, recent trends suggest a shift in momentum. The metaphorical elephant, HDFC Bank, has awakened, and private banks are beginning to regain footing. But how long can this resurgence last?
Nifty Pvt Bank/Nifty PSU Bank Ratio Chart
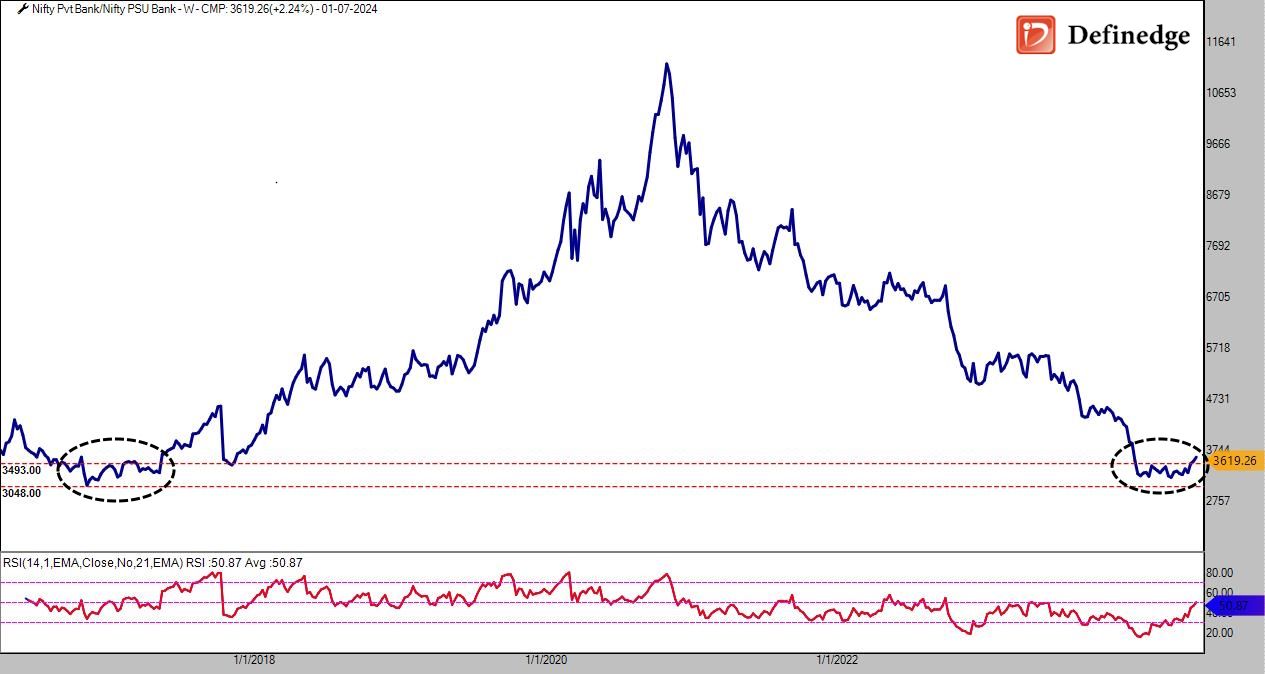
Source: TradePointAn analysis of the ratio chart reveals a promising development. The slope is turning northwards from the support zone established in 2016-2017, hinting that PSU banks may soon start to underperform relative to private banks. This trend suggests that now might be an opportune moment to refocus on private banking institutions.
Moreover, the RSI (Relative Strength Index) indicator adds to the optimism. It has turned positive and crossed above the median line of 50, a bullish signal indicating that private banks may outperform PSU banks in the coming months.
We ran the "All Chart Matrix" in RZone to check the stock trend on Multi-Chart and Multi-Timeframe.
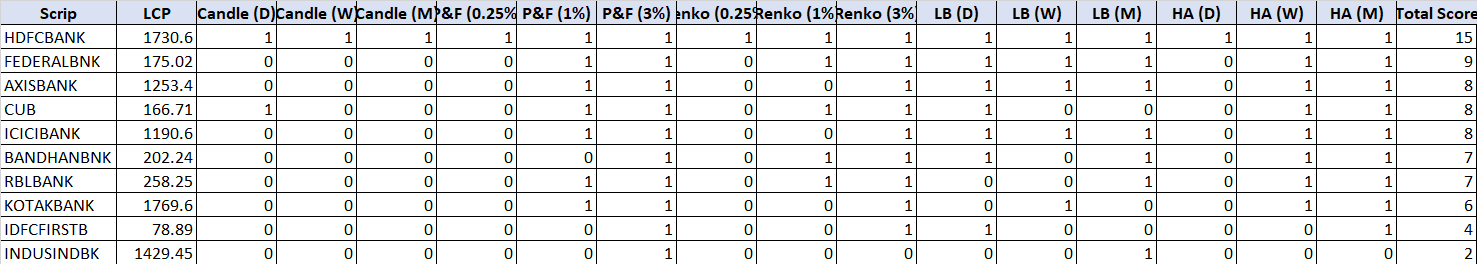
Source: RZoneIn conclusion, the four-year drought for private banks could be nearing its end. With favourable technical indicators and a shift in market sentiment, private banks appear poised for a potential resurgence.
-
Volumes are key important tool in technical analysis to identify the participation in the trend.
Read the conversation between Sachin and Raj and learn about the Volume parameters.
Click here to Read more.
-
Hey @Vishal Shah
It won't be long now, just a few more weeks and we will be Live!
We are combining the best features of TradePoint and Tradingview to give you the best trading experience. But you know, good things take time, right?

-
Sir, the data is up to 28th June (Friday) closing. The weekly chart shows the start of the week date, but the data on Saturday will be till the closing of the last trading day of the week.
-
@Shrikrishna D Sir, if you want to create the scanner in Candlestick, here it is:
You can run the Candlestick scanner and find the stocks. This is up to 14:25 on 28-06-2024.

-
@Vishal Shah Happy Trading Sir!
-
@Vishal Shah @Vishal Shah Got your point.
You can do this:
- Add RSI - Use RSI Above Value > Write 60 for Period "0"
- Add RSI - Use RSI Below Value > Write 60 for Period "1"
In Expression: Write 1 and 2'
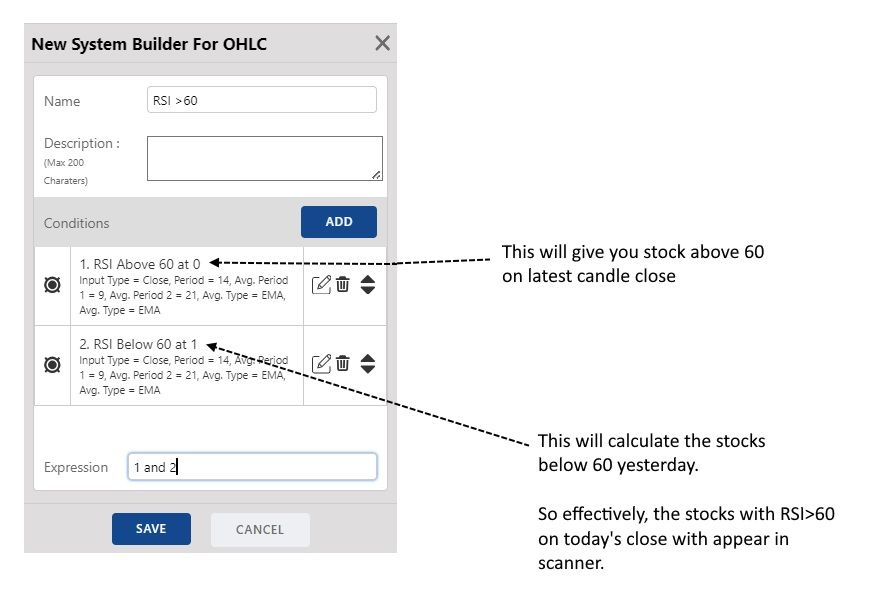
This will scan the stocks which are above 60 in the current candle.
You can follow this for other indicators as well.
I hope this answers your query.
-
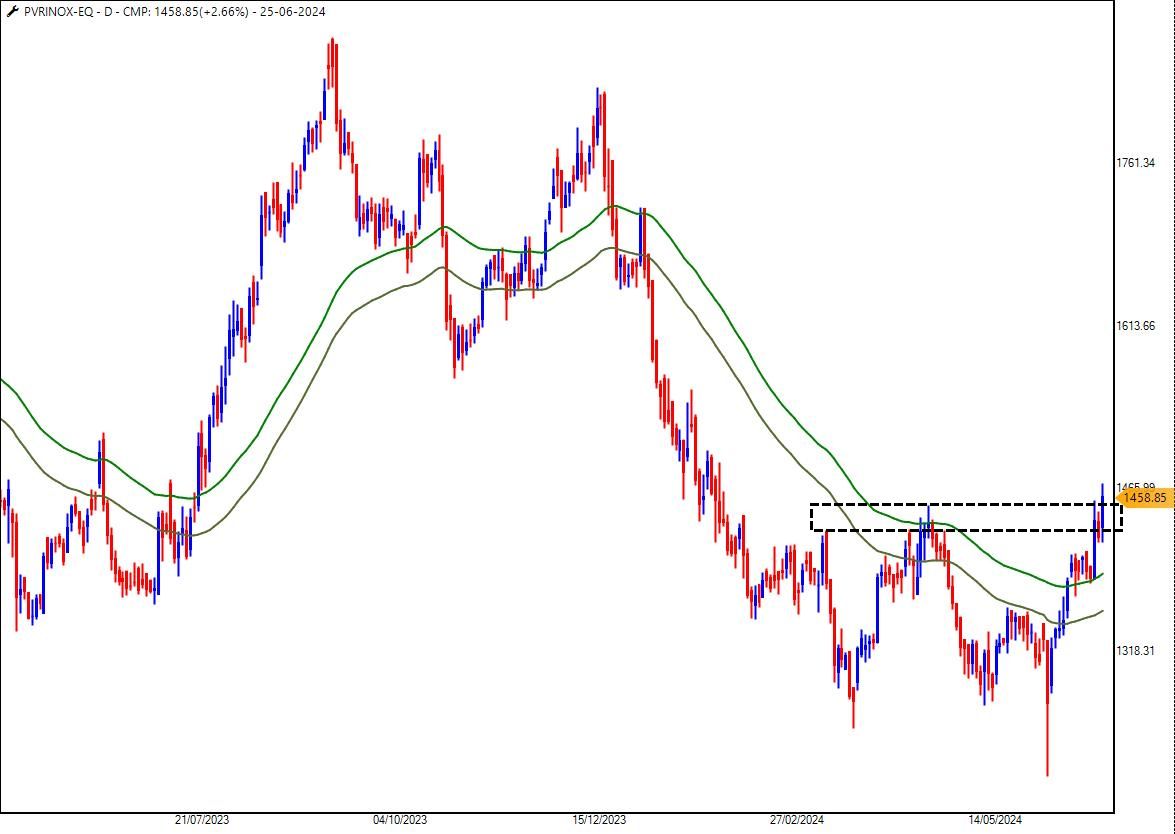
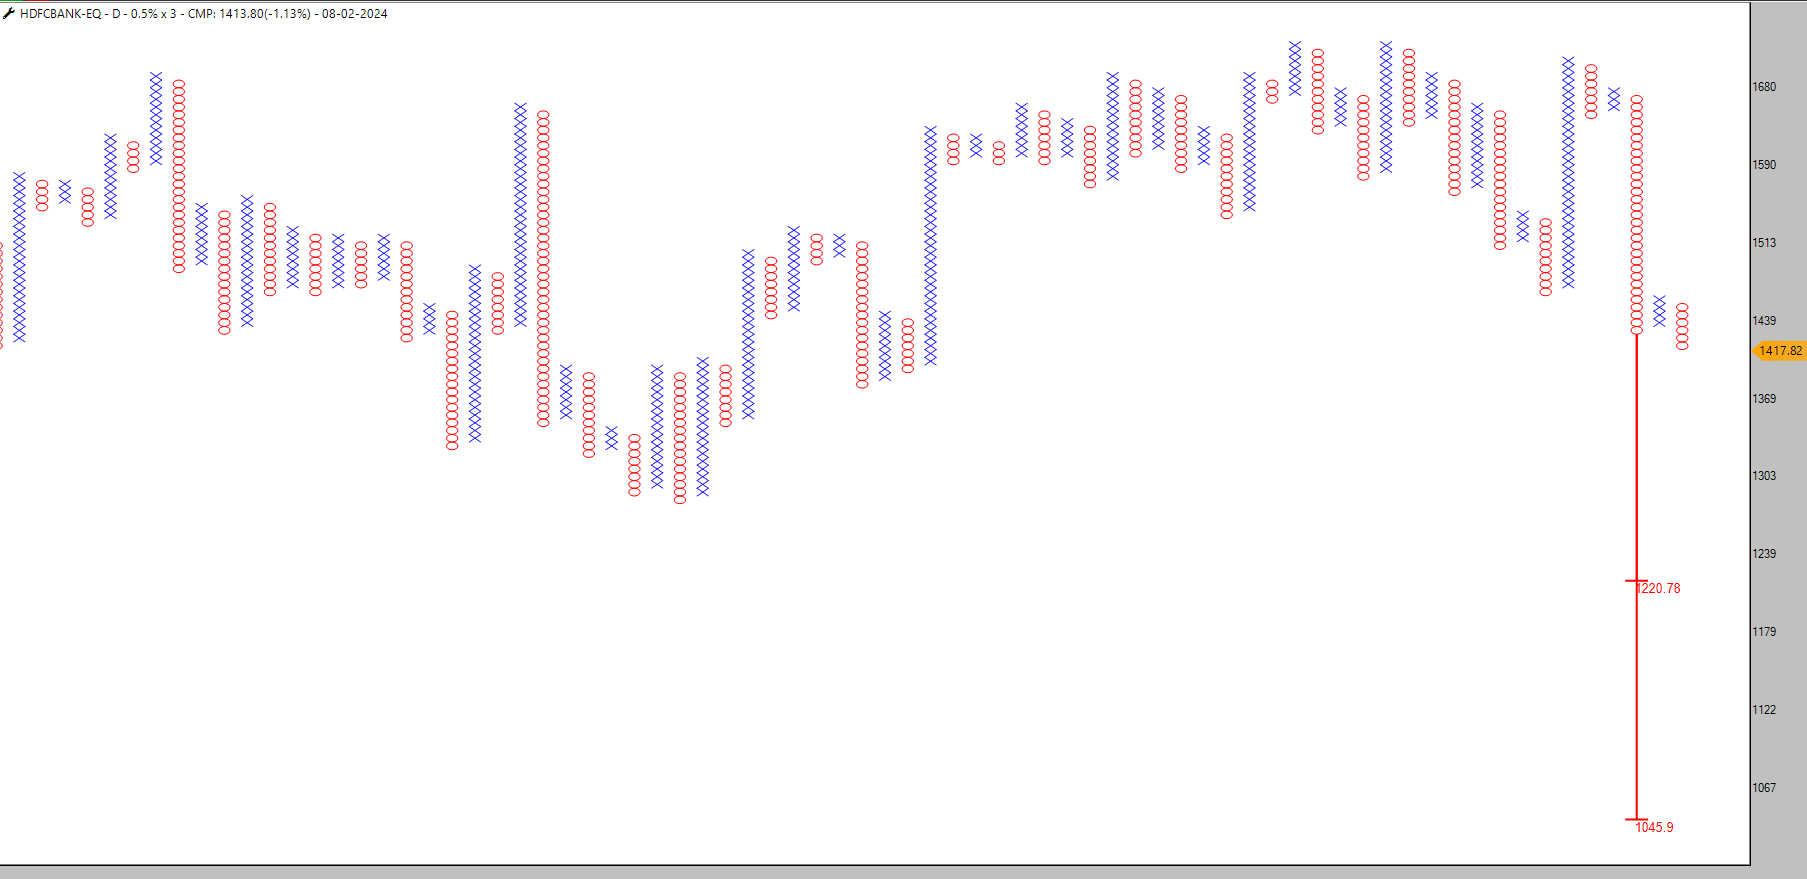
Recent low - 1415
-
@Madhurjya Nath Hey, do you want system only with RSI > 60 and RSI < 40?
I request you write in detail about your system. We can try and create it. Or request you to share your client code, our team will call you.
-
Discover the Weiss Wave technical analysis concept, an advanced method for understanding market trends through cumulative price and volume analysis. Learn about its origins, components, applications, benefits, and limitations to enhance your trading strategies.
-
@Madhurjya Nath You can create a system for Bearish now.
Happy Trading!
-
@Shrikrishna-D check this if you are looking for it. This is only Bullish Crossover criteria.
Also, do check the setup of these stocks from Nifty200 as per closing of 25-06-2024:

-
GM Sir, there has been a lot of spam recently. Our team is working to stop such activities.
-
Do you mean to say RSI Bullish Crossover ABOVE 60 and Bearish Crossover BELOW 40?
-
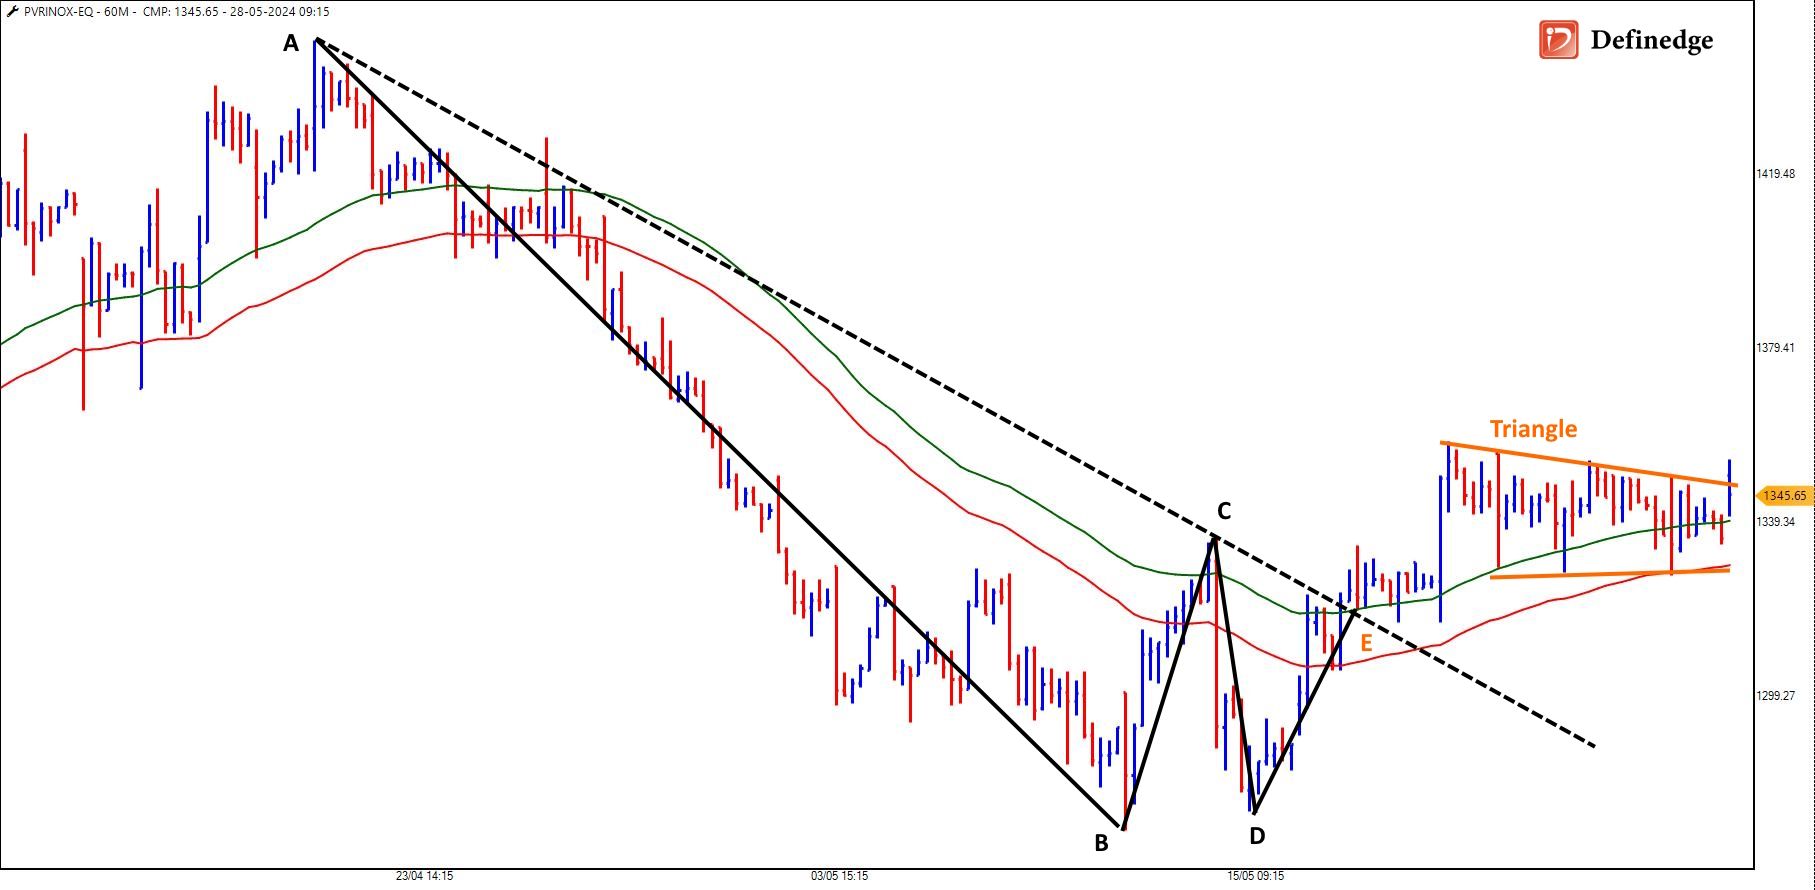
I had my eye on PVR in mid-June when my 62-DEMA Channel scanner flagged the stock.
Today's price action confirms a bullish breakout above the prior high, solidifying the unconventional triple-bottom pattern. The close above 1451 will confirm the breakout.
-
The VOLAR score, or Volatility-Adjusted Return, is a metric used to evaluate the performance of an investment by adjusting its returns for volatility. This score helps investors compare the risk-adjusted performance of different assets or portfolios.
The VOLAR score is calculated by dividing the return of an investment by its volatility, which is typically measured as the standard deviation of returns.
Volar Score = Return/Volatility
A higher VOLAR score indicates better performance on a risk-adjusted basis, meaning the investment provides higher returns for a given level of risk.
This metric is useful for investors who want to assess not just the absolute returns of an investment but how those returns compare to the risk taken to achieve them.
-
Many traders assess their trades solely based on the outcomes, which can lead to poor decisions and emotional distress. It’s important to recognize that a profitable trade isn’t always a good trade, and a losing trade might still be a well-executed one.
Consistent success in trading hinges on grasping and applying solid trading principles rather than obsessing over the financial result of each trade. By concentrating on the process and making every trade "One Good Trade".
-
@Deepakk Chabria Let me think.
-
The SPEED of a trend in the stock market refers to the rate at which the price of an instrument moves in a specific direction.
A high speed in a trend indicates strong momentum, often driven by robust market sentiment, significant news, or macroeconomic factors and an active participations indicated by volumes.
When a trend's speed diminishes, it can signal weakening momentum, suggesting that the driving forces behind the trend are losing strength. This deceleration often precedes a trend reversal, as market participants start to doubt the sustainability of the movement, leading to increased profit-taking and the entry of contrarian traders.
In the book "How to Trade Financial Markets Logically" by Ruben Chaves, he explains the theory of Speed.
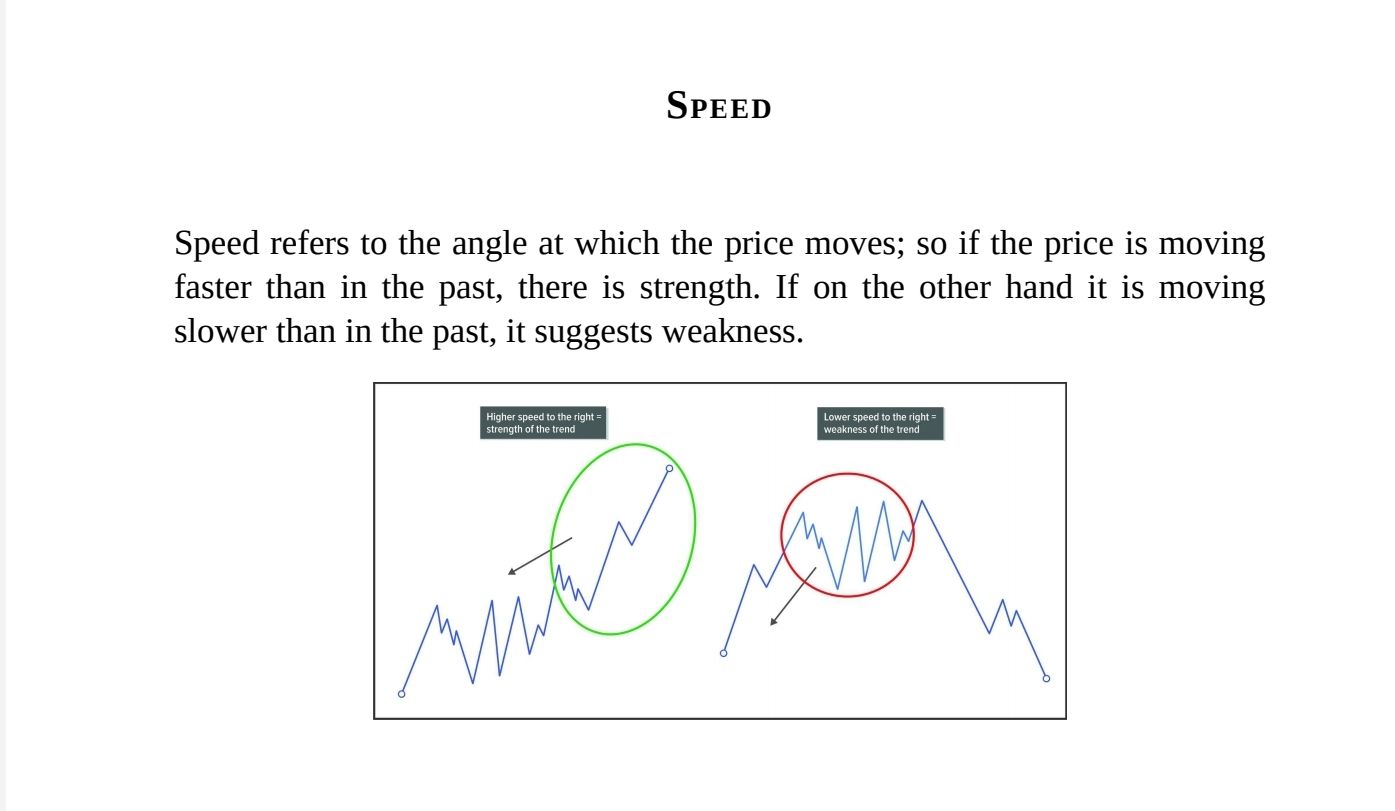
The above is a snapshot about the Speed from his book, but he has highlighted in-depth information about Speed and the strength of the trend.
While reviewing the chart of Maruti, I recalled this theory and thought to share it with our readers.
Here is the chart of Maruti.
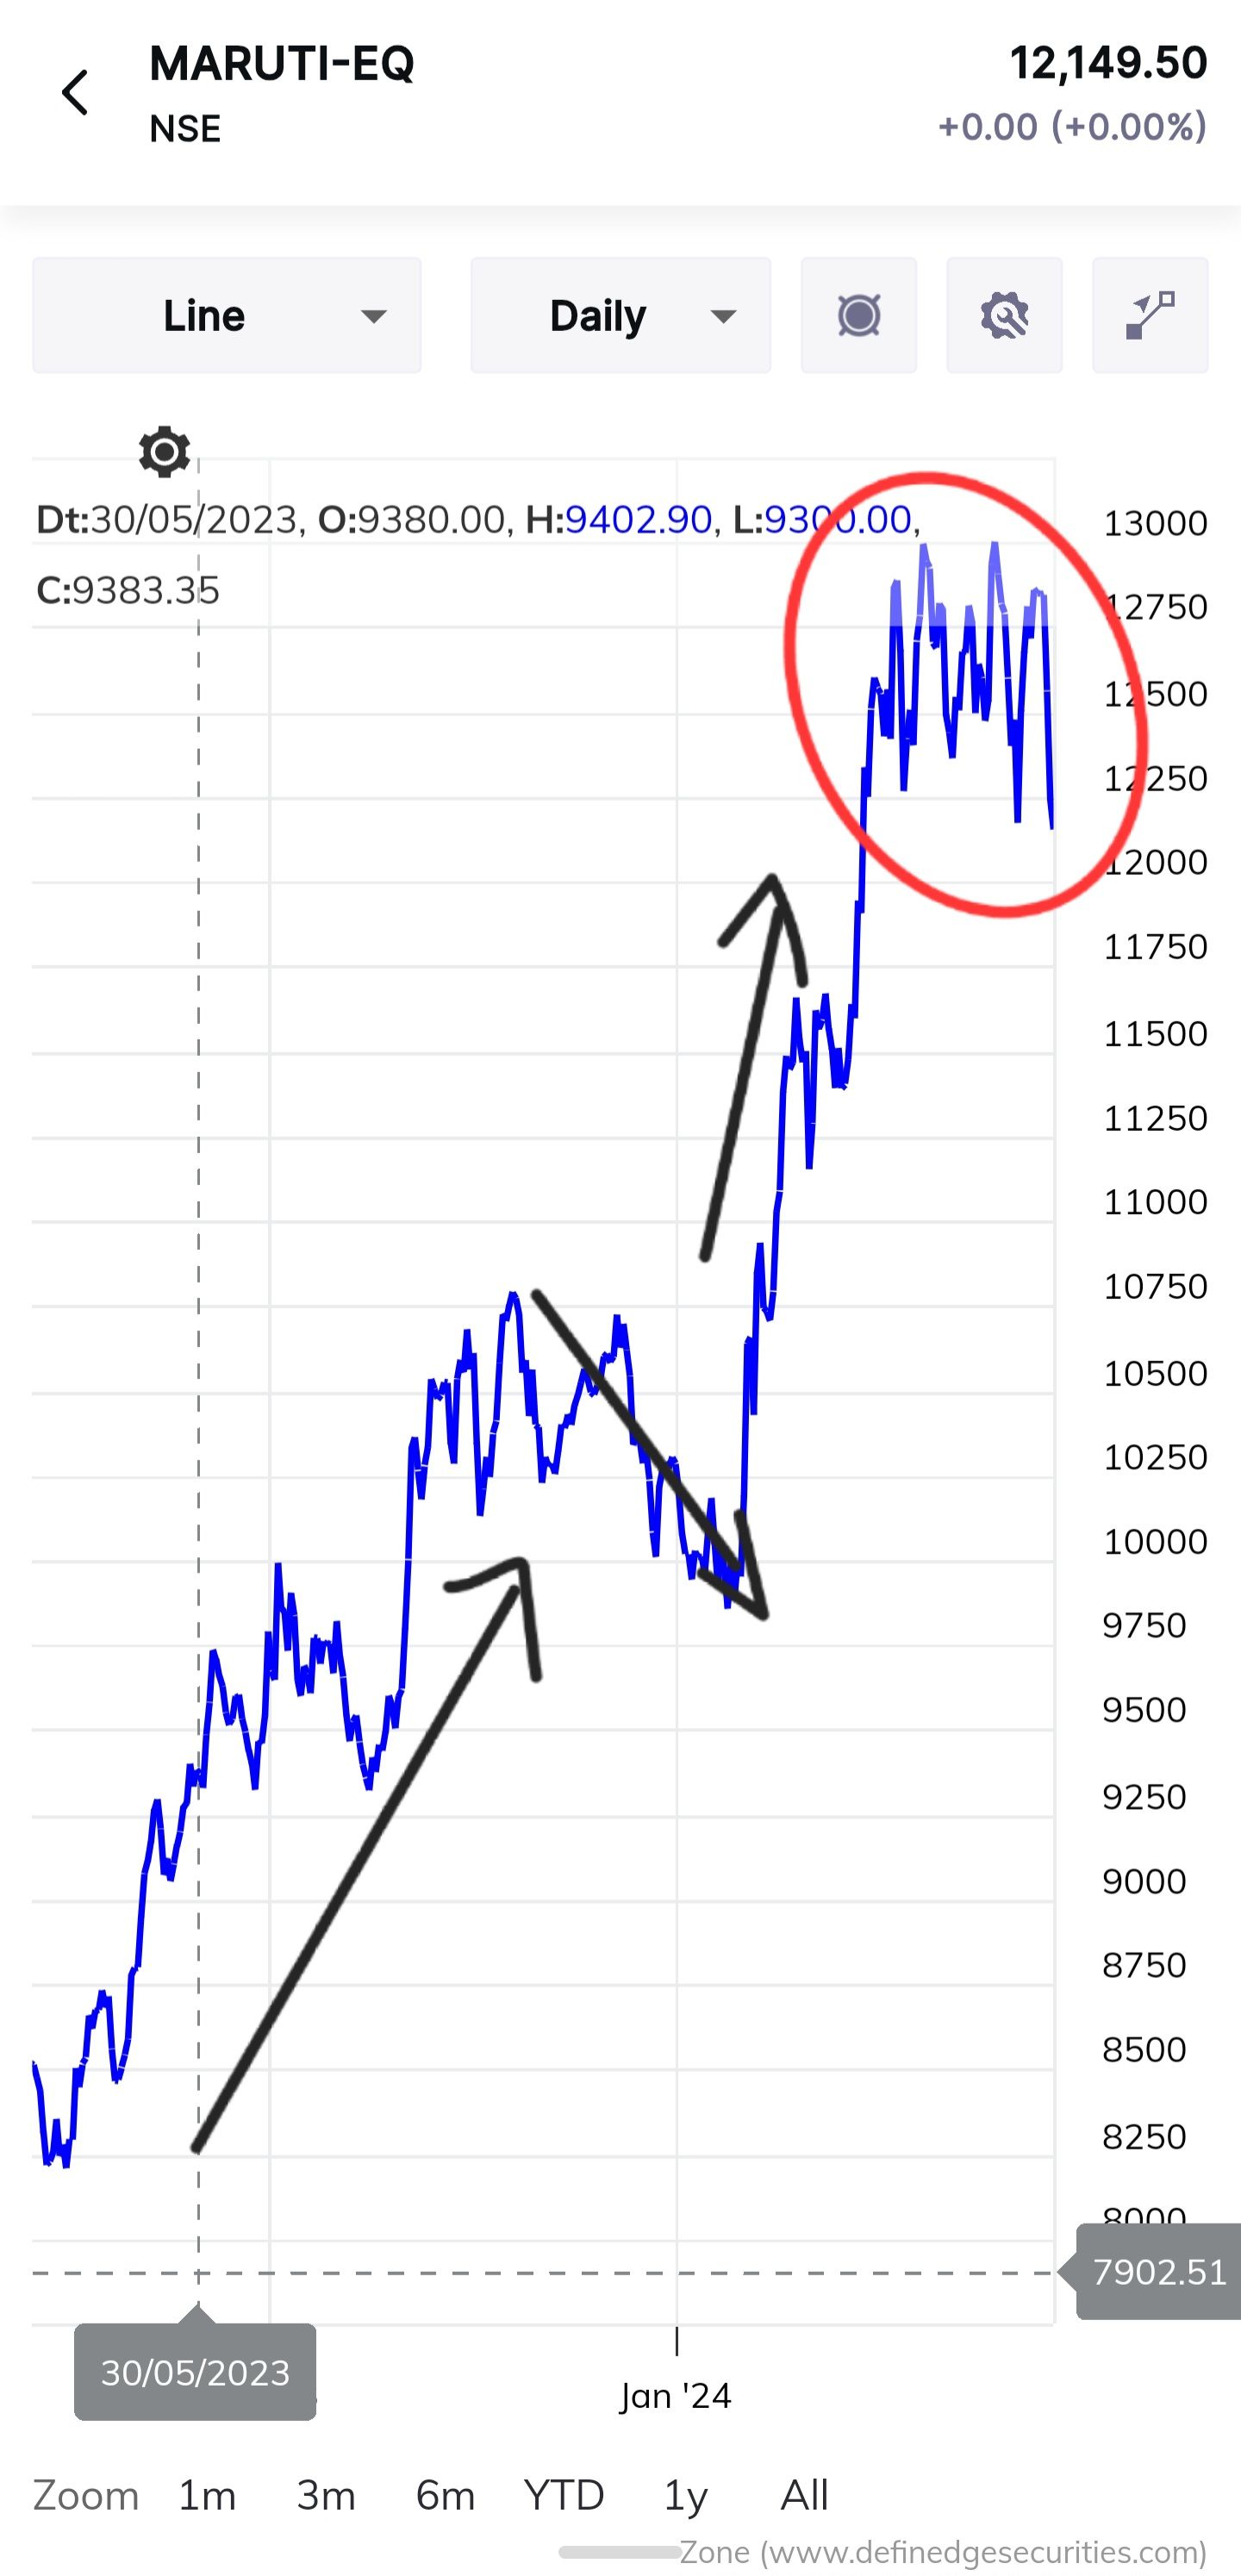
Source: Zone Mobile AppThe speed of the trend has been followed by an even stronger trend after a retracement.
However, the stock's recent lackluster momentum in the past few months is concerning as it lacks the speed of the trend.
Is this sign of the reversal?
In light of the Wyckoff pattern, the structure appears to indicate a distribution phase.
Fingers crossed for the investors in Maruti.
-
Hi Sir, if you open it from the scanner, it will just open the default chart without any setup.
You are running a scanner, its not a chart template.
-
Good morning, traders. Do you begin each day by checking the Gift Nifty and planning your trading strategy accordingly?
If so, you are not alone.
Many traders rely on the Gift Nifty overview to make informed decisions about their trades.
Now, with the Zone Mobile App, you can have the Nifty overview right at your fingertips and plan your trades a day prior.
Read all the analysis on Nifty with few clicks.
Open Zone Mobile 》Go to Scanner 》 Nifty Analysis
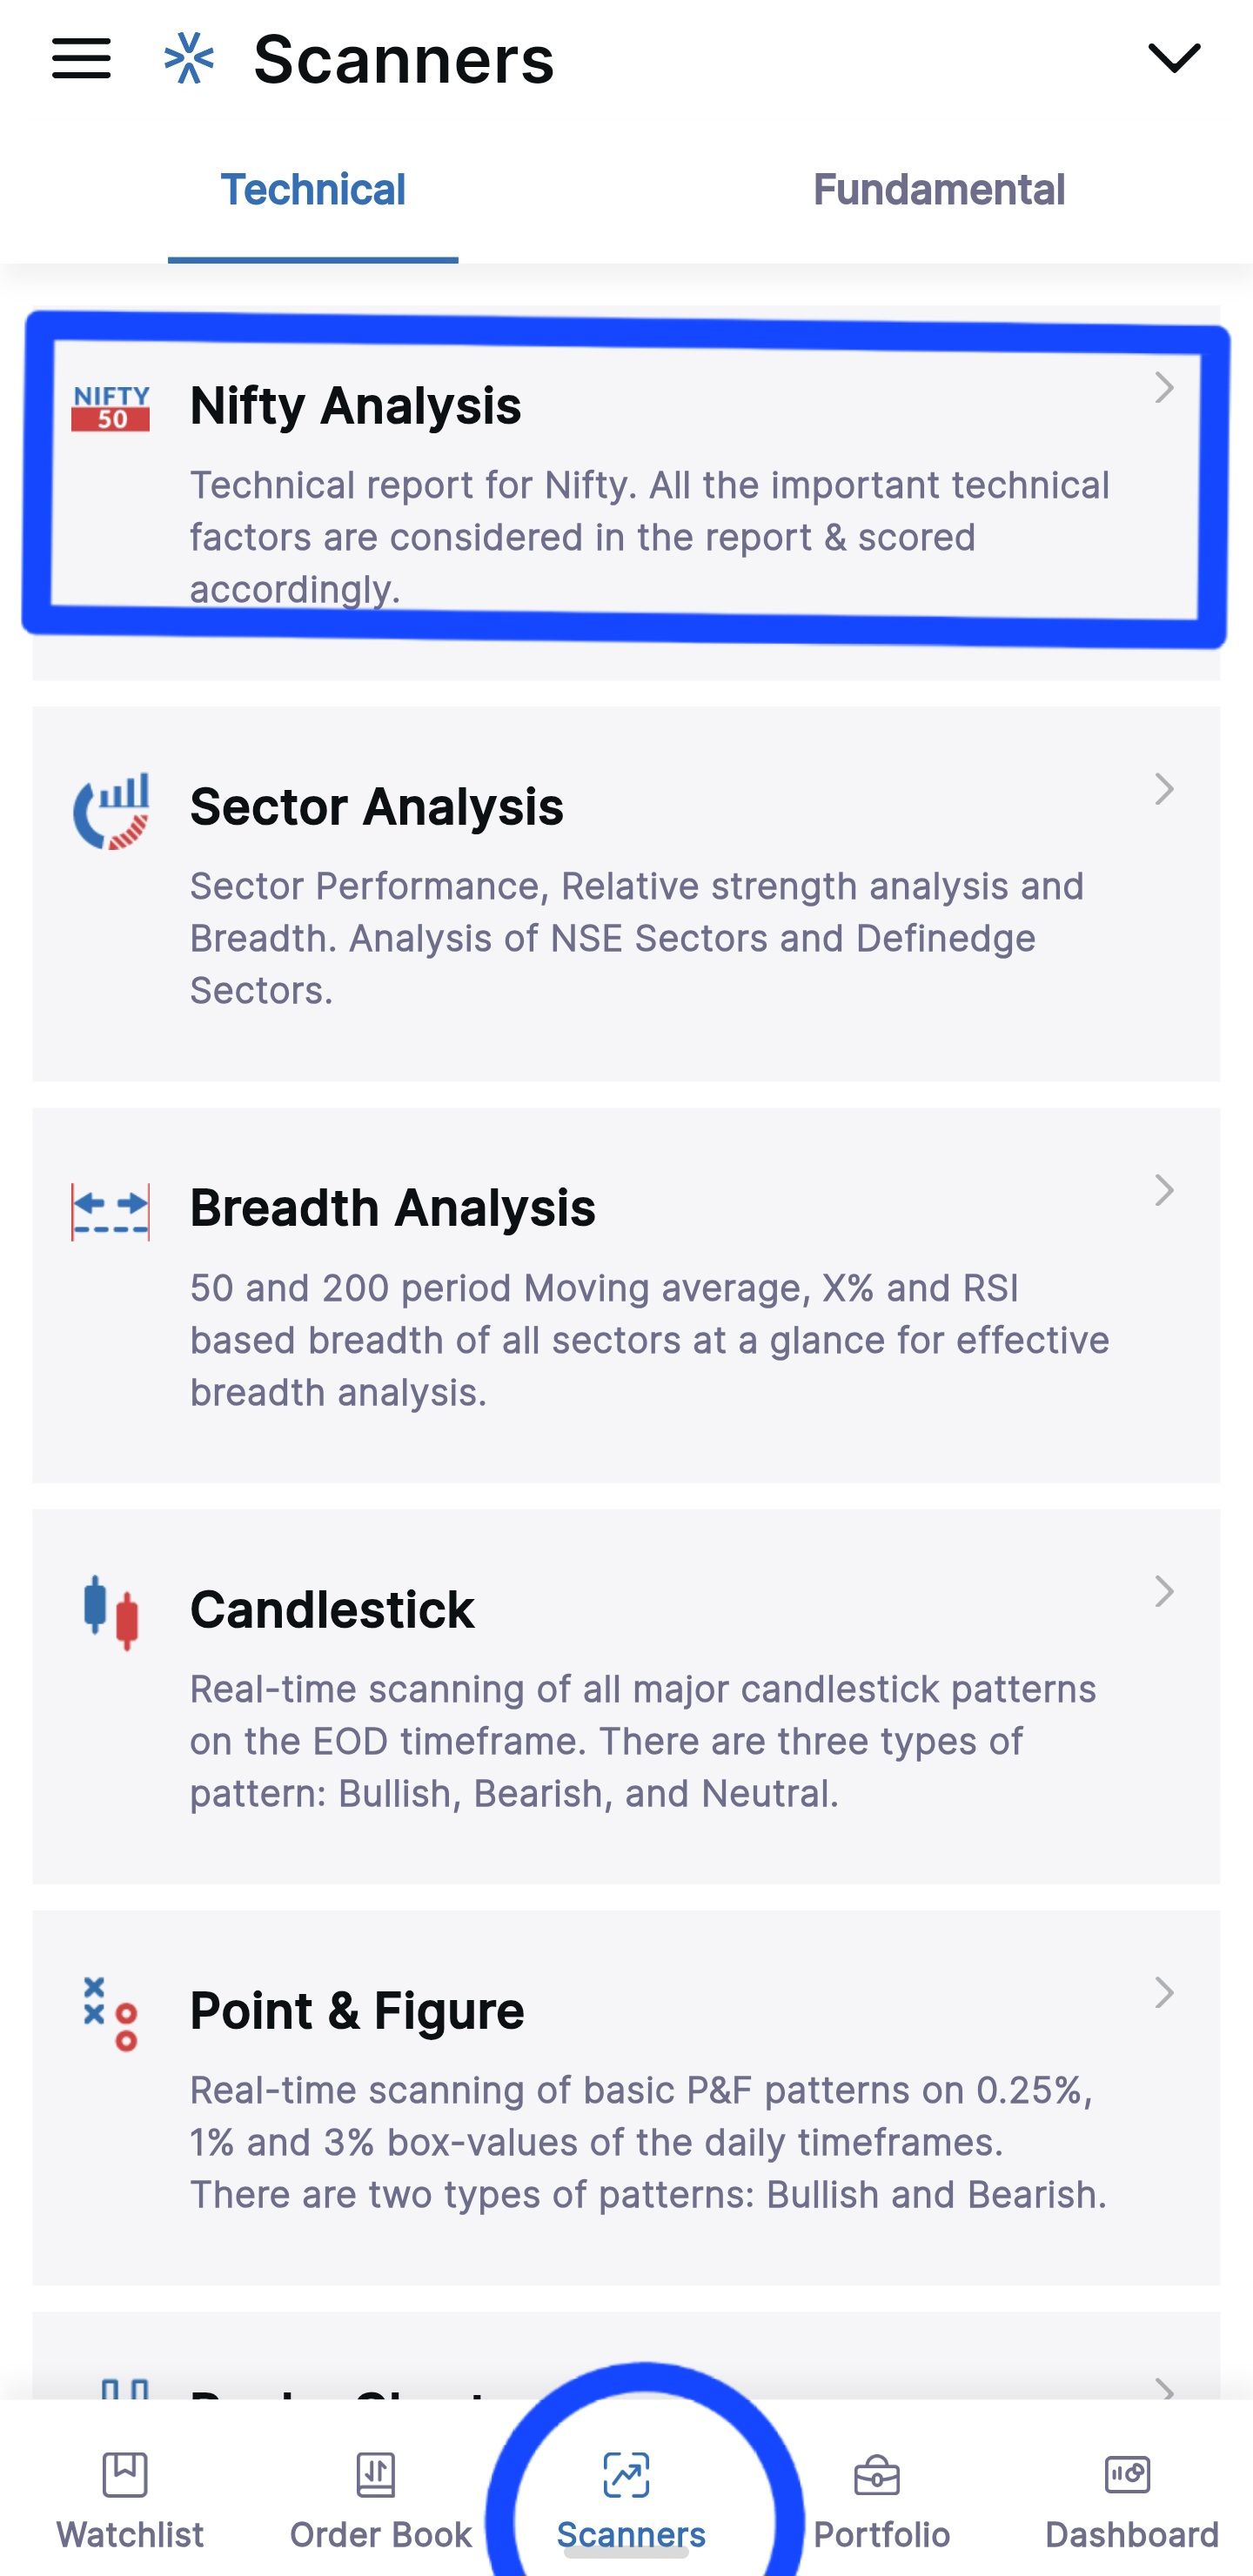
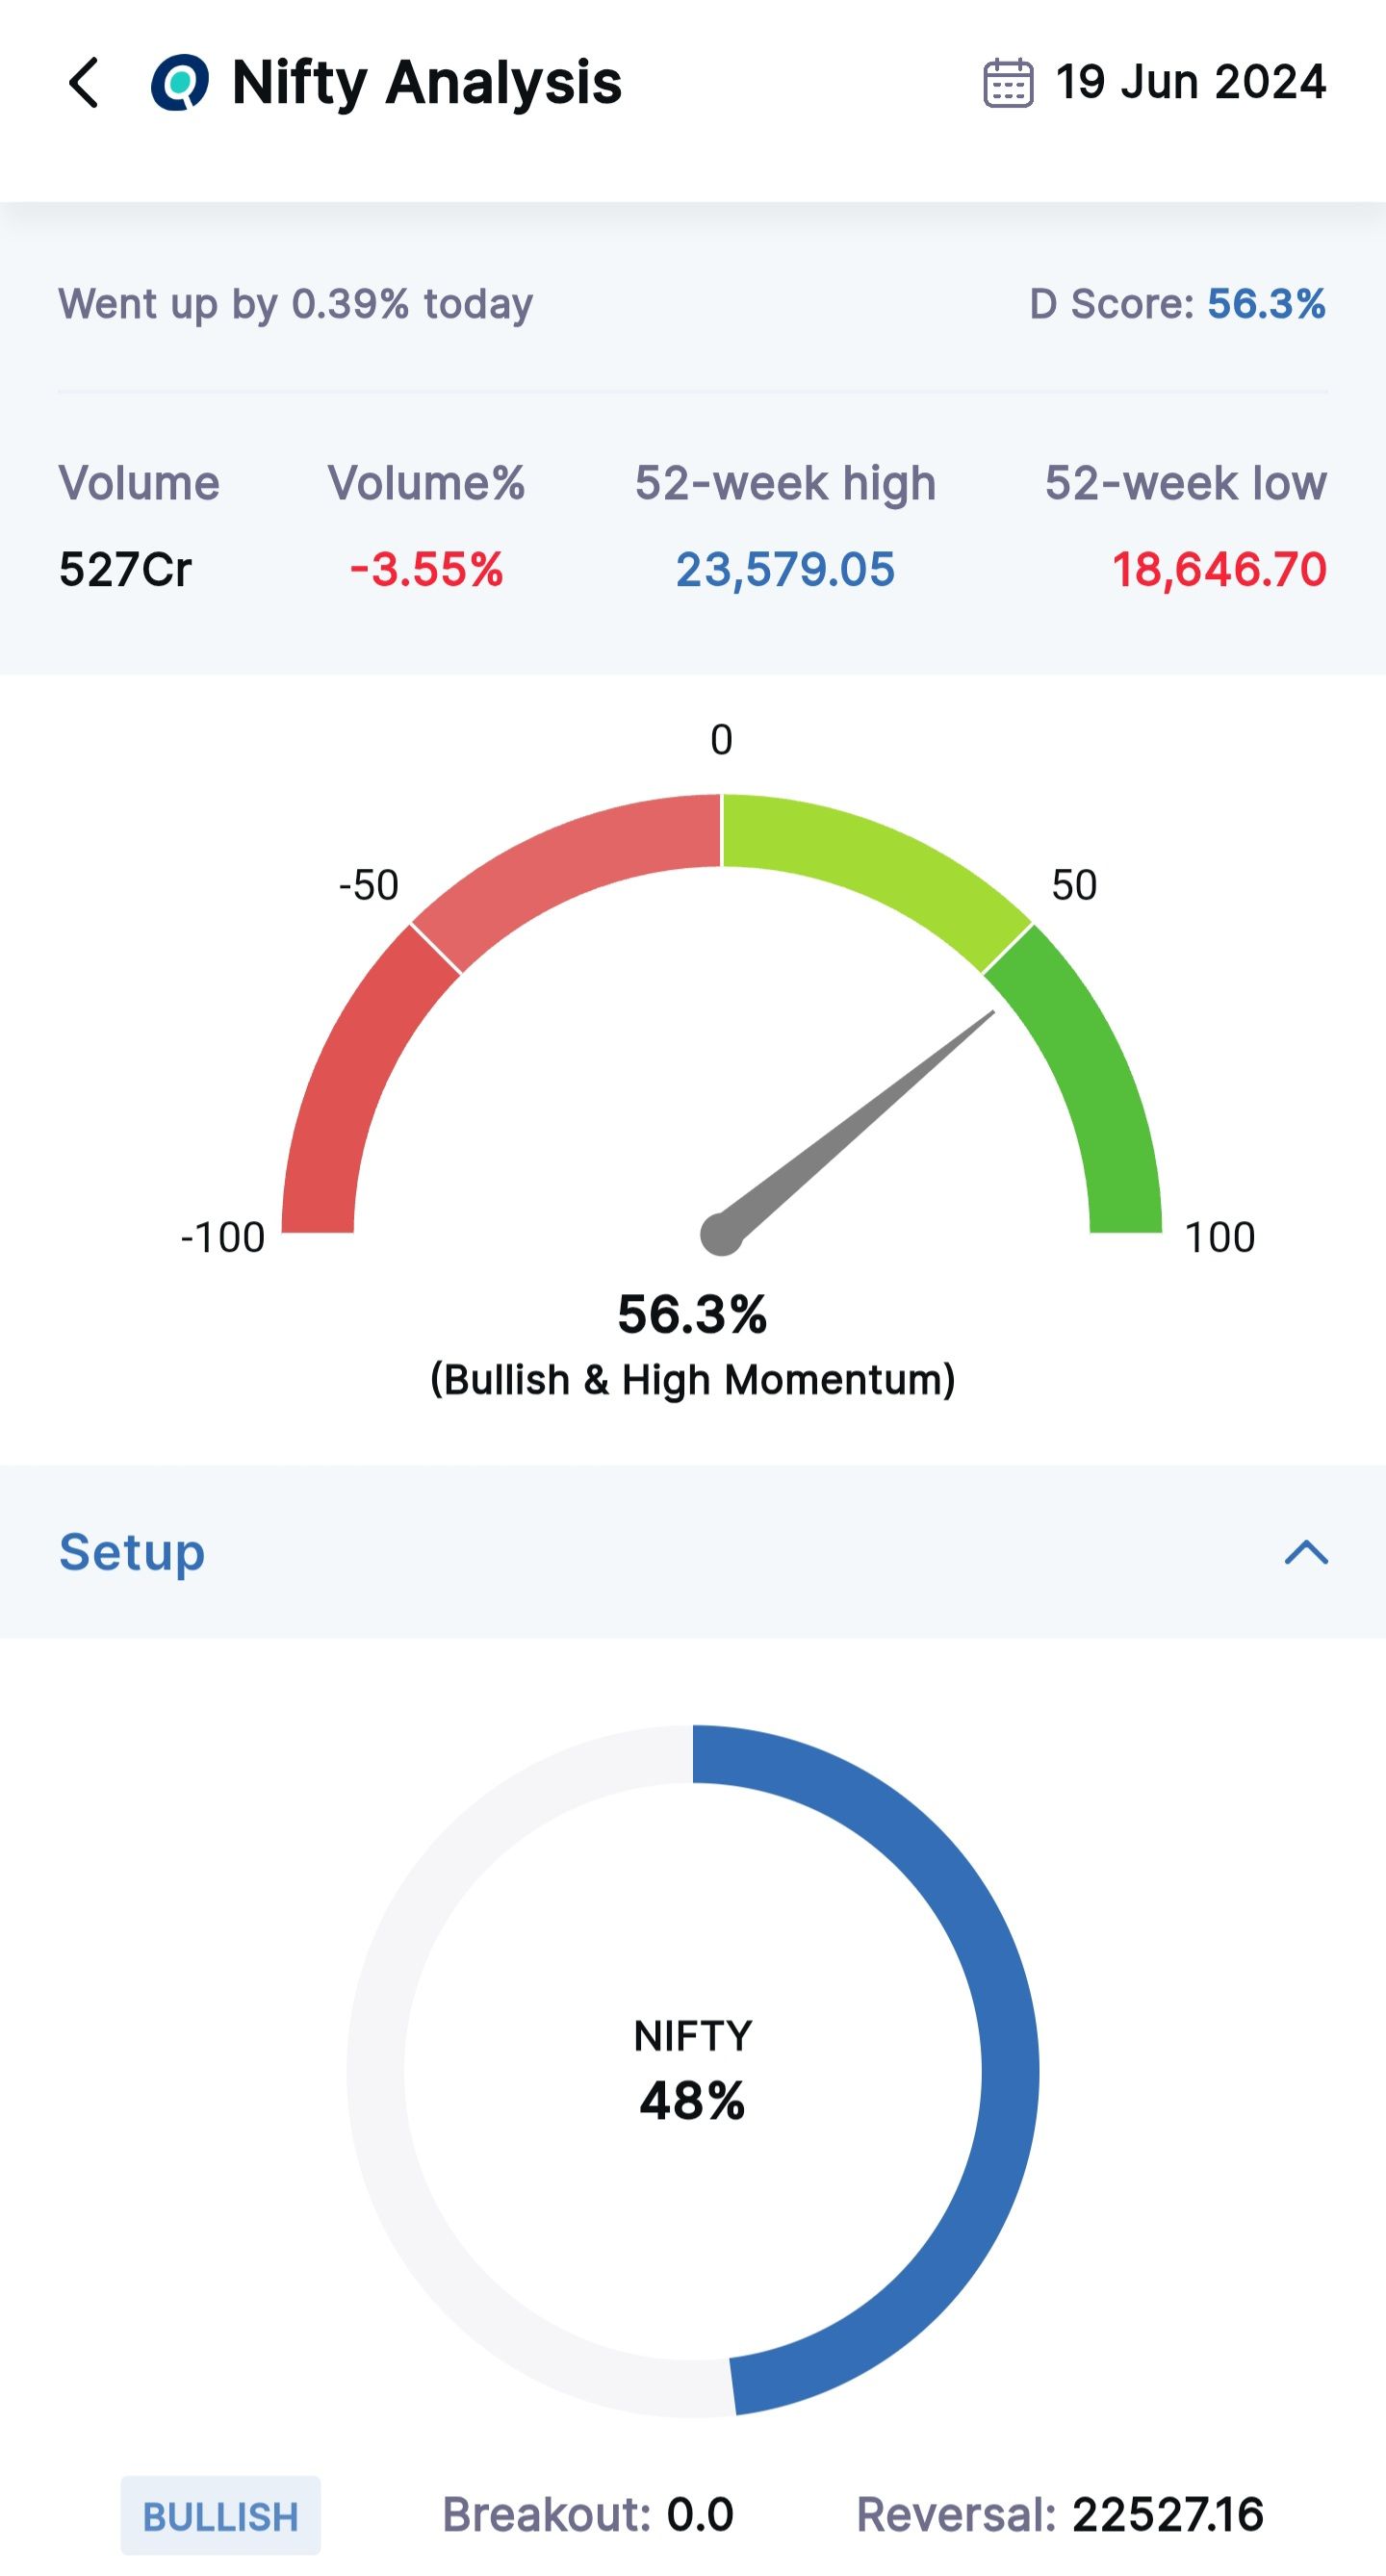
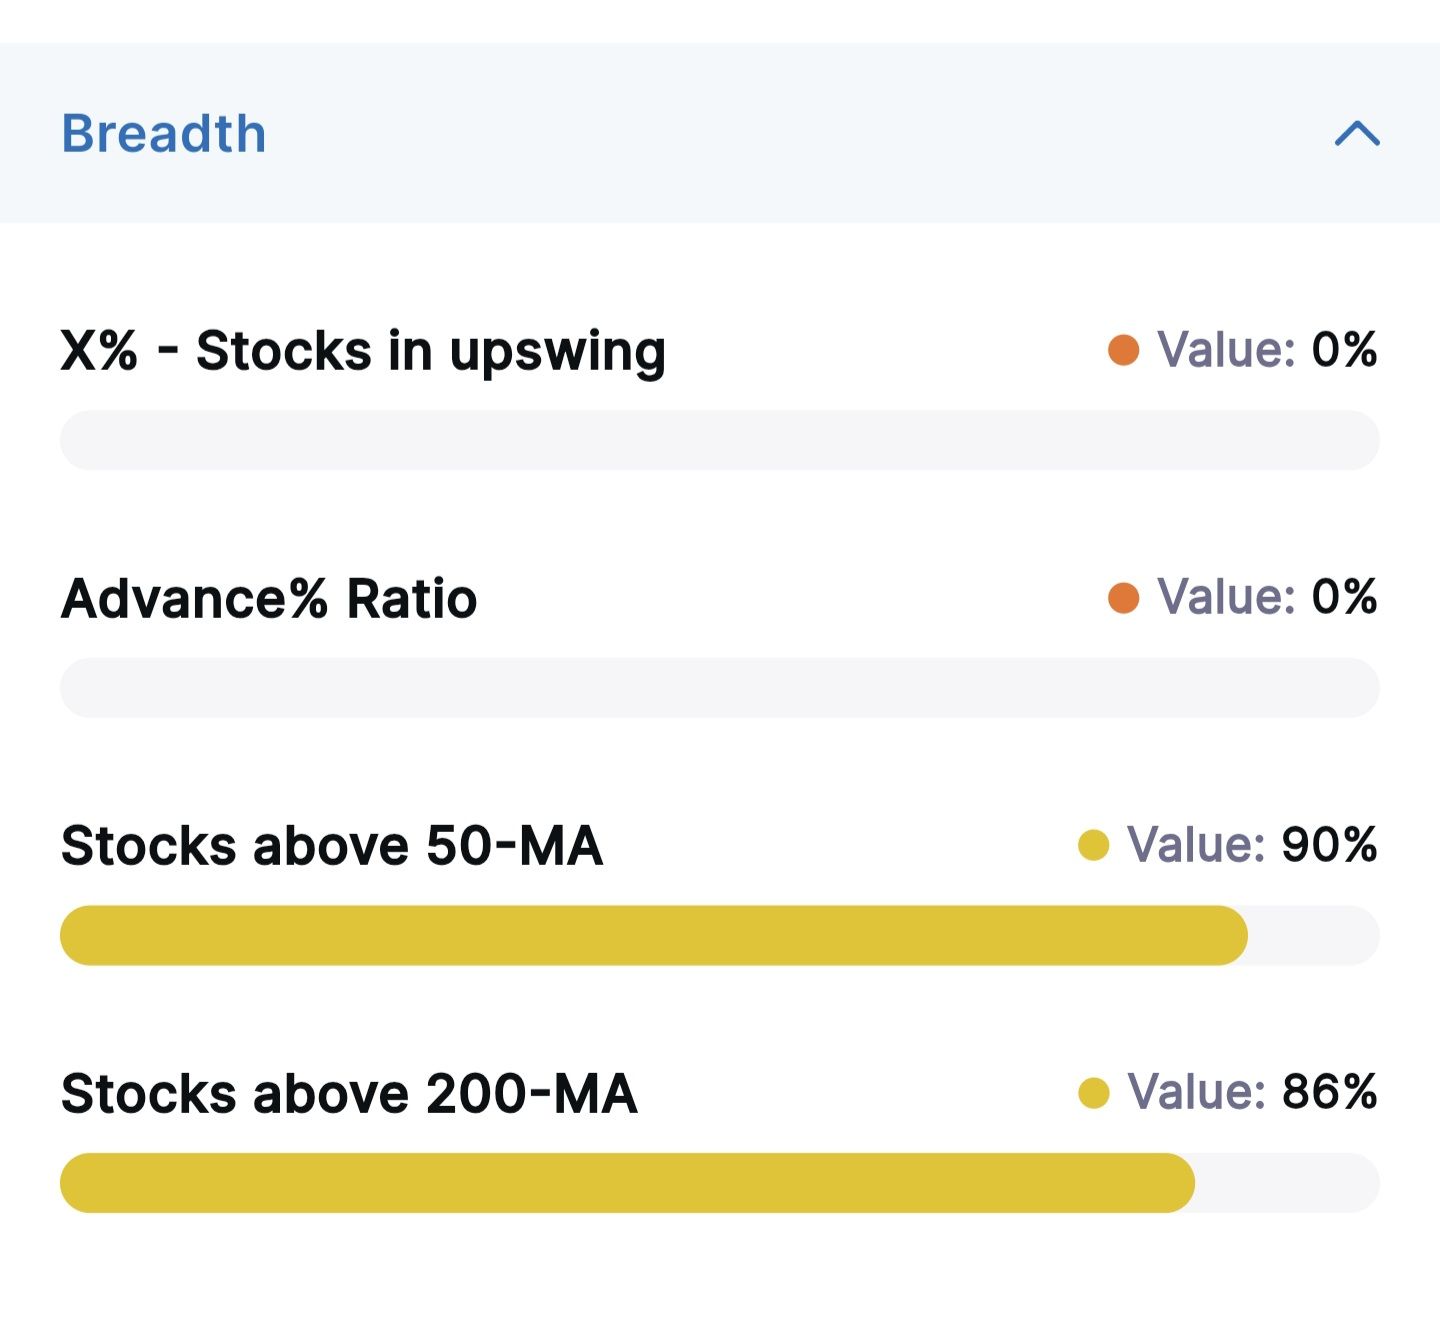
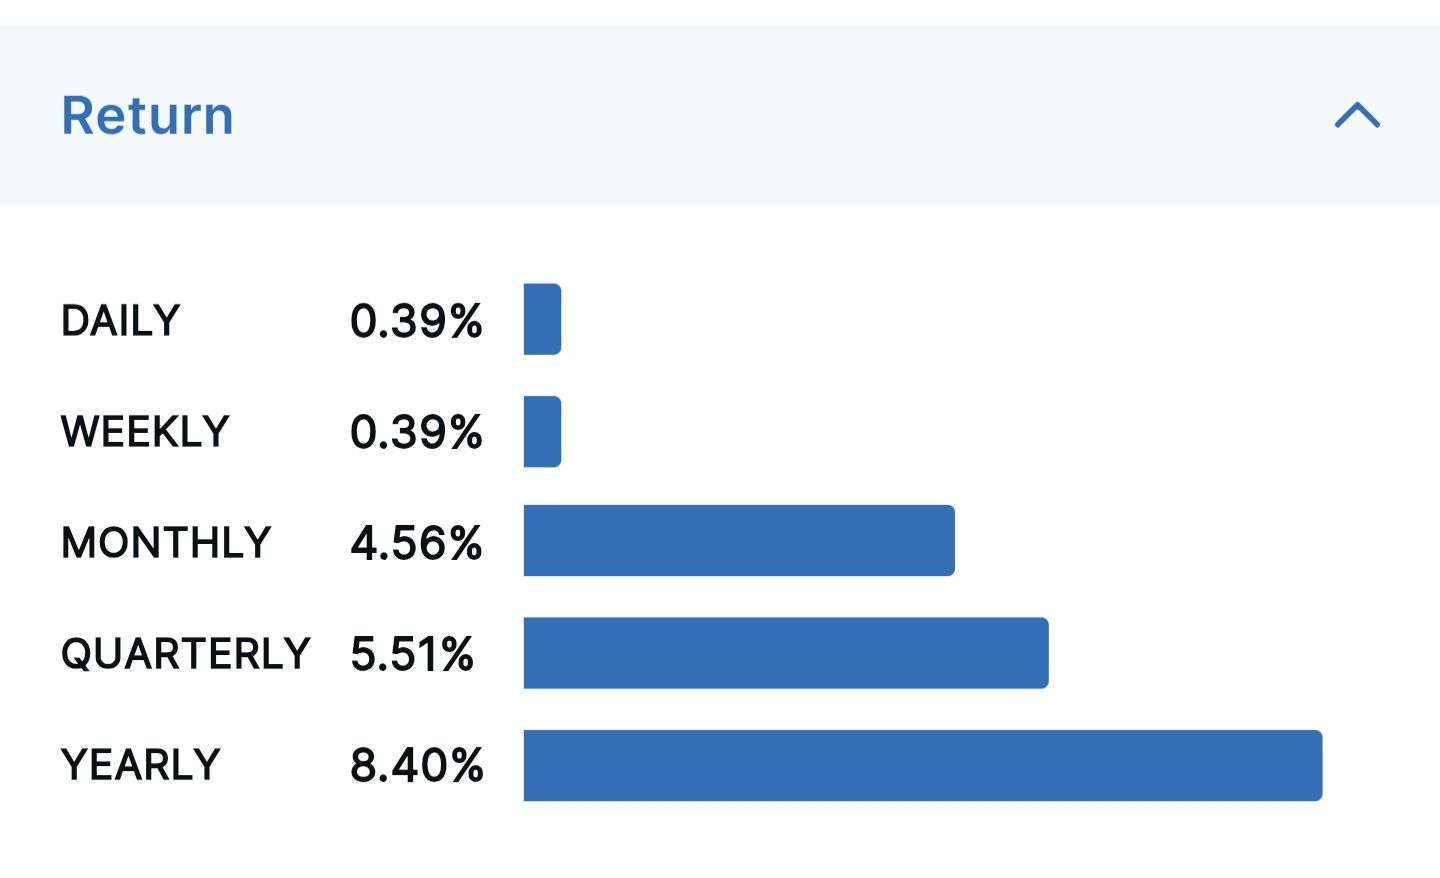
Here is Nifty Analysis for you.
-
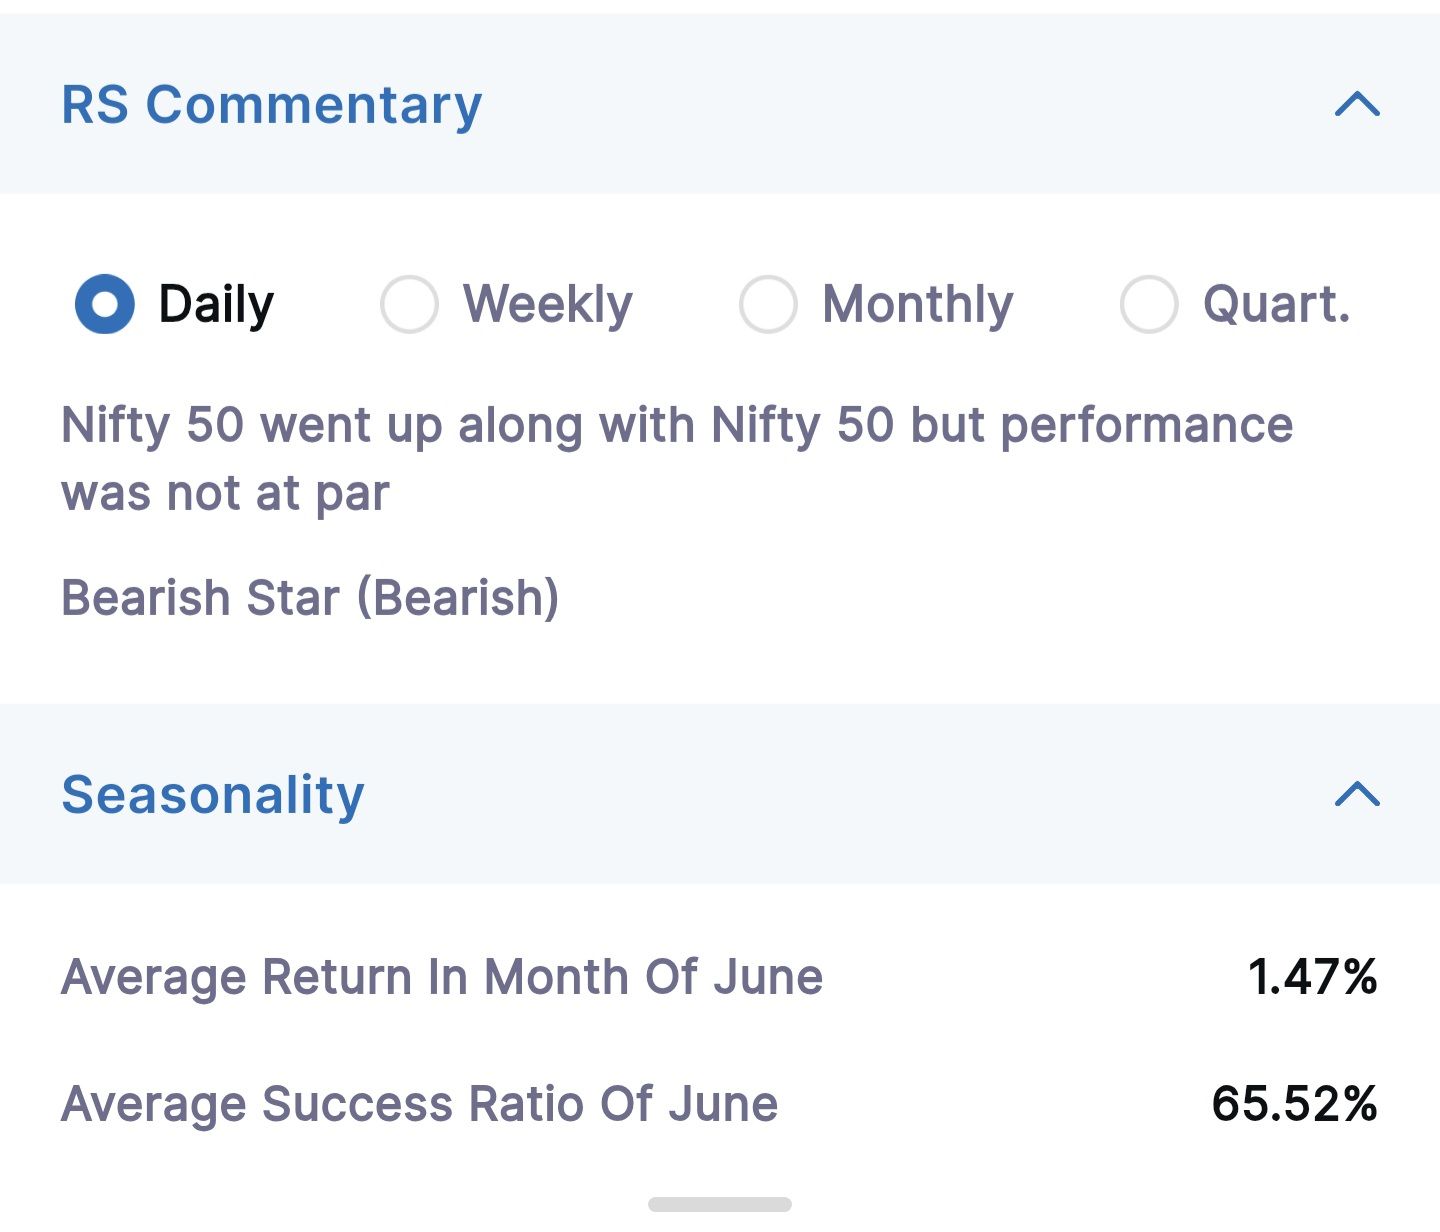
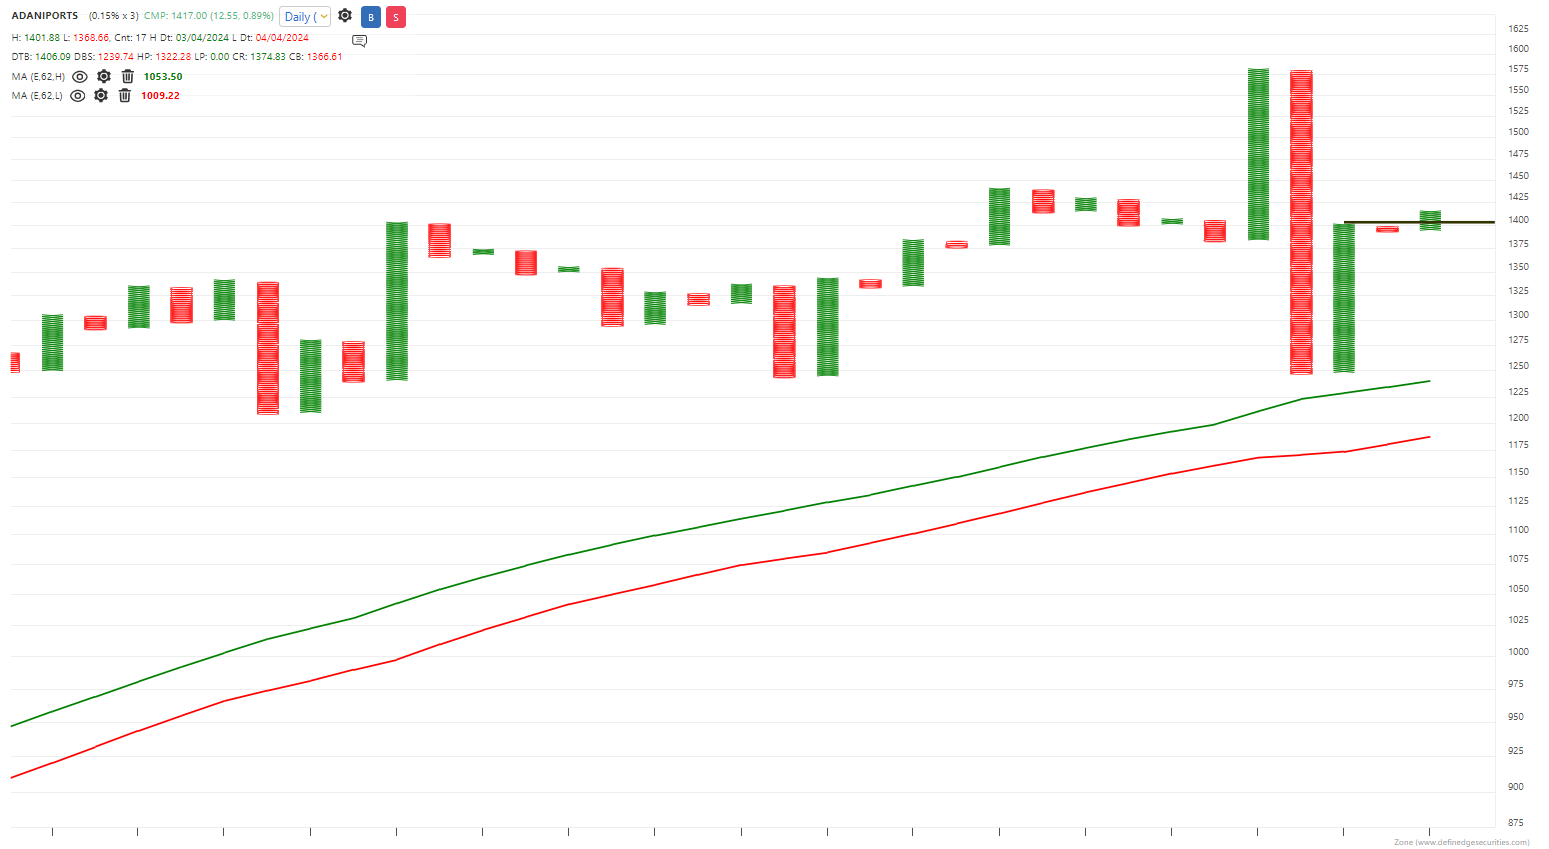
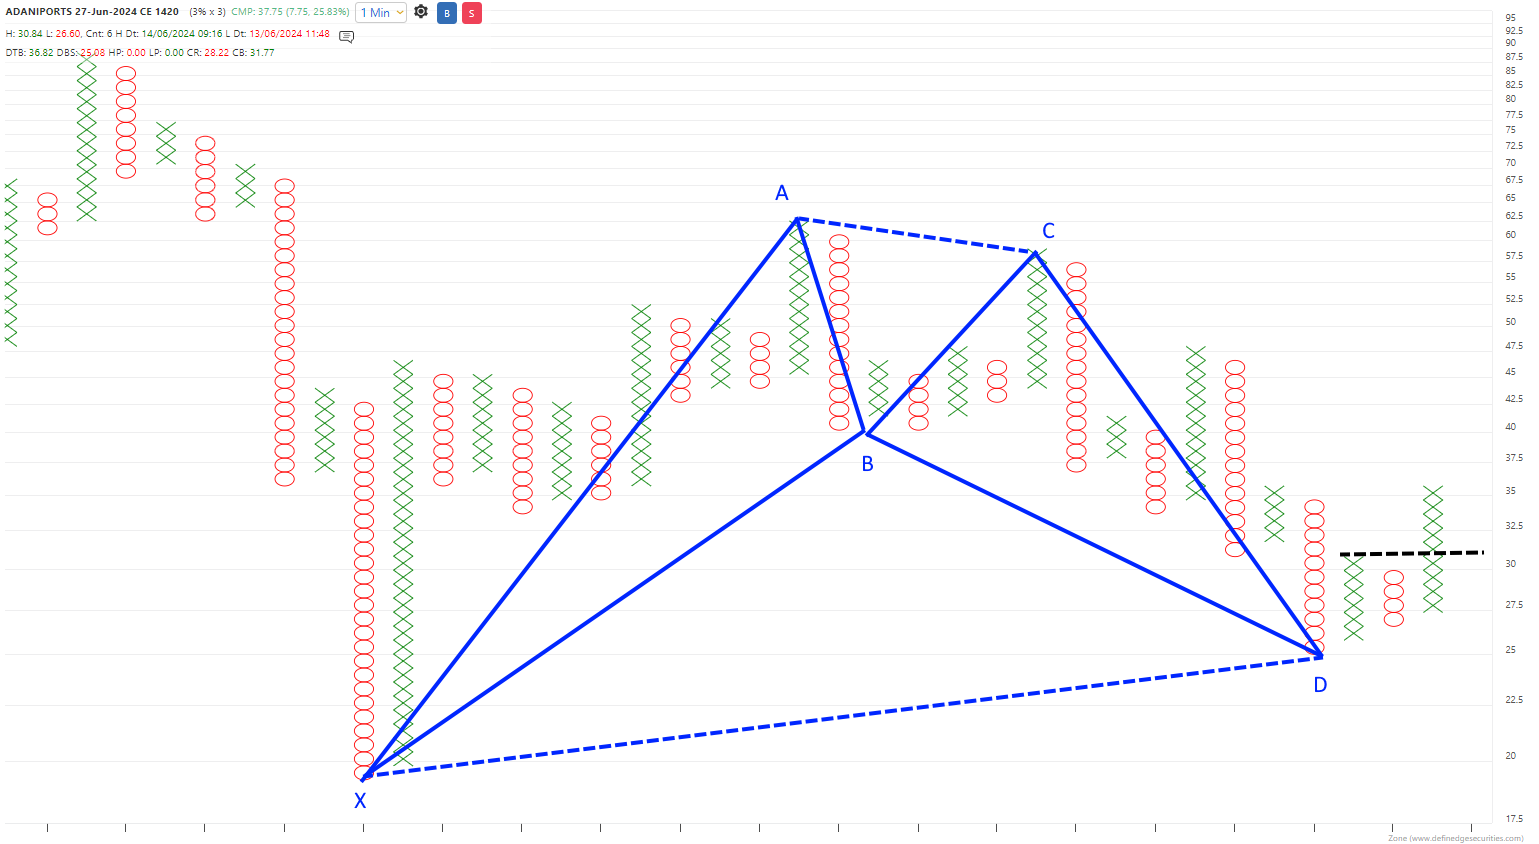
On the Adani Ports, 0.15% X 3 Daily chart - the stock has just broken out of the follow-through anchor column (AFT) while on the 1420CE chart of 3% X 3 on 1min chart, the Bullish Bat Harmonic pattern is visible.
Adani Ports Daily Chart
Adani Ports 1420CE Chart
-
Understand the role of trading volume in the stock trend. Learn why the first hour's volume is important, how rising volume above the 20-bar average indicates trending stocks, and how to leverage RZone for intraday and swing trading opportunities.
Read here: https://www.definedgesecurities.com/blog/rzone/why-volumes-are-important-in-trading/
-
This indicator is designed for daily analysis, not intraday trading. I used data from the previous day (value of 1) for this example. You can use a value of 0 to analyze current day data. However, it's important to remember that this analysis isn't suitable for making intraday trading decisions and may not be ideal for the Trividh strategy.
-
@Vishal Shah Check the link below and follow the steps.
https://www.definedgesecurities.com/blog/zone-web/zone-web-how-to-set-default-chart-template/
-
Trividh - The Options Strategy highlights the Federal Bank 173CE in today's trading session at 11:15am (attached image).

Many traders have doubts about when to enter the trade. I always suggest waiting for the follow-up breakout above the Anchor Col.
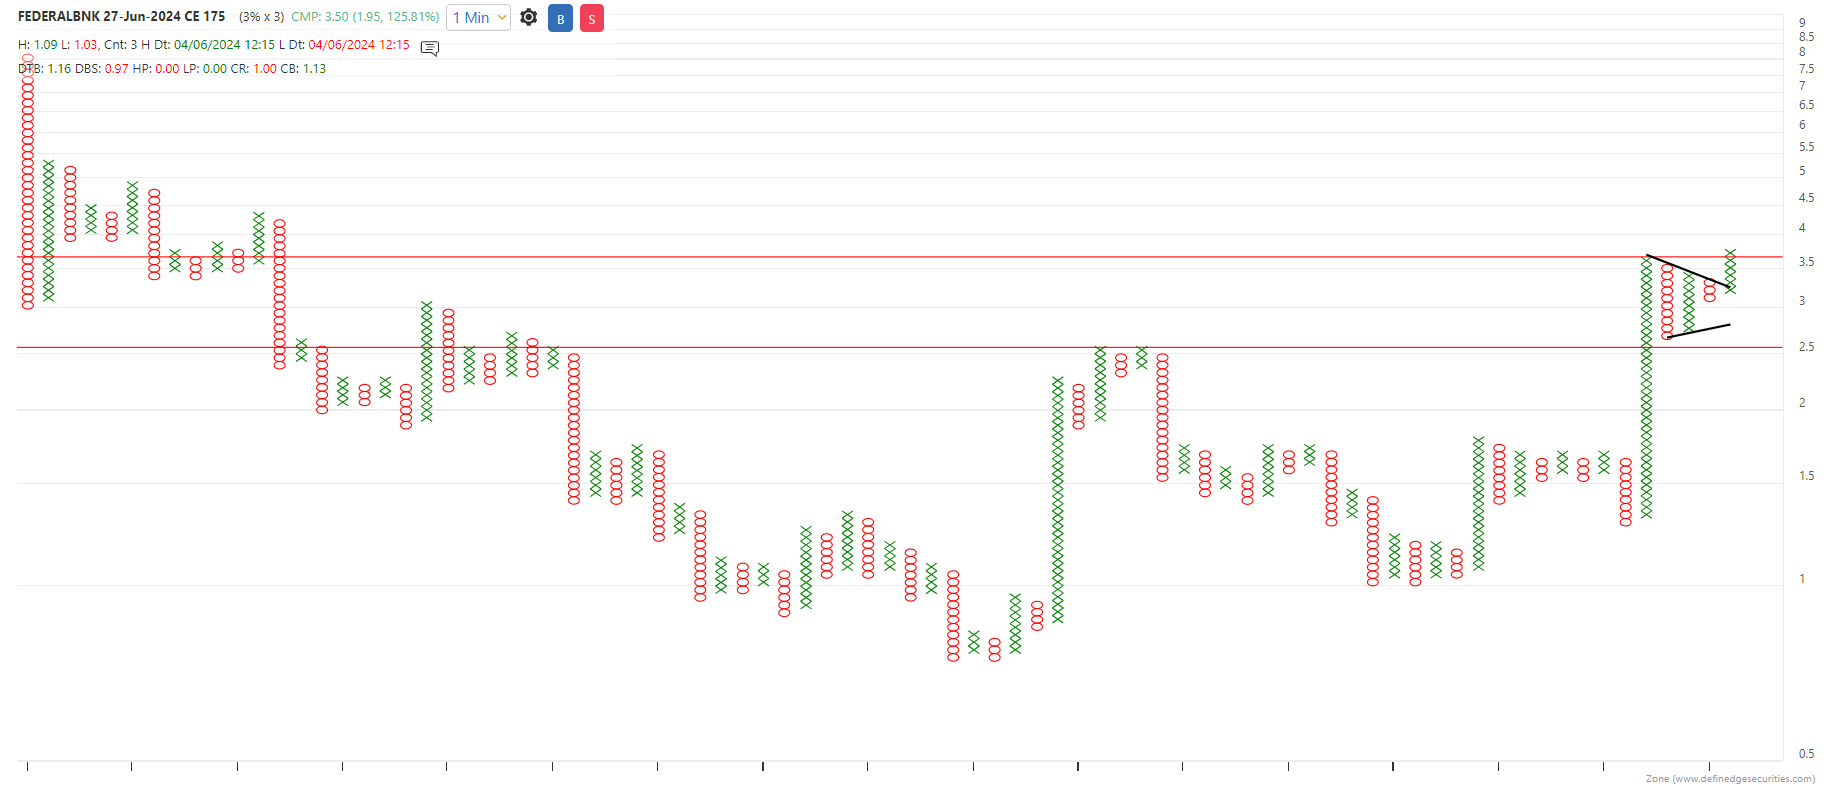
I have considered 175CE, which had a similar setup to 173CE but much higher volumes (liquidity) and lower spreads (Bid-Ask).
In the above chart, the Anchor Col follow-through is also supported by a triangle breakout confirming the setup.
Remember the idea of the hourly chart - the momentum should not fizzle out in the first hour, and if it continues after 10:15 am, you get good momentum trades in options.
It's all about timing the trades in Options buying.
New to Trividh - Check out the system, Click here
-
The volatility of General Election results was at it's best as we witnessed the roller coaster Monday and Tuesday.
The bulls managed to regain the momentum today as well but the real struggle for them begins now.
The index has entered into the major resistance zone of gap and if bulls pull this out, the index can witness a major short-covering rally towards 24,000.
But if they fail, the FIIs are waiting for the opportunity, and then Monday's high will be marked as a Fakeout, as per Wyckoff's theory. Also, it will be the index's lower high.
If this is marked as a Fakeout, then the Tuesday fall may be the first Sign of Weakness (SOW) as per Wyckoff—a bearish structure.
What are you trading - Longs or Shorts?
Source: TradePoint -
Below support, the trend may change on these stocks.
-
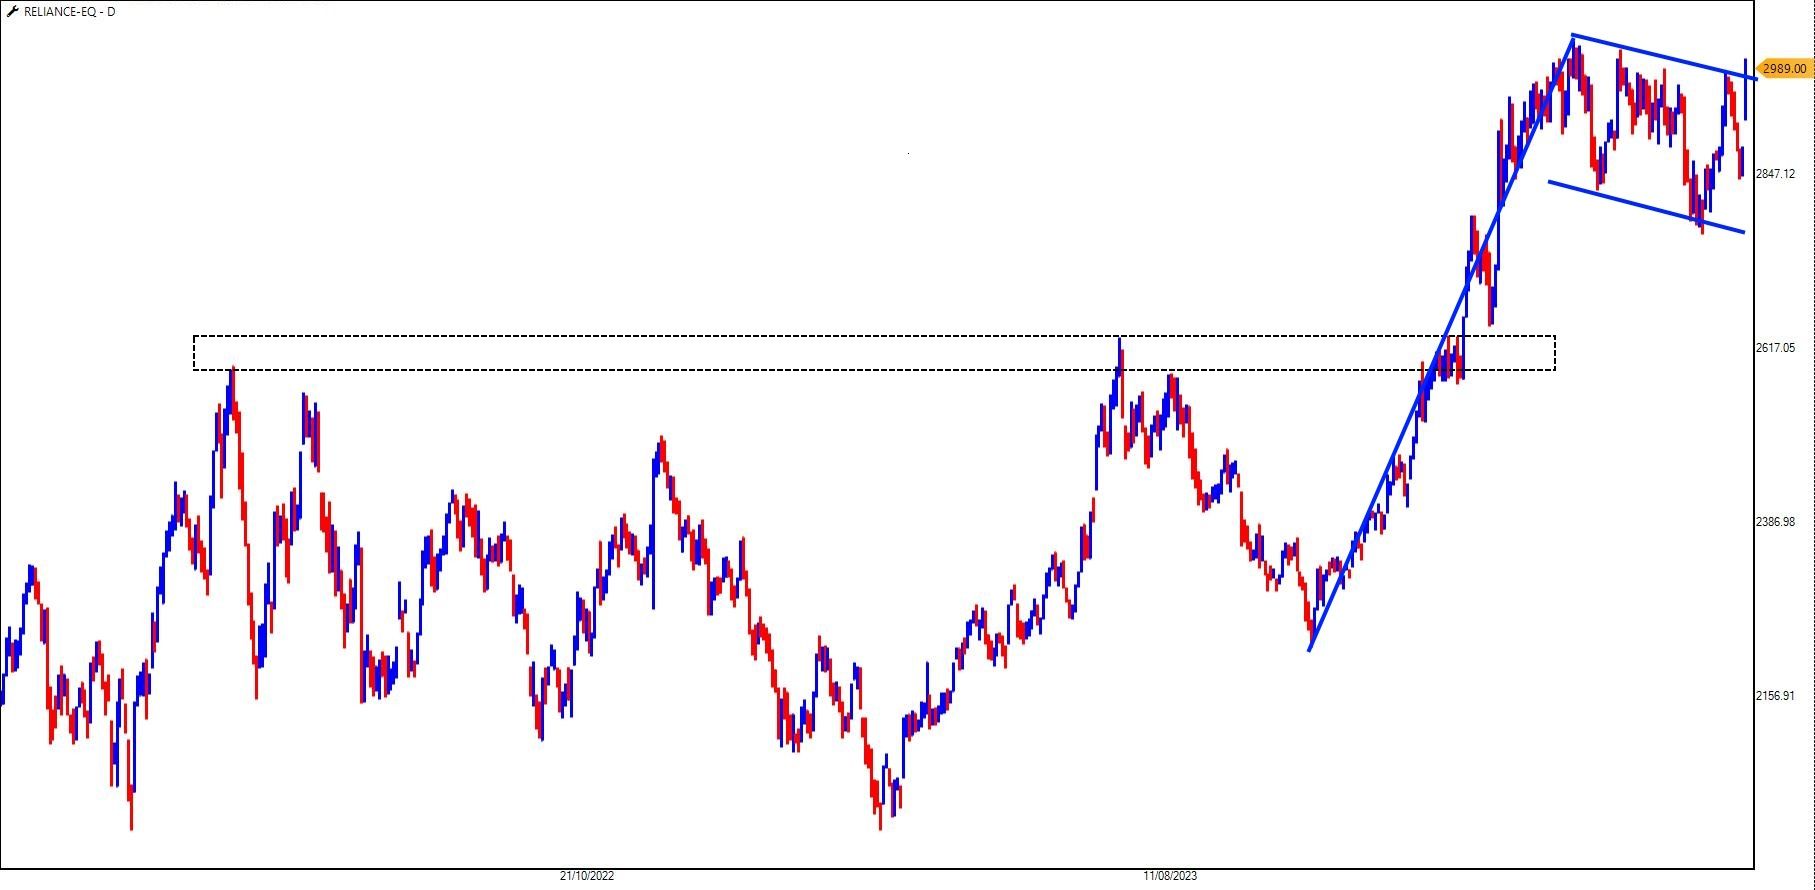
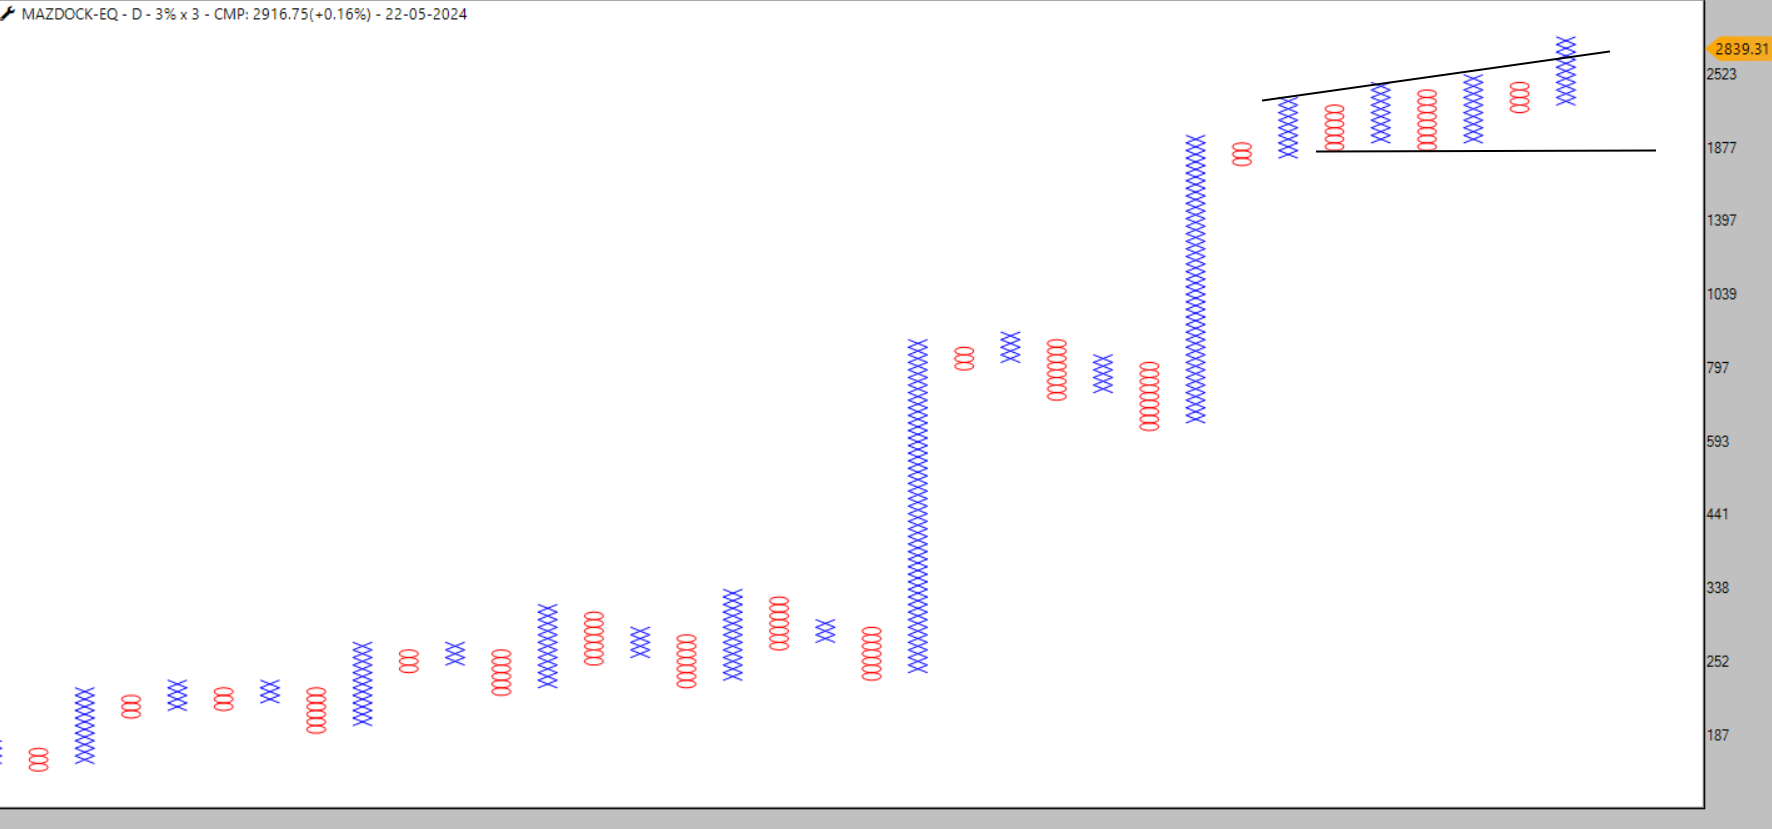
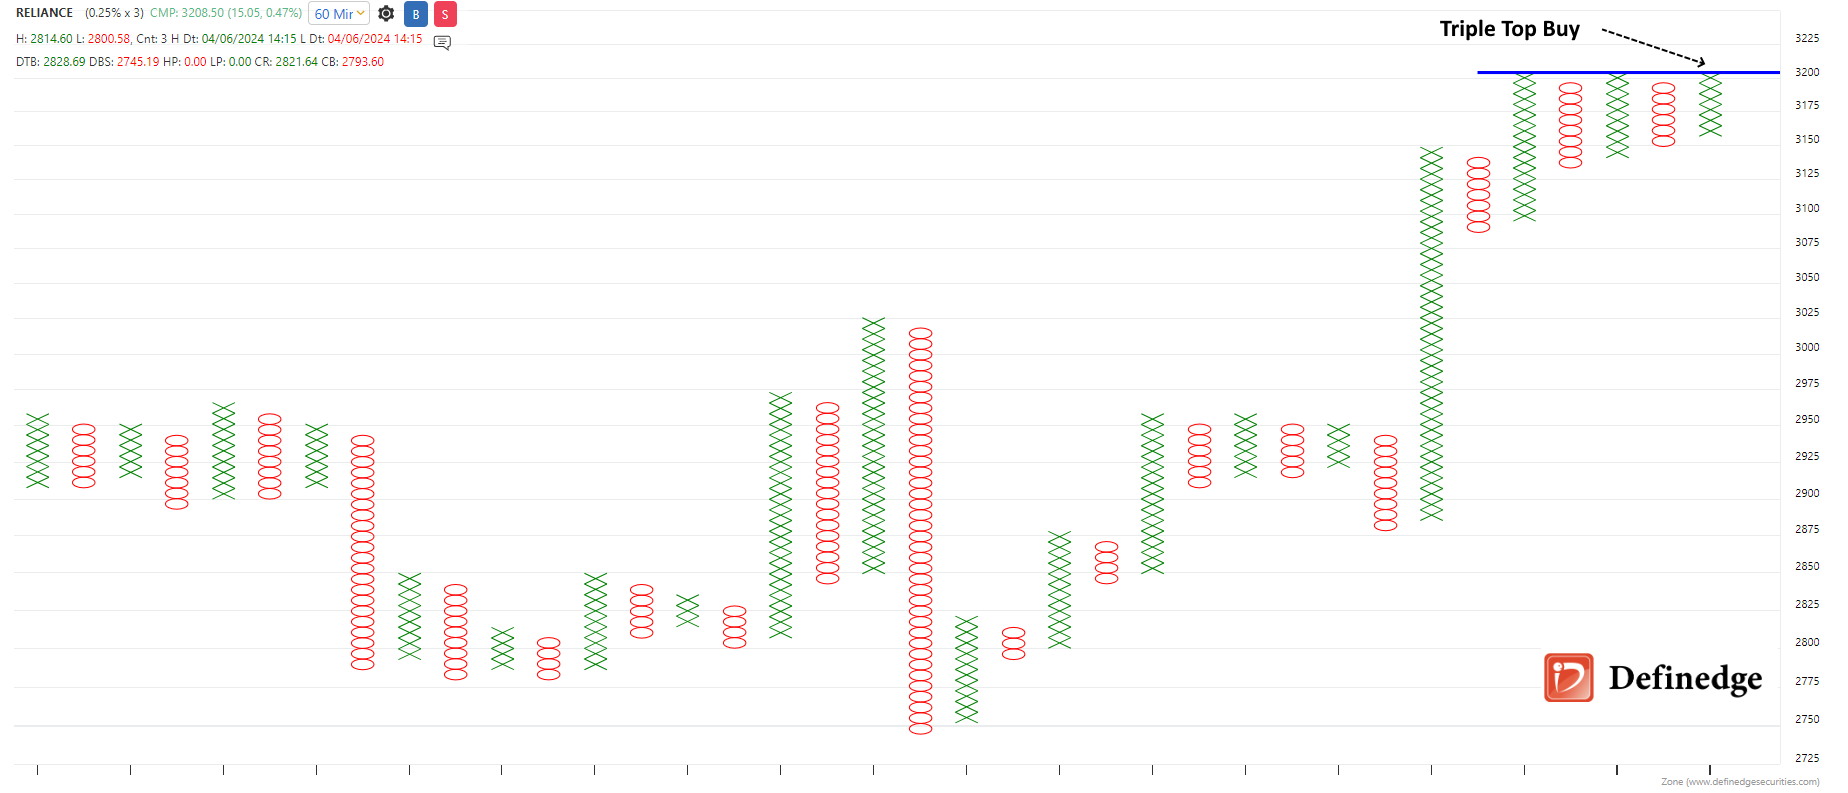
A Close above 3,000 will confirm the Flag and Psychological level breakout.
-
@Deepakk Chabria Thanks for your kind words.
-
Updated Chart:
-
Sir these are the criteria for stock selection:
- Golden Cross - 50DEMA above 200DEMA
- Stocks last close above 200DEMA
- RSI below 40
-
The market is set to open significantly higher after positive exit poll numbers, with Gift Nifty indicating an 800-point jump to around 23,500. This scenario often creates a dilemma for traders: Should you buy into a big gap-up opening?
The answer can be straightforward: Yes, if the stop-loss falls within your risk criteria.
In such situations, it's crucial to have a well-defined trading plan. Look for bullish patterns on the charts to identify potential entry points. For instance, a triangle breakout/Flag/Pennant on a candlestick chart or setups like DTB (Double Top Breakout), TTB (Triple Top Breakout), or AFT (Anchor Follow Through) on a Point-and-Figure chart can signal strong buying opportunities. In case you are following your systems, stick to it as per the signals.
What are you trading? Share your thoughts in the comments below.
-
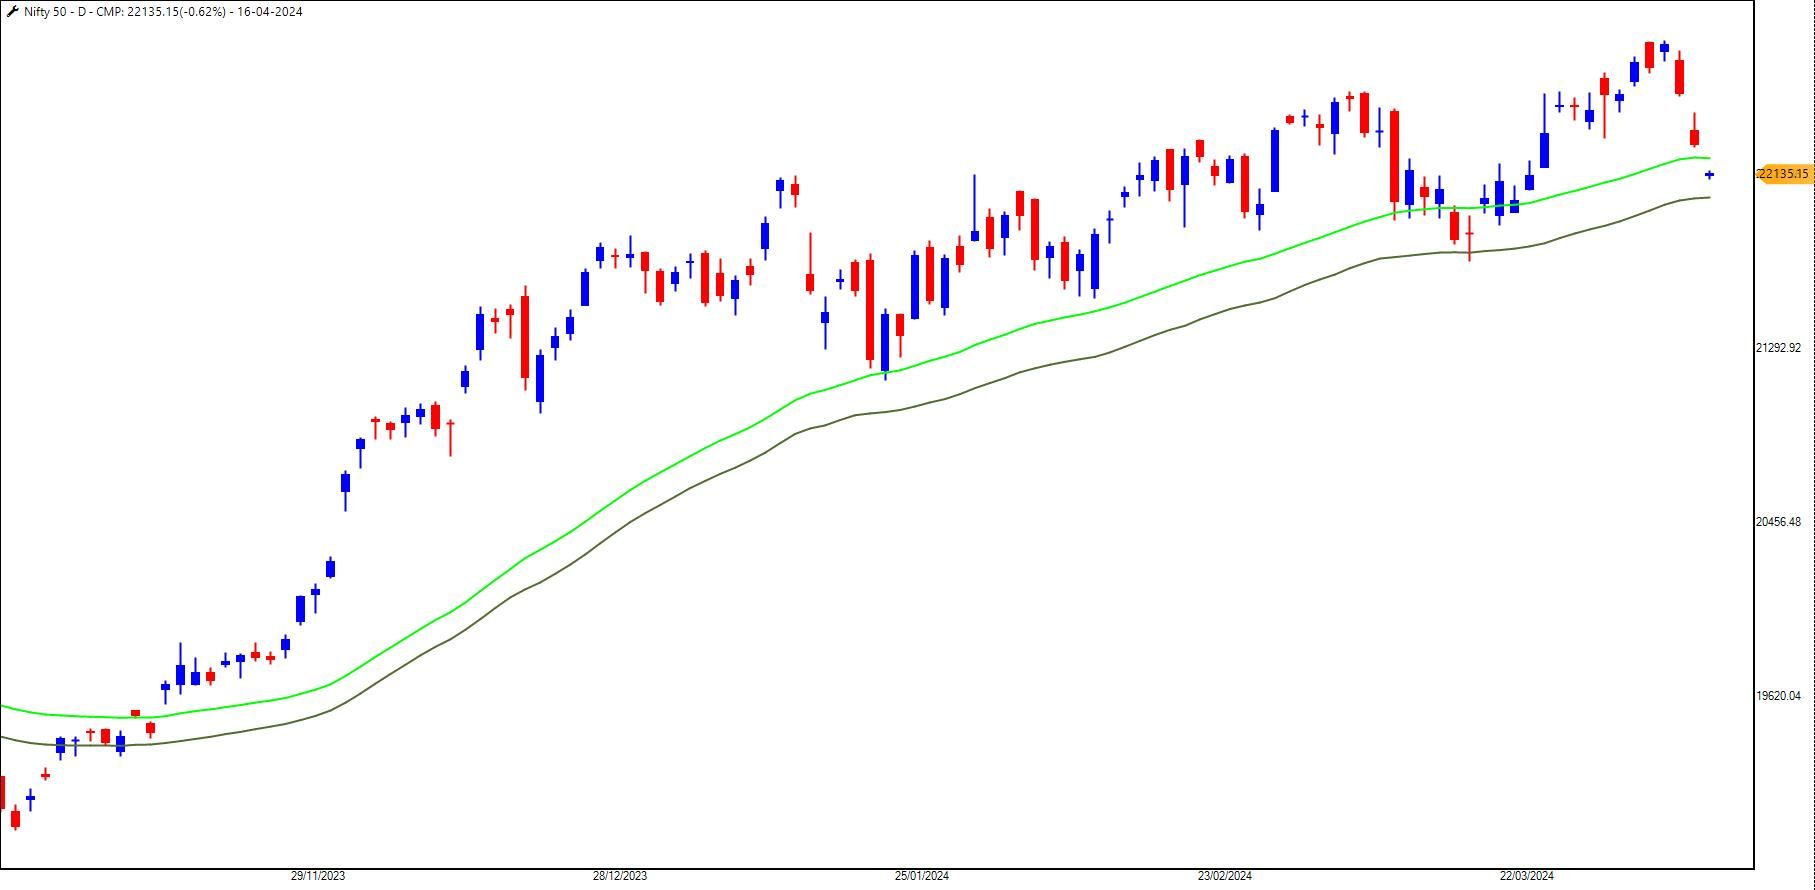
The Nifty witnessed a dip in the last few sessions from 23,110 to 22,417 ahead of the election results.
As of now, the medium-to-long-term trend remains bullish on the index, while short-term hiccups due to monthly expiry and fear amongst traders witnessed profit bookings.
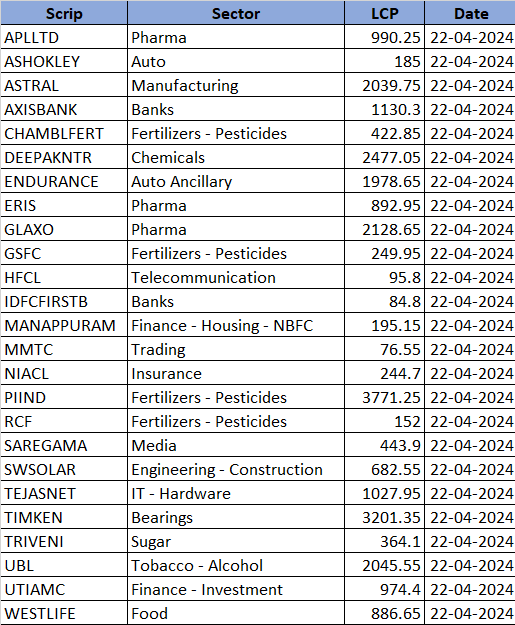
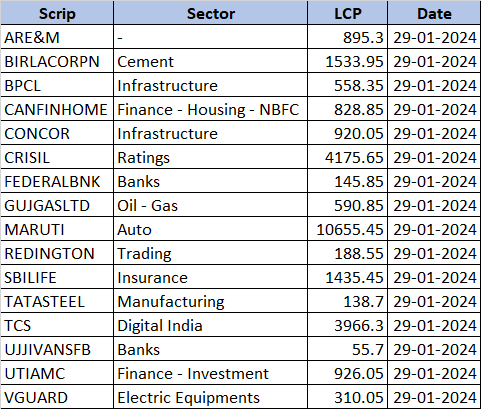
If you are looking to buy the dip, here is a list of stocks filtered based on the following criteria.
- Golden Cross - 50DEMA above 200DEMA
- Stocks last close above 200DEMA
- RSI below 40
-
@Anil Parmar DBS above the breakout level.
-
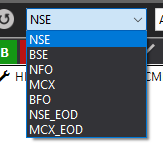
@Omkar Pradhan Select NFO
-
- Bullish Dragon
- Triangle Breakout
- Above 62HEMA Channel
-
As per the Relative Strength Index (RSI) indicator, only 50% stocks are in positive trend from Nifty750 (Nifty500+ MicroCap 250) on the MONTHLY chart.
The RSI is a widely used momentum oscillator that measures the speed and change of price movements. Developed by J. Welles Wilder, the RSI oscillates between 0 and 100 and is typically used to identify overbought or oversold conditions in a market. A 14-period RSI is a common choice among traders, providing a balance between sensitivity and reliability. To enhance the RSI's utility, traders often use a 9-period simple moving average (SMA) as a signal line, facilitating the identification of positive and negative crossovers.
Positive Crossover: A positive crossover occurs when the 14-period RSI crosses above its 9-period SMA. This crossover indicates increasing bullish momentum and suggests a potential upward price movement. It is often seen as a buy signal because it shows that the RSI is gaining strength relative to its recent average, suggesting that buyers are becoming more active.
Negative Crossover: Conversely, a negative crossover happens when the 14-period RSI crosses below its 9-period SMA. This indicates increasing bearish momentum and suggests a potential downward price movement. It is typically interpreted as a sell signal because it shows that the RSI is losing strength relative to its recent average, suggesting that sellers are gaining control.
The crossover can help in understanding the trend's direction and strength, categorized into neutral, positive, and negative trends.
Neutral Trend: A neutral trend is characterized by the RSI hovering around the 50 level, with frequent crossovers between the 14-period RSI and the 9-period SMA. In a neutral trend, the market lacks a clear direction, and the price movements are generally range-bound. Traders might adopt a wait-and-see approach or engage in short-term trading strategies to capitalize on small price fluctuations.
Positive Trend: In a positive trend, the RSI often stays above the 50 level, and the 14-period RSI consistently crosses above the 9-period SMA. This trend indicates sustained bullish momentum, and traders look for buying opportunities. The positive crossovers during this period confirm the strength of the uptrend and suggest that the price is likely to continue rising. However, traders should also watch for overbought conditions (RSI above 70) that might precede a reversal or a pullback.
Negative Trend: In a negative trend, the RSI typically remains below the 50 level, and the 14-period RSI frequently crosses below the 9-period SMA. This trend signals sustained bearish momentum, and traders look for selling or short-selling opportunities. The negative crossovers during this period reinforce the strength of the downtrend and indicate that the price is likely to continue falling. Traders should be cautious of oversold conditions (RSI below 30), which might signal a potential reversal or a temporary rebound.
We ran the RSI scanner in RZONE to check the trend of the stock on the monthly chart, and the results were shocking.
Though the markets are trending bullish, only 373 out of 750 stocks are bullish are per RSI while 42 remain Neutral and 335 remain bearish.

-
@Omkar Pradhan It's a P&F chart. You can plot in Zone (web-based) or TradePoint (Desktop App).
-
Stocklist 25-05-2024
-
@Mr Mehul Thakkar Enjoy!
-
You can join my Harmonic Trading Course here https://gurukul.definedgesecurities.com/courses/harmonic-trading-patterns-simplified/
-
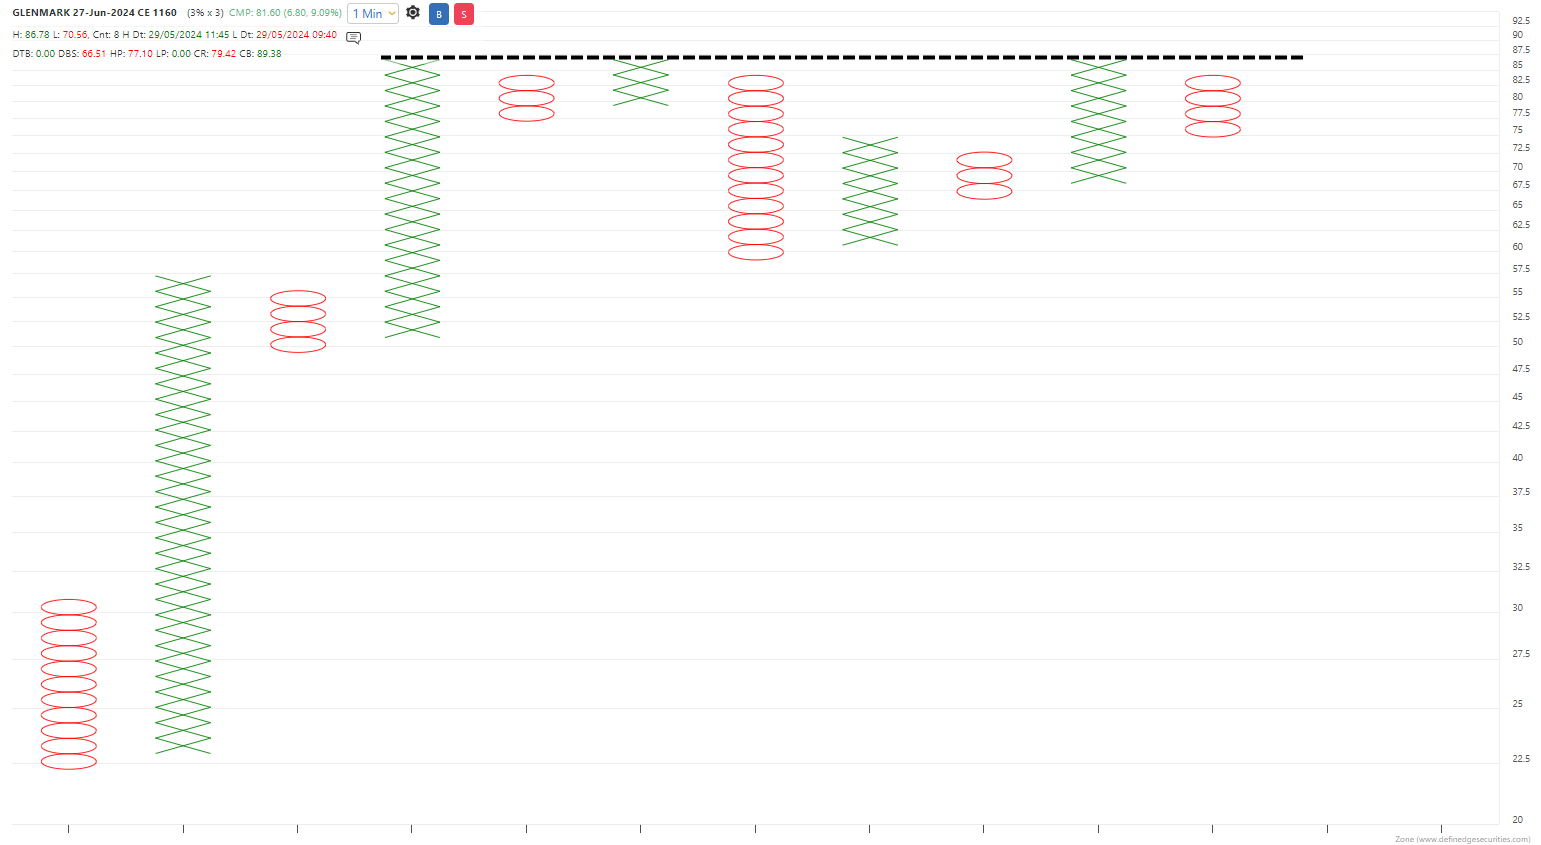
Breakout Level - 85
DBS - 65
Vertical Count - 145/265 -
@Mr Mehul Thakkar At time of posting the chart, it was 36
-
@Mr Mehul Thakkar SL is DBS
-
@PRANAV GULABANI Hope you minted Pranavbhai

-
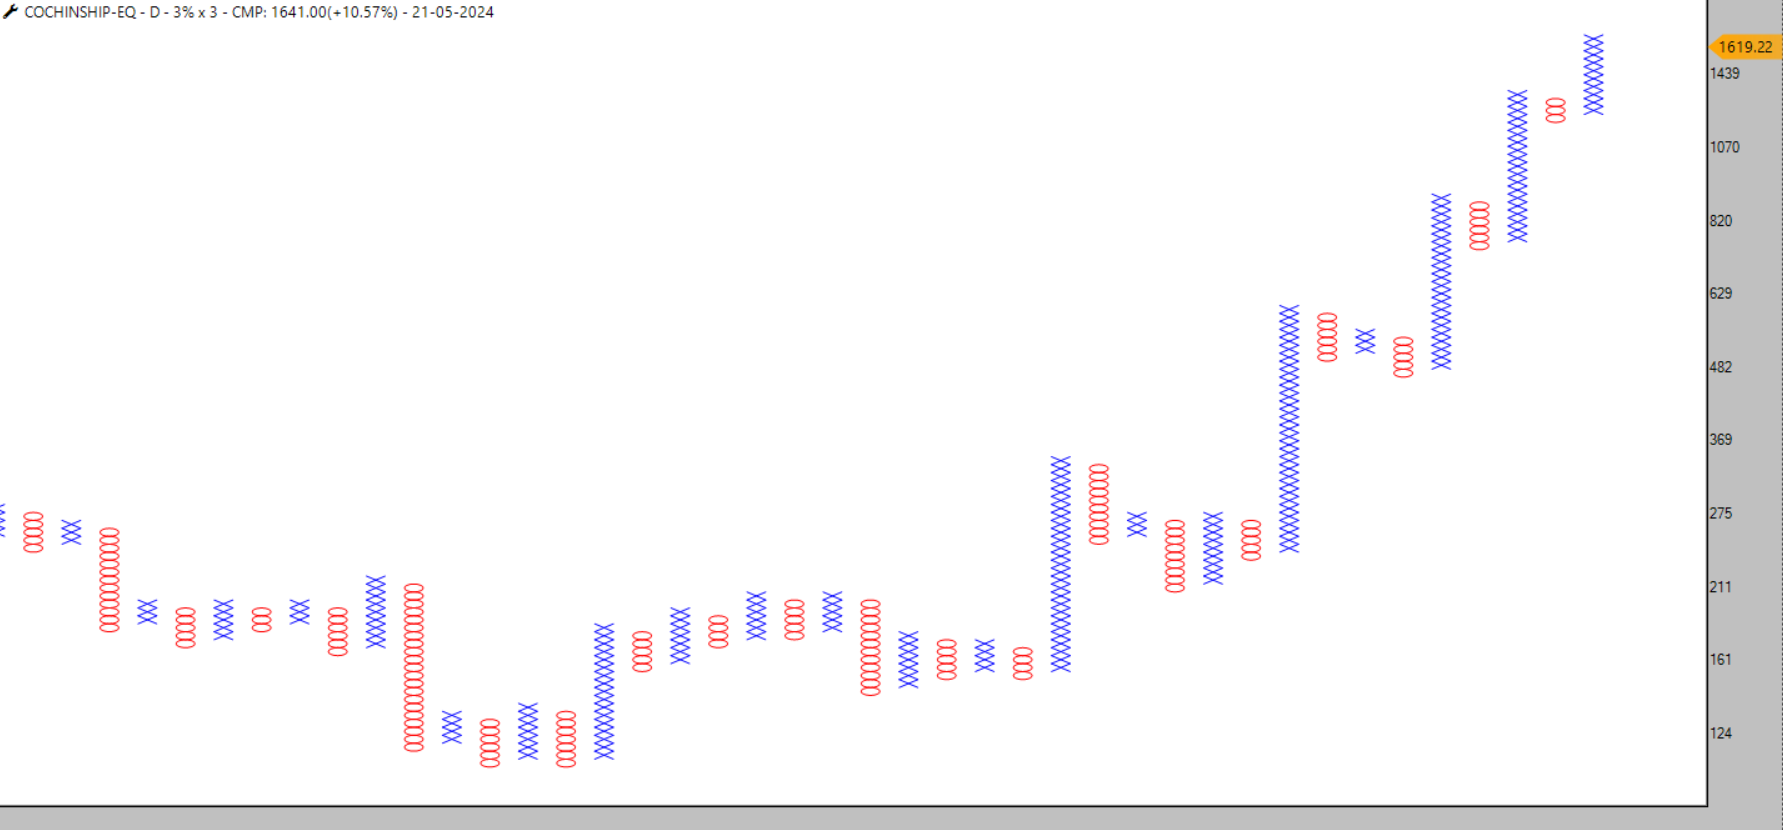
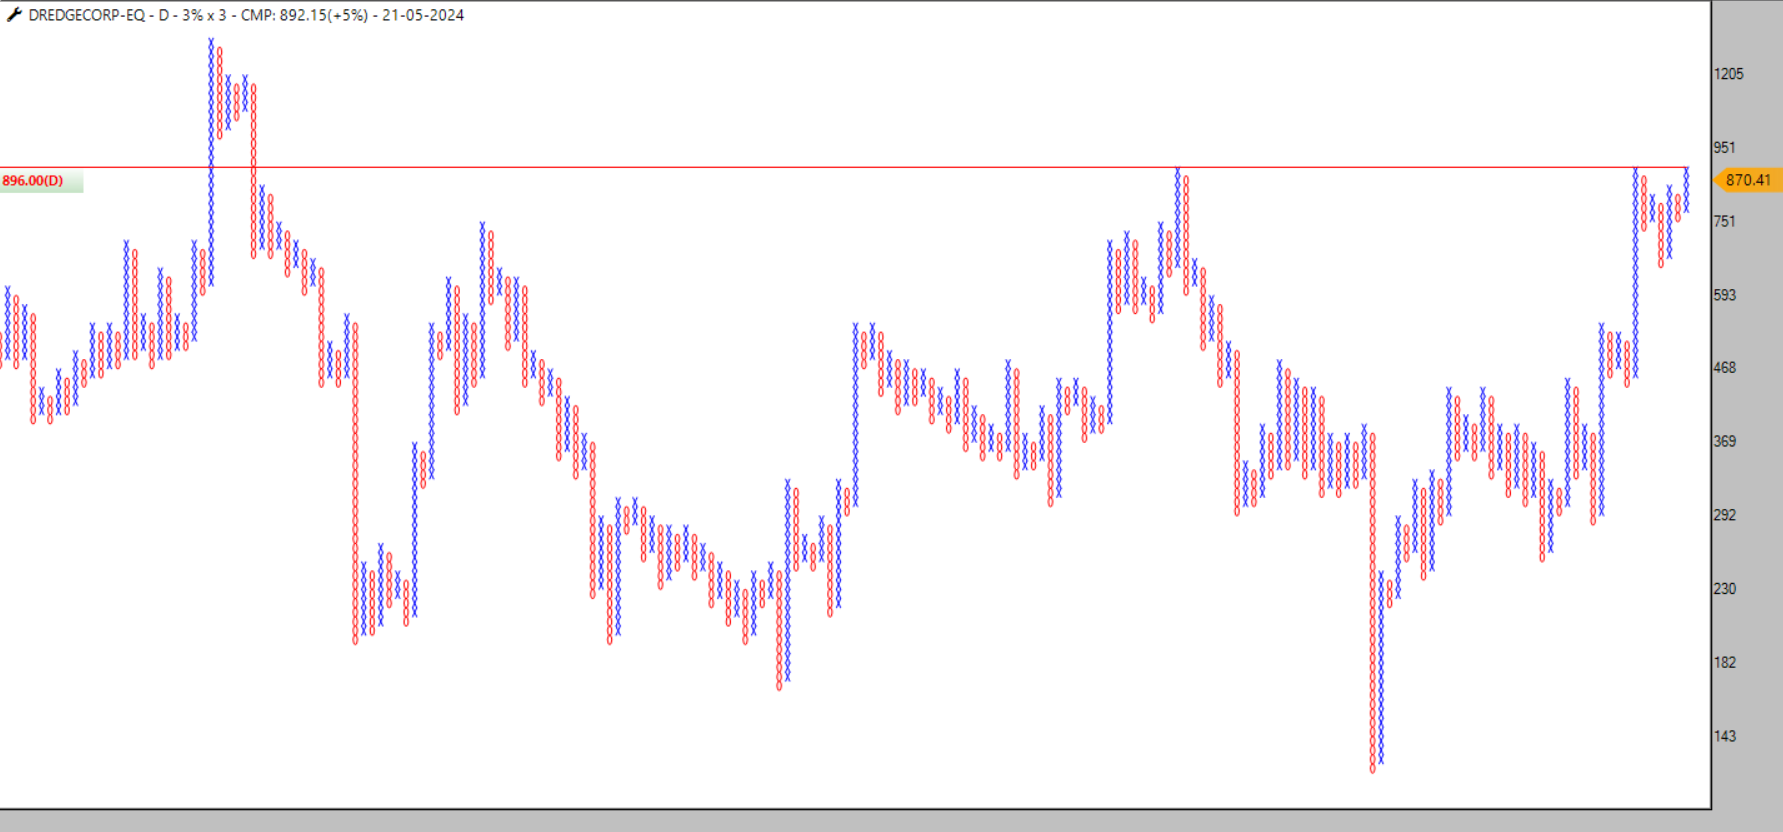
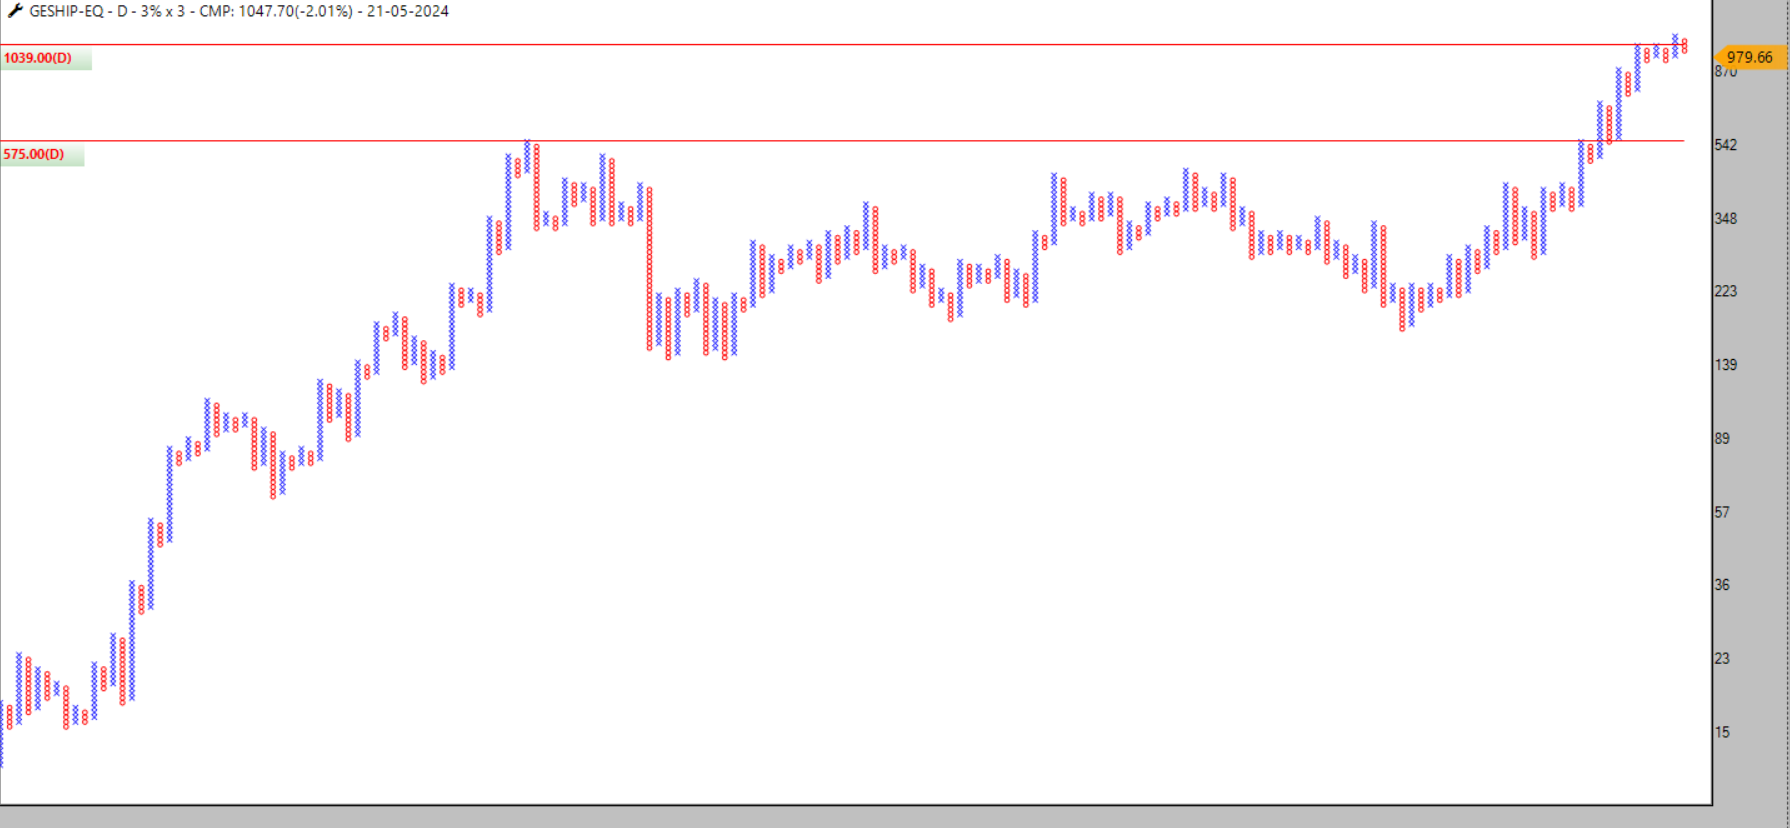
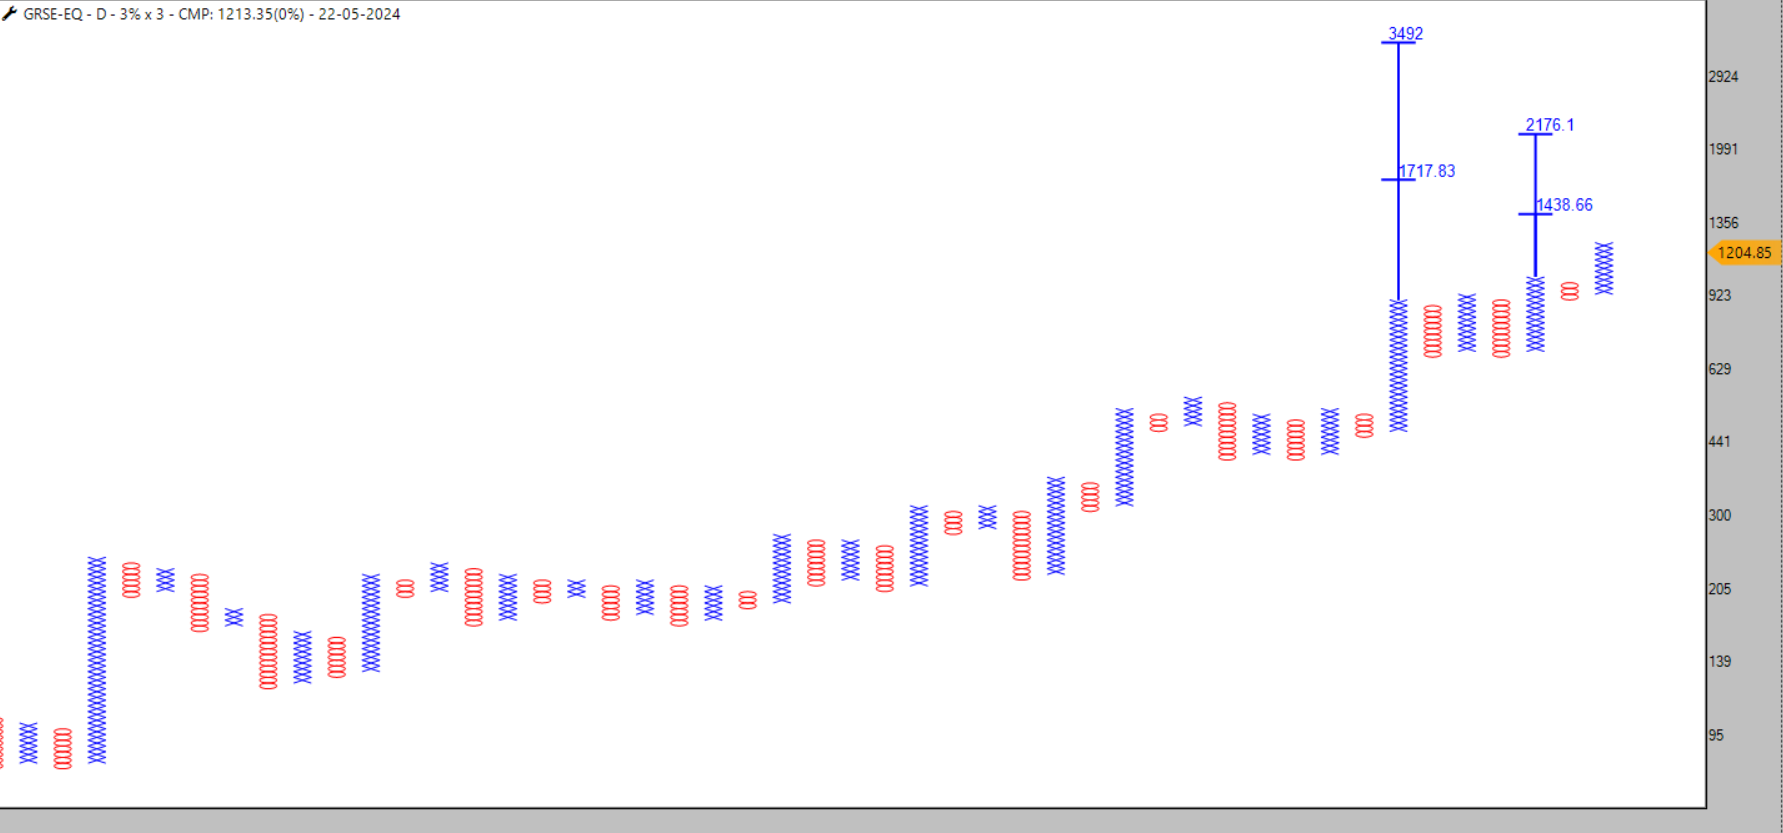
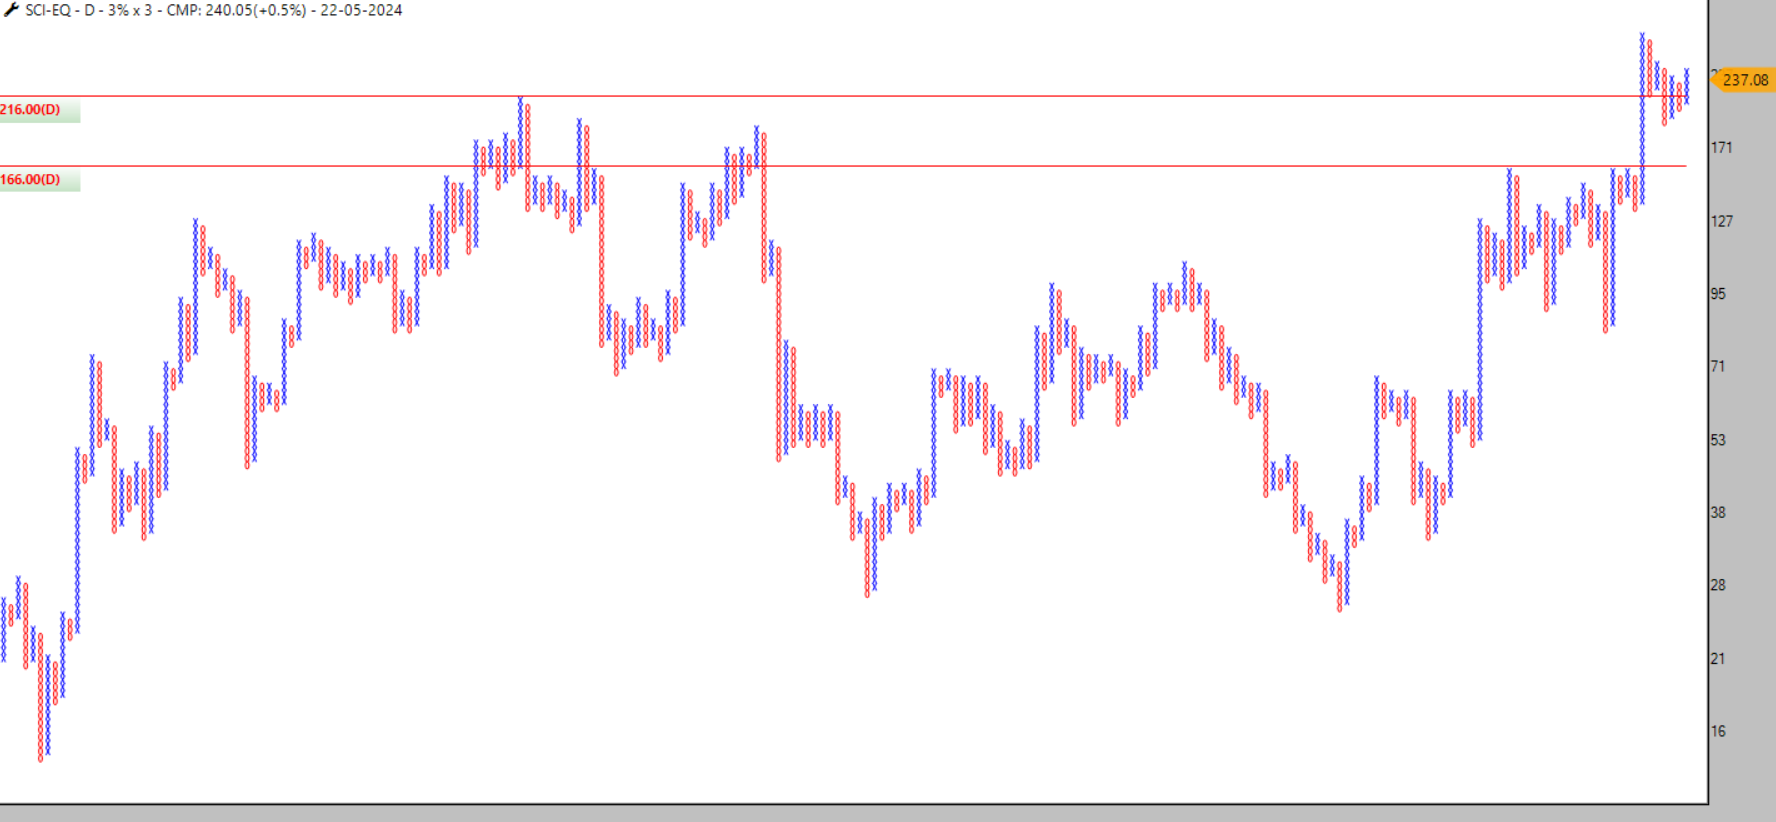
Definedge - Ship Building EQW Index
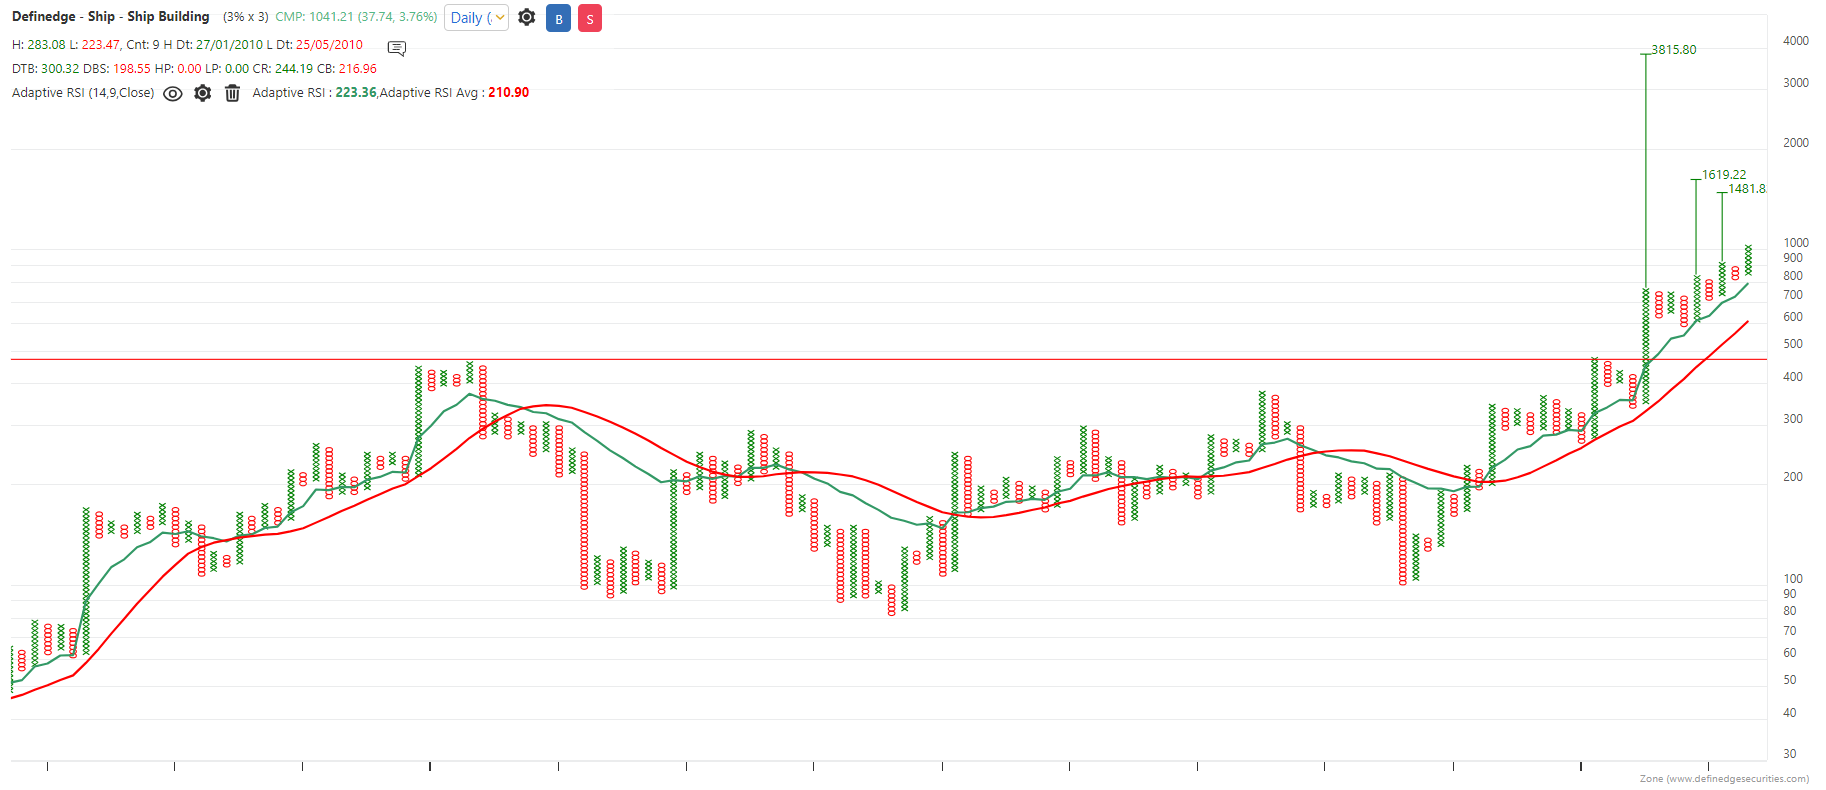
Cochin Shipyard
Dredeing Corp
GE Shipping
Mazgoan Dock
GRSE
SCI
-
Stocklist 18-05-2024
-
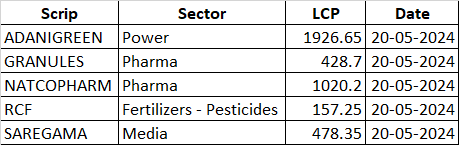
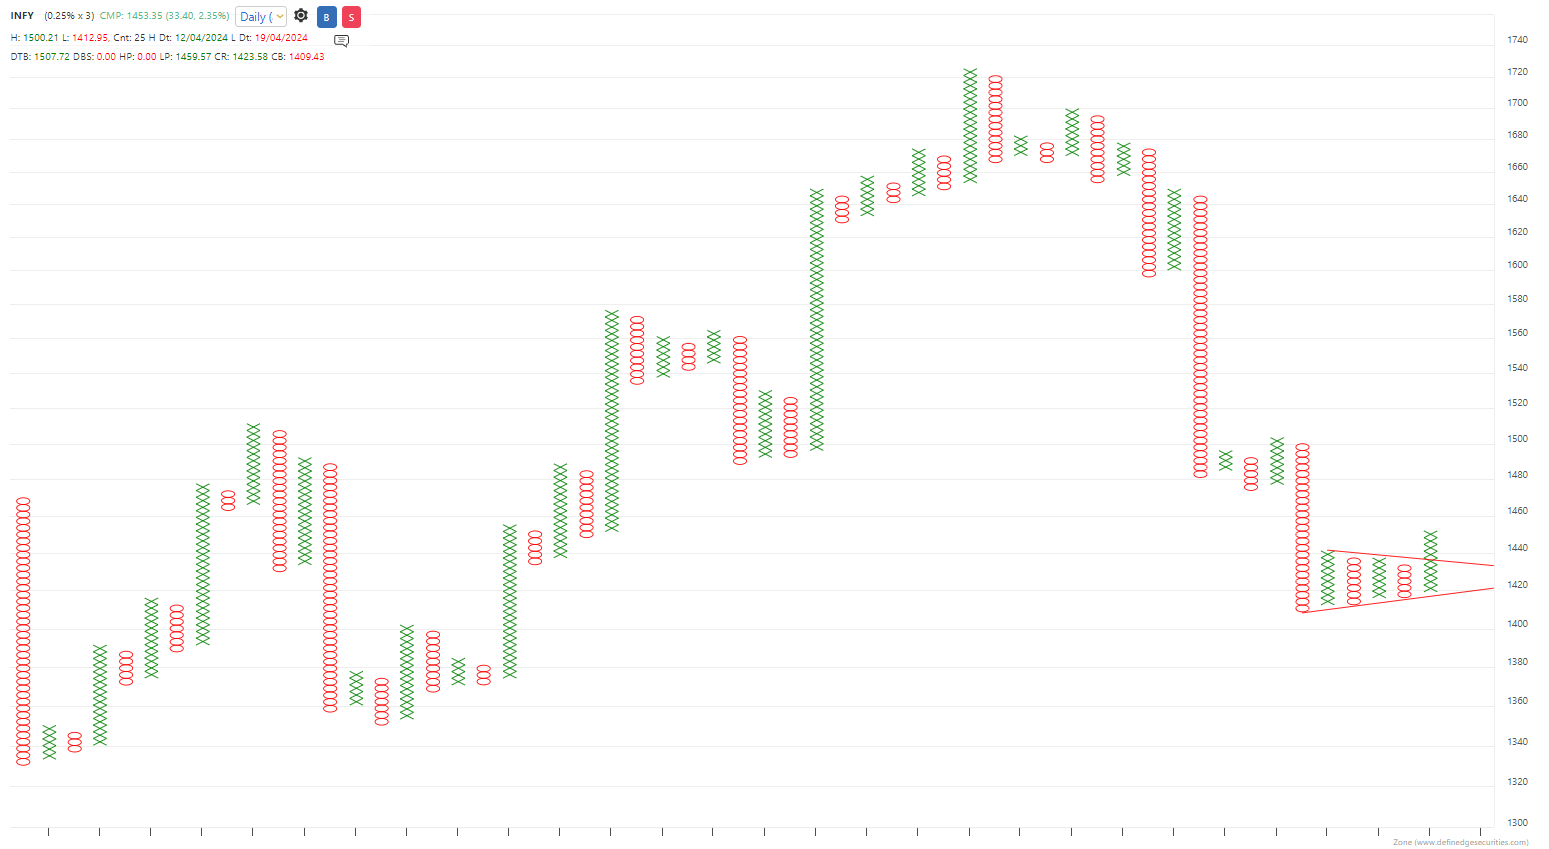
INFOSYS
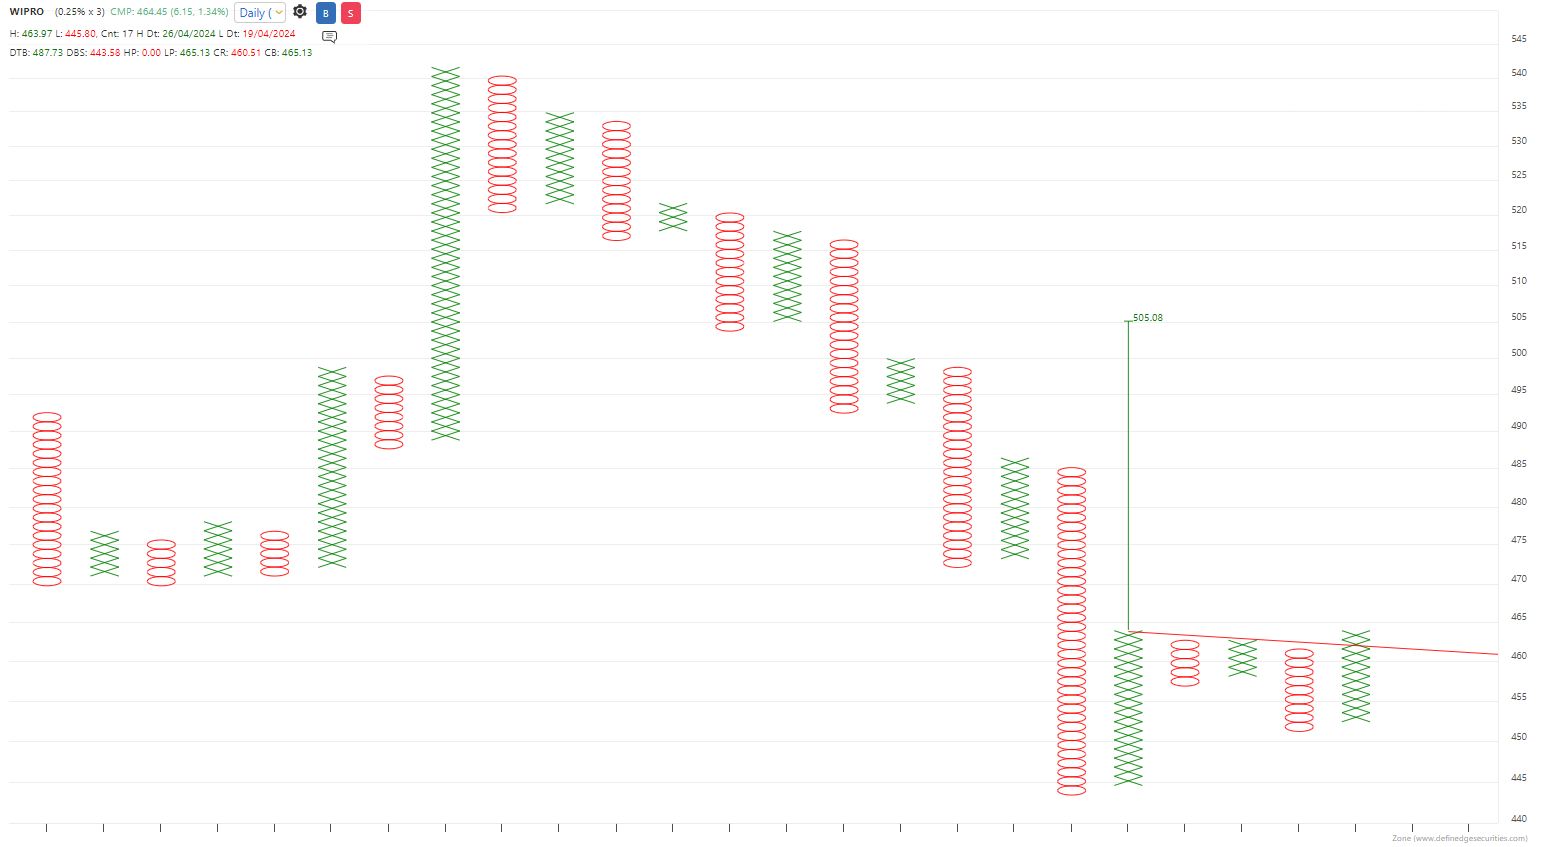
WIPRO
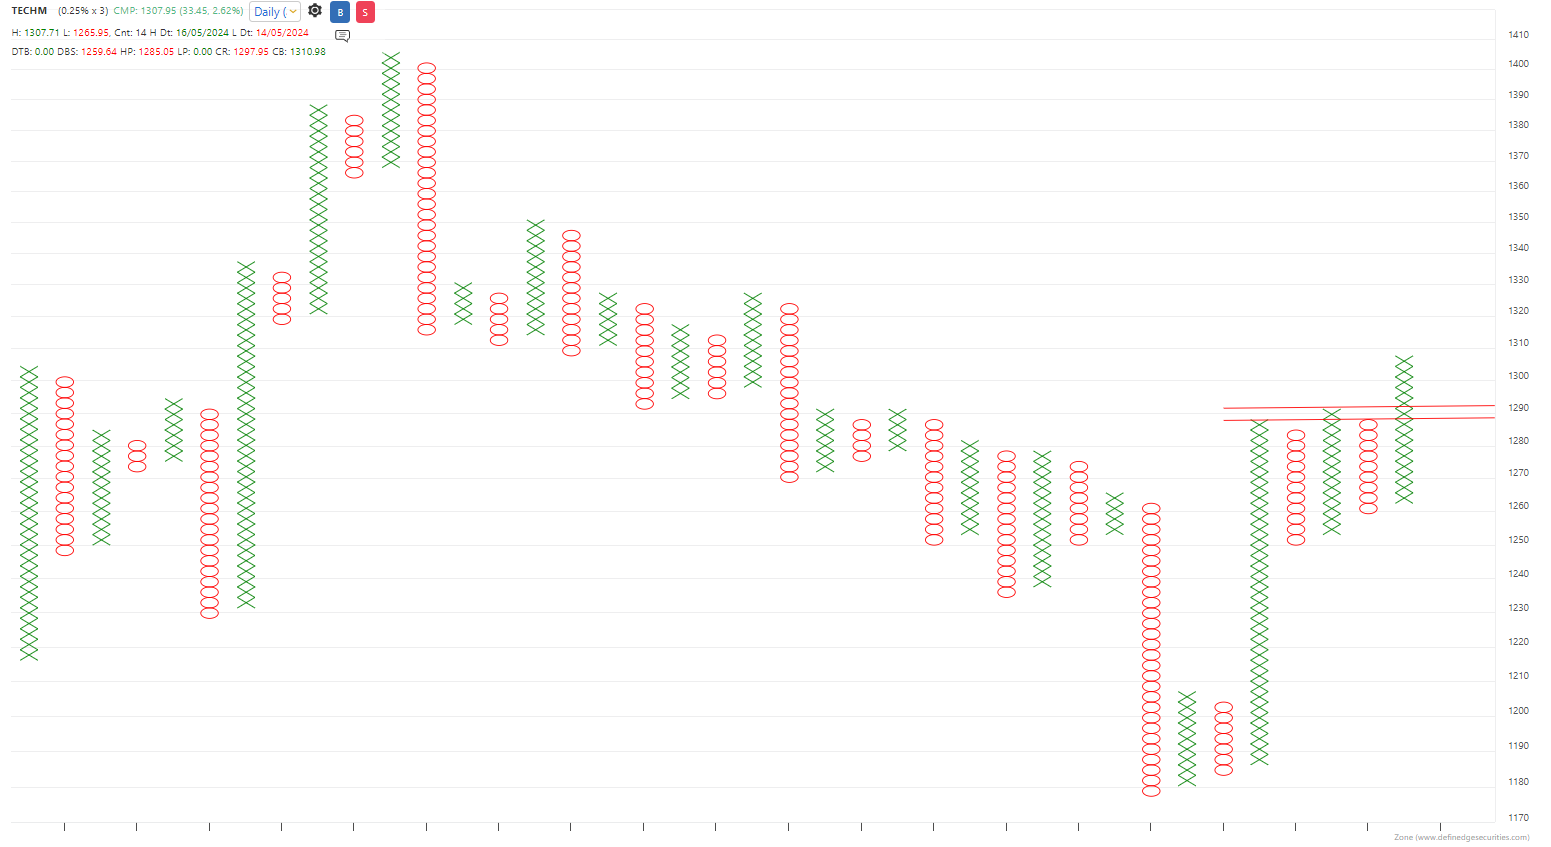
TECHM
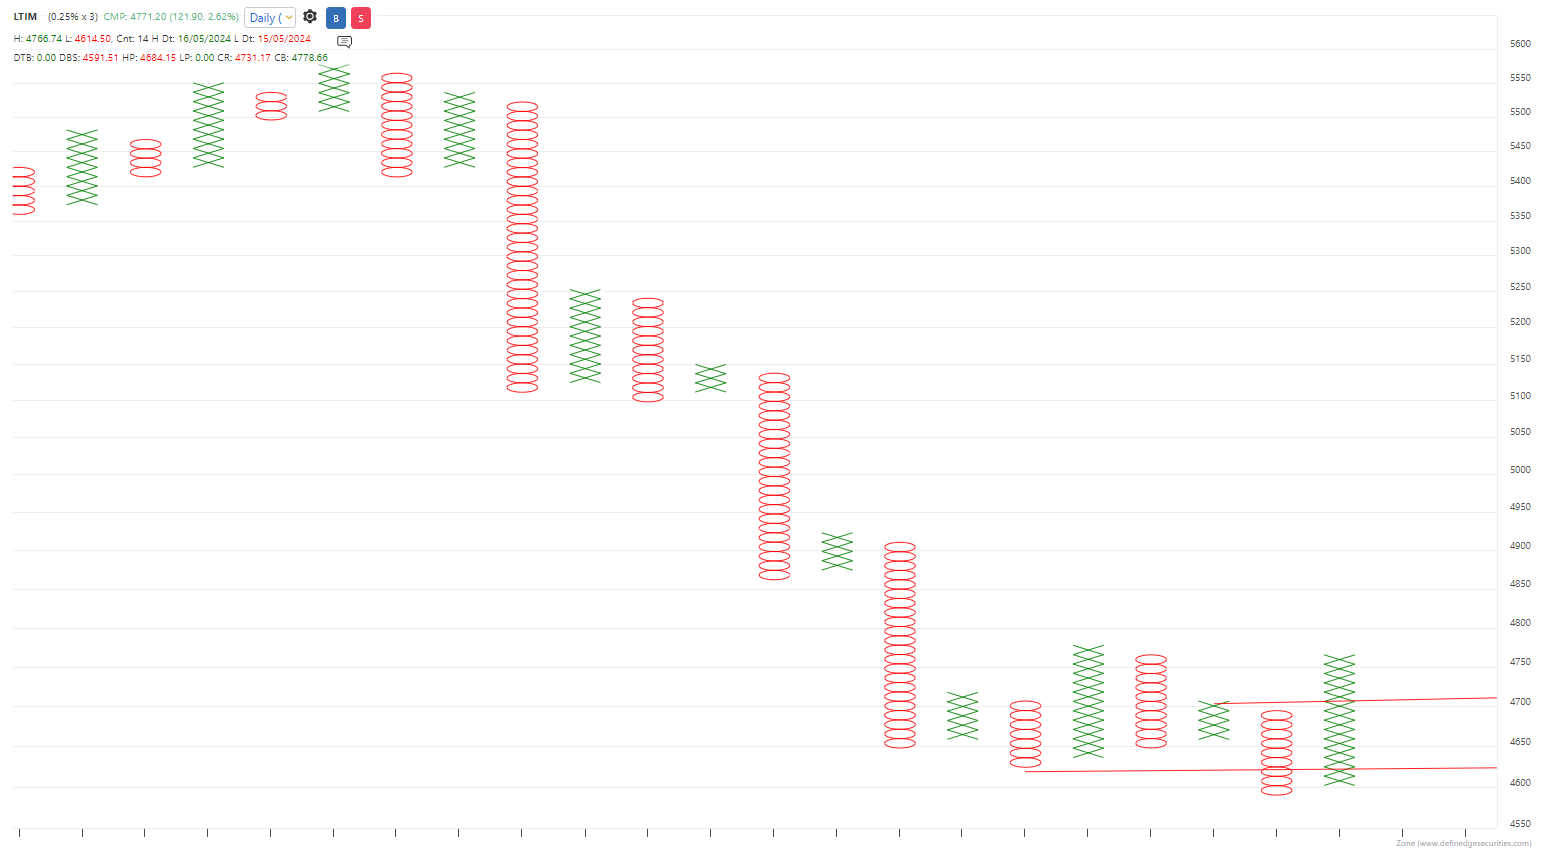
LTIM
-
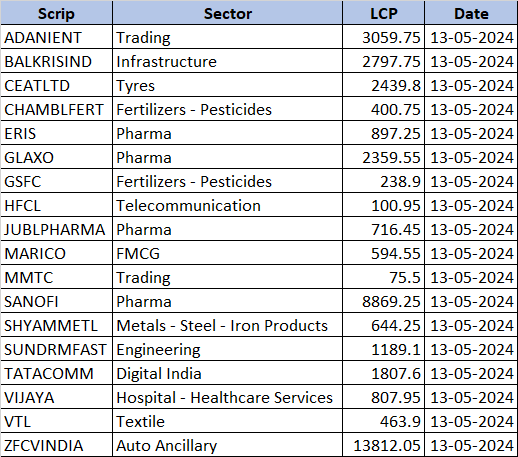
Source: RZoneFilter Criteria: P&F Daily 0.25% X 3 from Nifty200
Data as per closing of 14-05-2024 -
@Prashant Vaikunthe Great Sir
-
Adani Ports 1,244 to 1,310
#BullishHarmonic -
Stocklist based on Vriddhi Strategy on Weekly Chart
-
Stocklist 11-05-2024
-
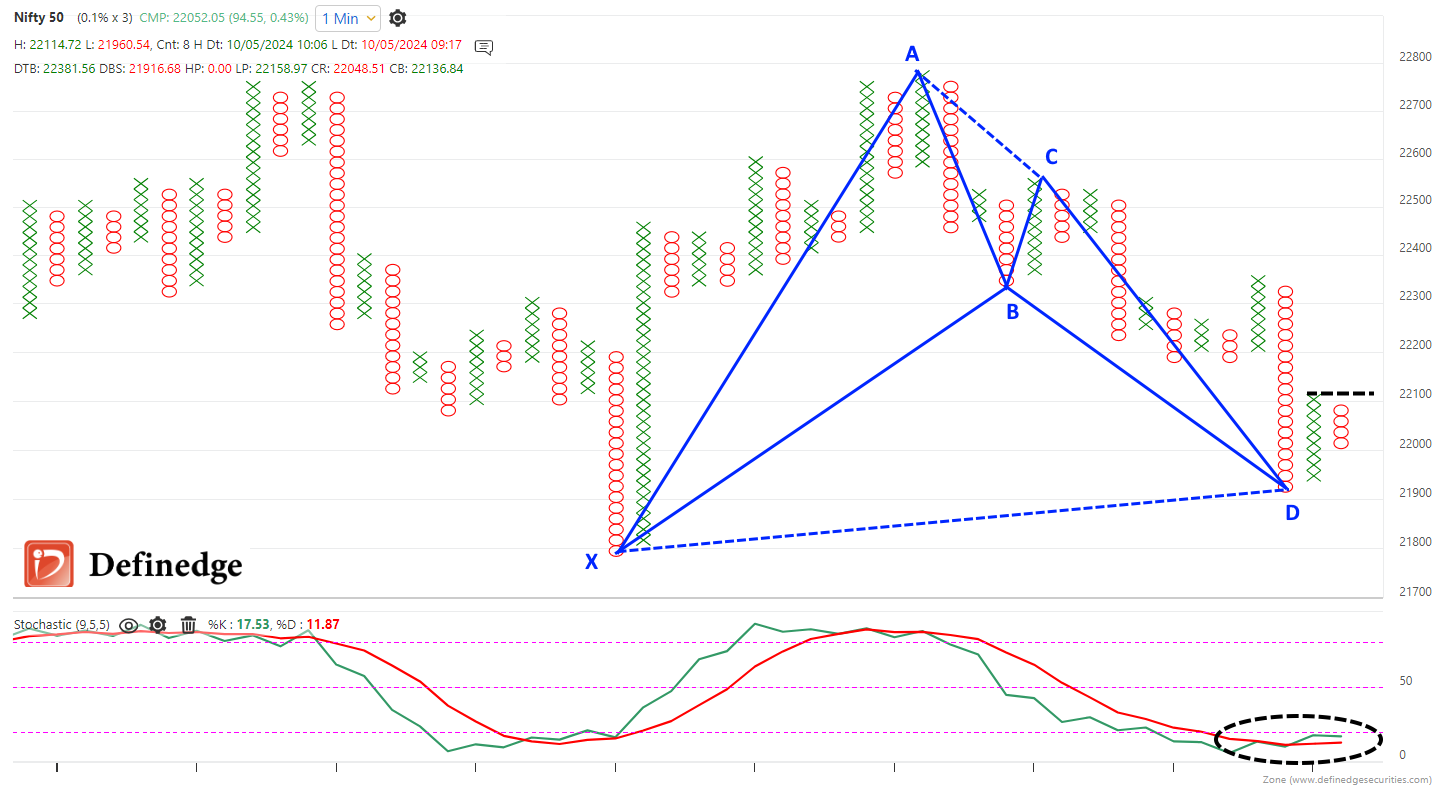
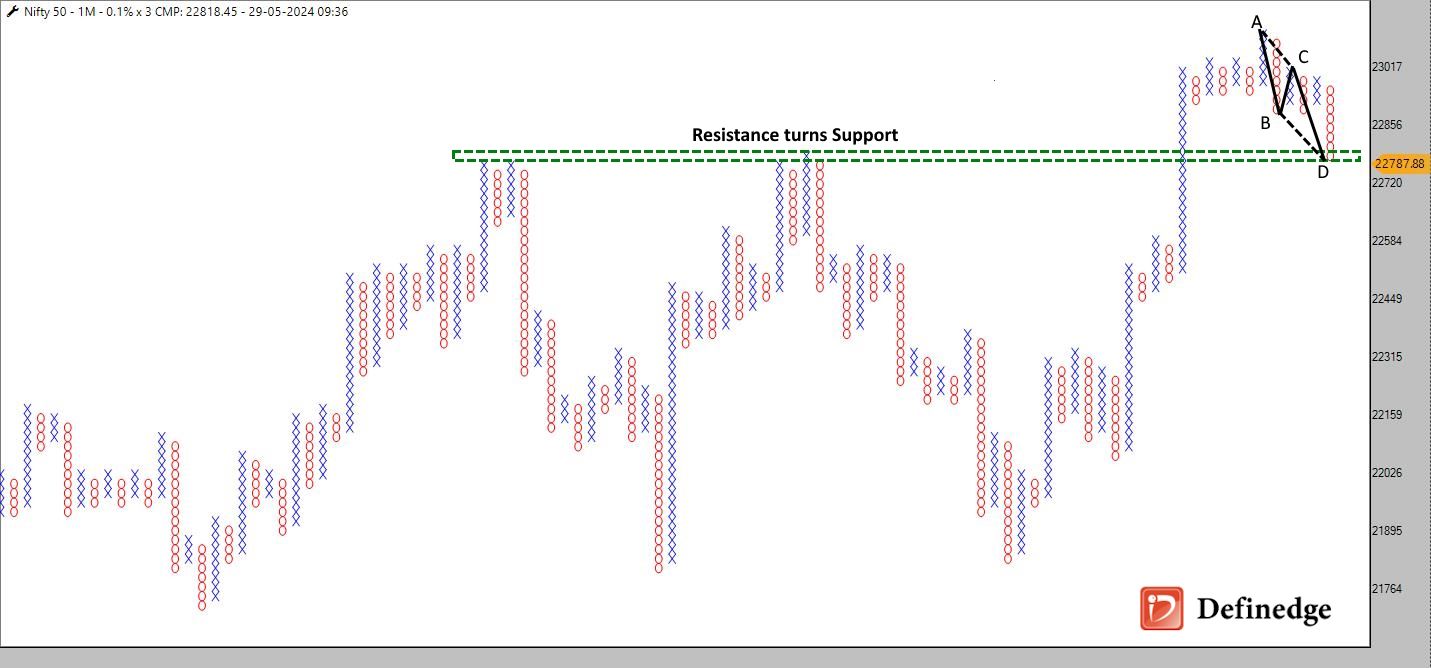
Nifty (Spot) has recently shaped a Bullish Bat harmonic pattern and showed signs of reversal in the first hour of trading.
The Stochastic oscillator has also shifted to a bullish stance. Further fueling the bullish sentiment, a breakout beyond the DTB at 22,140 is poised to amplify the upward momentum.
-
To learn about Harmonic Patterns, click here
-
Investing in the financial markets can be complex, often requiring a deep understanding of stock picking and market timing. However, a more straightforward and equally effective approach is gaining popularity - Mutual Funds.
The phrase "Mutual Fund, Sahi Hai" (Mutual Fund, it's correct) encapsulates the essence of this investment vehicle, underlining its potential to deliver consistent returns over the long term without needing individual stock picking.
While some investors may prefer the thrill of picking individual stocks, Mutual Funds offer a diversified and professionally managed alternative. They pool money from multiple investors and invest in a diversified portfolio of stocks, bonds, or other securities according to a specific investment objective. This diversification helps spread risk and mitigate the impact of market volatility.
One of the fundamental principles of investing is the power of compounding returns. Rather than trying to time the market or chase hot stocks, successful investors focus on the long-term growth potential of their investments. Mutual Funds align perfectly with this approach, allowing investors to participate in the market's growth over time.
As markets continue to reach new highs, evaluating the performance of Equity-Linked Mutual Funds across different time horizons is essential. Let's delve into Mutual Fund Performance over the short term (1 year) to the long term (10 years) to gain insights into their potential for wealth creation.
Top 25 Mutual Funds for 10 Years Returns

Source: MF Zone, Definedge SecuritiesTop 25 Mutual Funds for 5 Years Returns

Source: MF Zone, Definedge SecuritiesTop 25 Mutual Funds with 1-Year Returns

Source: MF Zone, Definedge SecuritiesWhile market conditions and economic factors can influence short-term performance, the long-term track record truly matters. Investors should focus on identifying Mutual Funds with a consistent performance history, disciplined investment approach, and alignment with their investment goals and risk tolerance.
If you wish to invest via Mutual Funds, visit us our MF Zone page.
In conclusion, Mutual Fund investments offer a convenient and effective way for investors to participate in the growth potential of the financial markets. The mantra "Mutual Fund, Sahi Hai" encapsulates the confidence in this investment vehicle to deliver sustainable wealth creation over the long term. By staying disciplined, diversified, and focused on the power of compounding returns, investors can achieve their financial objectives with Mutual Funds.
-
@Steve Davis Hi, the first seems to be the "Close Chart", while the second is the "High-Low" chart.
The chart plotting is different for both. Hence, it is not a mismatch, that's difference in chart formation.
-
Stocklist 27-04-2024
-
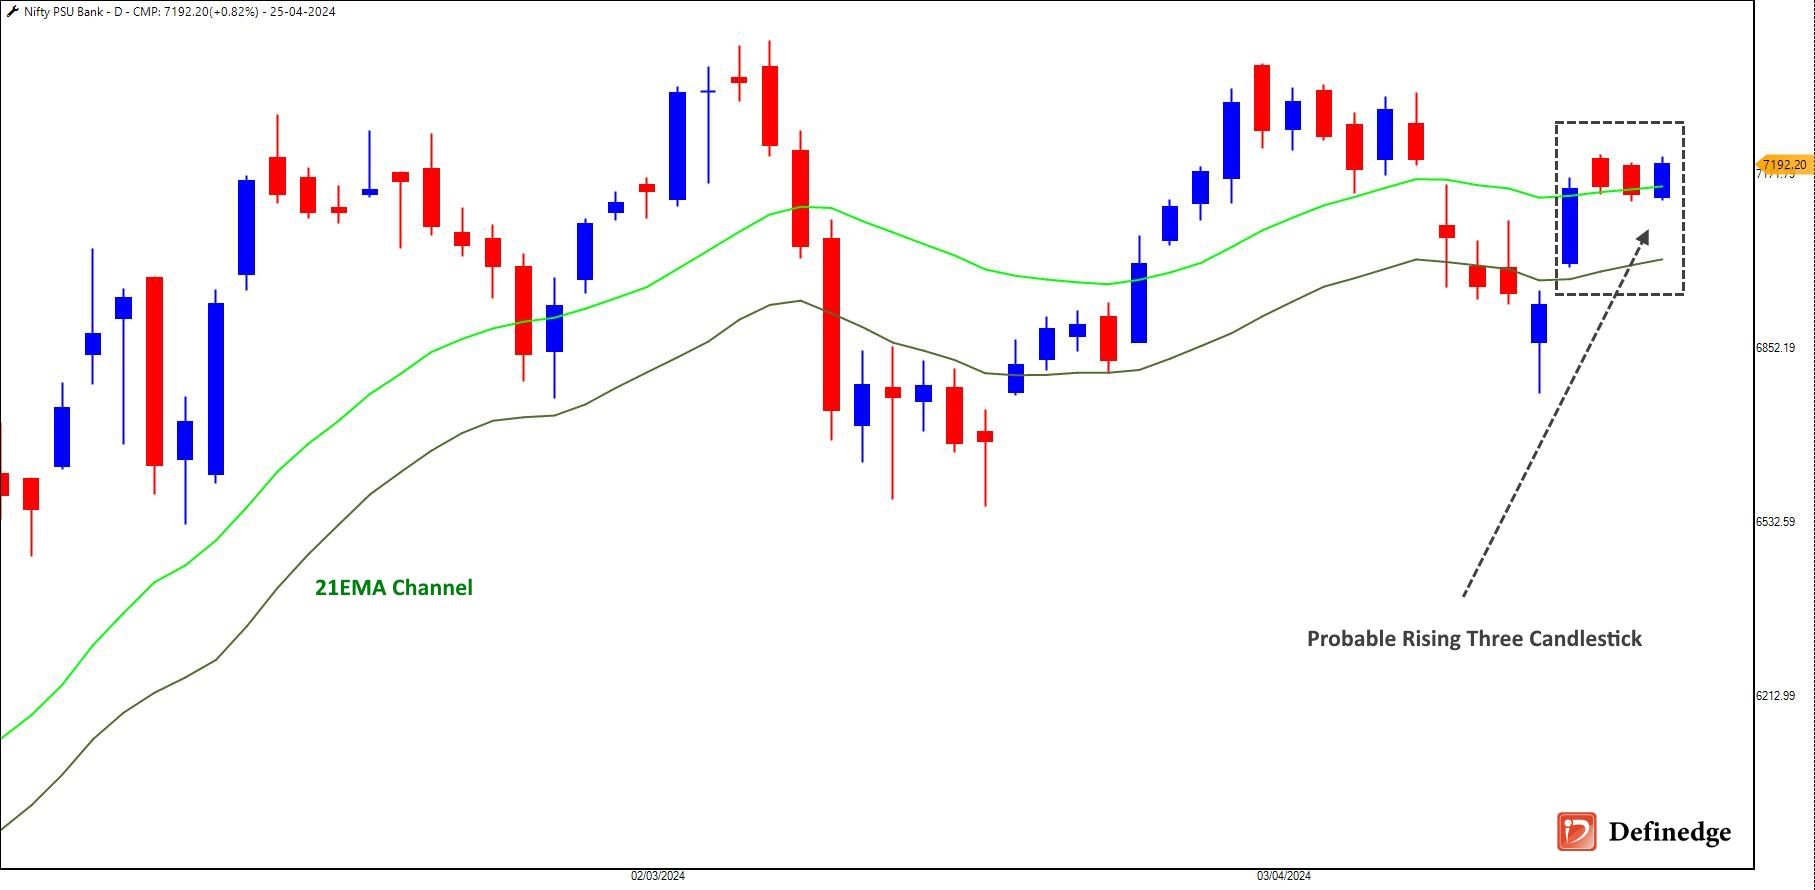
Nifty PSU Banks bulls seize the opportunity in the market dip. Analysis of the chart shows that the index has surpassed the short-term 21DEMA Channel, indicating a potential upward trend. Additionally, it appears to be forming a Rising-Three Candlestick pattern, a bullish signal that could be confirmed once the index breaches the 7,210 mark. Check out our detailed discussion in the following video: https://www.youtube.com/watch?v=ETPXQkMsbgs
On the stocks side, we ran the "All Chart Matrix" on RZone; here is the list of the stocks based on the scoring:
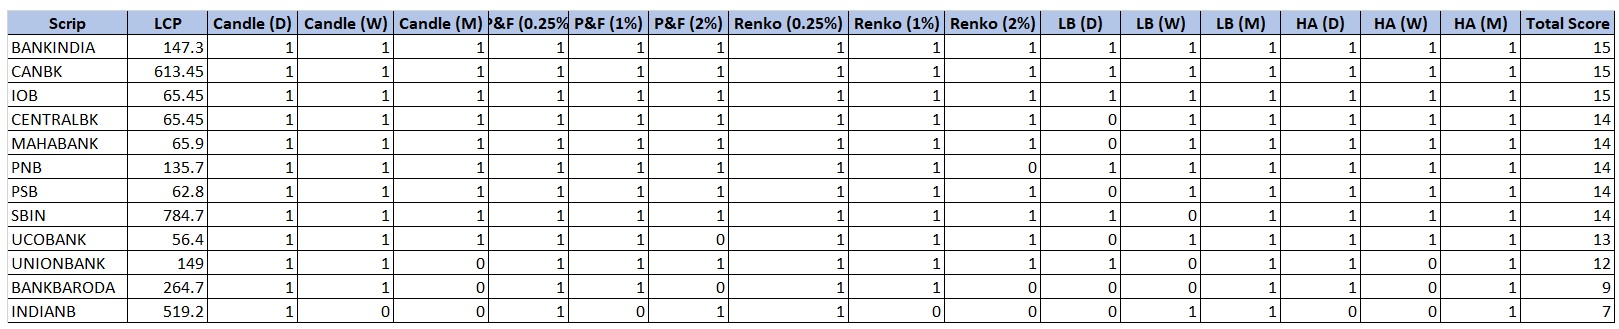
-
@Subramanya Joshi They haven't crossed yet.
-
I spent the last 15 years mastering the art of Harmonic Trading Patterns. I witnessed the bullish and bearish cycles of equities and commodities and learned from his experiences.
For weeks, I worked tirelessly, recording videos, writing scripts, and creating strategies to help traders understand the nuances of trading with harmonic patterns. I did not want to make another course; I just wanted to create a course that would be a game-changer for anyone who took it. Finally, after months of hard work, the course is LIVE.
I had poured my heart and soul into it and was proud of our creation at Definedge. The Harmonic Trading Course will be available at an unbeatable price of just Rs. 5999, and it would be an excellent value for anyone who wants to add a valuable strategy to his trading kitty and master the art of trading.
I am happy to make a difference in the lives of so many traders. Trading is challenging, but anyone can succeed with proper guidance and strategies.
Enrol Now on gurukul.definedgesecurities.com

-
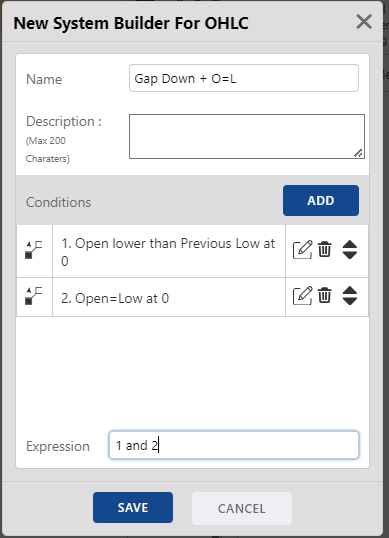
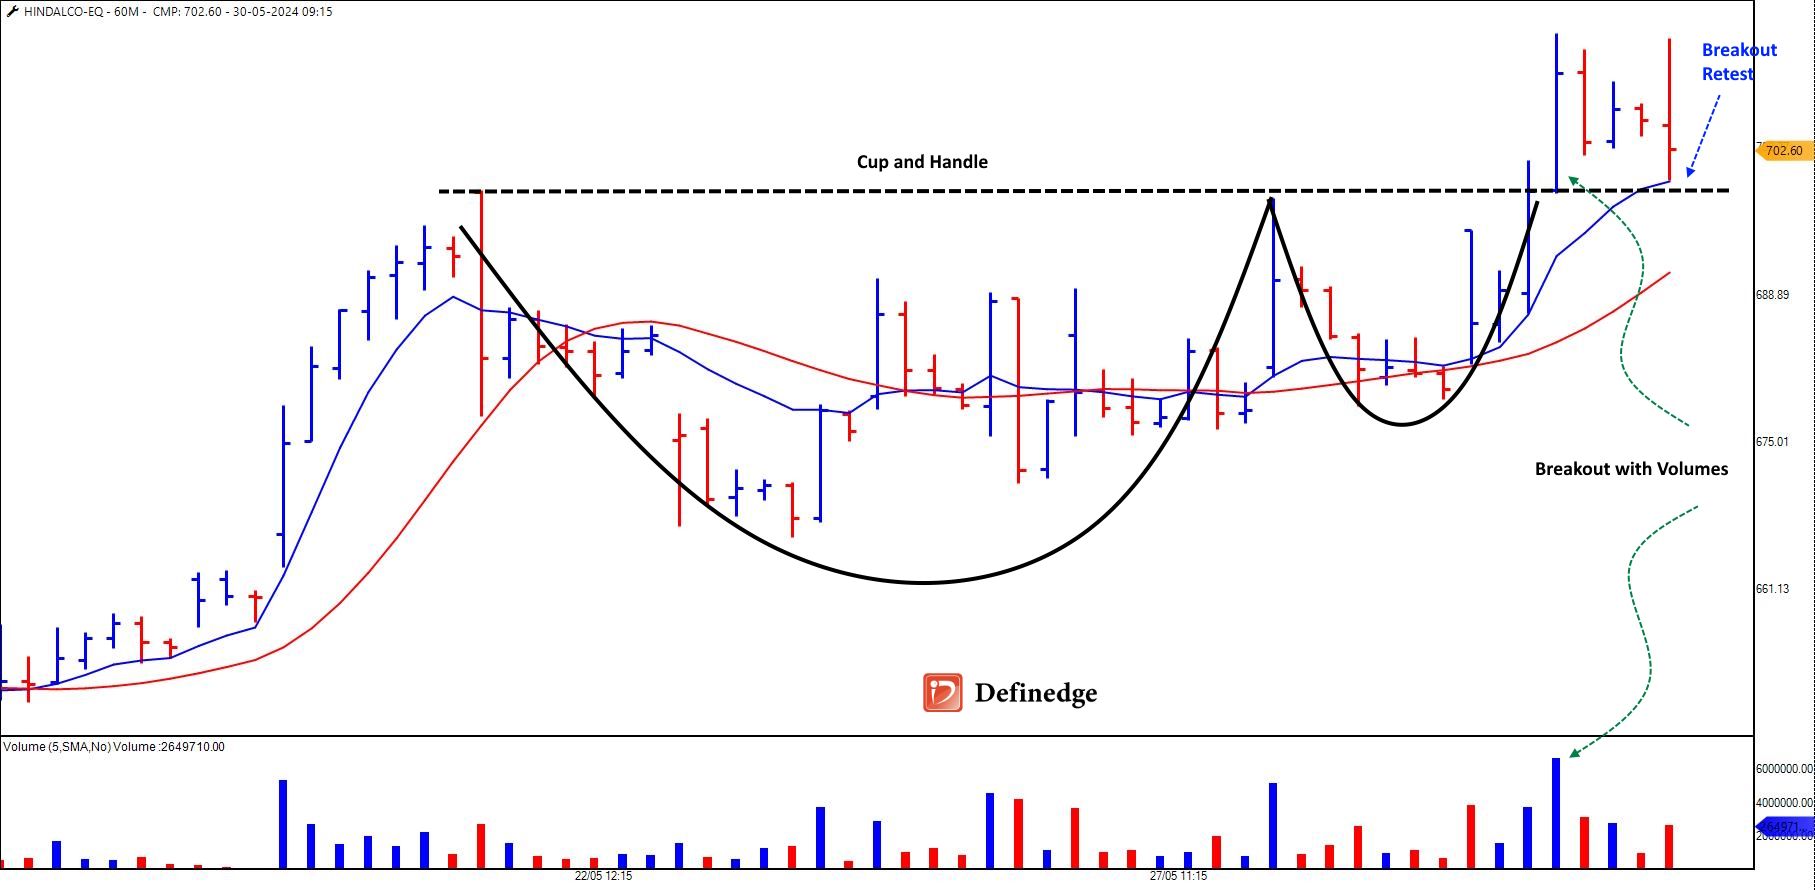
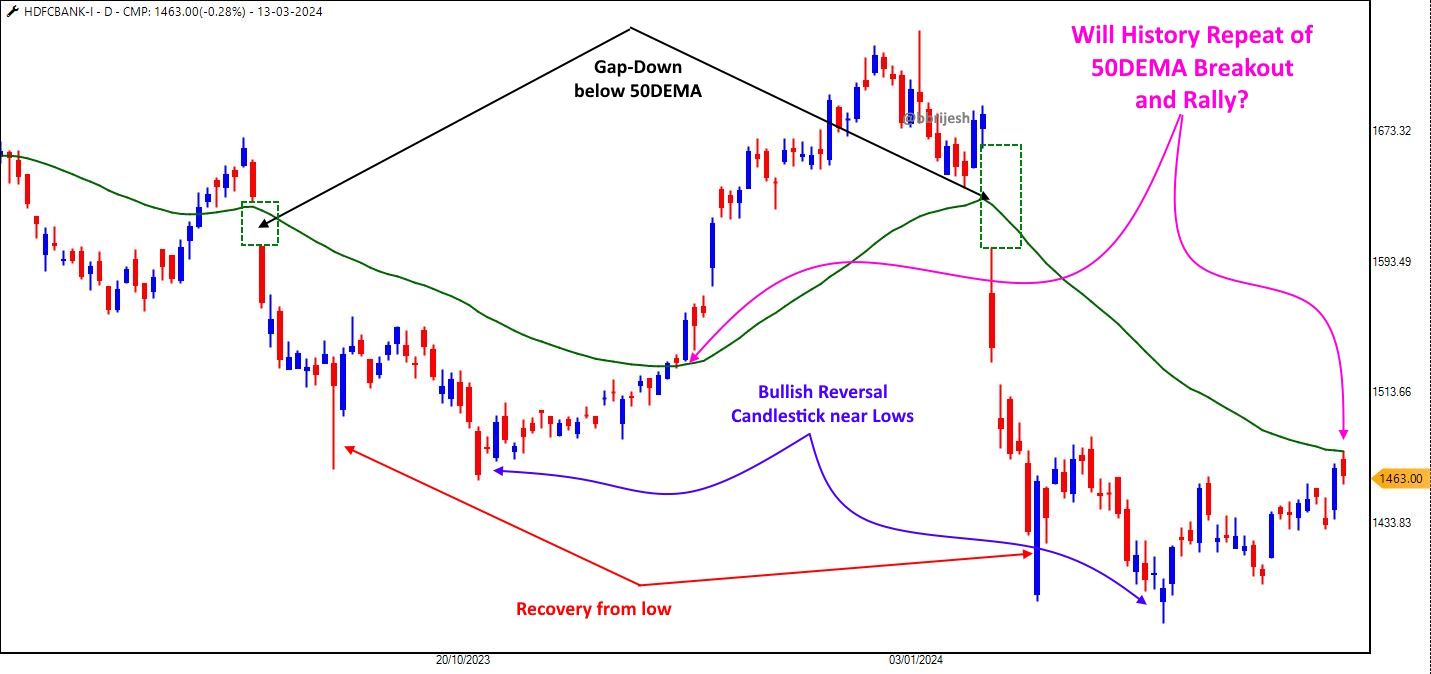
Technical Parameters:
- Open=Low today in the support zone
- Gap as support zone
- Moving Average Channel - 62DEMA
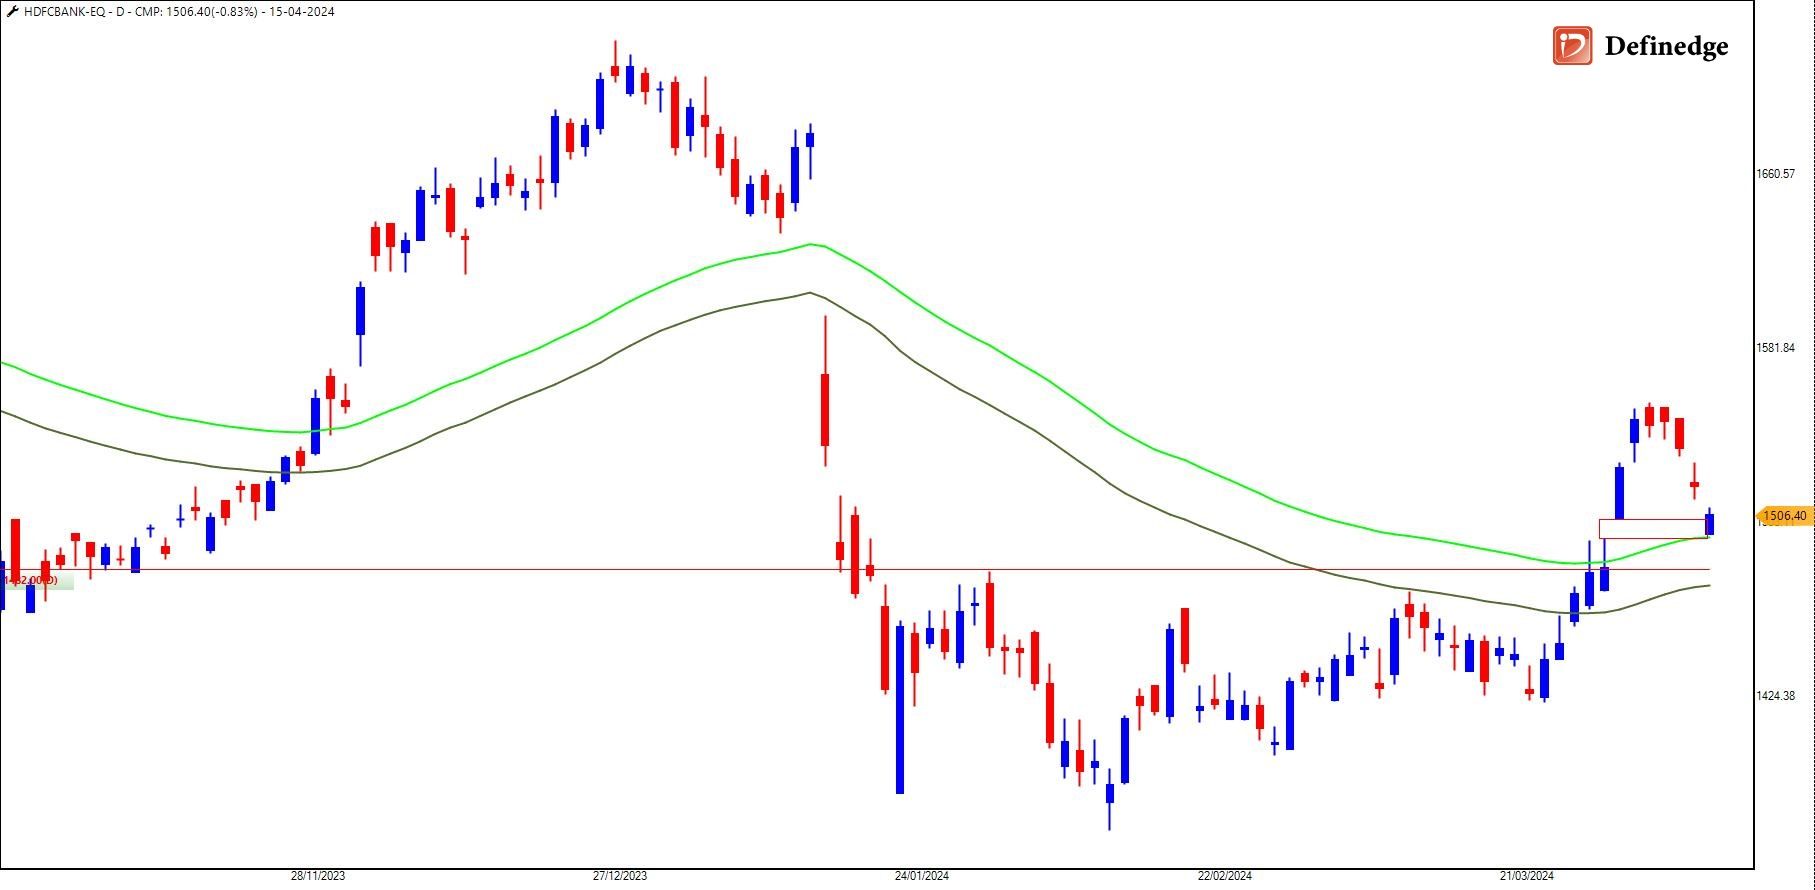
Read our previous article - https://www.definedgesecurities.com/blog/whats-trending/swimming-in-the-big-whales-wake-hdfc-bank/
-
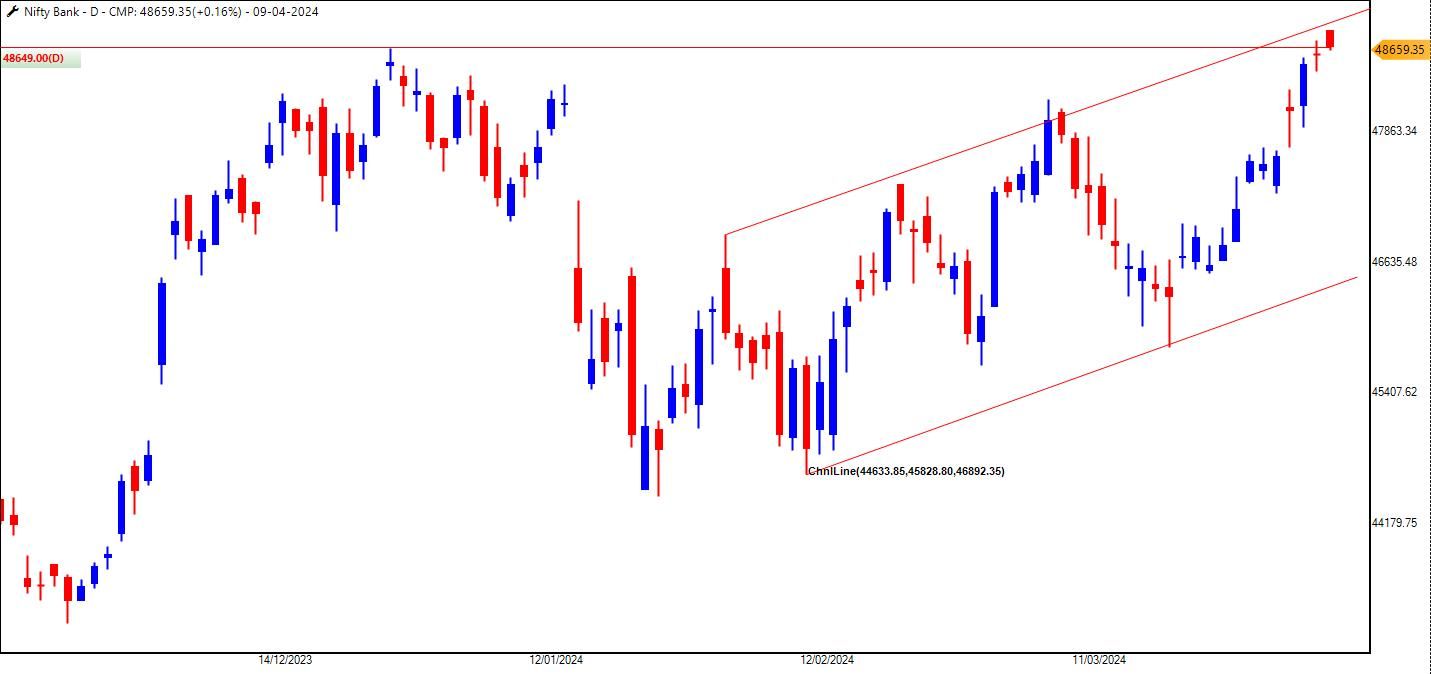
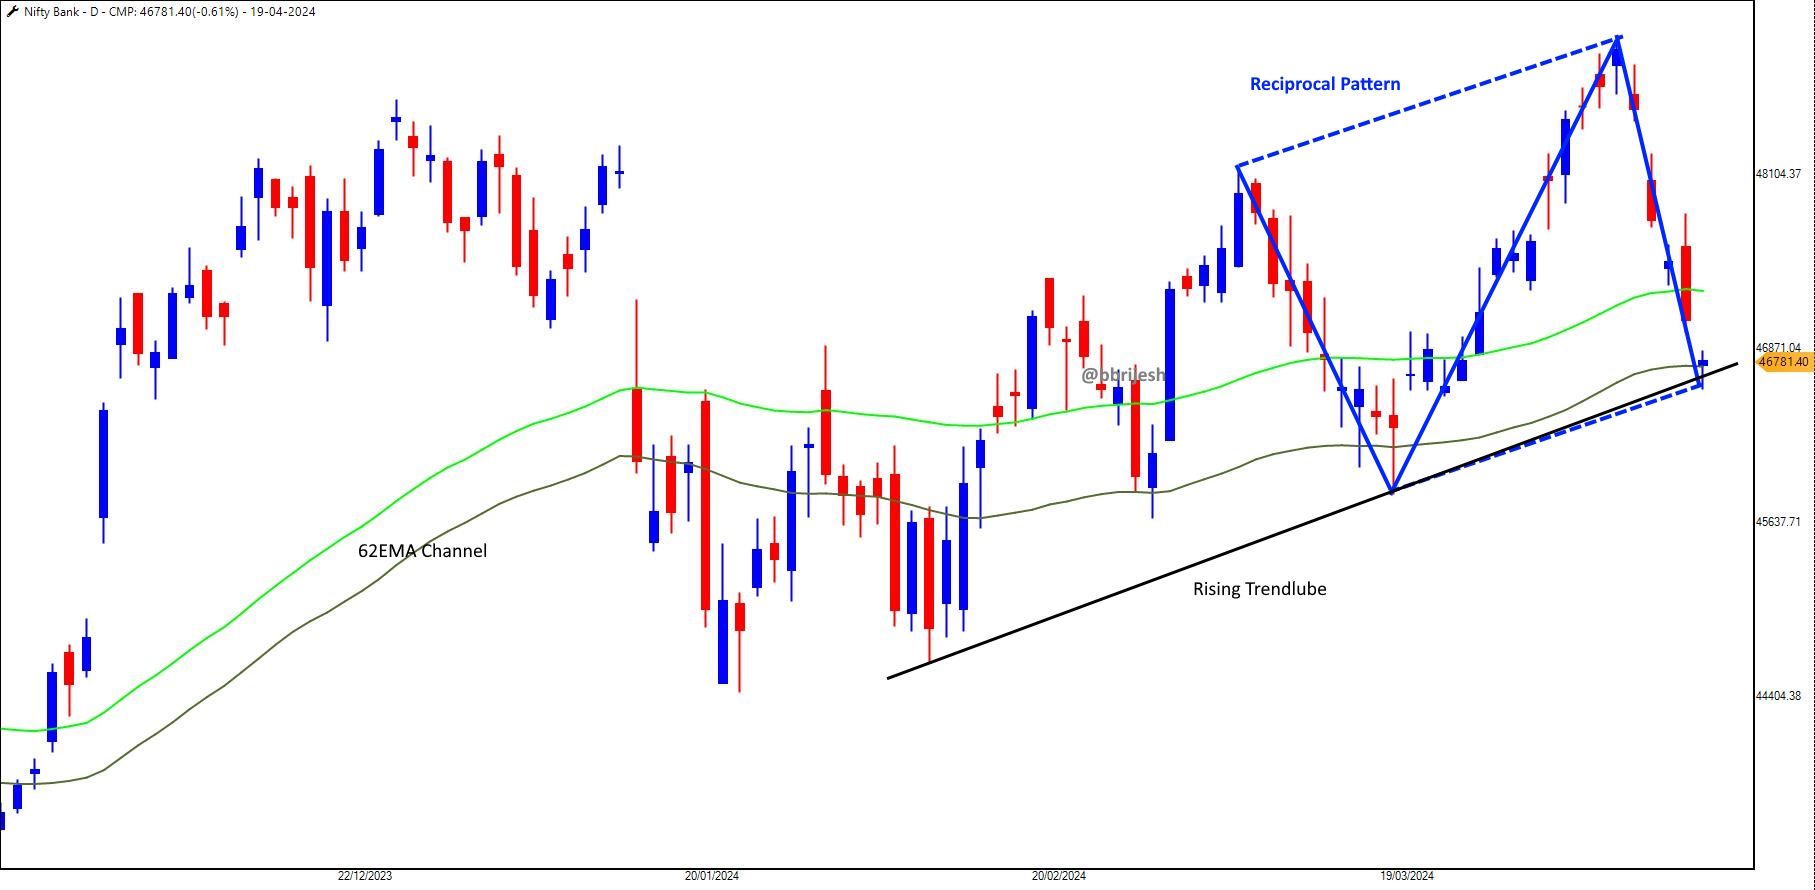
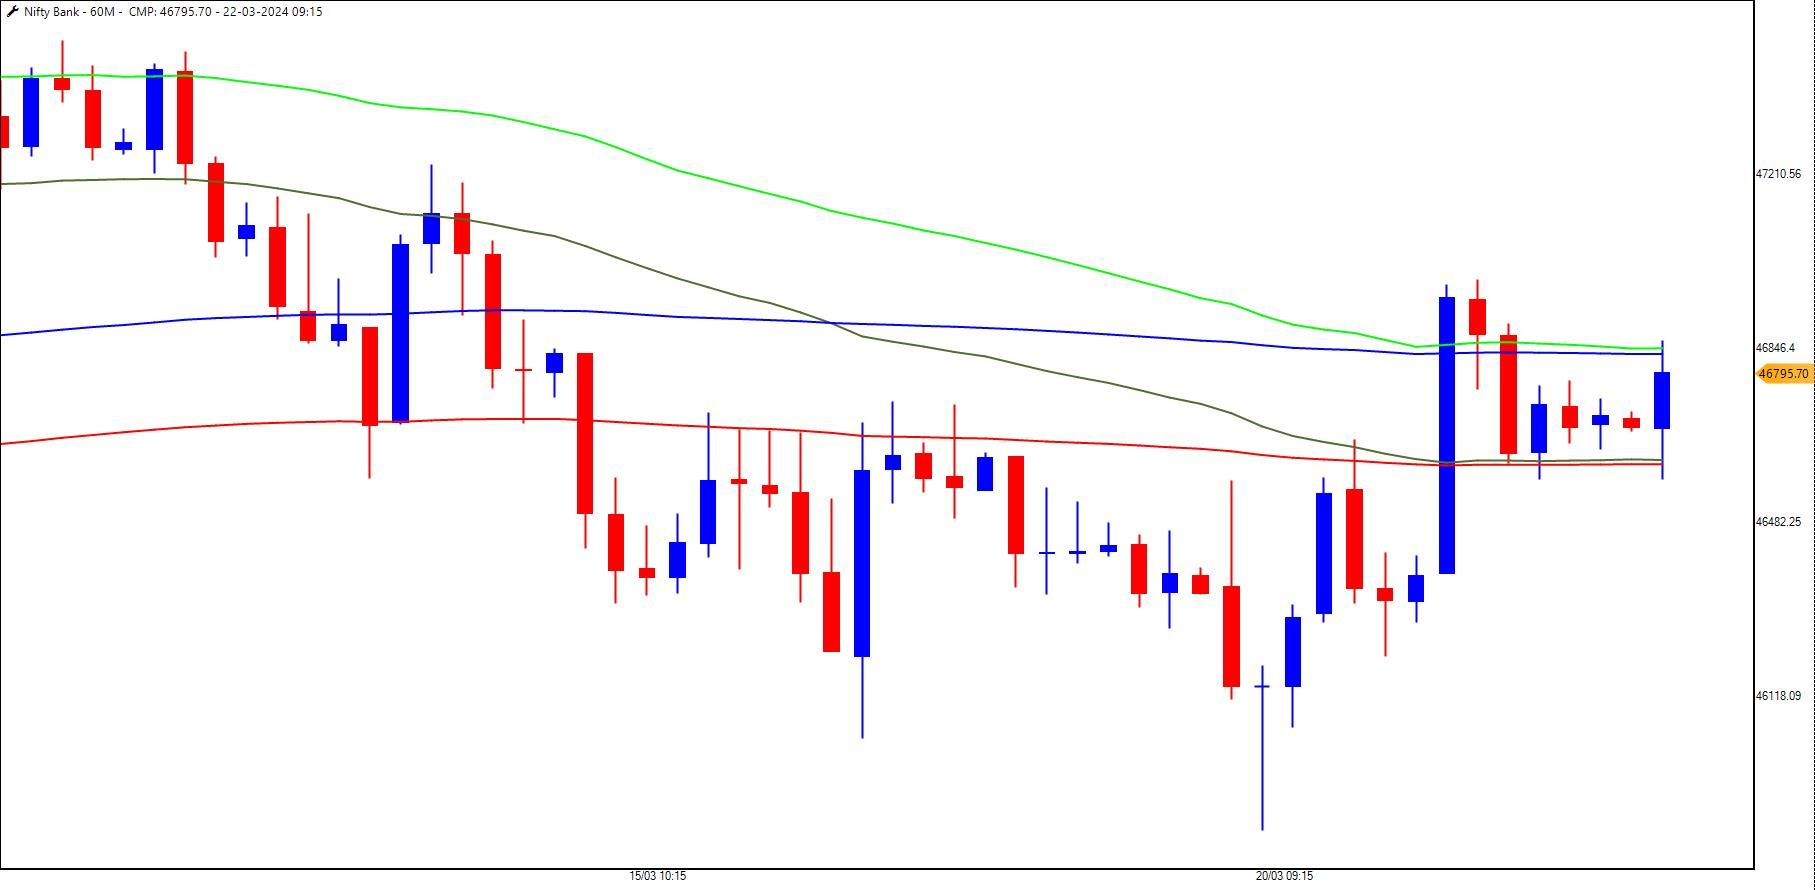
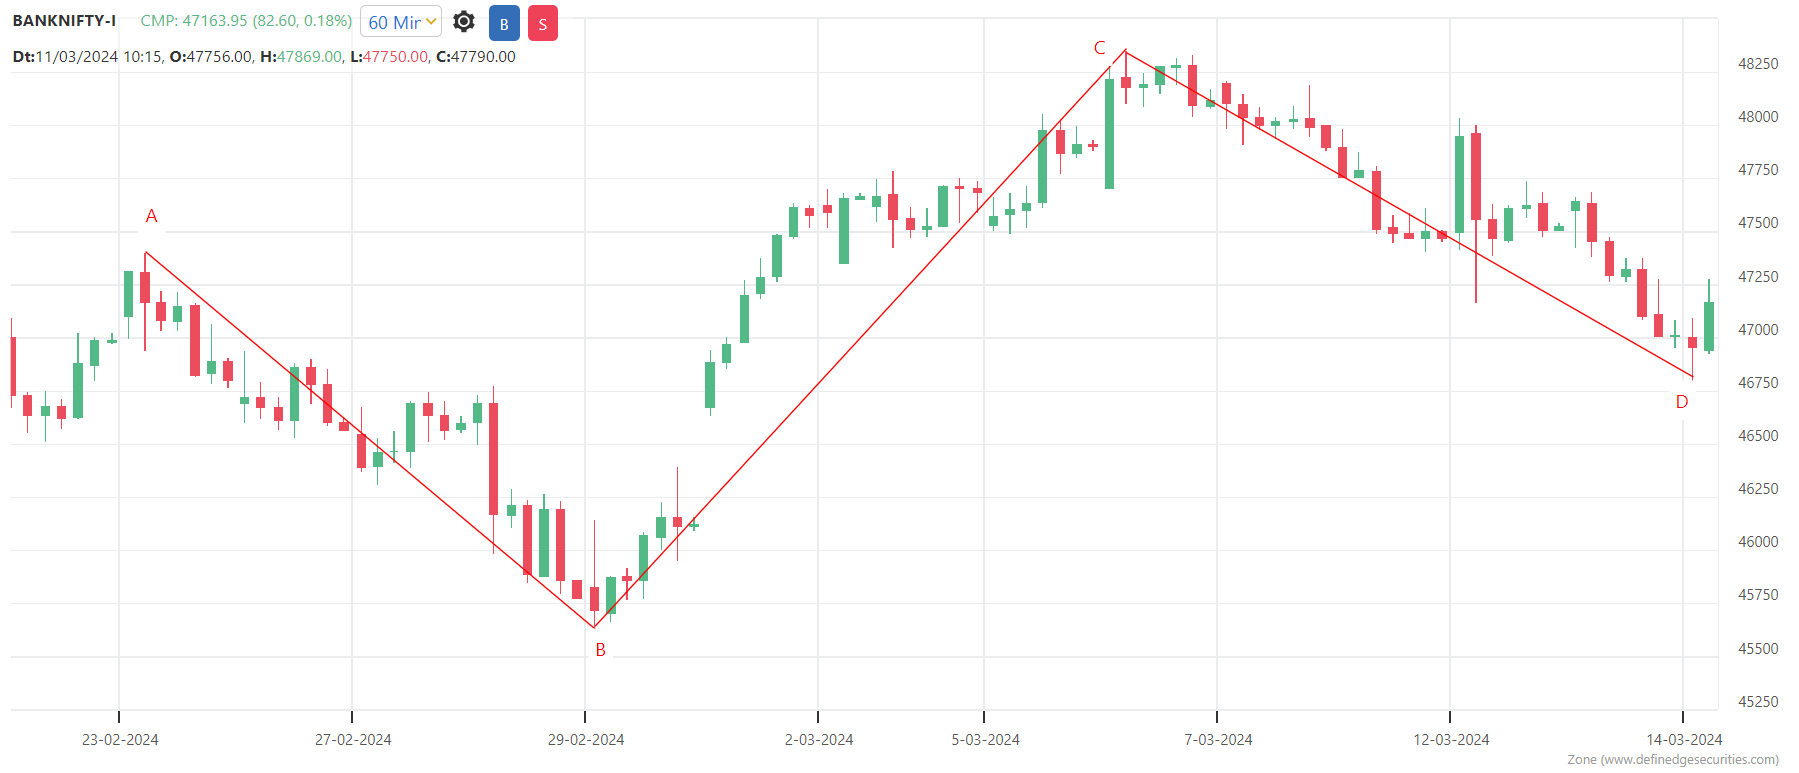
Bank Nifty hits an all-time high of 48,812 but with nearly an open=high, a structure which doesn't excite bulls.
The horizontal trendline and rising channel indicate the range of 48,900-48,400 to be the trend decider.
-
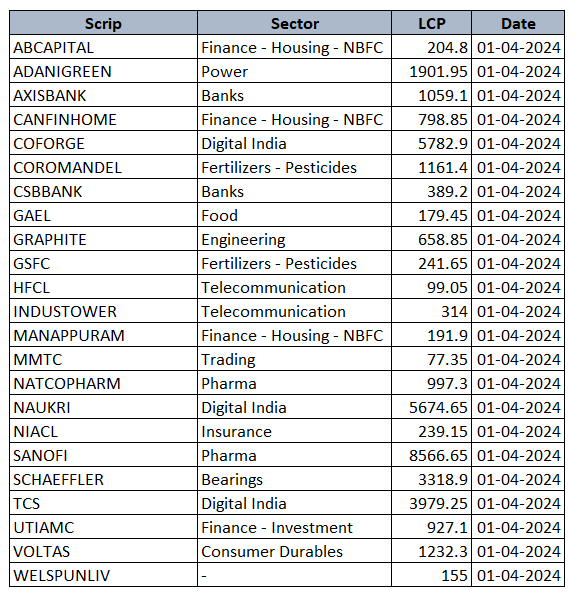
Stock list 6th April 2024
-
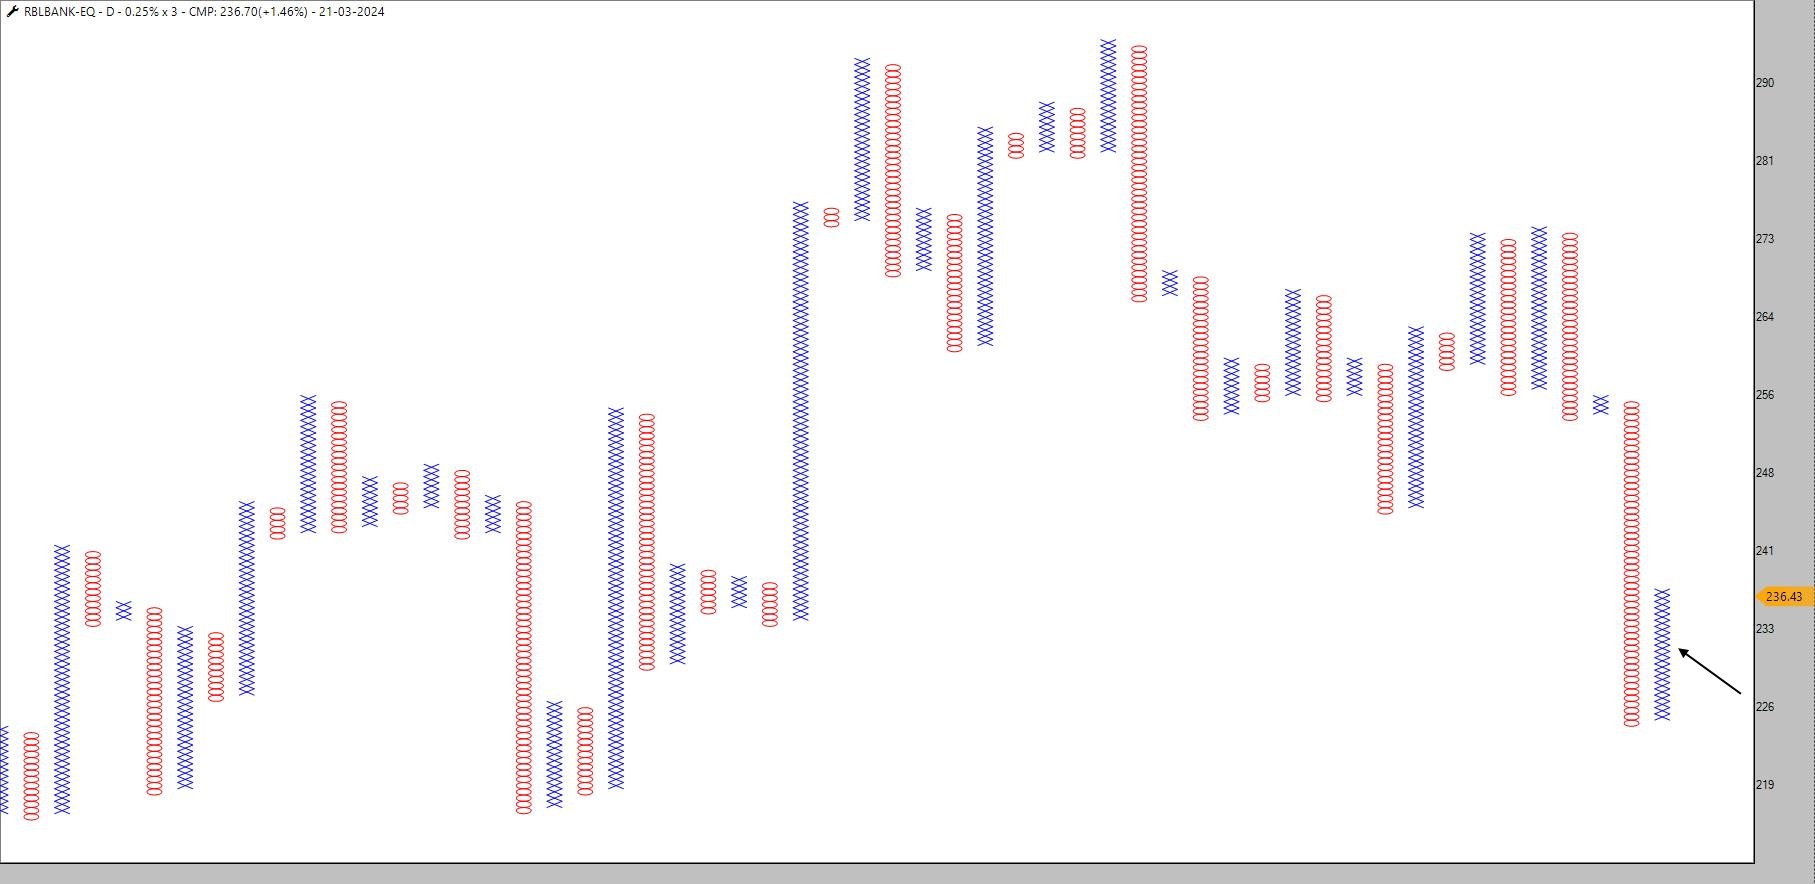
RBL Bank - 224 to 250+
-
Stock list 30th March 2023
-
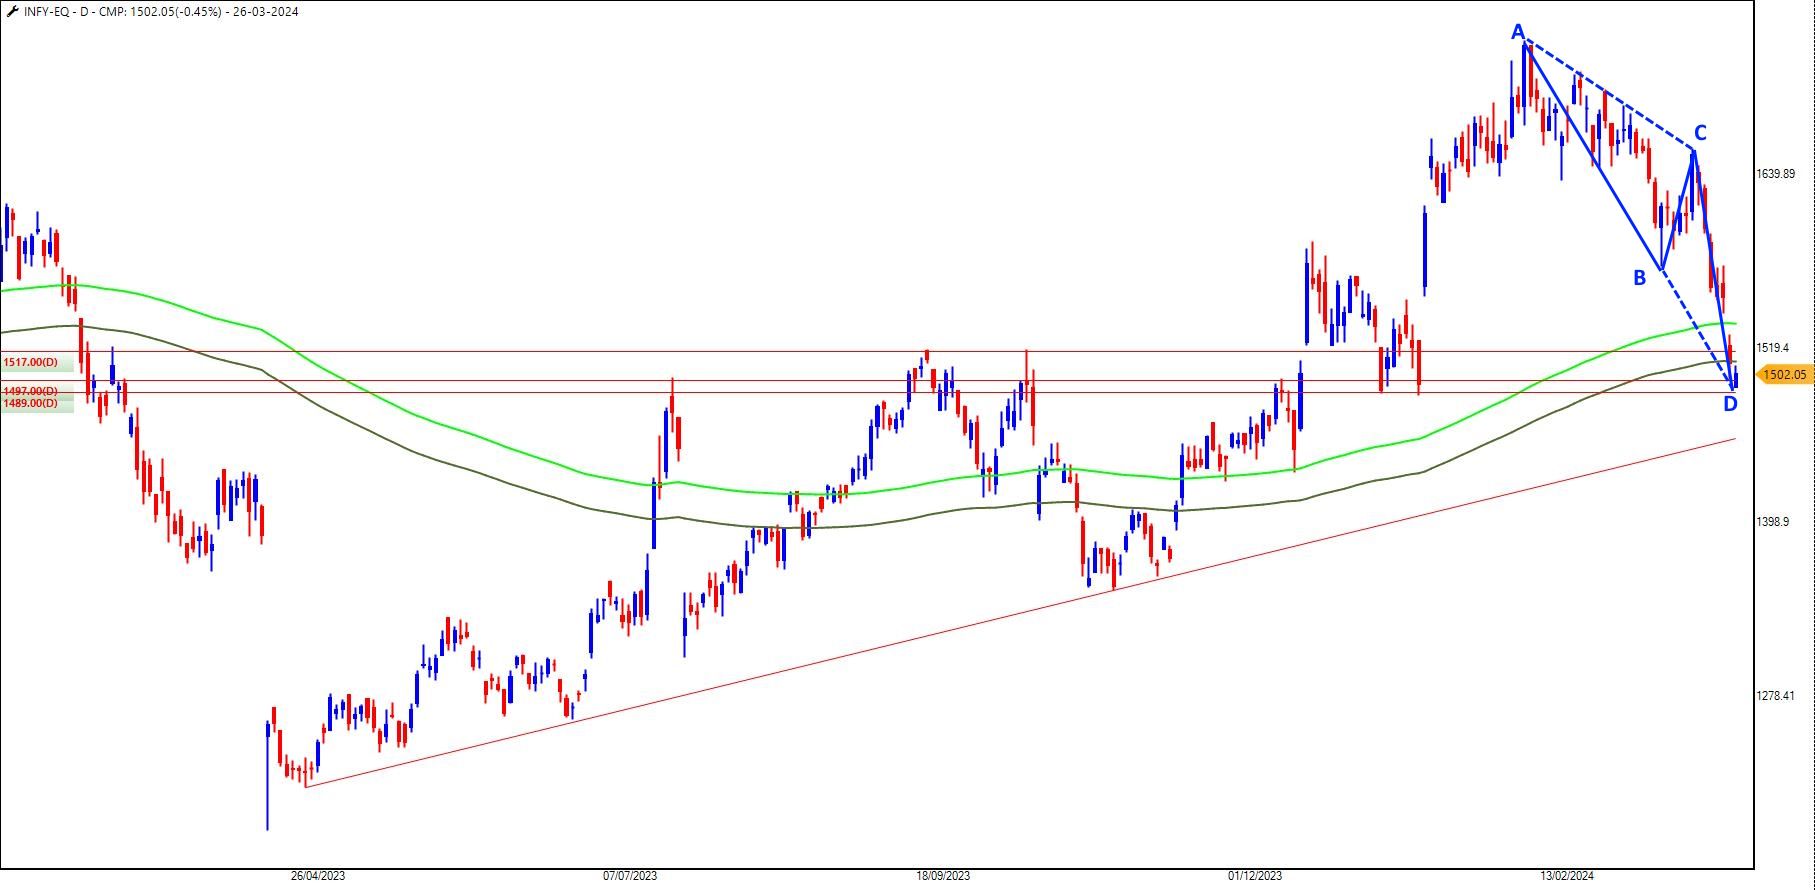
Pattern negates below 1,475
-
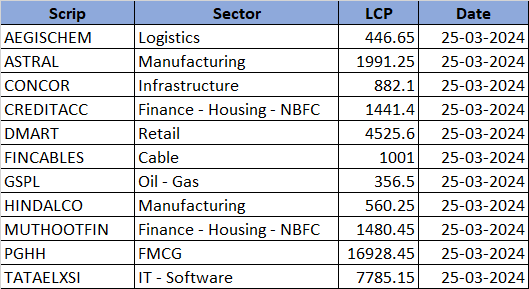
Stock list 23rd March 2024
-
Hey everyone, as you have probably seen, I recently covered the concept of Moving Average channels in my latest video (Click here for Video).
I wanted to open up this discussion to our FORUM users, inviting any questions or doubts you might have about the topic.
Feel free to ask away, and I'll do my best to provide clear explanations and solutions to any queries you may have. Post your queries in the comment below.
*Please read the questions and answer before posting as the same question may be answered in the discussion.
-
Watch this video to understand the concept of Moving Average Channel https://www.youtube.com/watch?v=DkjxwHt3xlA
-
RBL Bank Updated Chart - 224 to 237
Move SL @ 222 (CB)
-
Superb follow-through after Fed...Expecting $2285-2360 this year.
-
Stock List 16th March 2024
-
@ASHISH MAURYA Great!
-
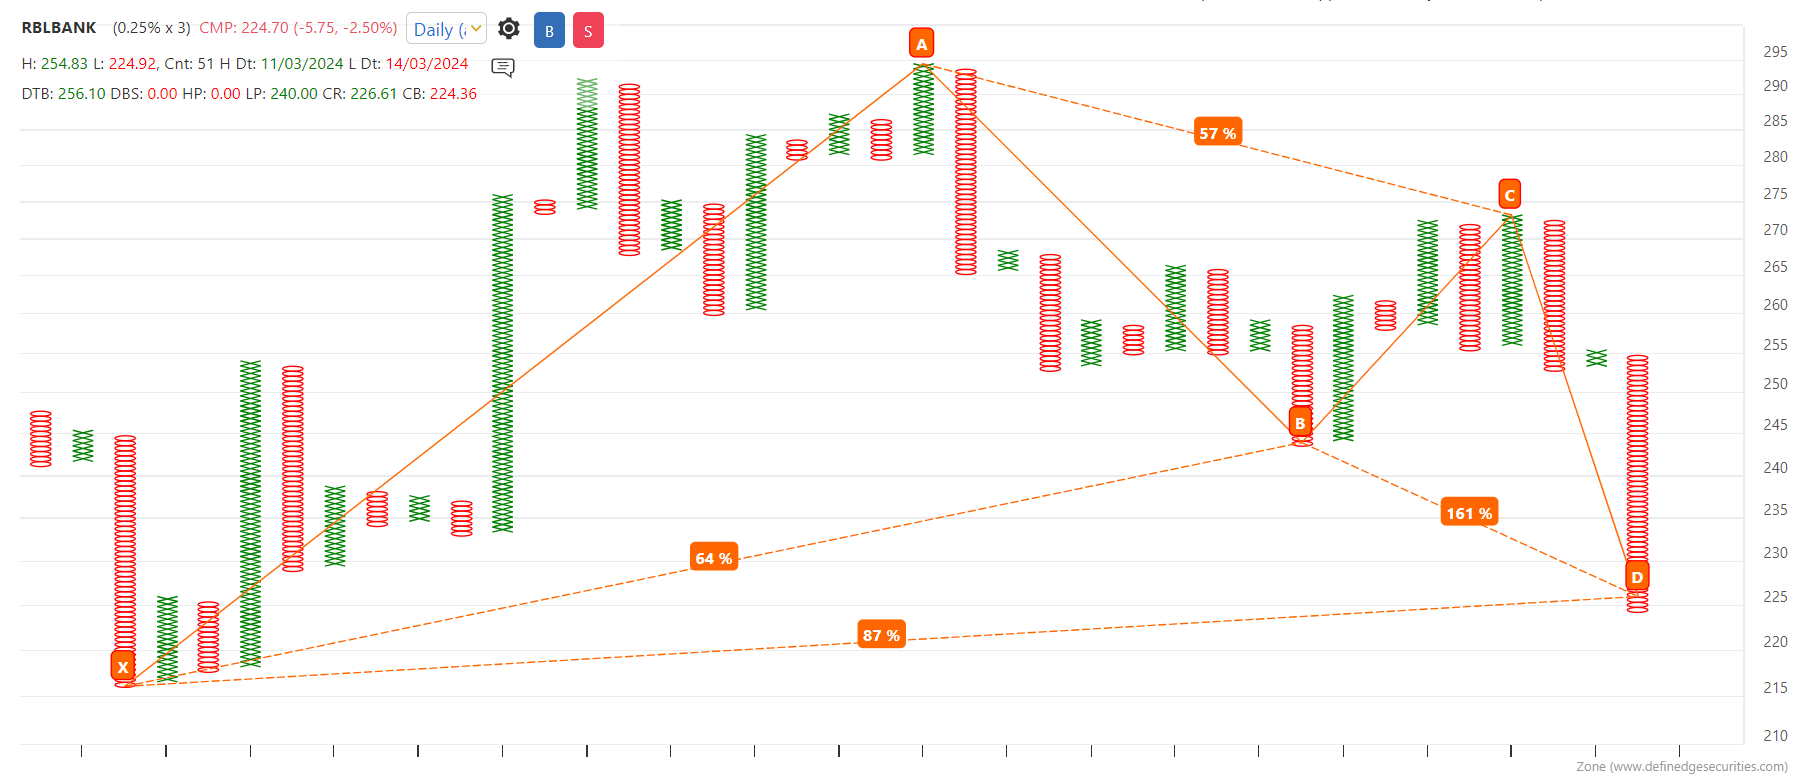
Pattern Negates Below 215 (CMP-224)
-
@Bharat Bhatia Course on its way
-
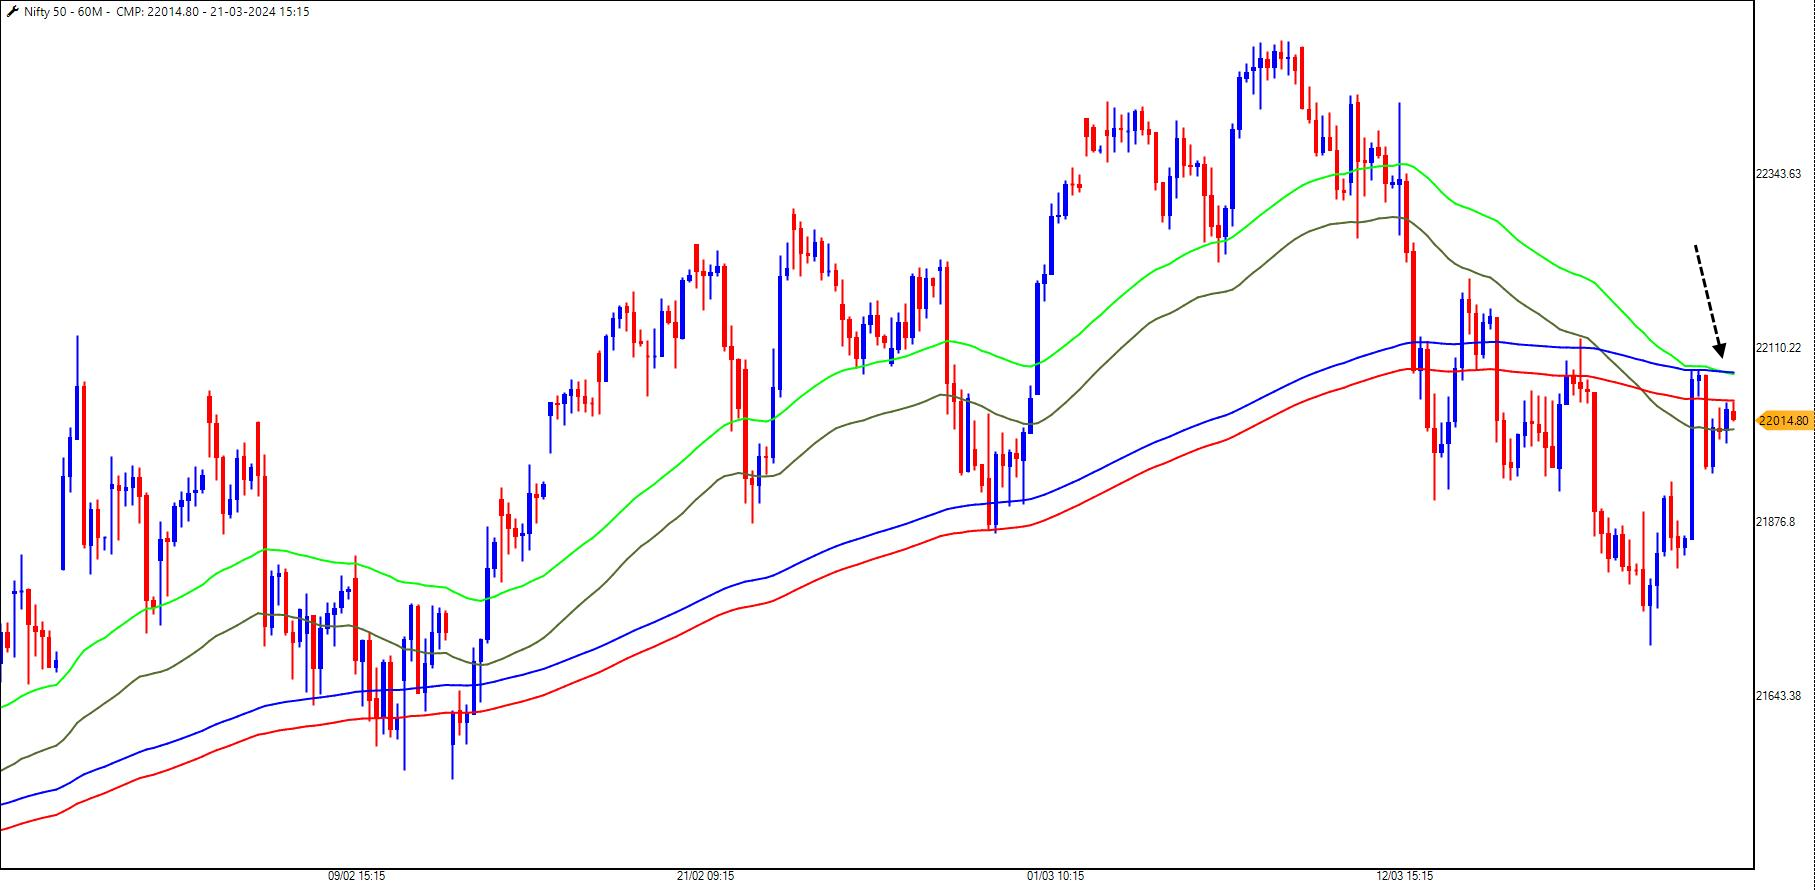
Patterns negates below 21,850
-
@Deepakk Chabria Hi sir,
Here is the link for Stochastic
https://youtu.be/q-iyx3coreg?si=FPUhfTZ39eKtBl3a -
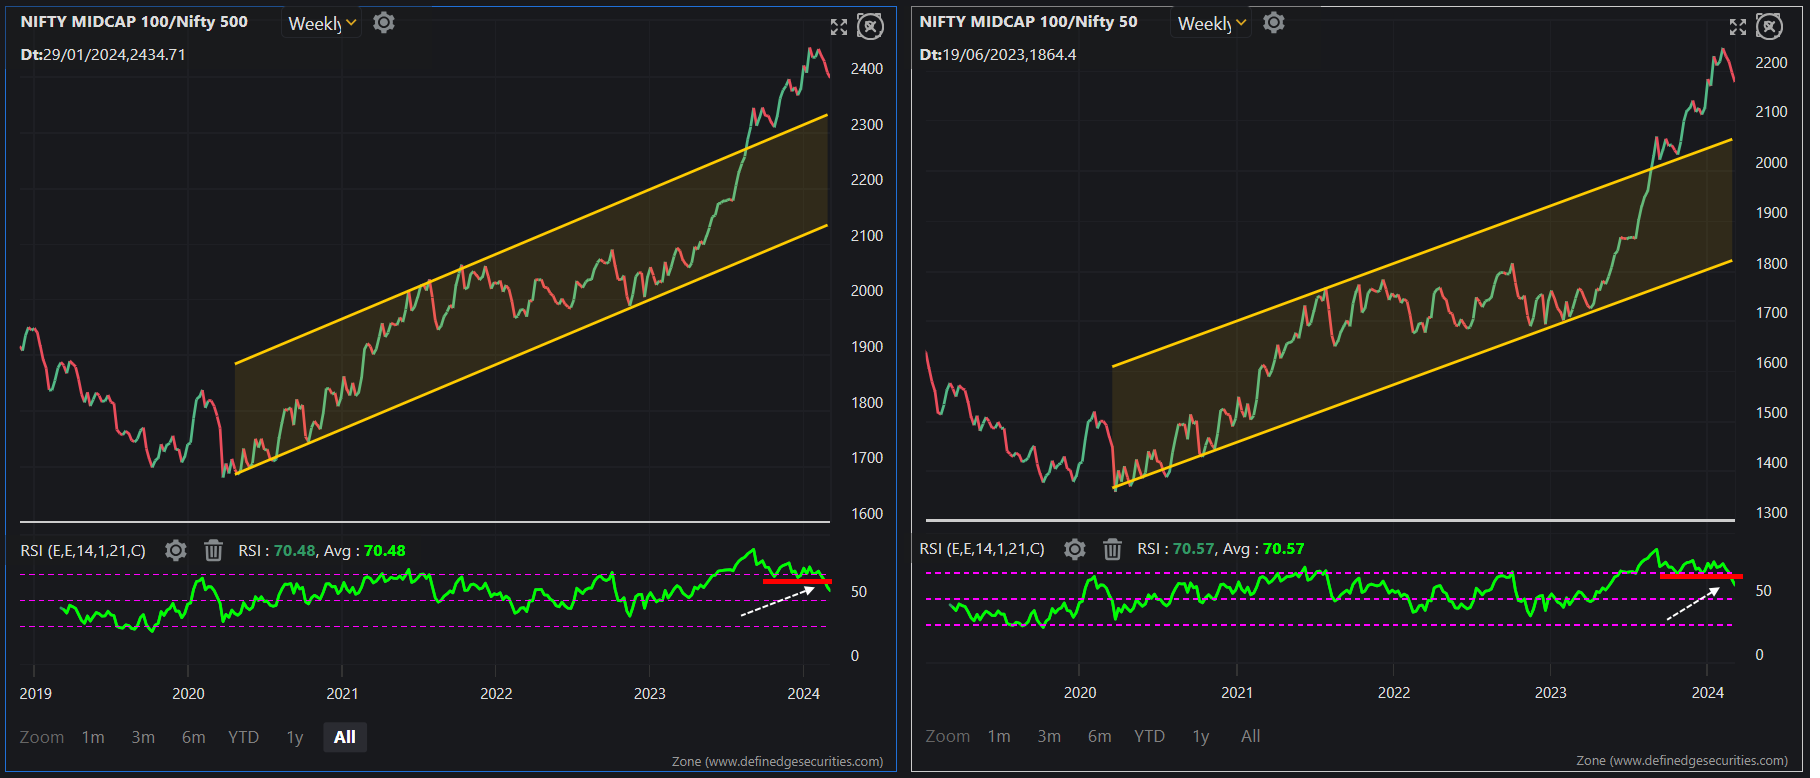
Large caps appear poised to take the spotlight as indicators suggest a shift in market dynamics.
The ratio charts of NiftyMidcap/Nifty500 and NiftyMidcap/Nifty50 are showing signs of exhaustion, with their slopes turning southward.
Relative Strength Index (RSI) further corroborates this trend, signaling a breakdown in midcap strength against both the Nifty500 and Nifty50.
These chart setups highlights that large caps are gearing up to seize the opportunity, as if proclaiming, "Apna Time Aayega."
-
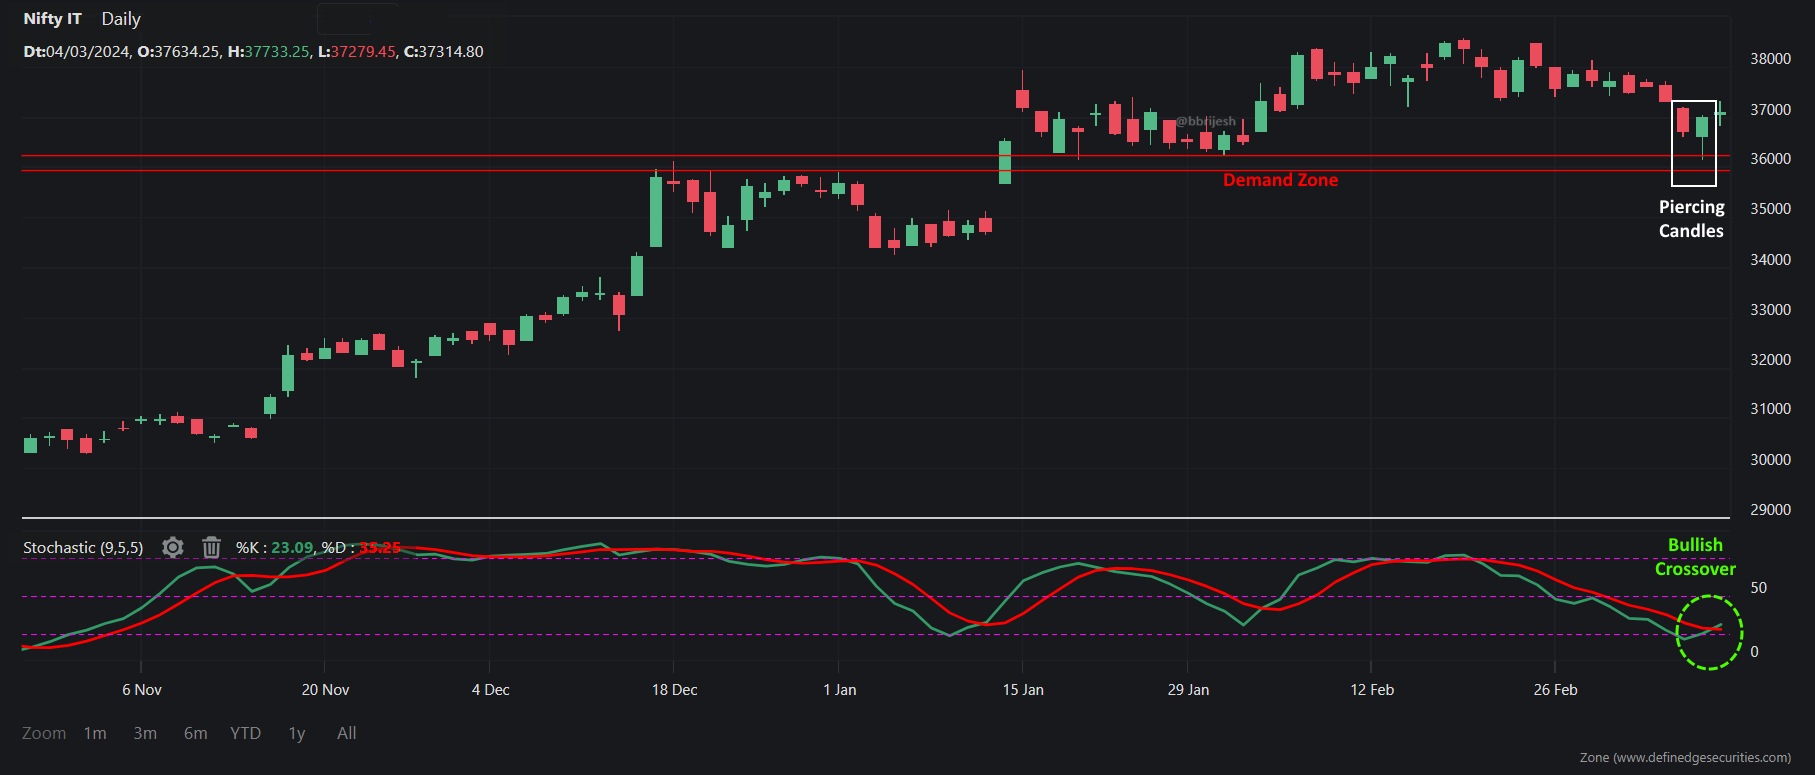
The Nifty IT Index is showing strong signs of a bullish trend as indicated by the formation of a Bullish Piercing Candlestick pattern within the demand zone.
The stochastic indicator has given a bullish crossover, further supporting the notion that bullish momentum may take the lead in the near future. These technical indicators collectively point towards a favorable outlook for the Nifty IT Index, suggesting potential opportunities for investors to capitalize on the upward movement in the market.
-
Stock List 9th March 2024
-
The market is at an all-time high, and investors are understandably confused about where to put their money.
If you've been following the "Laidback" strategy, congratulations! This is the market phase exactly when it shines.For the past few months, I have been exploring the DONSHI strategy, which shares similarities with Laidback but utilizes a combination of two indicators to define the entries.
Let's understand how DONSHI can help you trade and invest in these high markets.
DONSHI: A Blend of Donchian Channels and RSI
DONSHI combines two popular technical indicators: the Donchian Channel and the Relative Strength Index (RSI).
Donchian Channel (DC): This indicator creates a dynamic upper, middle and lower band based on the recent highs and lows in price.
Relative Strength Index (RSI): The RSI measures the momentum of price movements, indicating potential buying and selling opportunities.
Entering and Exiting the Market with DONSHI
The DONSHI strategy employs these indicators to determine entry and exit points:
Entry: Buy when the price closes above the middle line of the DC (20), and the RSI (14) should be above 60. This confluence of signals suggests a potential uptrend with strong momentum.
Exit: Sell when the price hits the lower line of the DC (20).
Using DONSHI with RZONE
You have an advantage if you're a Definedge Securities client using RZONE! I've already published the DONSHI strategy in the Public System Builder, making it readily available for you to implement.I have recorded a video on this setup with back-testing results on various sectors and stocks. Click here to watch the video
-
UPDATED CHART: Nifty FMCG Index with 50DEMA and 200DEMA
-
In stock market trading, there's a perpetual quest for efficiency, accuracy, and profitability. Among traders, there's a prevailing debate between being a systematic trader versus a discretionary one. The former relies on predefined rules and algorithms to execute trades, while the latter depends on human intuition and judgment. In recent years, trader's interest in systematic trading has increased, driven by technological advancements and access to sophisticated tools and platforms.
A common sight in the trading community is traders spending countless hours crafting scripts and algorithms to automate their trading strategies. These scripts often involve complex combinations of technical indicators, statistical models, and machine learning algorithms aimed at generating profitable trades.
Last evening, I went for dinner with a friend who connected with me on Twitter. He is also a trader engrossed in developing a script based on the Relative Strength Index (RSI) and Bollinger Bands. He had devoted five months to refining his system, tweaking parameters and fine-tuning the code to achieve optimal results.
However, amidst the fervour of script writing and system development, it's crucial to recognise the limitations inherent in this approach. No matter how diligently one fine-tunes a trading system, there's always an element of uncertainty and unpredictability in the markets that cannot be fully accounted for.
During a dinner conversation with him, I demonstrated an alternative approach to systematic trading that challenged his conventional mindset. Leveraging the tools and resources provided by Defiendge Securities, I swiftly recreated his trading system using the RZone platform. We replicated his strategy with just a few clicks and conducted backtesting to assess its performance. The results showed the power and efficiency of sophisticated trading platforms.
Although we achieved impressive results in backtesting, I advised him to conduct front testing with the data to validate the system's performance in real-time or simulated real-time market conditions.
In addition to backtesting, front testing is a crucial step in evaluating the effectiveness of system trading strategies. While backtesting involves analyzing historical data to assess how a trading system would have performed in the past, front testing allows traders to observe how the system performs in real-time or simulated real-time market conditions. Front testing also enables traders to identify any discrepancies between backtested results and actual real-time performance, allowing adjustments and refinements before committing capital to live trading. By incorporating front testing into the evaluation process, traders can enhance the robustness and reliability of their trading systems, ultimately increasing their chances of success.
It's 1 am, and our discussion deep-dived into systematic trading, exploring the trade-offs between DIY scripting and leveraging existing tools and technologies. While there's merit in customising trading systems to suit individual preferences and trading styles, there's also value in embracing pre-existing solutions that offer robust features and functionalities. As the night wore on, the trader realised that sometimes, the most prudent decision is to leverage the right tools rather than reinvent the wheel.
The key takeaway from our discussion is the importance of exploring the myriad tools and resources available for systematic trading. Whether utilising advanced trading platforms like RZone or accessing comprehensive guides and tutorials, traders can enhance their efficiency and effectiveness by leveraging existing solutions. While there's no one-size-fits-all approach to trading, being open-minded and adaptive to new technologies and methodologies can significantly elevate one's trading prowess.
In conclusion, while you can script the system, you cannot script a trade with absolute certainty. The uncertain nature of stock markets demands a flexible and adaptive approach to trading. By embracing the tools and technologies available, traders need to trade with confidence and agility. Whether you're a veteran or a novice trader, the key to the success of a trading system lies in continuously refining your strategies, leveraging available resources, and staying ahead of the curve in systematic trading.
-
@Brijesh Bhatia Pattern Negated.
-
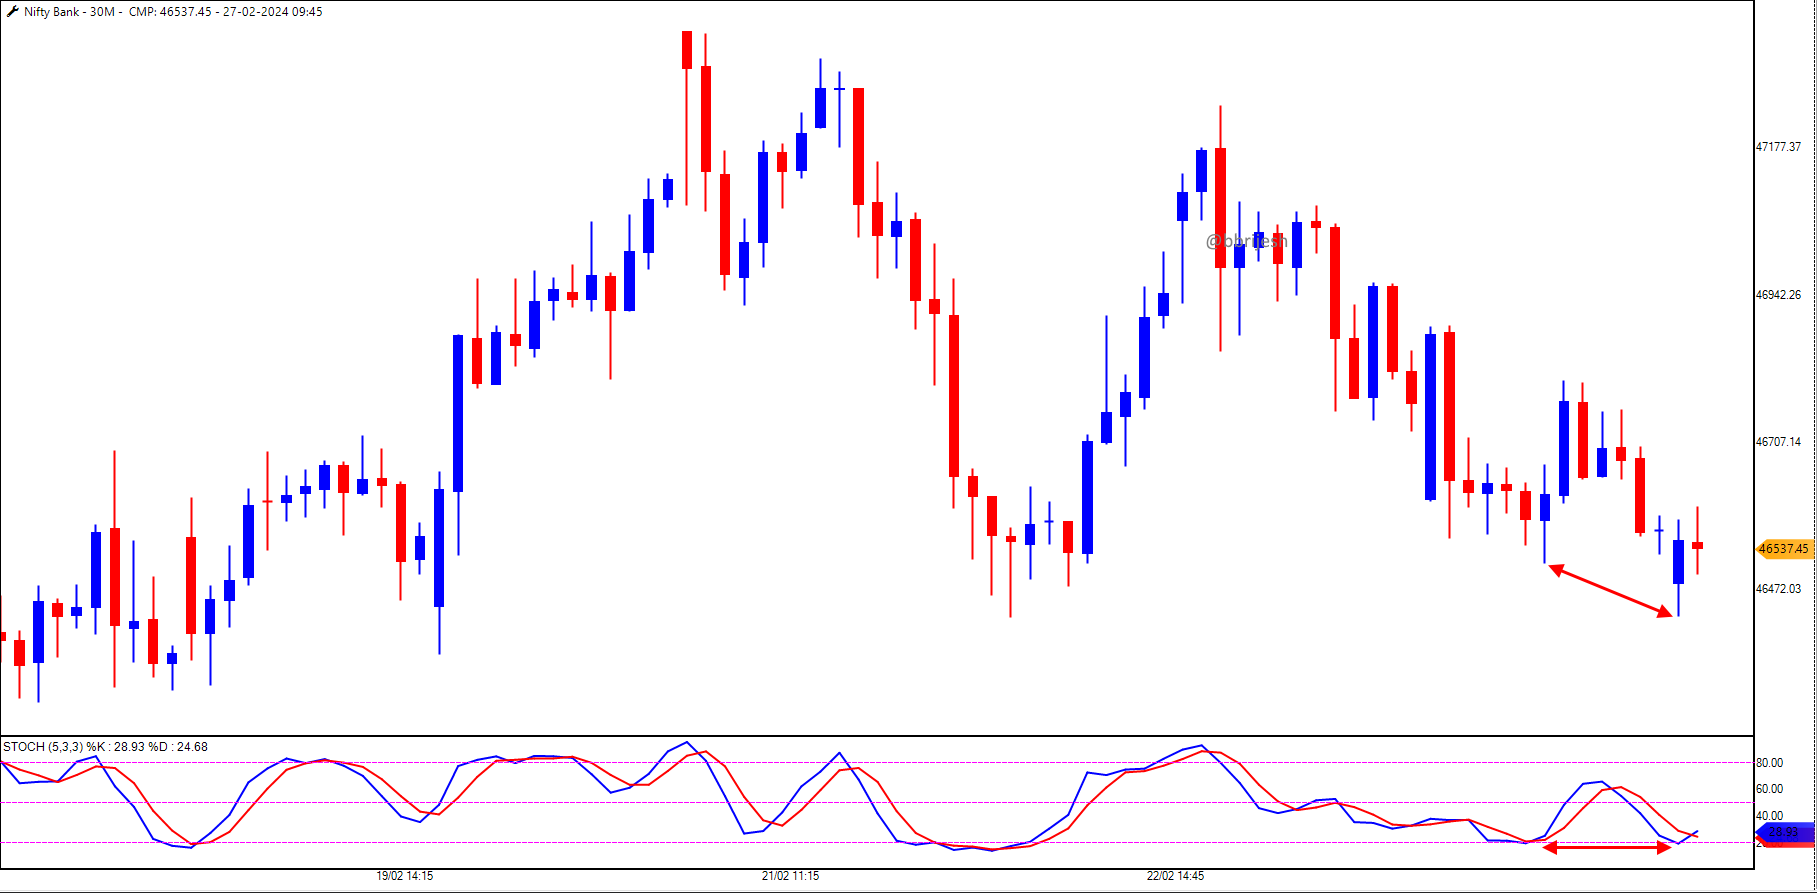
The setup negates below 46,333
-
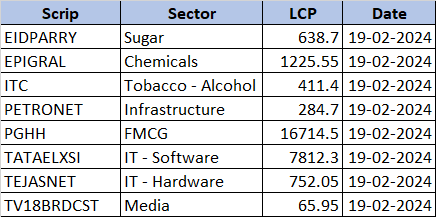
Stock List 24th Feb 2024
-
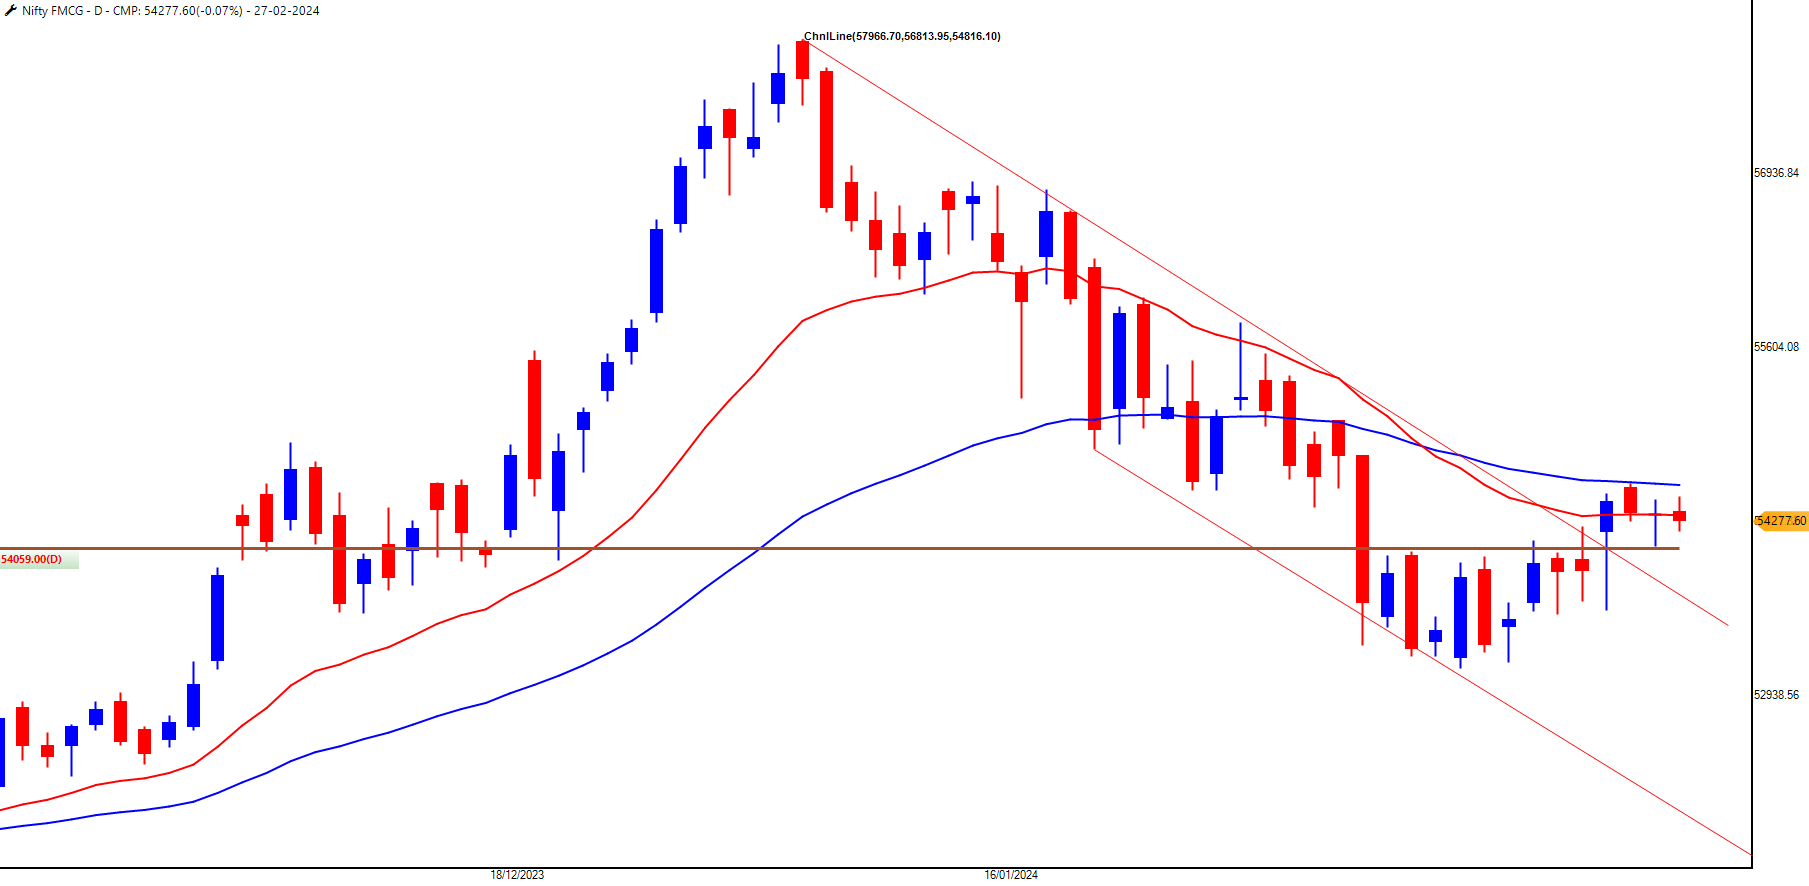
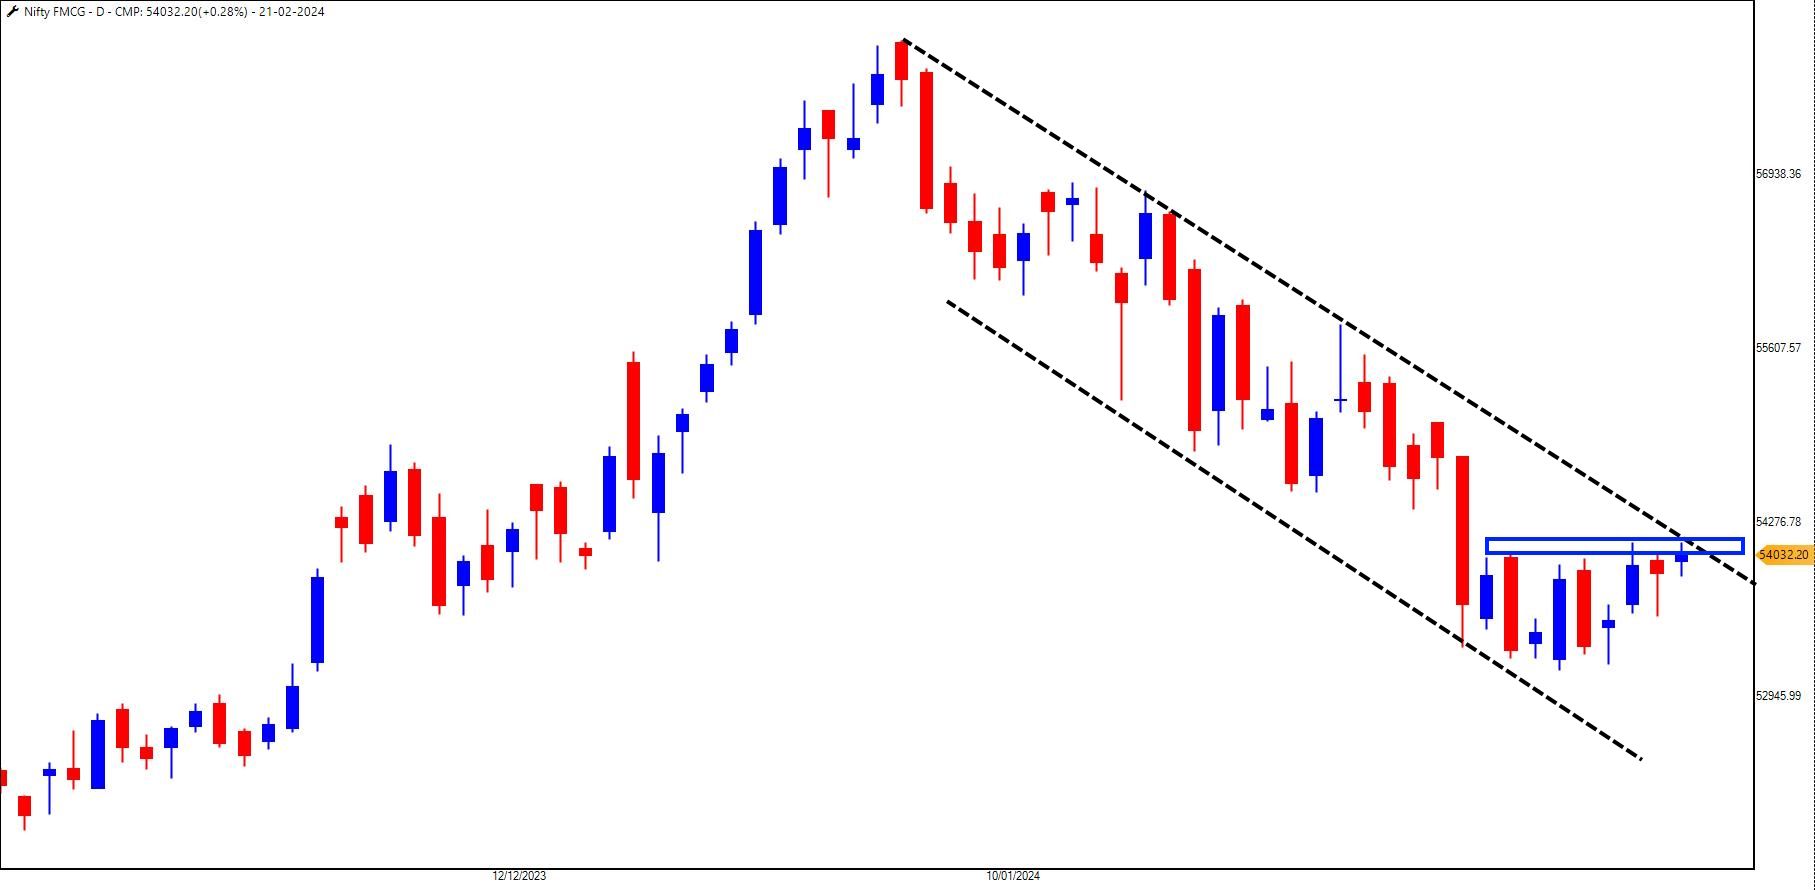
As highlighted in the weekly newsletter a couple of weeks ago, according to Seasonality Analysis, February historically records the worst monthly performance for this sector. However, this dip typically signifies a bottoming-out process, setting the stage for a potential upward trend.
The chart for Nifty FMCG indicates a falling channel pattern, but signs are pointing towards an imminent breakout, particularly in the 54,300-54,400 zone. The sector presents lucrative opportunities in the near future.
-
Stock List 17th Feb 2024
-
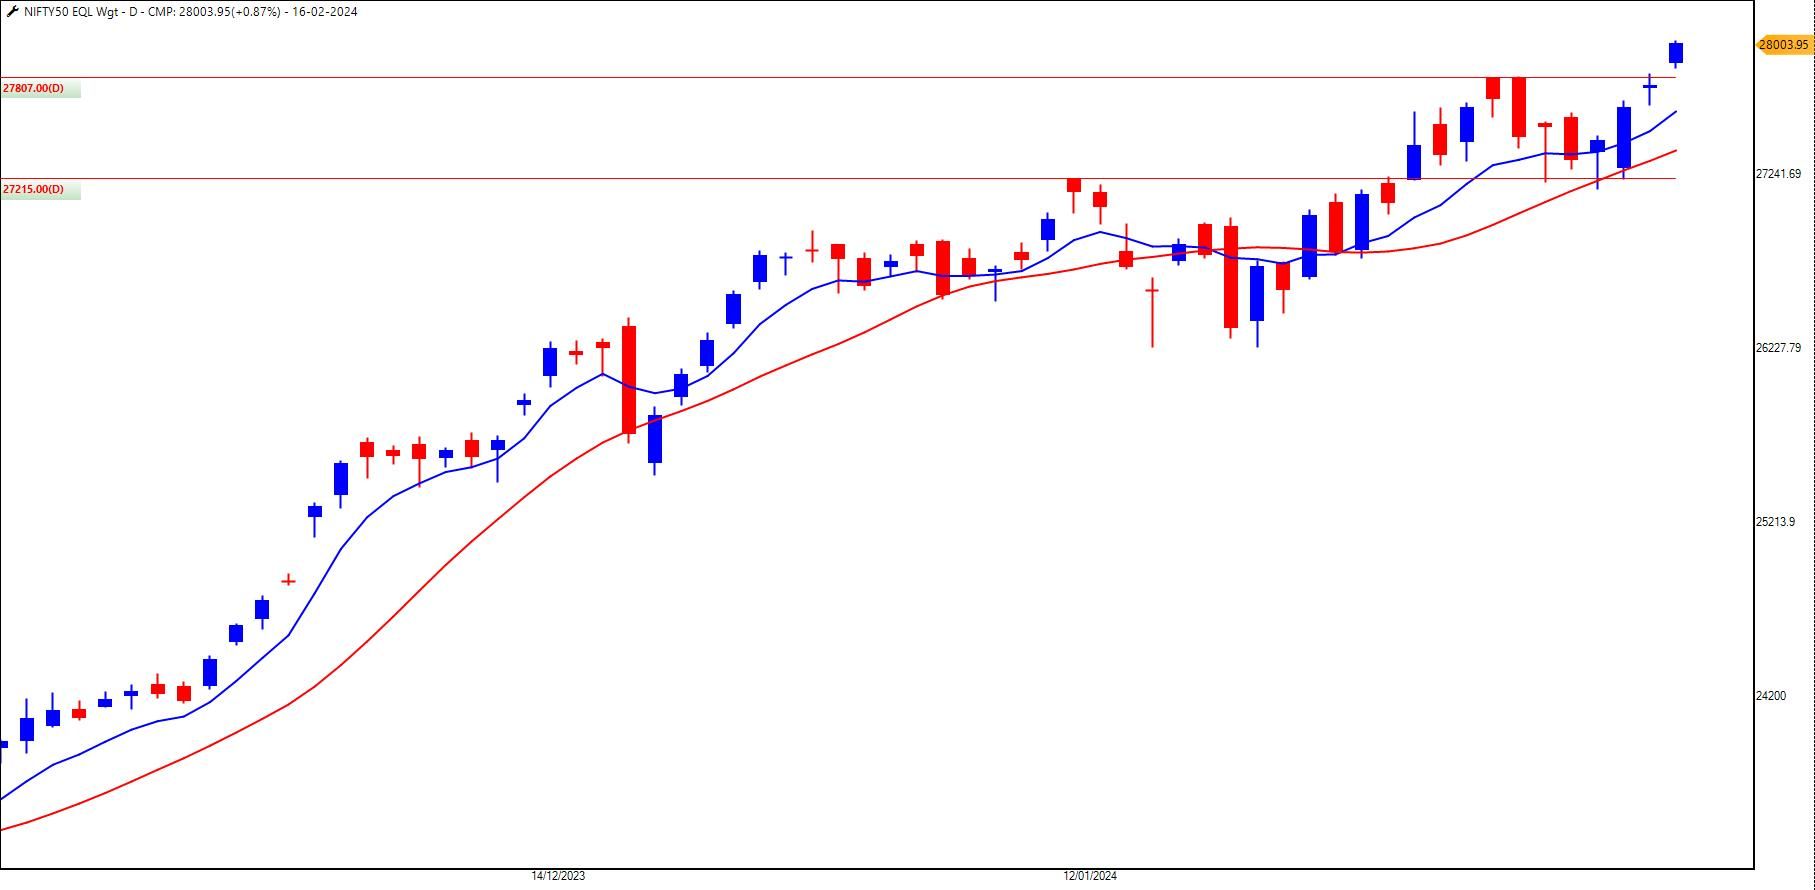
The Nifty Equal Weighted Index has surged past its previous range and reached an all-time high.
Will the Nifty50 follow suit?
-
An adroit trader manoeuvres through the intricate stock markets with exceptional expertise and finesse.
The term "adroit" implies high competence, agility, and cleverness in executing trading strategies effectively. An adroit trader demonstrates keen analytical abilities, adept risk management practices, and the capacity to adapt swiftly to changing market conditions. With a combination of strategic thinking, discipline, and emotional control, adroit traders consistently seek opportunities to capitalise on market movements while minimising risks.
In essence, an adroit trader is knowledgeable about the intricacies of trading and demonstrates the agility and finesse required to excel in trading
Here are some adroit traits of a trader:
-
Analytical Mindset: A skilled trader can analyse market trends, financial data, and news to make informed decisions.
-
Adaptability: Successful traders can swiftly adjust their strategies in response to changing market conditions, ensuring they stay ahead of the curve.
-
Discipline: Discipline is essential for sticking to trading plans, executing trades without emotion, and maintaining consistency in approach.
-
Patience: Patient traders understand that success in trading often requires waiting for the right opportunities and not succumbing to impulsive actions.
-
Emotional Control: Mastering emotions such as fear and greed is vital for making rational decisions and avoiding impulsive trading mistakes.
-
Continuous Learning: Adroit traders never stop learning. They stay updated on market developments, explore new strategies, and refine their skills to stay competitive.
-
Strategic Thinking: Successful traders think strategically, setting clear goals and developing well-thought-out plans to achieve them.
-
Confidence: Confidence in one's abilities and decisions is essential for navigating the market's uncertainties with conviction.
-
Resilience: Trading can be challenging, and adept traders demonstrate resilience by bouncing back from losses, learning from setbacks, and persisting in their pursuit of success.
In conclusion, being an adroit trader encompasses a combination of key traits and skills that enable individuals to make profitable journeys in the trading arena. By sharpening the above traits, traders can strive to embody the qualities of adroitness, ultimately enhancing their performance and prospects of building wealth.
-
-
Planning to invest in Mutual Fund?
Watch this video before investing.
-
Happy Valentine's Day Dosto 🥰
As a family of traders here at the forum, I Wish A Happy Valentine's Day to every member of our forum.
As Cupid's arrows pierce hearts worldwide, traders, too, find themselves navigating the markets with a unique lens on Valentine's Day. While the traditional festivities may seem a world apart from the trading floor, parallels can be drawn between matters of the heart and trading in stock markets. Here's a trader's take on Valentine's Day:
1. Timing is Everything:
In both love and trading, timing plays a critical role. Traders closely monitor market movements, identifying optimal entry and exit points to capitalise on opportunities. Similarly, in matters of the heart, seizing the right moment can make all the difference between success and missed connections.2. Emotional Resilience:
Emotions run high in both trading and matters of love. Traders must maintain a level head in market fluctuations, avoiding impulsive decisions driven by fear or greed. Similarly, in relationships, emotional resilience is crucial to weathering challenges and nurturing long-term bonds.3. Adaptability:
Flexibility is a trait shared by successful traders and partners alike. Just as traders adjust their strategies in response to changing market conditions, individuals in relationships must adapt to the evolving needs and dynamics of their partners.4. Long-Term Vision:
Both trading and relationships require a long-term perspective. Traders focus on building sustainable growth over time, while couples invest in nurturing their bond for a fulfilling future together. Patience, commitment, and perseverance are essential virtues on both fronts.5. Finding Balance:
Achieving a balance between work and personal life is a common challenge for traders and professionals. Just as traders strive to maintain a healthy work-life balance, individuals in relationships must prioritise quality time with their loved ones amidst the demands of daily life.6. Celebrating Successes:
In trading, as in life, it's important to celebrate achievements along the way. Whether hitting a profit target or reaching a relationship milestone, acknowledging and commemorating successes fosters a sense of fulfilment and motivation to strive for excellence.While the trading world may seem far removed from the sentimentality of Valentine's Day, the underlying principles of timing the markets, emotional resilience, adaptability, long-term vision, balance, and celebrating successes resonate in both domains. So, as traders navigate the markets with precision and poise, they can also appreciate the nuances of love and relationships, recognising that, in matters of the heart, as in the markets, a strategic approach yields the most significant rewards.
-
@L M You can use vertical counts or trailing methods.
-
@Aditya Sarowgi There is no Unusual Options Activity in GMR
-
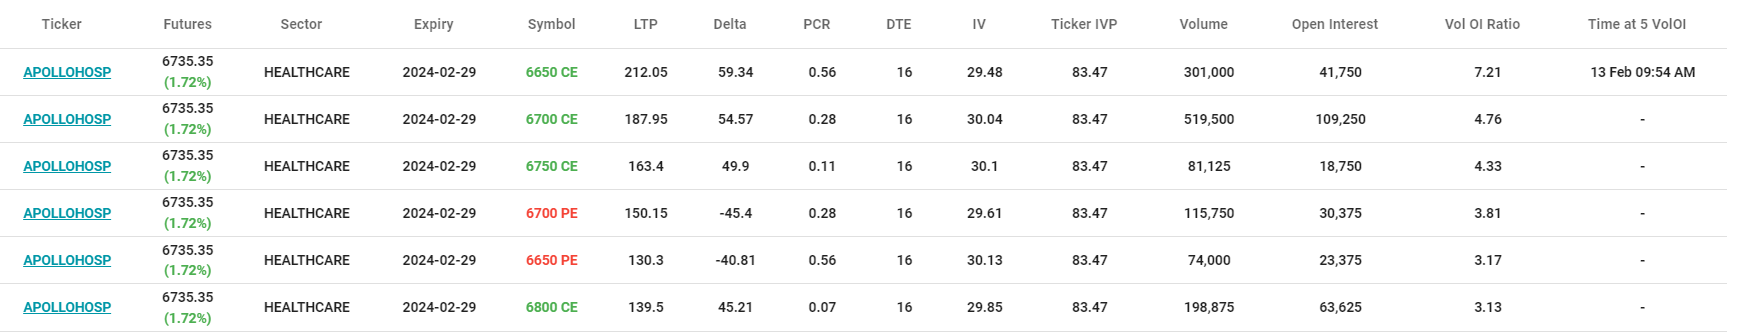
ApolloHsp 6750CE @ 155 SL 120
(From Left) 1. 6750CE 1Min 6750CE Chart,
2. Apollo Hsp Futures Chart
3. ApolloHsp Cash Chart with Volumes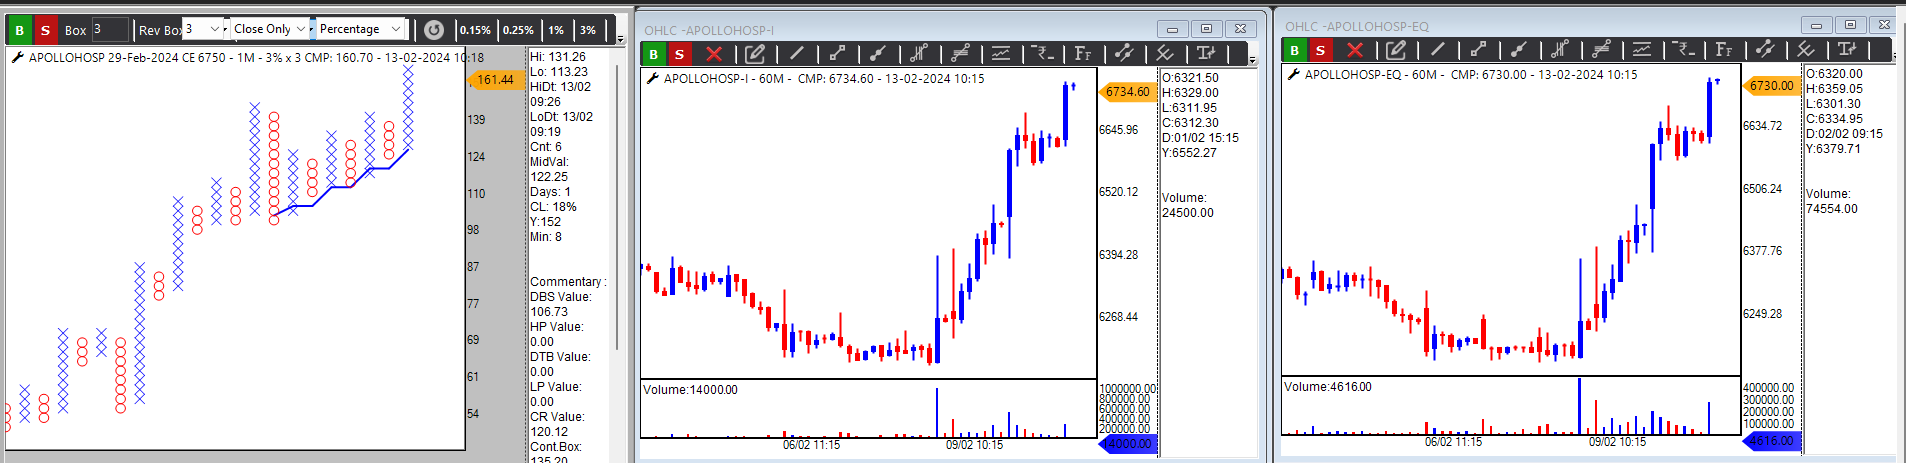
Unusual Options Activity
Strategy Video - https://www.youtube.com/watch?v=0pWqZcI_kMc&t=37s
-
The technical analysis arena often buzzes with terms that capture the imagination of traders and analysts alike. Among these, "multi-timeframe analysis" (MTFA) is a captivating concept that intrigues and debates.
Traders often find themselves drawn to examining price movements across different timeframes, believing it is key to unlocking deeper insights into market dynamics.
The allure of MTFA lies in its potential to provide a more comprehensive understanding of trends and price action. Yet, as with any methodology, the question lingers: Is it necessary or merely a buzzword echoing through the trading community?
In this article, we unfold the essence of multi-timeframe analysis, examining its relevance and assessing whether it lives up to the fascination it commands among technical analysts.
Multi-Time Frame Analysis (MTFA) involves studying price action across different time frames to understand market dynamics comprehensively. It facilitates applying a top-down approach in technical analysis, allowing analysts to navigate from higher time frames to the most suitable lower time frame for their analysis.
Let’s explore the pros and cons of multi-timeframe analysis and why it has become an indispensable tool for traders worldwide.
Pros
-
Comprehensive Market Perspective: MTFA allows traders to view the market differently. By analysing multiple time frames, from shorter intraday periods to longer-term trends, traders gain a more comprehensive perspective on the overall market condition.
-
Enhanced Trend Identification: One of the primary benefits of MTFA is its ability to identify trends across various time frames. Short-term fluctuations may obscure the broader trend, but traders can confirm the prevailing market direction by assessing higher time frames and making more informed decisions.
-
Improved Entry and Exit Points: Multi-time frame analysis aids in pinpointing optimal entry and exit points. Traders can use shorter time frames for precision in timing their trades, while more extended time frames help confirm the overall trend's viability.
-
Reduced Noise and False Signals: Short-term price fluctuations, or 'market noise,' can mislead traders. MTFA helps filter out such noise by relying on the consensus of multiple time frames, reducing the likelihood of false signals and improving the accuracy of trade decisions.
-
Risk Management: By assessing different time frames, traders can better gauge the risk associated with a particular trade. This enables more effective risk management, including setting appropriate stop-loss levels and position sizes based on the broader market context.
Cons
-
Complexity and Learning Curve: MTFA requires a deep understanding of technical analysis and the ability to synthesise information across various time frames. This complexity can be overwhelming for novice traders and may lead to confusion.
-
Increased Workload: Analysing multiple time frames can be time-consuming. Traders employing MTFA may spend more time conducting analyses, which can be challenging for those with limited availability.
-
Conflicting Signals: Different time frames may sometimes provide conflicting signals. For example, a short-term chart may suggest a buy signal, while a longer-term chart indicates a sell signal. Traders must navigate these conflicting signals skillfully.
-
Over-Analysis Paralysis: The abundance of information from various time frames may lead to over-analysis, causing traders to hesitate or miss out on profitable opportunities. Striking the right balance between thorough analysis and decisive action is crucial.
Multi-Time Frame Analysis is a valuable tool in a trader's arsenal, providing a holistic view of market conditions.
While it offers numerous benefits, it's essential to be aware of the potential drawbacks and challenges. Traders must balance the thorough analysis of multiple time frames and the need for timely, decisive action. With a well-rounded approach, MTFA can significantly enhance a trader's ability to navigate the dynamic world of financial markets.At Definedge, we take a proactive approach with Multi-Time Frame Analysis, setting ourselves apart in market analysis. Our commitment is reflected in developing multiple scanners tailored for Candlesticks and the P&F charting method. Leaving no stone unturned, we offer scanners equipped with ranking and scoring methodologies, empowering you to identify the best-performing stocks or sectors.
Here is an image for a quick look at the available Multi-Time Frame Analysis scanners:
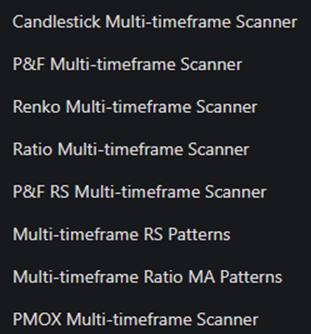
Unlock the full potential of these features by opening an account with Definedge Securities. Sign Up here: https://www.definedgesecurities.com/
While some functionalities are available through our Zone and TradePoint apps with associated costs, fret not – you can explore them free of charge for an entire month before deciding to subscribe.
-
-
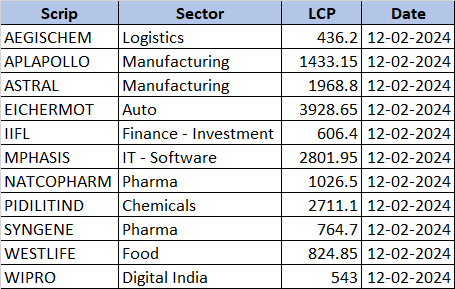
Stock List 10th Feb 2024
-

Since my school days, I've had a habit of reading newspapers, and one column that always caught my eye was Today's Horoscope or Horoscope of the Day. Do you have the habit of this?
Over time, my fascination with horoscopes grew, leading me to get deeper into the subject by reading books dedicated to astrology. During my college days, I used to buy books and read them.
Back in 2024, as I was browsing articles online, I recently stumbled upon one focused on Taurus predictions for 2024, my zodiac sign. Intrigued by the idea, I felt compelled to explore how the characteristics associated with each zodiac sign might intersect with the stock market traders.
In the stock market, every decision is analysed, but it is a surprise that some traders turn to the stars for guidance. Yes, you read that right—zodiac signs, those celestial symbols that supposedly dictate our personalities and destinies, have found their way into stock market trading.
Can your astrological sign really influence your success in the stock market?
Let's explore this intriguing intersection of mysticism and finance.
Aries (March 21 - April 19): The Trailblazer
Aries are known for their boldness and competitive spirit, traits that can serve them well in the fast-paced world of stock trading. Their impulsive nature might lead to quick decision-making, resulting in significant gains or losses.
Aries traders thrive on taking risks and are unafraid to jump into new ventures. However, they must be cautious not to let their impatience lead to hasty decisions that could backfire.Taurus (April 20 - May 20): The Patient Strategist
Taureans are known for their patience and practicality, making them well-suited for the unpredictable nature of the stock market. They prefer stability and reliability, often opting for long-term investments rather than risky ventures. Taurus traders carefully analyse market trends and economic indicators before making decisions, ensuring they are well-informed. While their cautious approach may sometimes result in missed opportunities, it protects them from unnecessary losses.Gemini (May 21 - June 20): The Versatile Trader
Geminis are characterised by their adaptability and curiosity, traits that can make them skilled traders in the stock market. They thrive in dynamic environments and constantly seek new opportunities to capitalise on. Gemini traders are quick thinkers and adept at analysing market trends, allowing them to make informed decisions on the fly. However, their tendency to be indecisive can sometimes lead to missed opportunities or impulsive trades.Cancer (June 21 - July 22): The Intuitive Trader
Cancerians are known for their intuition and emotional intelligence, qualities that can be beneficial in navigating the complexities of the stock market. They have a keen sense of empathy, allowing them to understand market sentiment and anticipate fluctuations. Cancer traders trust their instincts and often rely on gut feelings when making investment decisions. While their emotional approach can sometimes cloud their judgment, it also enables them to connect with market trends on a deeper level.Leo (July 23 - August 22): The Confident Risk-Taker
Leos are natural-born leaders with an innate sense of confidence, traits that can make them fearless traders in the stock market. They thrive on taking risks and are unafraid to pursue what they want. Leo traders are self-assured and decisive, often making bold moves that set them apart from the crowd. However, their tendency to be overly optimistic can sometimes lead to reckless behaviour and significant losses if not tempered with caution.Virgo (August 23 - September 22): The Analytical Perfectionist
Virgos are known for their attention to detail and analytical mindset, making them meticulous traders in the stock market. They excel at conducting thorough research and meticulously analysing data before making investment decisions. Virgo traders are disciplined and methodical, often following a strict set of criteria when evaluating potential opportunities. While their analytical approach can sometimes lead to overthinking, it also ensures that they make well-informed decisions based on sound reasoning.Libra (September 23 - October 22): The Balanced Trader
Libras are known for their diplomacy and sense of balance, qualities that can serve them well in the unpredictable world of stock trading. They weigh their options carefully and strive to maintain harmony in their investment portfolio. Libra traders are adept at identifying opportunities that offer a good risk-reward balance and are skilled negotiators in making deals. However, their indecisiveness can sometimes hinder their ability to act swiftly in fast-moving markets.Scorpio (October 23 - November 21): The Strategic Trader
Scorpios are known for their passion and determination, making them formidable stock market traders. They possess an instinct for spotting opportunities and are not afraid to delve into the depths of the market to uncover hidden gems. Scorpio traders are strategic and calculated, often employing tactics such as diversification and hedging to mitigate risks. However, their intensity and penchant for secrecy can sometimes lead to suspicion among other traders.Sagittarius (November 22 - December 21): The Adventurous Speculator
Sagittarians are known for their optimism and adventurous spirit, which can make them bold speculators in the stock market. They thrive on taking risks and always seek new opportunities to explore. Sagittarius traders are optimistic about the future and are willing to take chances on emerging trends and technologies. However, their tendency to be overconfident can sometimes lead to reckless behaviour and significant losses.Capricorn (December 22 - January 19): The Disciplined Planner
Capricorns are known for their ambition and discipline, qualities that can make them disciplined planners in stock trading. They set clear goals for themselves and work tirelessly to achieve them, often adopting a long-term approach to investing. Capricorn traders are patient and methodical, carefully weighing each investment opportunity's potential risks and rewards. However, their conservative nature sometimes keeps them from taking advantage of more lucrative but riskier ventures.Aquarius (January 20 - February 18): The Visionary Innovator
Aquarians are known for their innovation and forward-thinking mindset, traits that can make them visionary traders in the stock market. They are always on the lookout for disruptive technologies and revolutionary ideas that have the potential to shape the future. Aquarius traders are not afraid to think outside the box and are willing to take calculated risks on unconventional opportunities. However, their tendency to be idealistic can sometimes cloud their judgment and lead to impulsive decisions.Pisces (February 19 - March 20): The Intuitive Dreamer
Pisceans are known for their intuition and creativity, qualities that can make them intuitive traders in the stock market. They possess a deep understanding of human nature and are adept at sensing market trends before they become apparent to others. Pisces traders trust their instincts and are often guided by their dreams and aspirations. However, their idealistic nature can sometimes lead to impractical decisions and financial losses if not grounded in reality.While using astrology to guide investment decisions may seem far-fetched to some, many traders believe there is a correlation between zodiac signs and trading tendencies.
Whether you believe in the power of the stars or not, there's no denying that understanding your personality traits and tendencies can help you become a more self-aware and disciplined trader. So, the next time you're pondering your investment strategy, perhaps it's worth looking at the stars for cosmic guidance. Who knows? The universe might have some investment tips up its sleeve.
-
@Eswar S confirmation of pattern??
-
READ ONLY IF YOU WISH TO RIDE A
bullBEAR
")
In the stock market, where participants vie for profits amidst the volatile waves of economic tides, one strategy stands out as both feared and revered: short selling. Often considered an art form rather than a mere trading technique, short selling involves selling borrowed securities to buy them back at a lower price, thus profiting from the price decline. While some view it with scepticism due to its association with market downturns, others recognise its strategic complexity and potential for profit generation when executed precisely. Indeed, short selling can be likened to an art requiring skill, foresight, and a deep understanding of market dynamics.
At its core, short selling involves defying the traditional notion of buying low and selling high. Instead, practitioners of this art form seek to profit from a market downturn by identifying overvalued or overbought shares and predicting their decline. This requires a keen eye for spotting trends, analysing financial data, and interpreting market sentiment. Successful short sellers possess a contrarian mindset, daring to swim against the current of optimism that often pervades financial markets.
Much like a painter carefully selects their palette of colours, a skilled short seller meticulously researches potential targets. They scrutinise financial statements, assess industry trends, and even chart patterns. Through thorough analysis, they identify vulnerabilities others may overlook, such as deteriorating earnings, excessive leverage, or market saturation. By understanding the underlying weaknesses of a company, they can anticipate future challenges and position themselves accordingly.
Timing is crucial in short selling, akin to capturing the perfect moment in a photograph. Short sellers must gauge when to enter a trade and when to exit. Unlike long positions, where losses are capped at the initial investment, short positions carry unlimited risk, as prices can theoretically rise indefinitely. Therefore, short sellers must remain vigilant, ready to cut their losses if the market turns against them. Discipline and emotional resilience are paramount, as the temptation to abandon a losing position can be strong.
Moreover, short selling requires a profound understanding of market psychology. Fear and greed often drive investor behaviour, leading to periods of irrational exuberance and abrupt reversals. Skilled short sellers capitalise on these emotional swings, exploiting market inefficiencies and capitalising on mispriced assets. They can anticipate momentum shifts and adjust their strategies by staying attuned to market sentiment and behavioural biases.
Short selling is vital in markets despite its reputation as a risky endeavour. By providing liquidity and price discovery, short sellers contribute to market efficiency, helping to prevent asset bubbles and excess speculation. Furthermore, they check corporate misconduct, uncovering fraud and malfeasance that may otherwise go unnoticed. In this sense, short selling can be seen as market regulation, promoting transparency and accountability.
In conclusion, short selling is not merely a speculative gamble but a nuanced art form that requires skill, discipline, and a deep understanding of market dynamics. Like a master painter wielding a brush, successful short sellers navigate the complexities of financial markets with precision and foresight. While it may not be suitable for all investors, those who master the art of short selling can unlock opportunities for profit generation in both bull and bear markets. As with any art form, practice, patience, and perseverance are essential for those seeking to excel in short selling.
-
@L M Apka demand tha so post to karna padega na
")
-
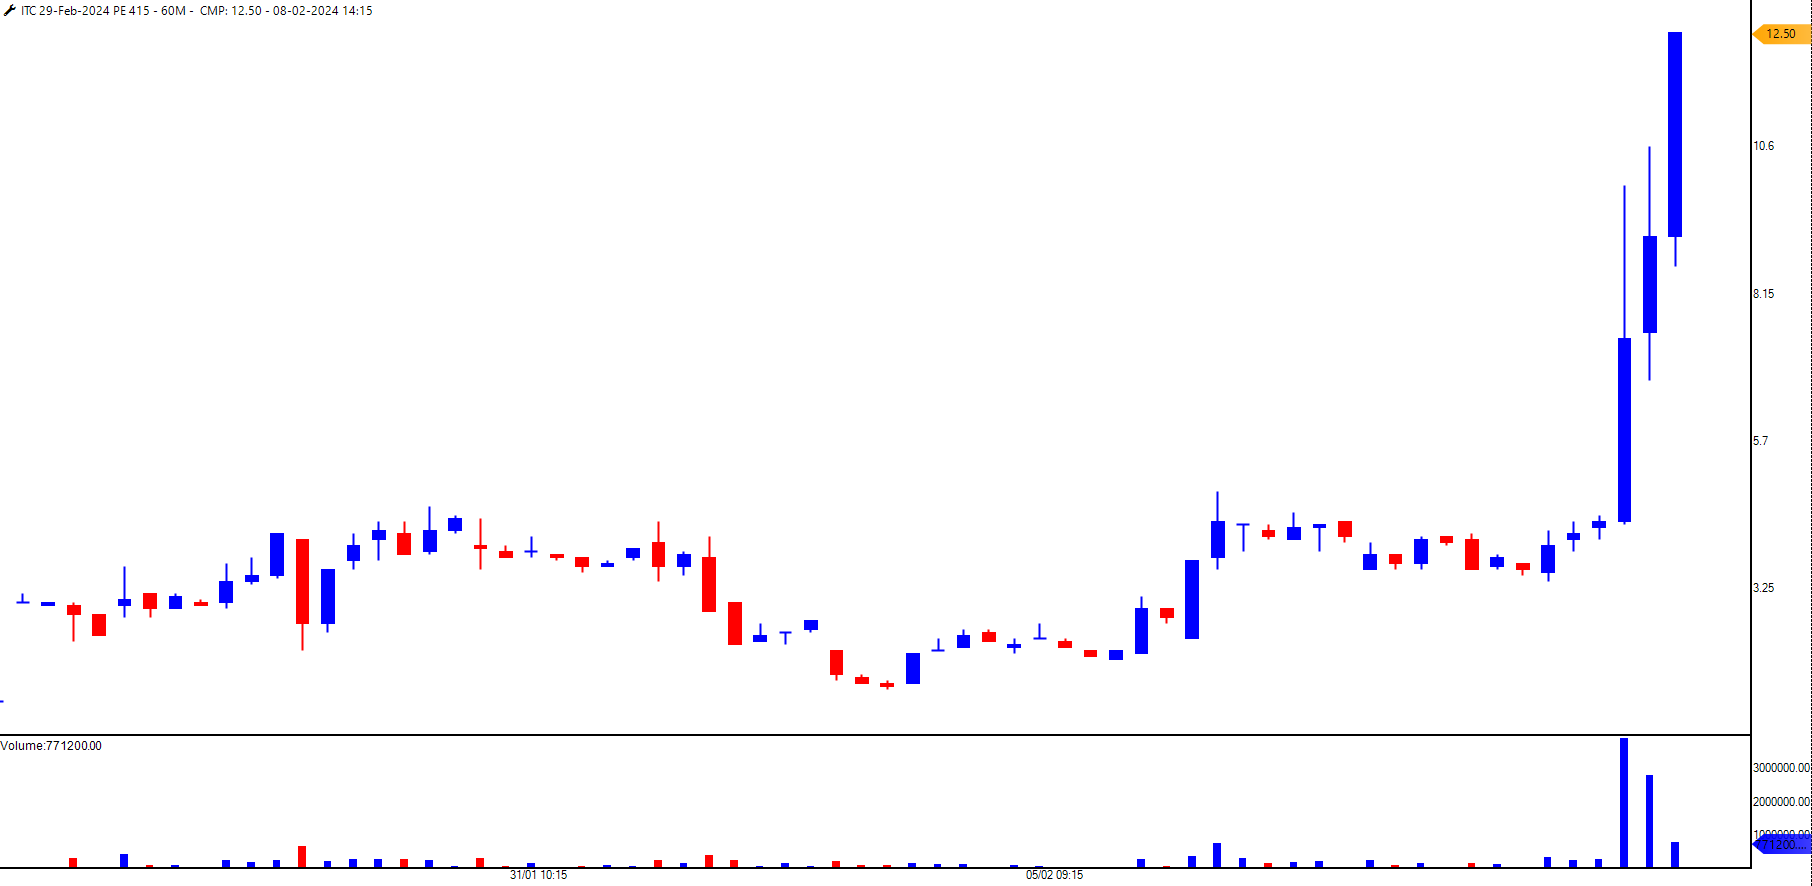
Unusual Volumes - Cash Chart
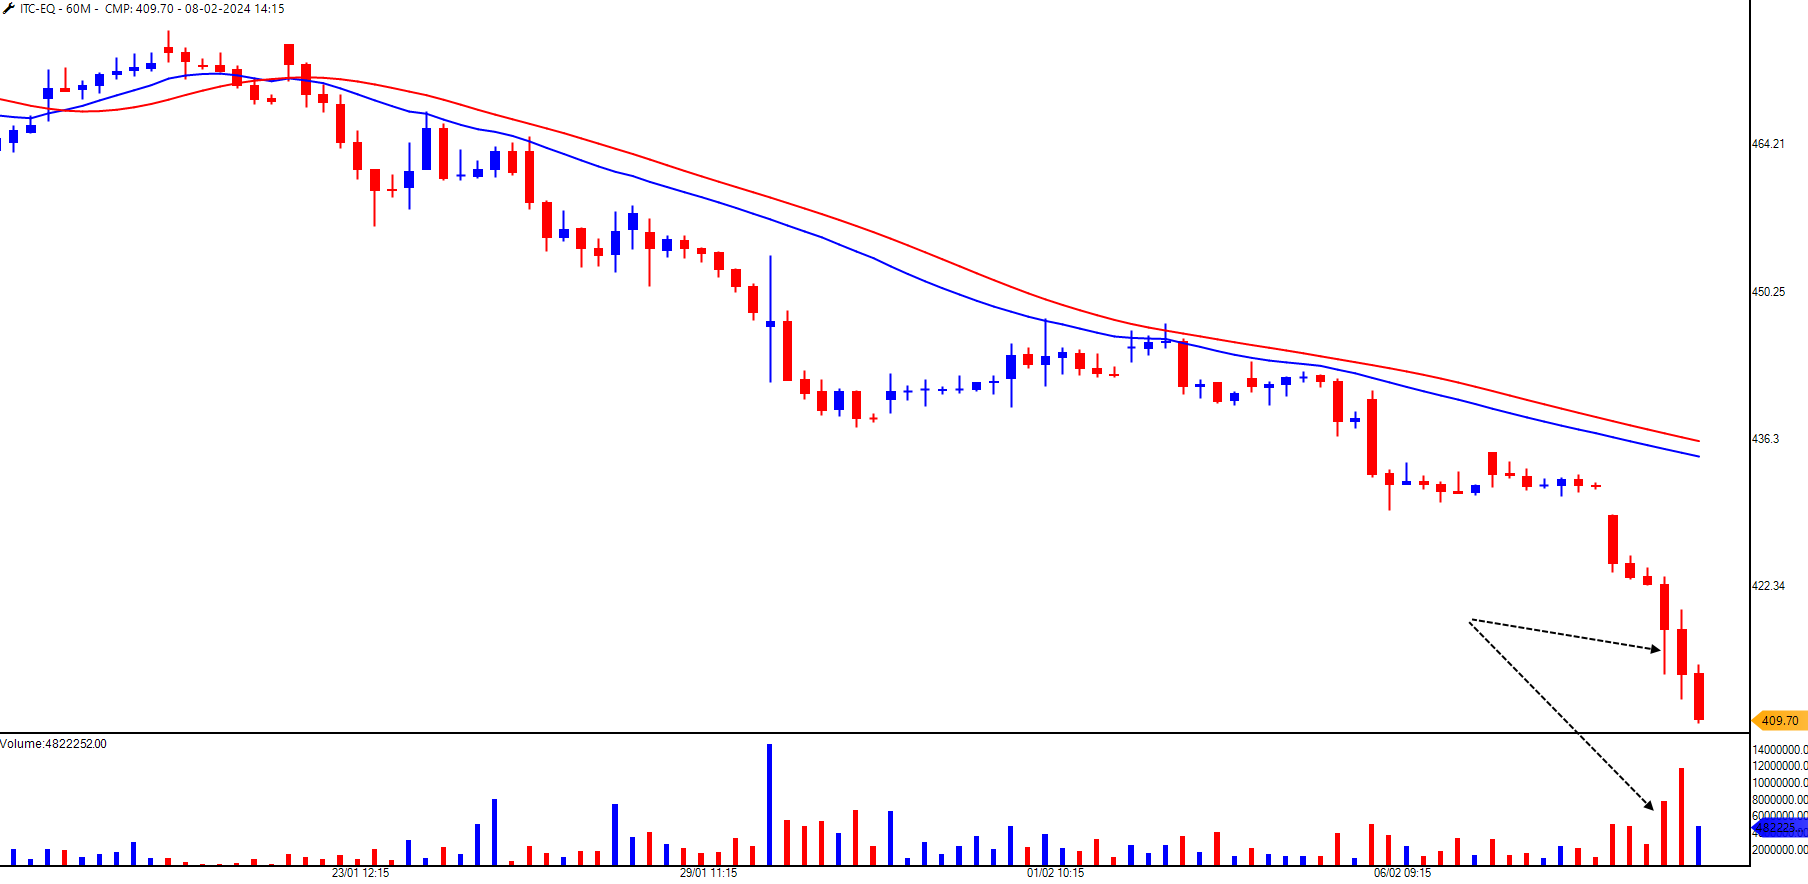
Unusual Volumes - Futures
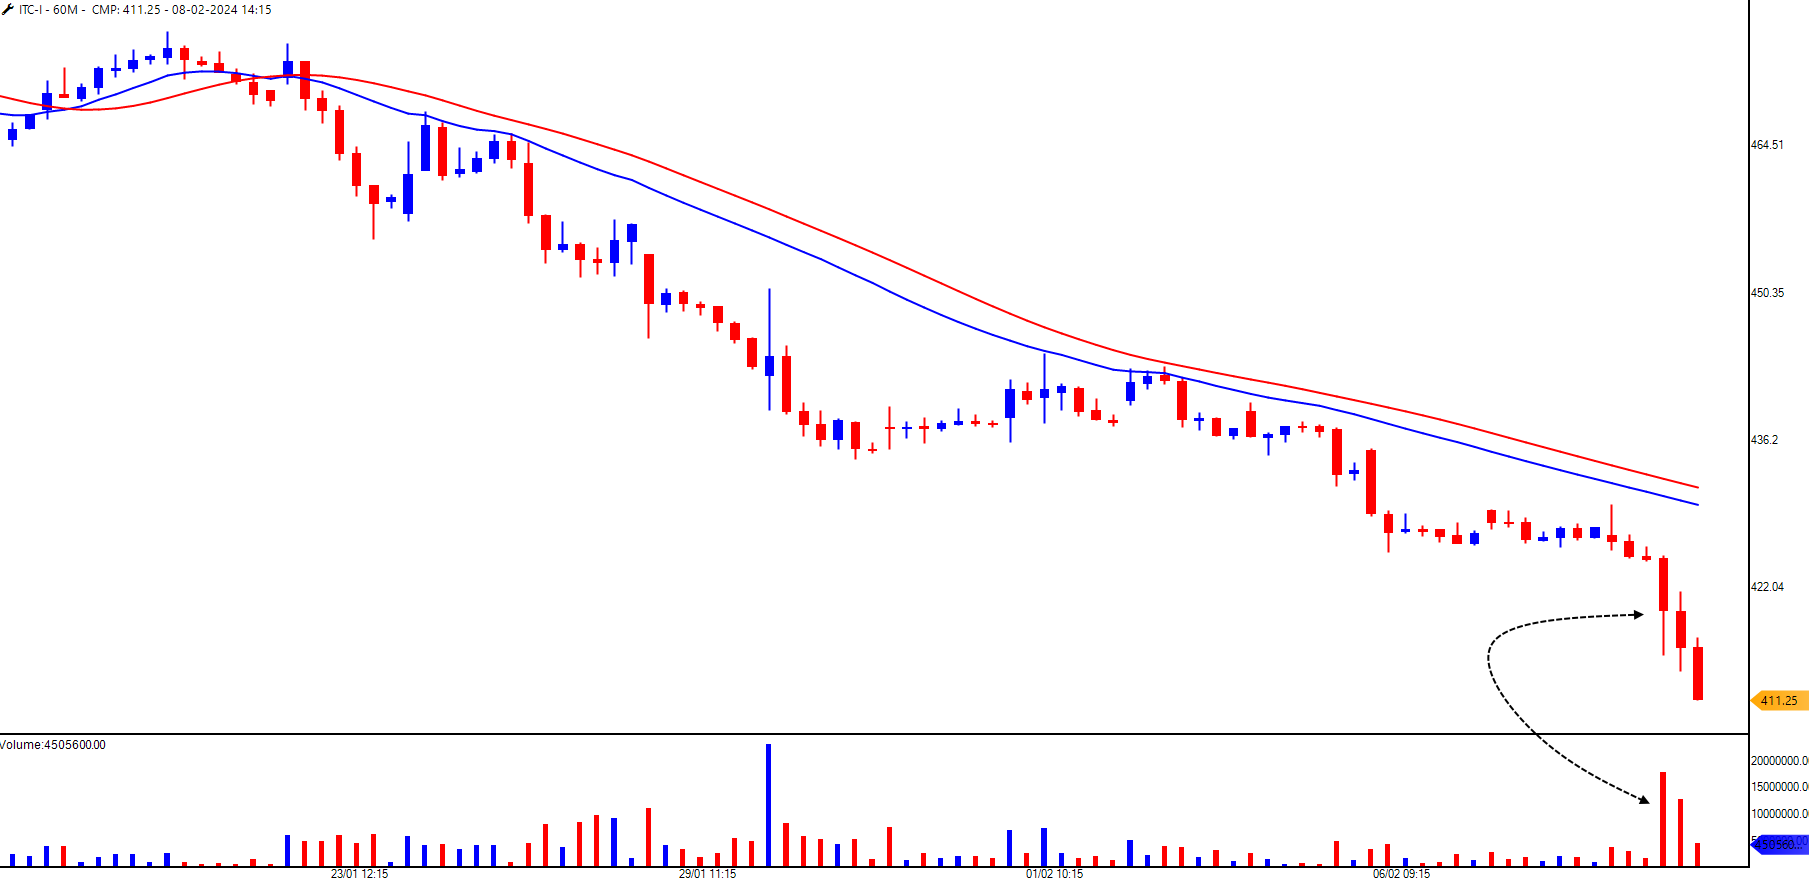
Unusual Options Activity
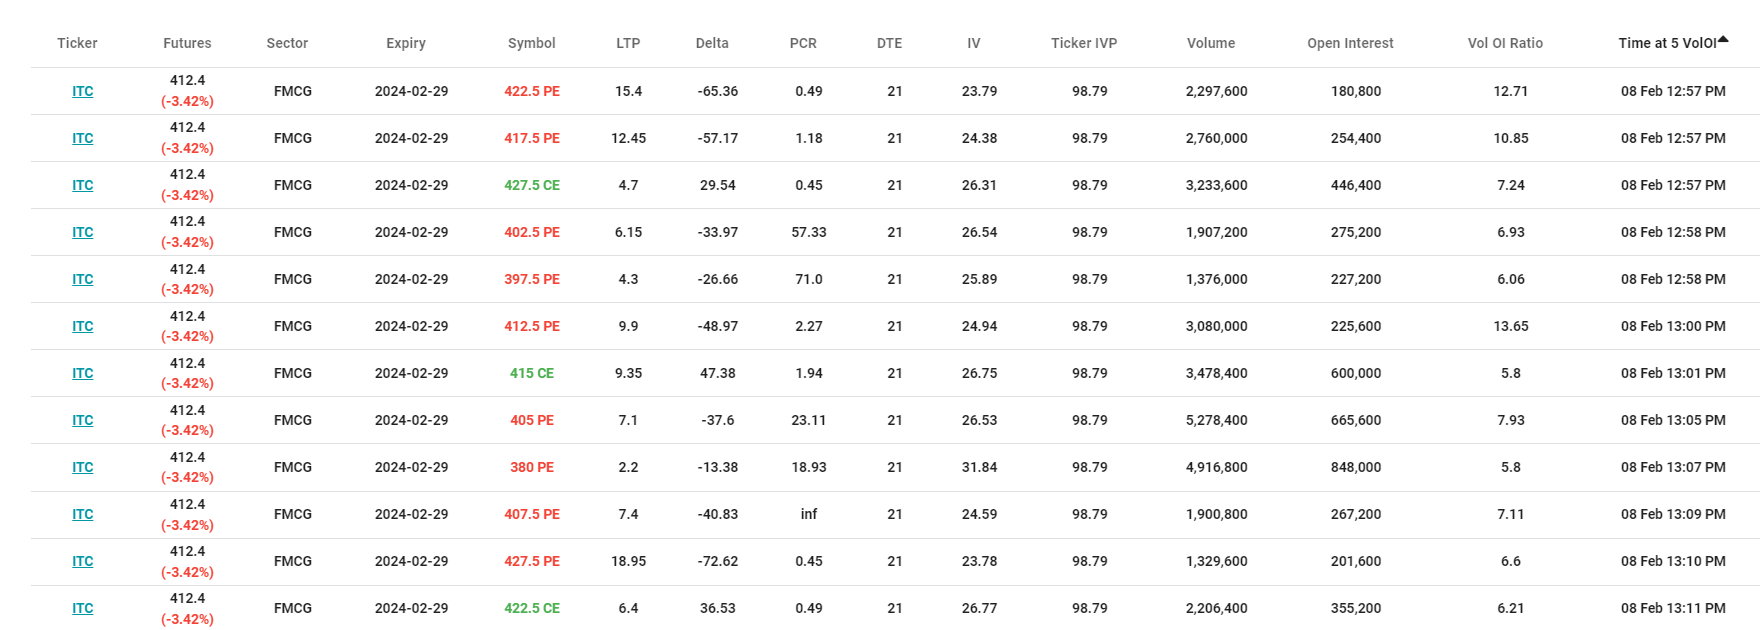
ITC 420PE Chart - Entry @ 9.70
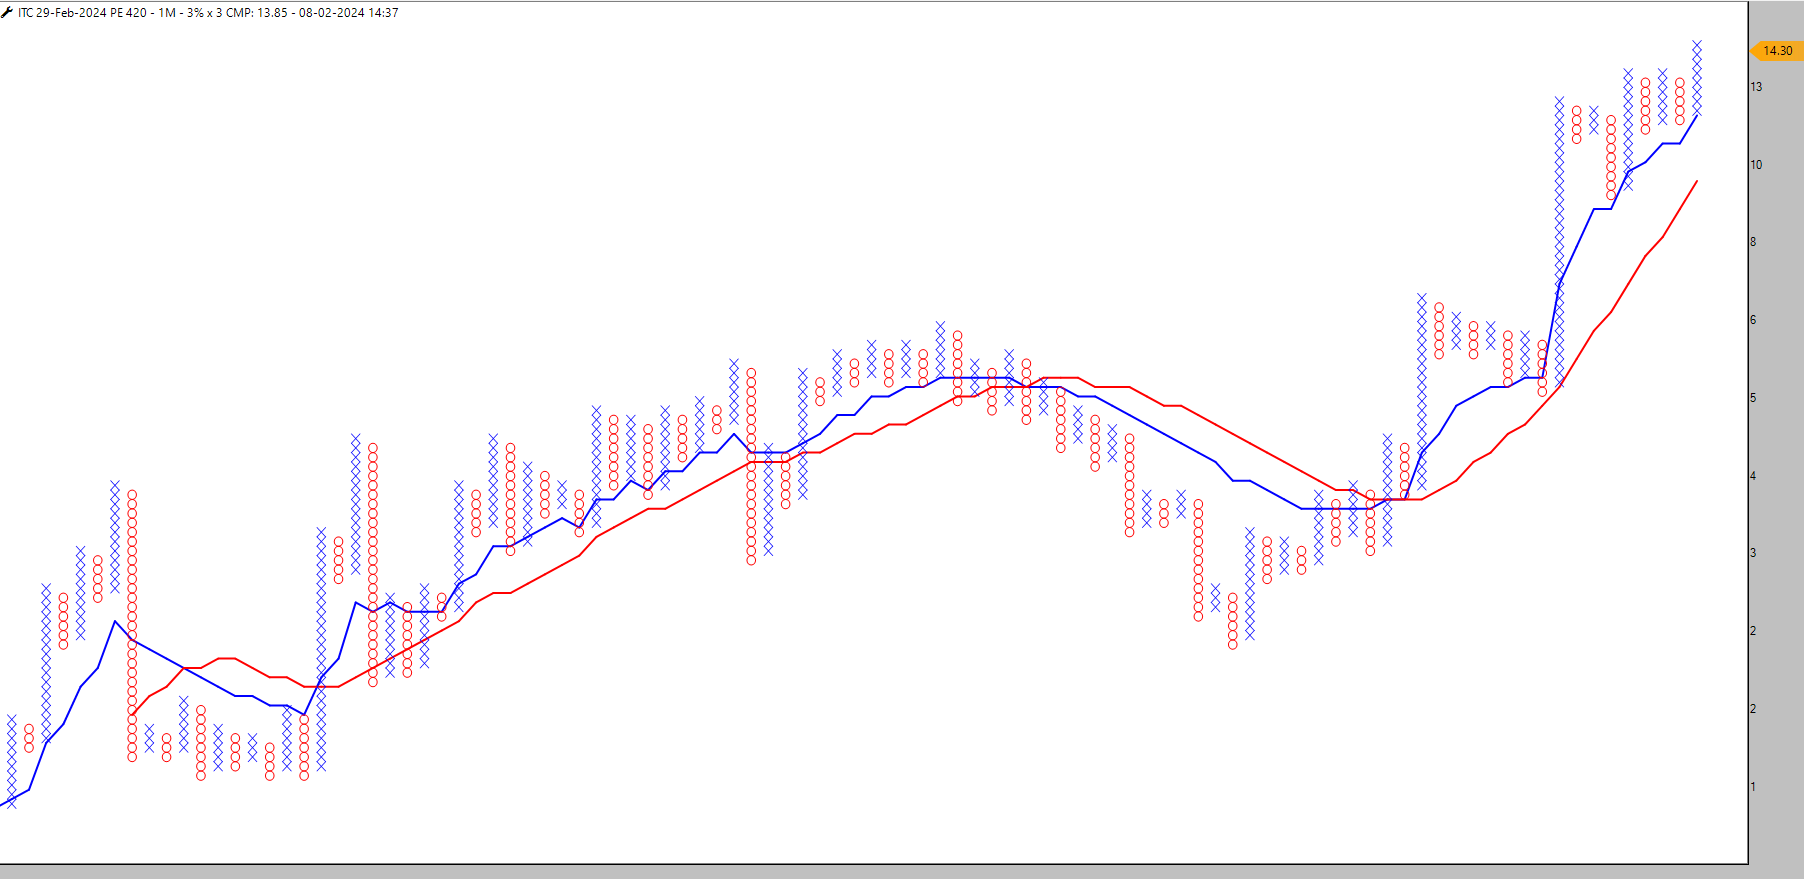
ITC415PE Chart - Entry @ 7.50
-
@L M Sure sir
-
Beauty reigned supreme in an era where Bollywood often favoured heroines with titles like Miss World, Miss Universe, or Miss India. Yet, as the spotlight shifted to the silver screen, the importance of acting skills became apparent. While these titles could secure success in modelling, they offered no guarantee of survival amidst fierce competition in the film industry. Similarly, once hailed as stalwarts in the stock markets, blue-chip companies can falter unexpectedly, highlighting the need to look beyond superficial appearances and recognise the importance of performance and adaptability.
In trading and investing, letting emotions cloud judgment is too easy. Investors often find themselves swayed by personal biases or hopeful sentiments, particularly in blue-chip stocks. When these market giants start to stumble, there's a common misconception that the dip represents a bottom, and many hold onto the belief that the stock will inevitably rebound. However, history tells a different story.
There are two distinct types of downturns: those that coincide with a broader market decline and those where a stock experiences a correction independently of market trends. While the former may be attributed to systemic factors affecting the entire market, the latter signals specific issues within the company. When a stock falls irrespective of overall market conditions, it often serves as a red flag, indicating underlying weaknesses or challenges that investors should heed. Recognising and avoiding such stocks is a must.
Over the years, we've witnessed numerous instances where once-revered blue-chip stocks fell from grace, leaving investors hesitant to glance in their direction. The list of such stocks is extensive, ranging from Unitech and Satyam to RCOM and DHFL, to name a few. Despite their previous status as market darlings, these companies suffered significant downturns that caught many investors off guard.
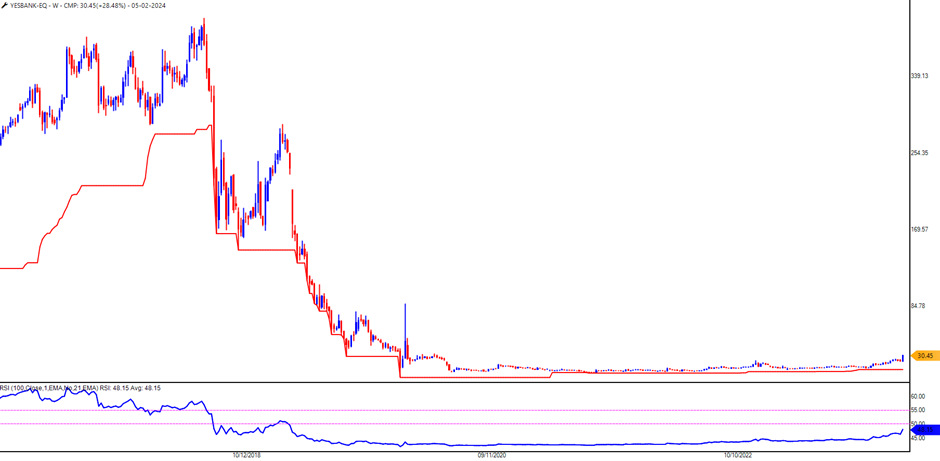
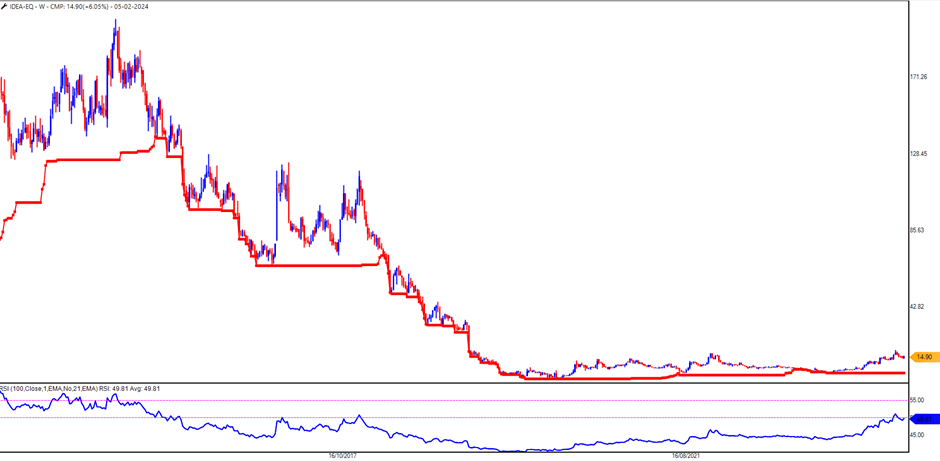
Even now, amidst talks of potential revivals for struggling giants like Vodafone Idea and Yes Bank, the question remains: Is this a reversal or a temporary blip in a downward spiral?
As a chartist, I adhere to a simple principle: I trade based on what I see on the charts, not personal preferences or speculative optimism. One of the strategies I rely on is the Laidback Strategy, a well-known approach within the Definedge community.
Let's consider some examples to illustrate the effectiveness of this approach:
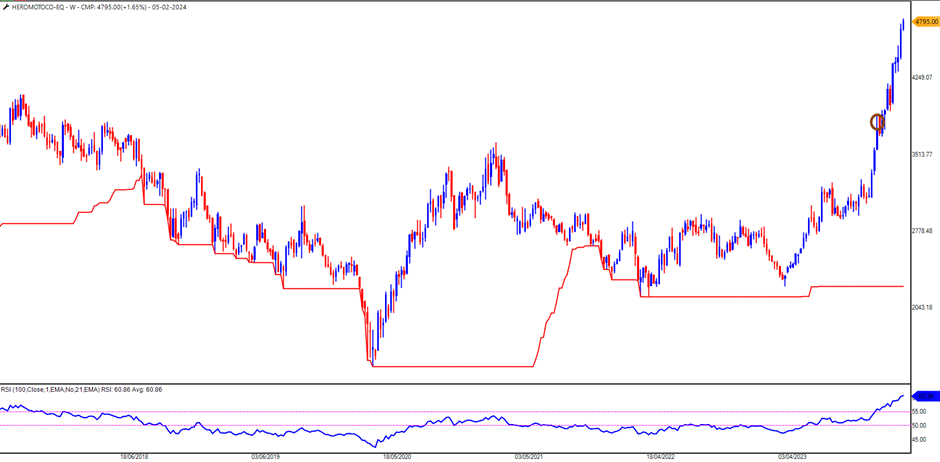
- Hero Moto Corp:
Despite its stature in the market, Hero Moto Corp experienced a prolonged period of underperformance. However, when my system indicated a BUY signal for the first time since 2017. The system triggered a buy at Rs. 3,760 at the end of November 2023; the stock demonstrated significant outperformance, proving the value of trading based on technical indicators rather than sentiment.
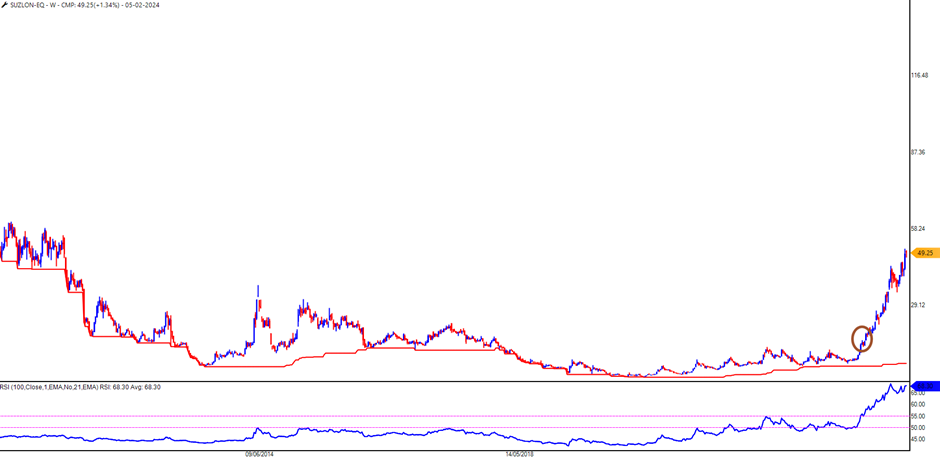
- Suzlon:
Another example is Suzlon, which faced challenges and scepticism from investors for years. Yet, when the charts signalled a BUY at Rs.14 after long years of underperformance, the stock defied expectations and delivered impressive returns.
- IOC Ltd:
Like the examples above, IOC languished for some time before showing signs of a potential turnaround. Again, following the signals from my trading system led to profitable opportunities.
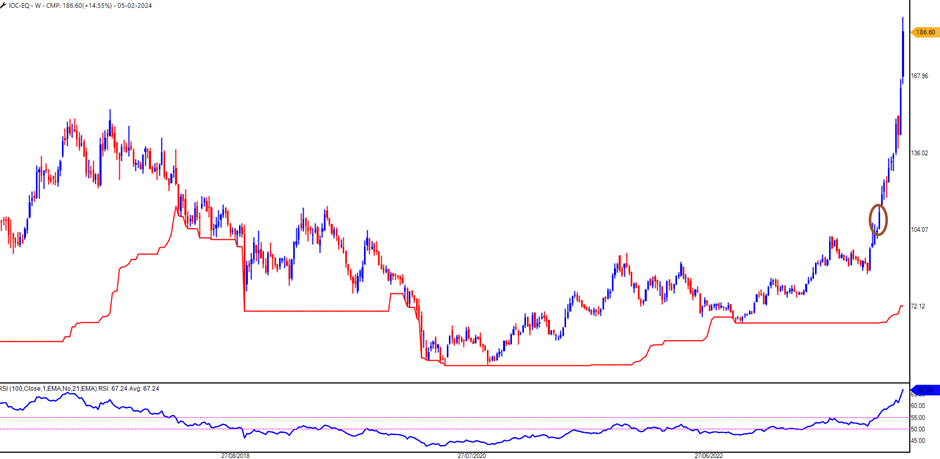
As for Vodafone Idea and Yes Bank, while there may be murmurs of a potential resurgence, my system has yet to trigger a BUY signal. Therefore, I remain cautious and avoid entering positions until the charts indicate.
1. Yes Bank
2. Vodafone Idea
The key takeaway is to trade what you see on the charts, not what you wish to see or hope for. Emotions and personal biases can cloud judgment and lead to costly mistakes in investing and trading. By relying on technical analysis and adhering to proven strategies, navigate markets with greater confidence and discipline.
Let the charts be your guide, and remember: it's not about what you like but rather what you see unfolding before you.
- Hero Moto Corp:
-
Forget Western Candlestick Pattern, Learn a pattern by #Gujju #Trader
Kanti Kaka Ni Chavi - #Kudko #Bhusko #CandlestickPattern
-
Stock List 3rd Feb 2024
-
@Yogen Mehta You can scan for fresh scripts on EOD basis.
-
Bulls entered the Dragon but needed to break the resistance of the gap.
-
Re: The Strategy's Unbelievable Stats Revealed - Video Coming Soon...
You may have heard about this simple concept "Golden Cross" and "Death Cross".
But this stats are just unbelievable. Even I was so shocked when I saw this.
Watch video here: https://youtu.be/6312czWjTTE?si=Z58fn3Gf3sFR_yUg
#KeepItSimple
-
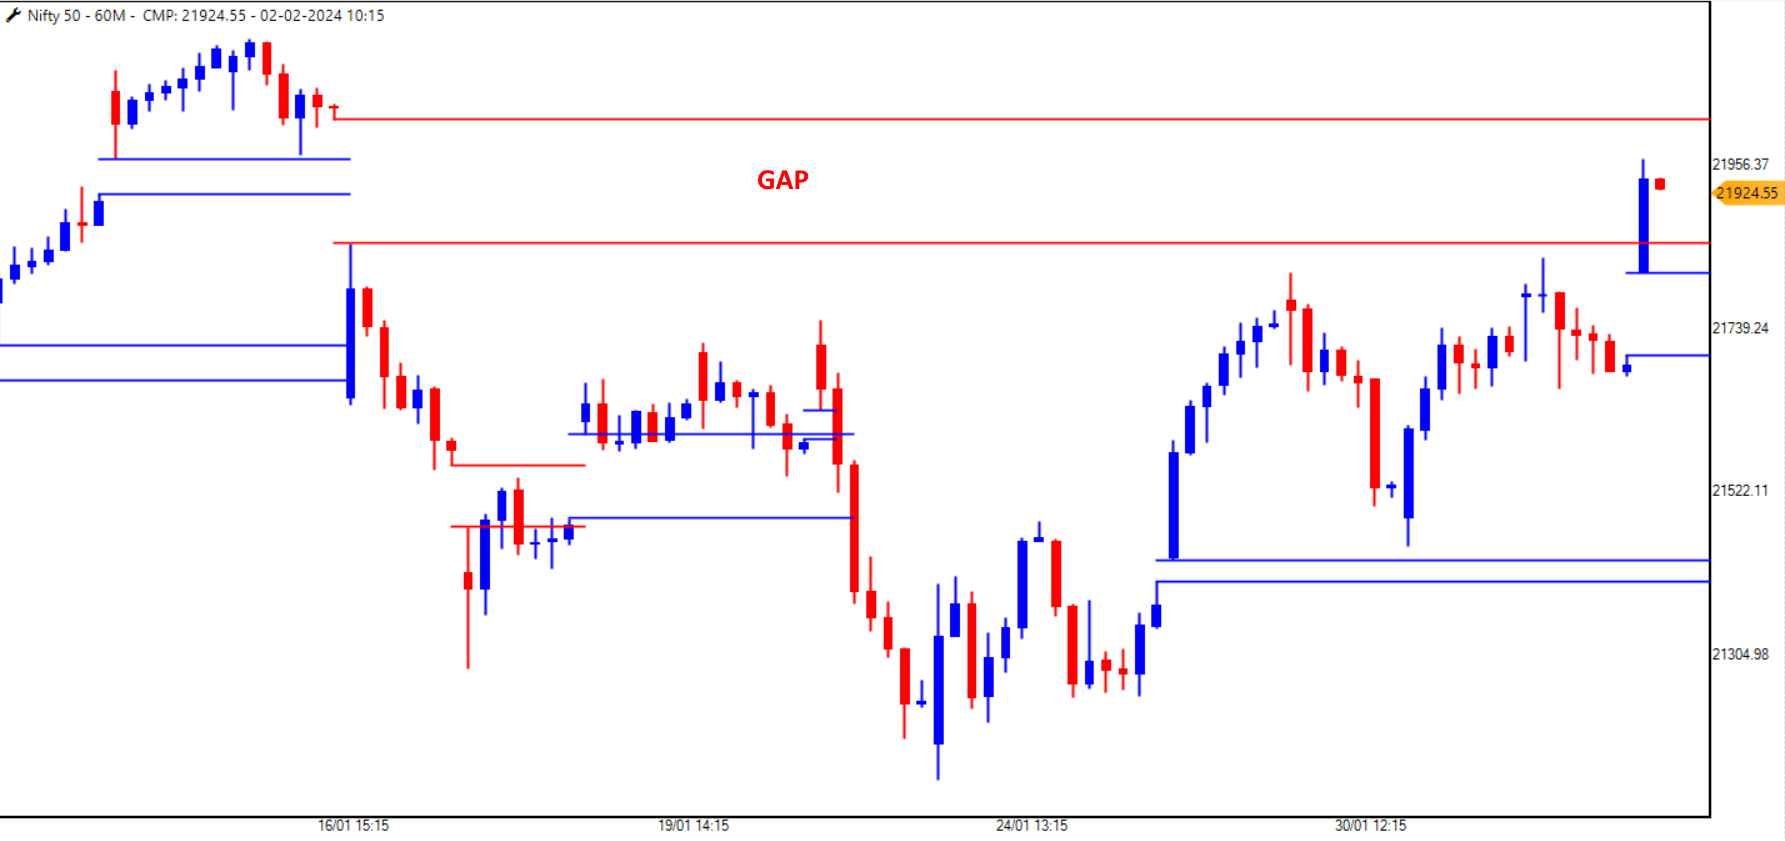
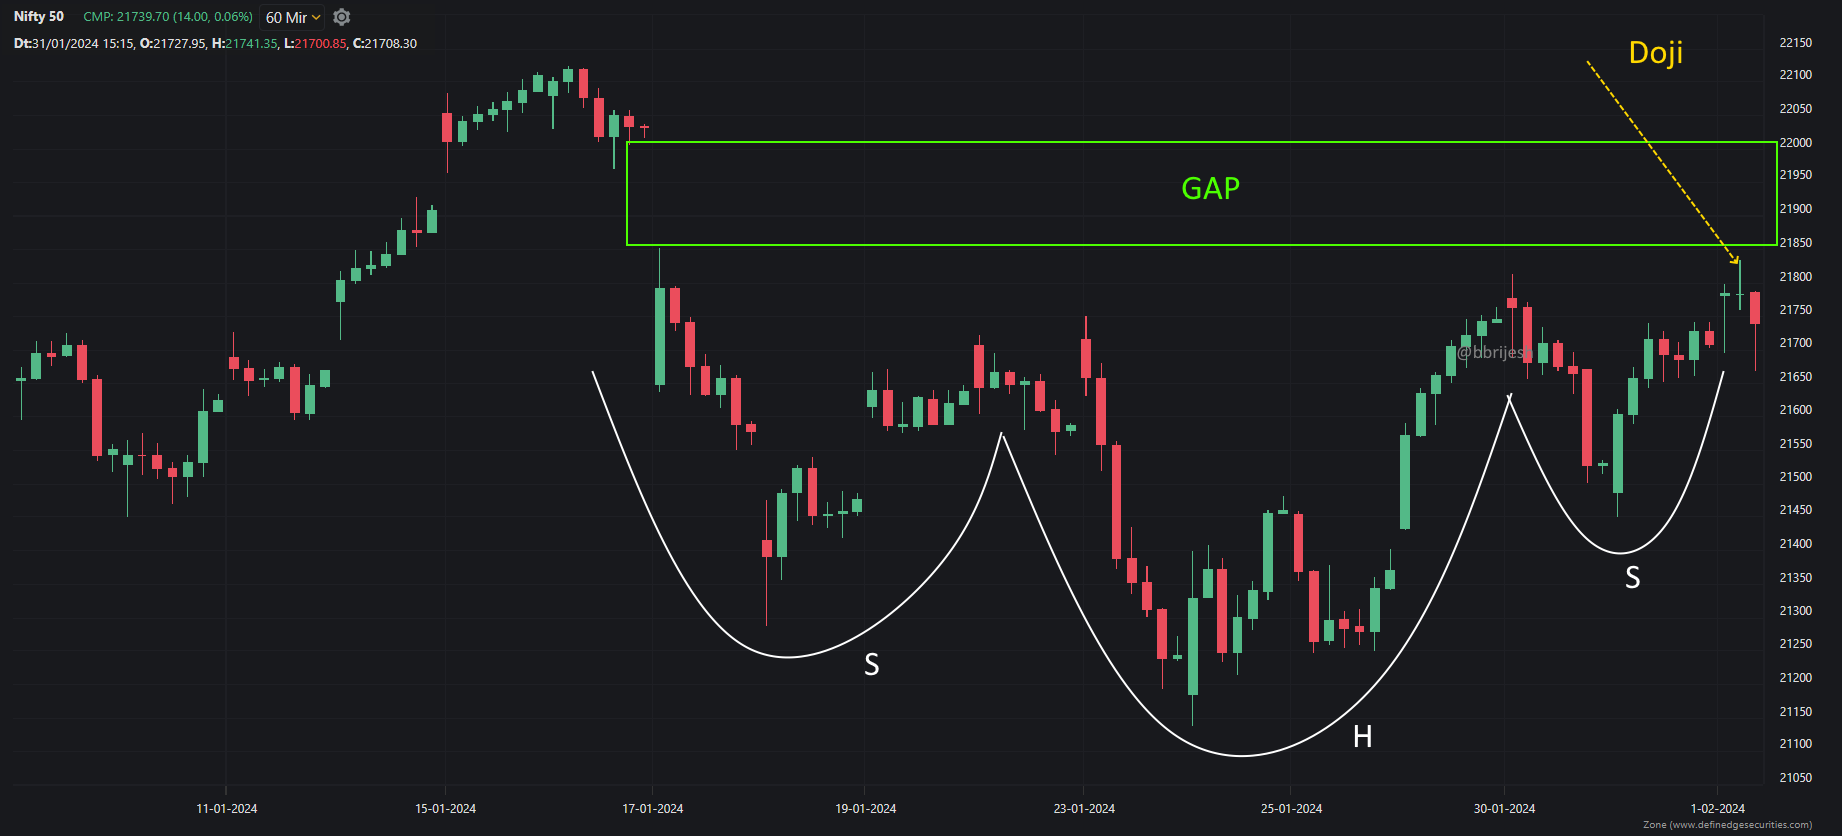
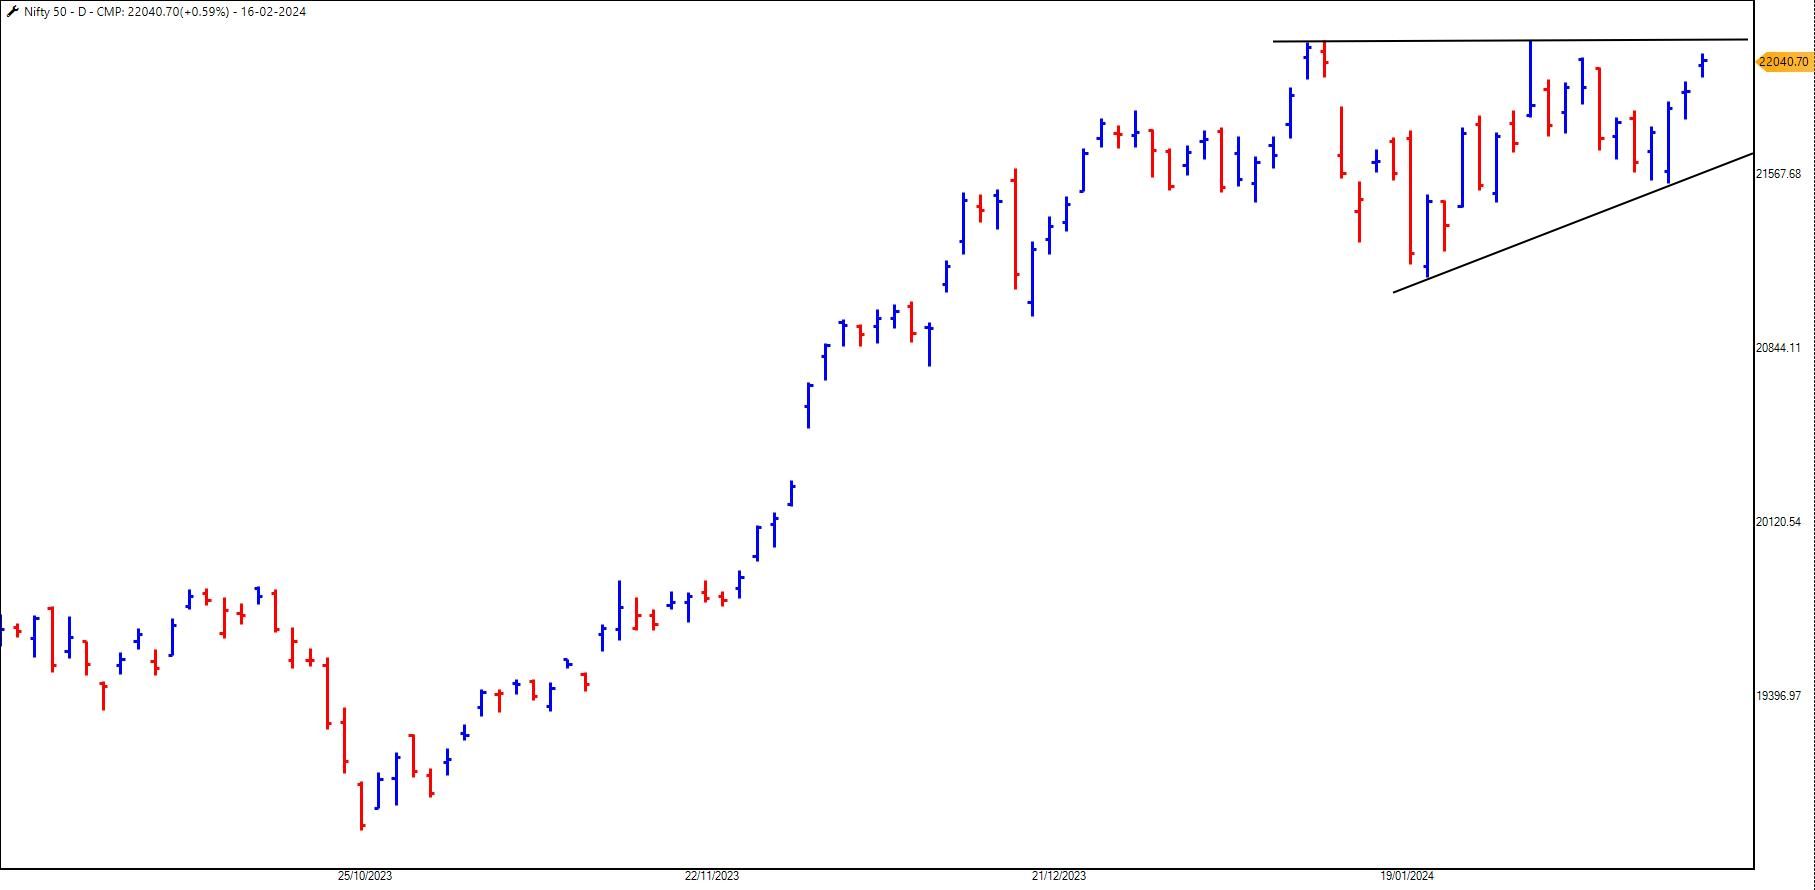
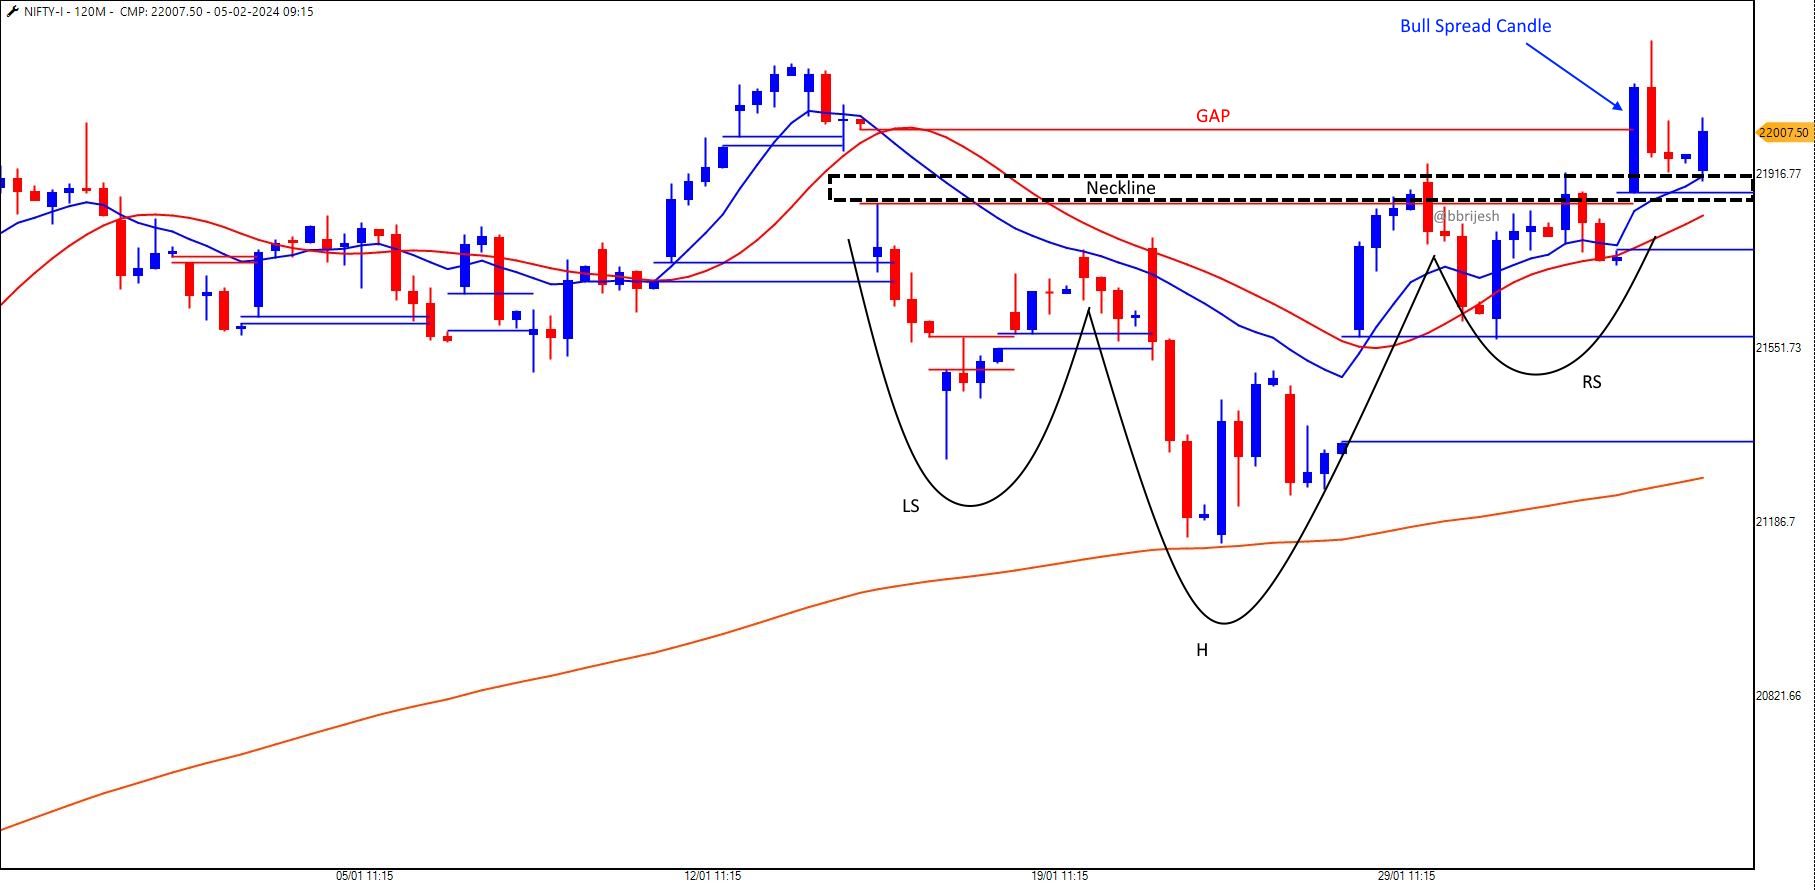
Is anything interesting in the #BudgetDay2024?
Let's focus on the Nifty chart here.
The potential for a bullish trend is evident by forming a Bullish or Inverted Head and Shoulder pattern, indicating a possible upward market move.
A significant obstacle lies in the form of a gap between 21,800 and 22,000, establishing a formidable resistance zone.
The presence of a Doji pattern, coupled with bearish momentum on the hourly chart, raises concerns about the weakening grip of the bulls on the market.
Should the bulls prove unable to breach the resistance, a looming threat emerges as a potential aggressive onslaught by the bears.
Traders must remain vigilant and watch the levels closely.
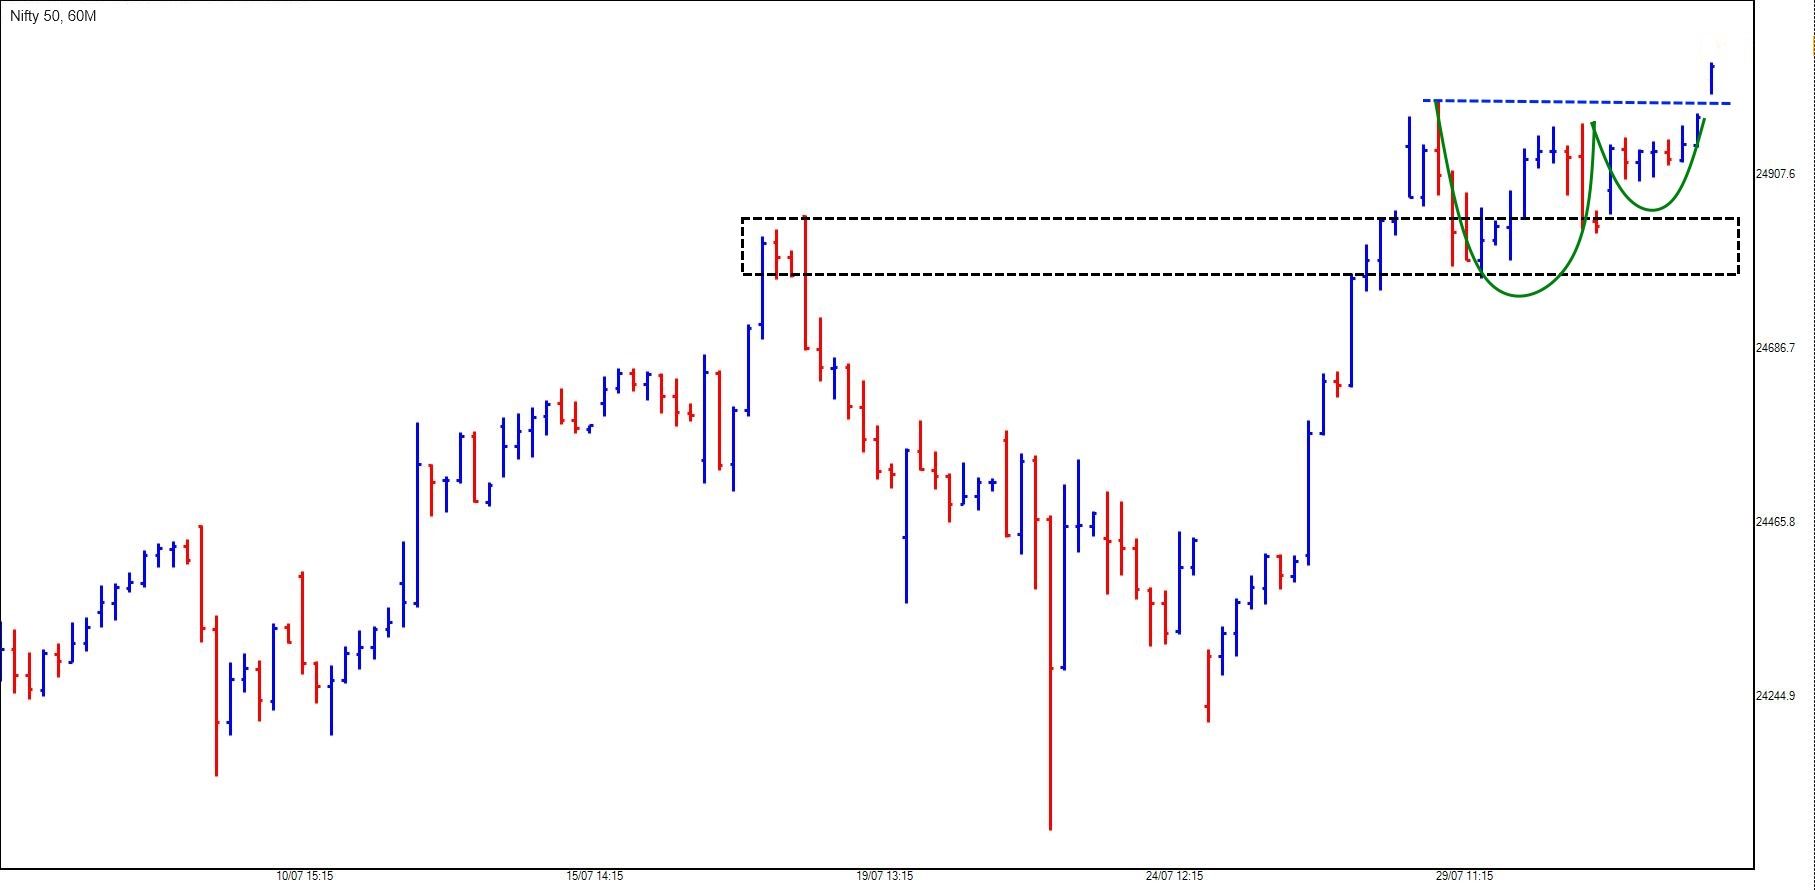
Nifty - Cup & Handle Breakout
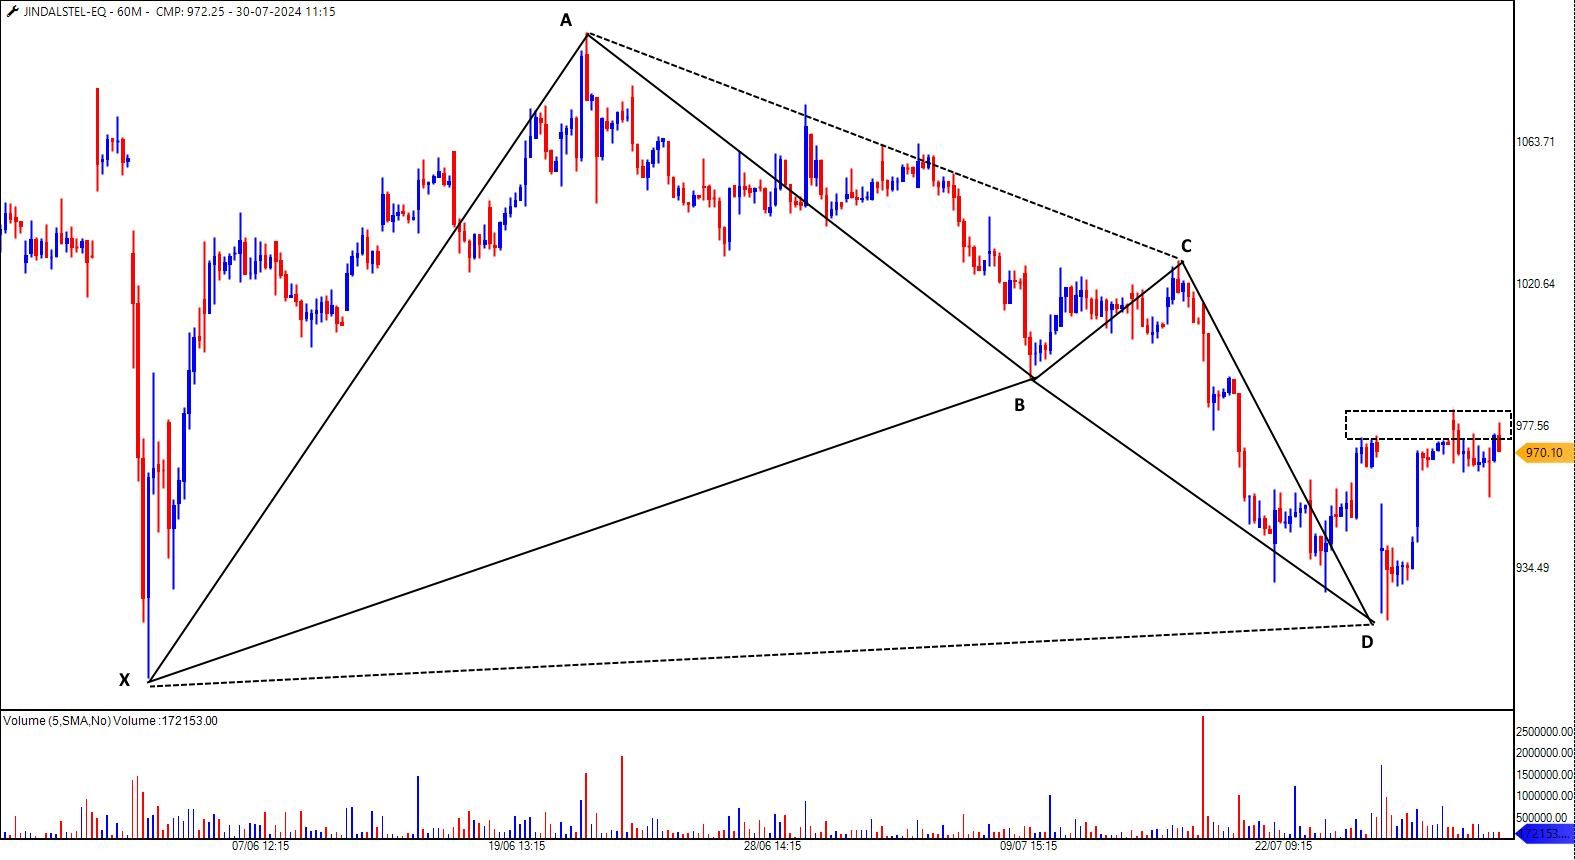
JindalStel - Breakout ABV 985
Suzlon - Over 4X in Laidback Strategy
Suzlon - Over 4X in Laidback Strategy
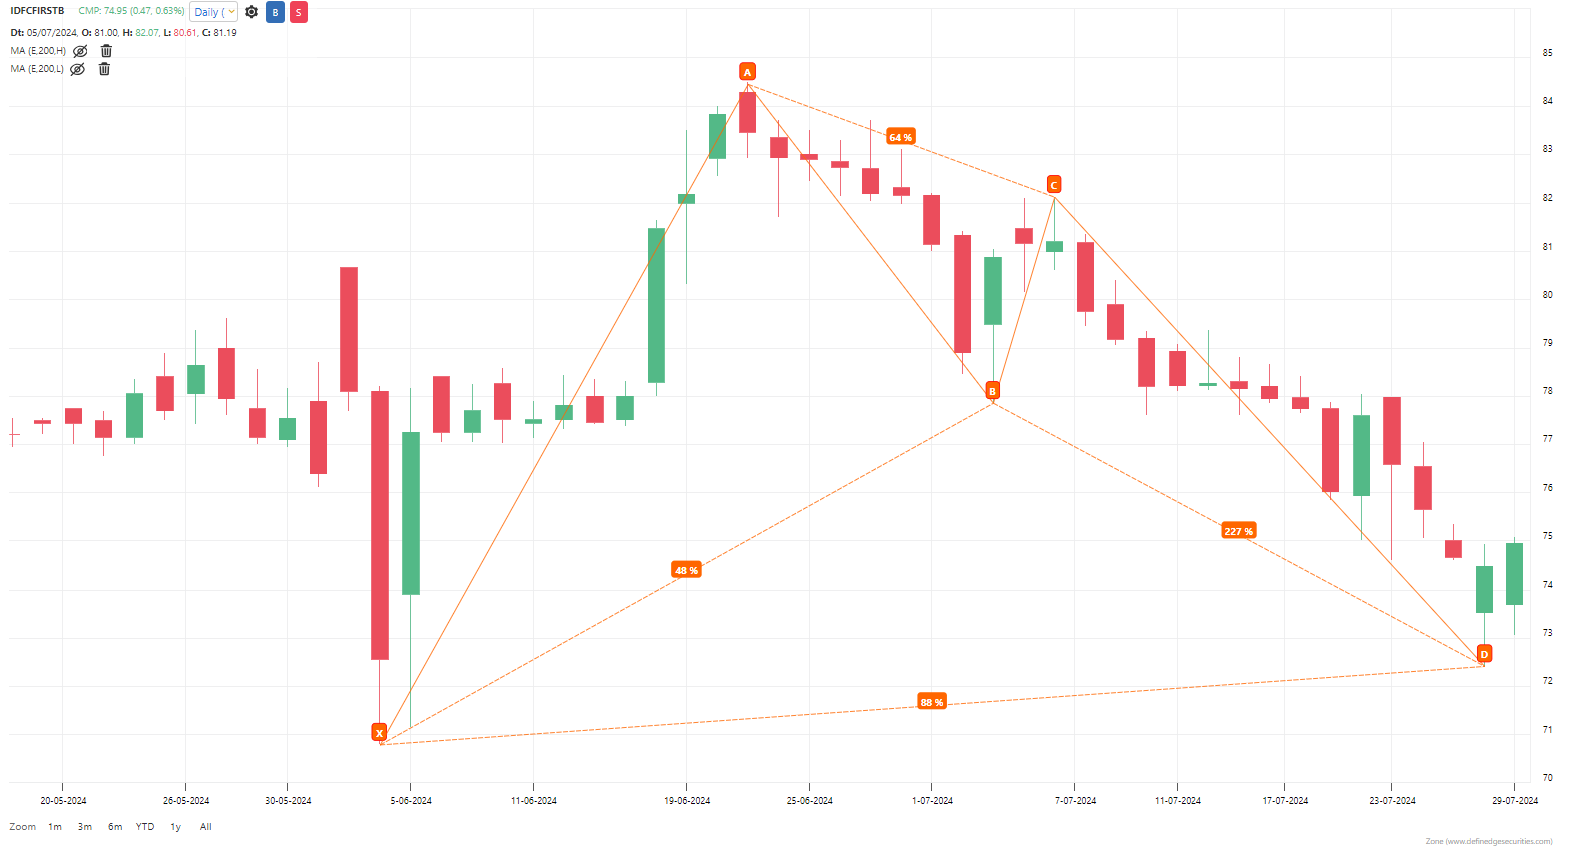
IDFCFIRSTBank - Bullish Harmonic
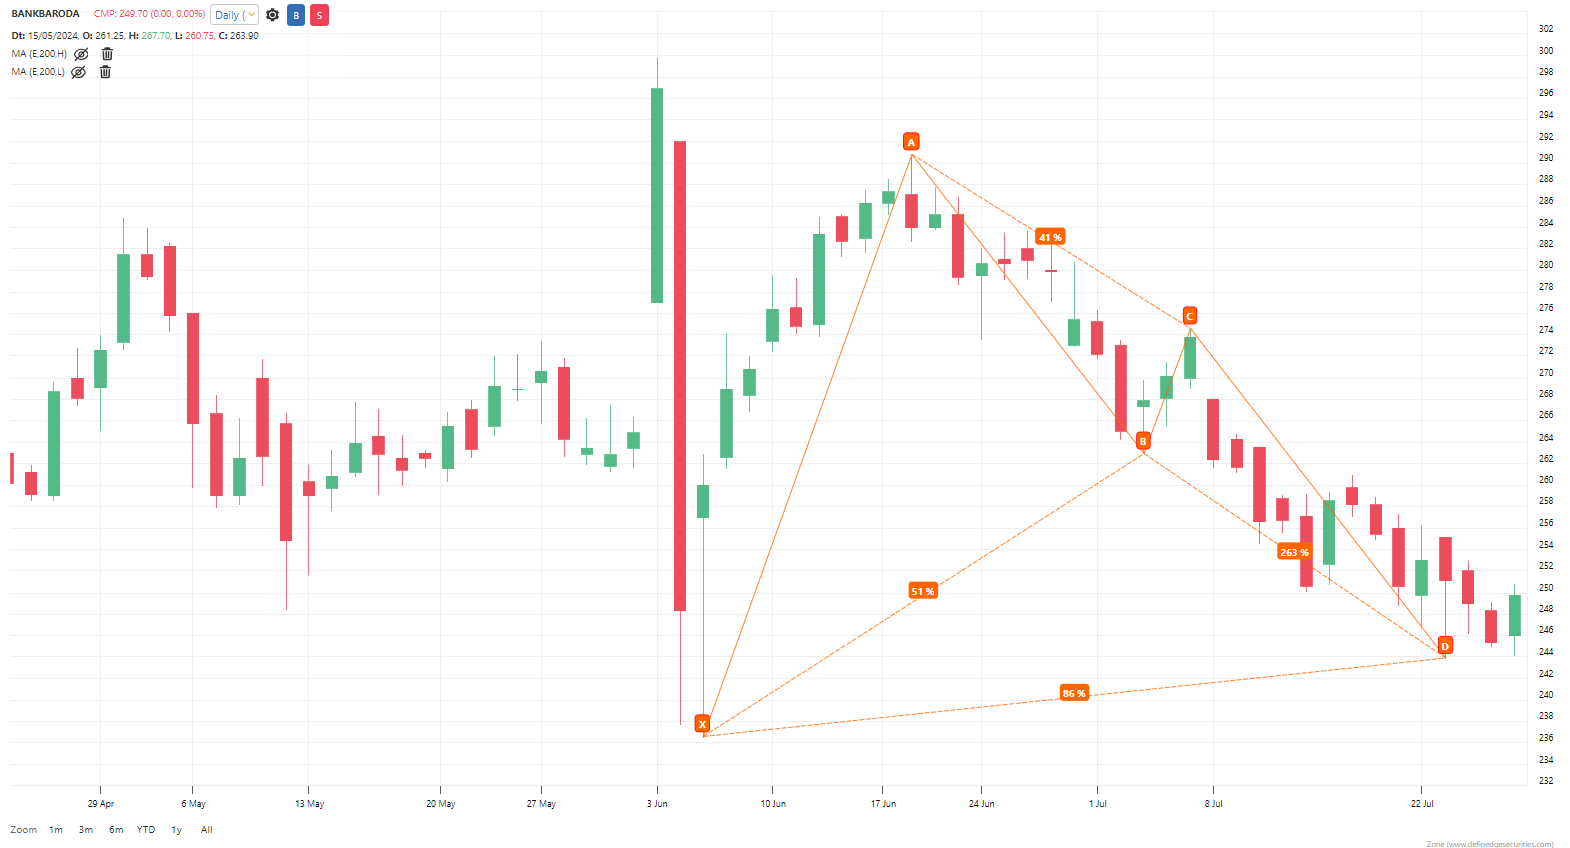
Bank Baroda - Bullish Harmonic
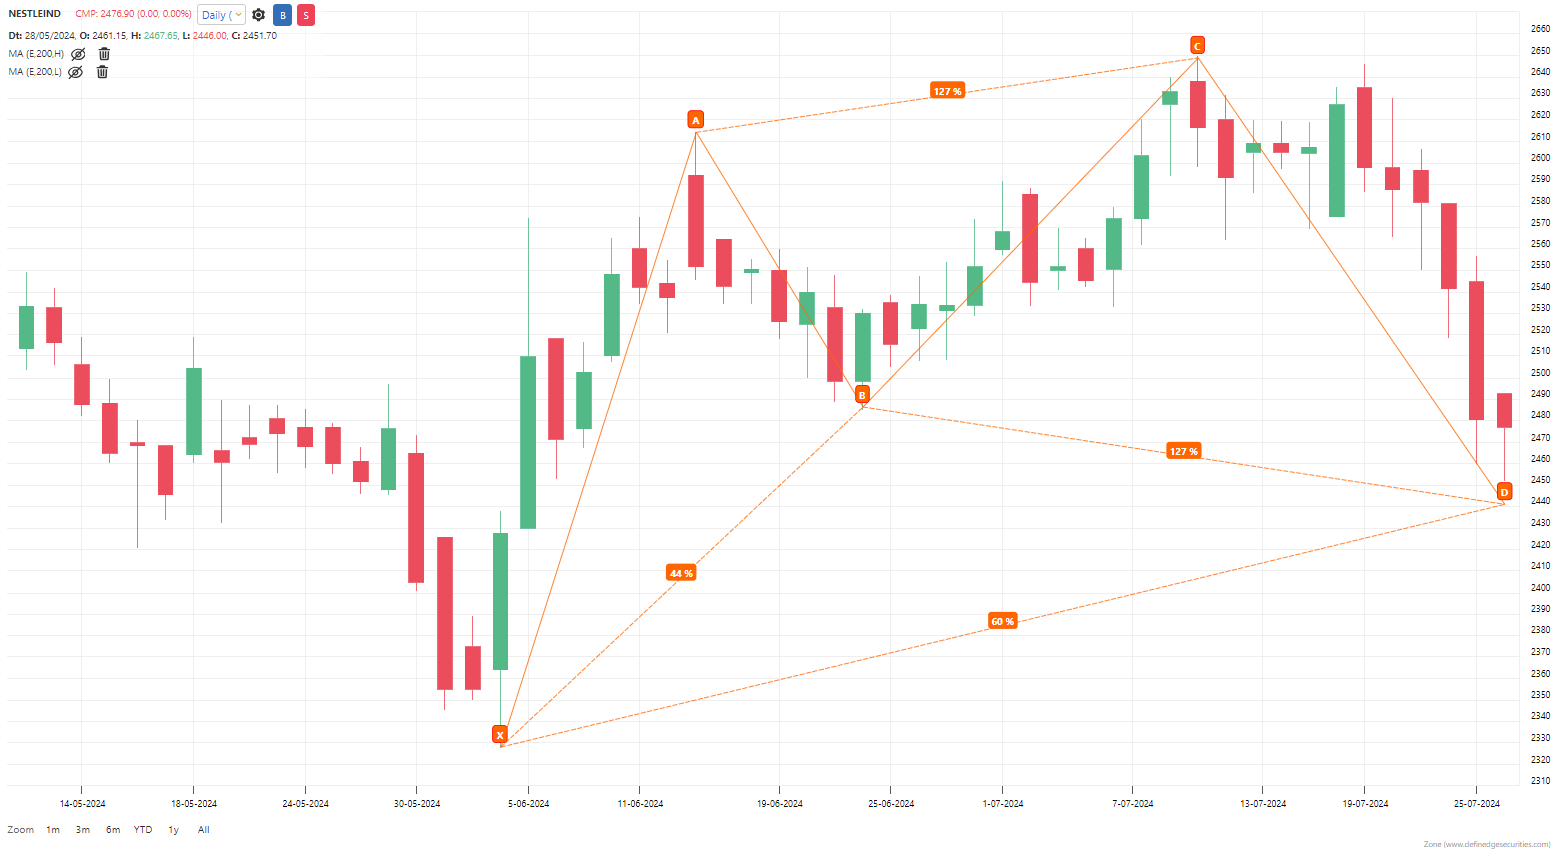
Nestle - Bullish Harmonic @ 2,430-2,440
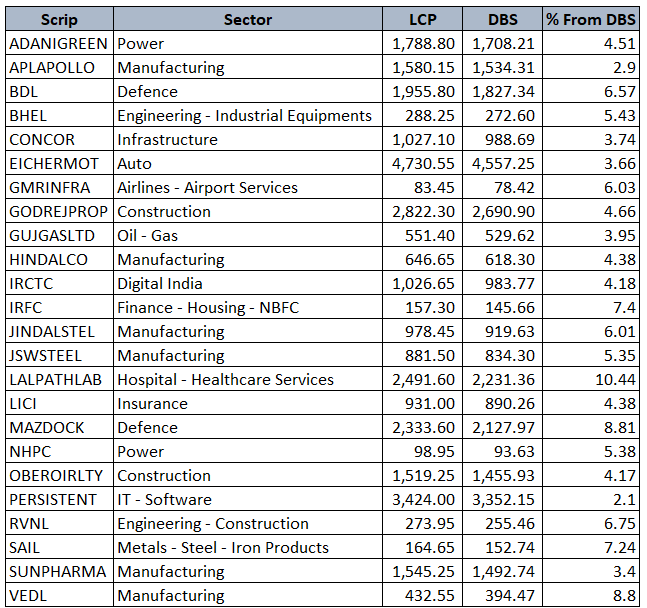
Laidback Strategy - Stock List
Nifty - Bearish Gartley
Bajaj Fin - Bullish Harmonic
Bajaj Fin - Bullish Harmonic
F&O Stocklist for Follow Through Setup
Budget Session Trading Strategy (Video)
SYSTEM BUILDER QUERY
Drreddy - Bearish Harmonic
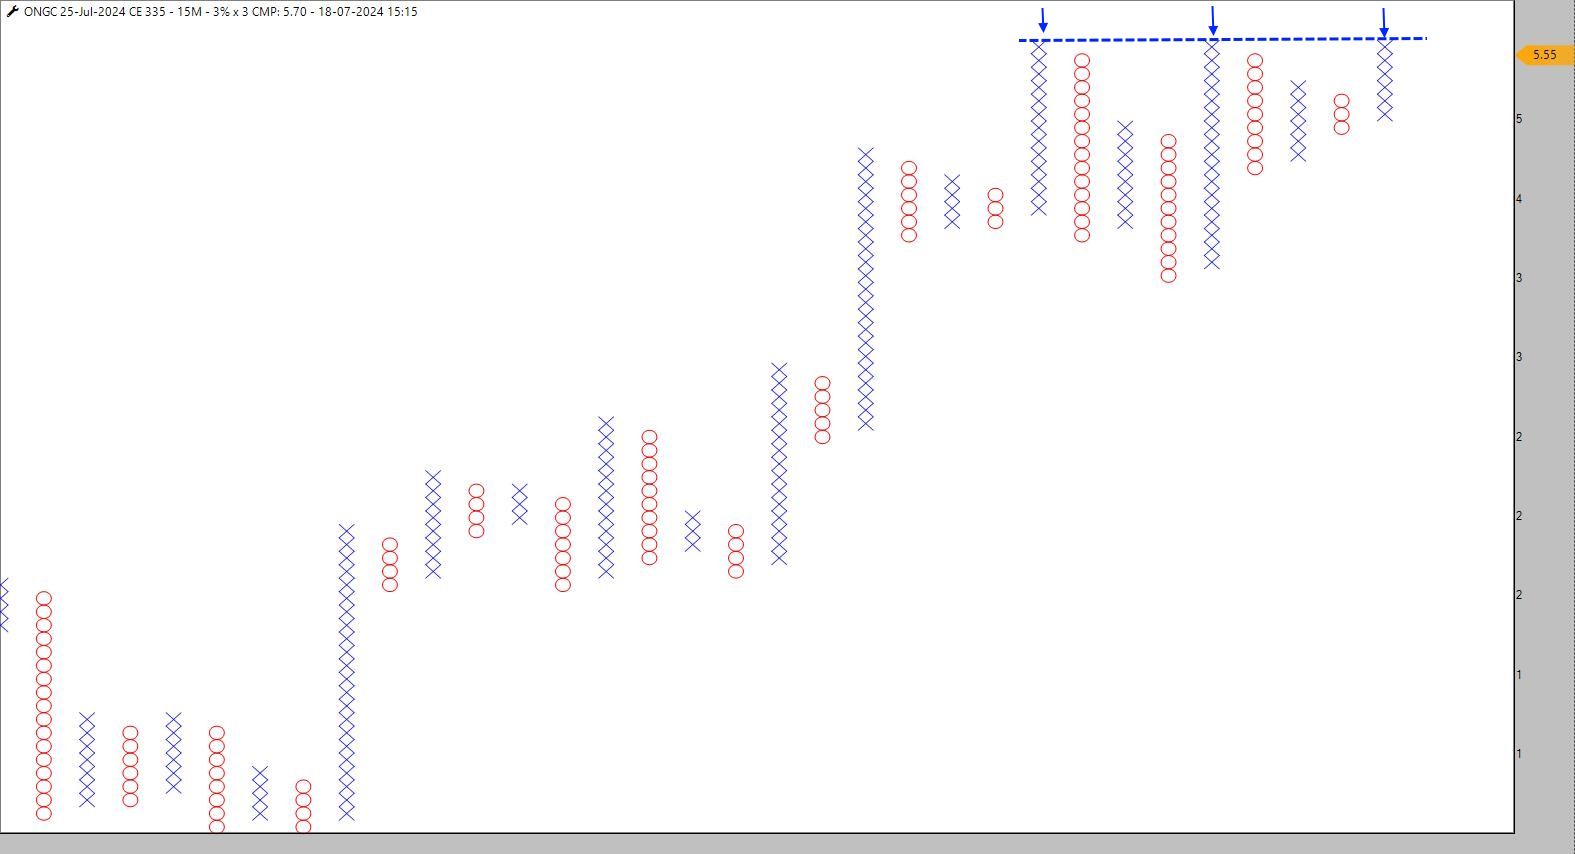
ONGC 335CE - Breakout Above 6.50 (CMP-5.50)
Bank Nifty - Time for Options Traders
SYSTEM BUILDER QUERY
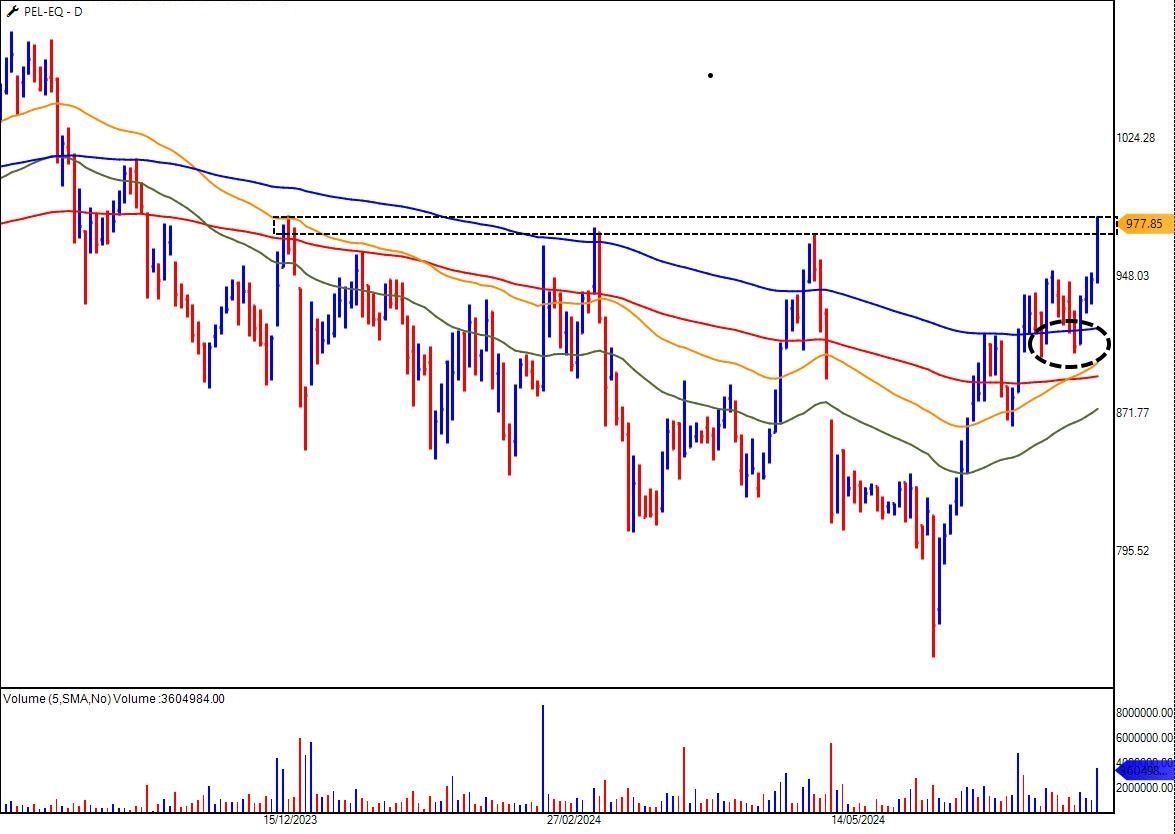
PEL - The Journey to New Beginnings
SYSTEM BUILDER QUERY
VSTOP indicator for candlestick chart
Reliance - On verge on TTB
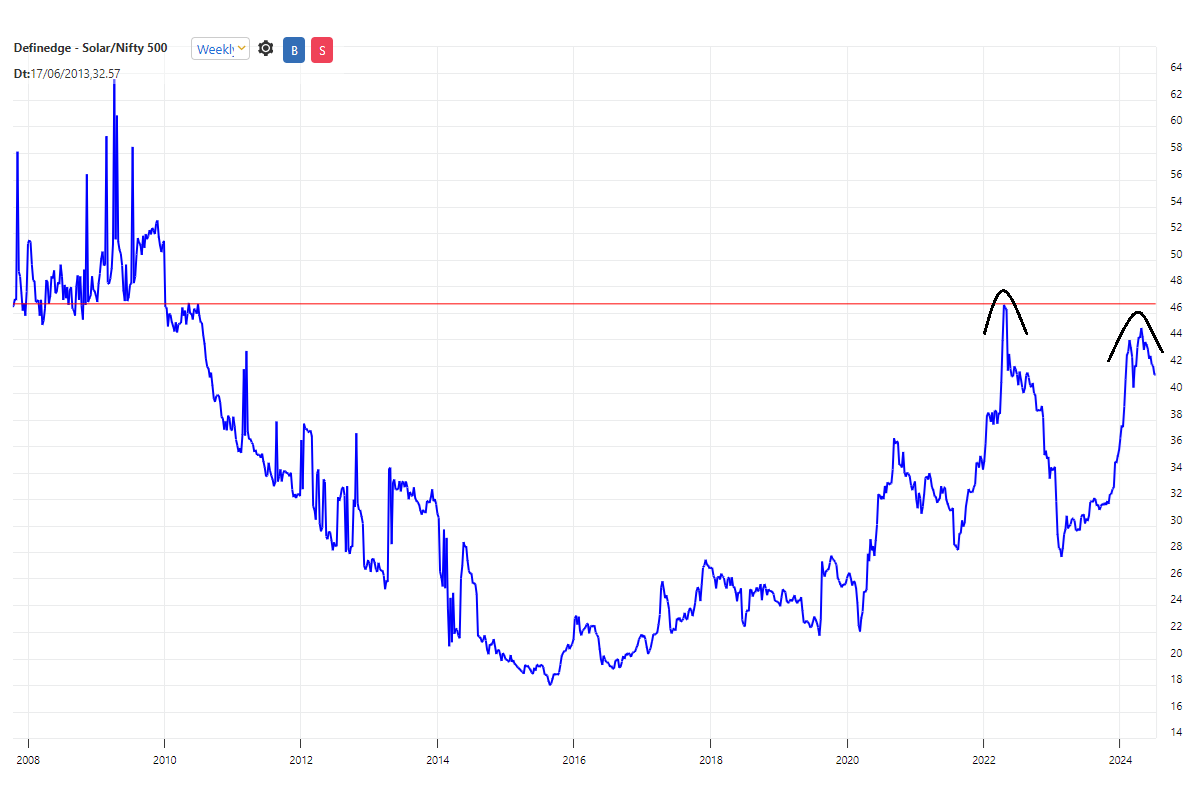
Definedge Solar vs Nifty500 Ratio Chart
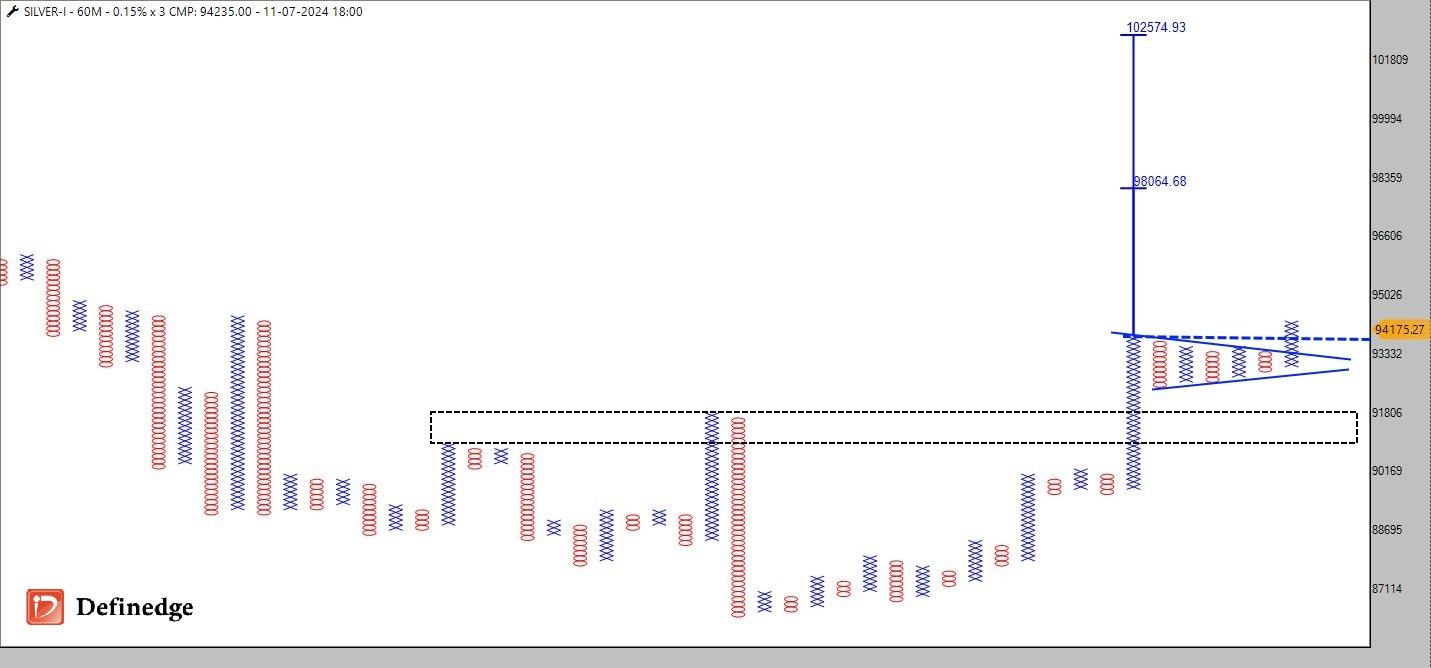
MCX Silver - Is it Getting Ready for 1,00,000?
Nifty - Bullish Harmonic
Volume Weighted Trend Rider - Trading Strategy
Volume Weighted Trend Rider - Trading Strategy
Stock Turning Bullish- Check on Zone Mobile
How is brick size calculated?
Laidback Strategy - Stock List
ABC pattern clarification
Can Private Banks End the Four-Year Drought?
Bank Nifty - Time for Options Traders
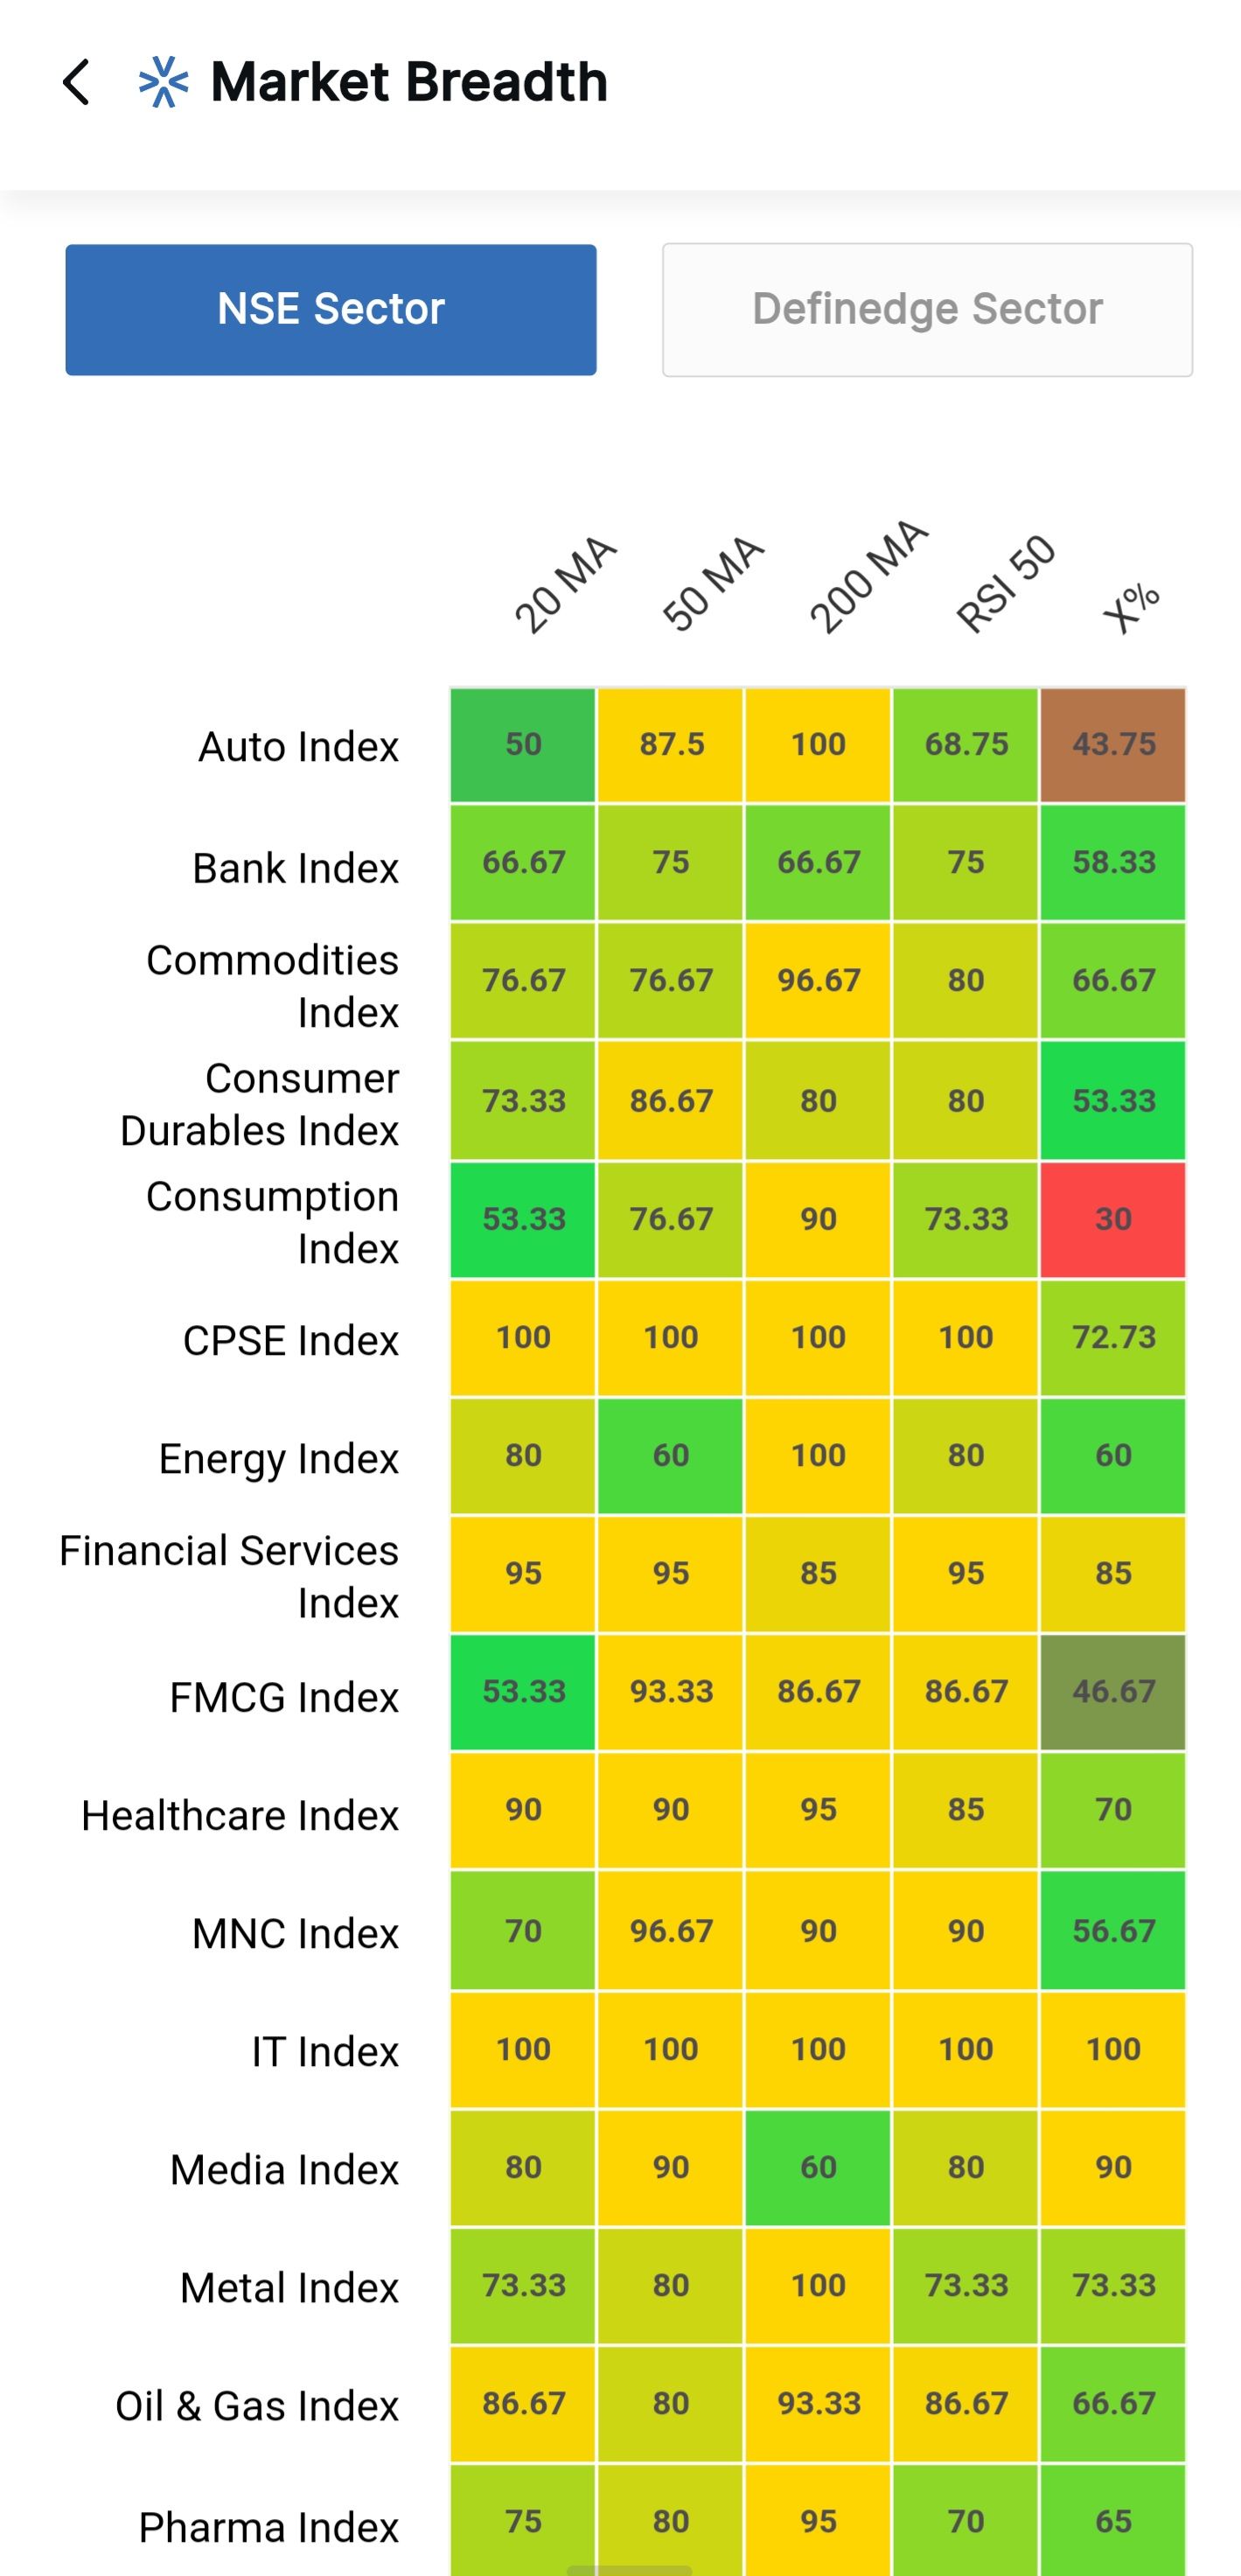
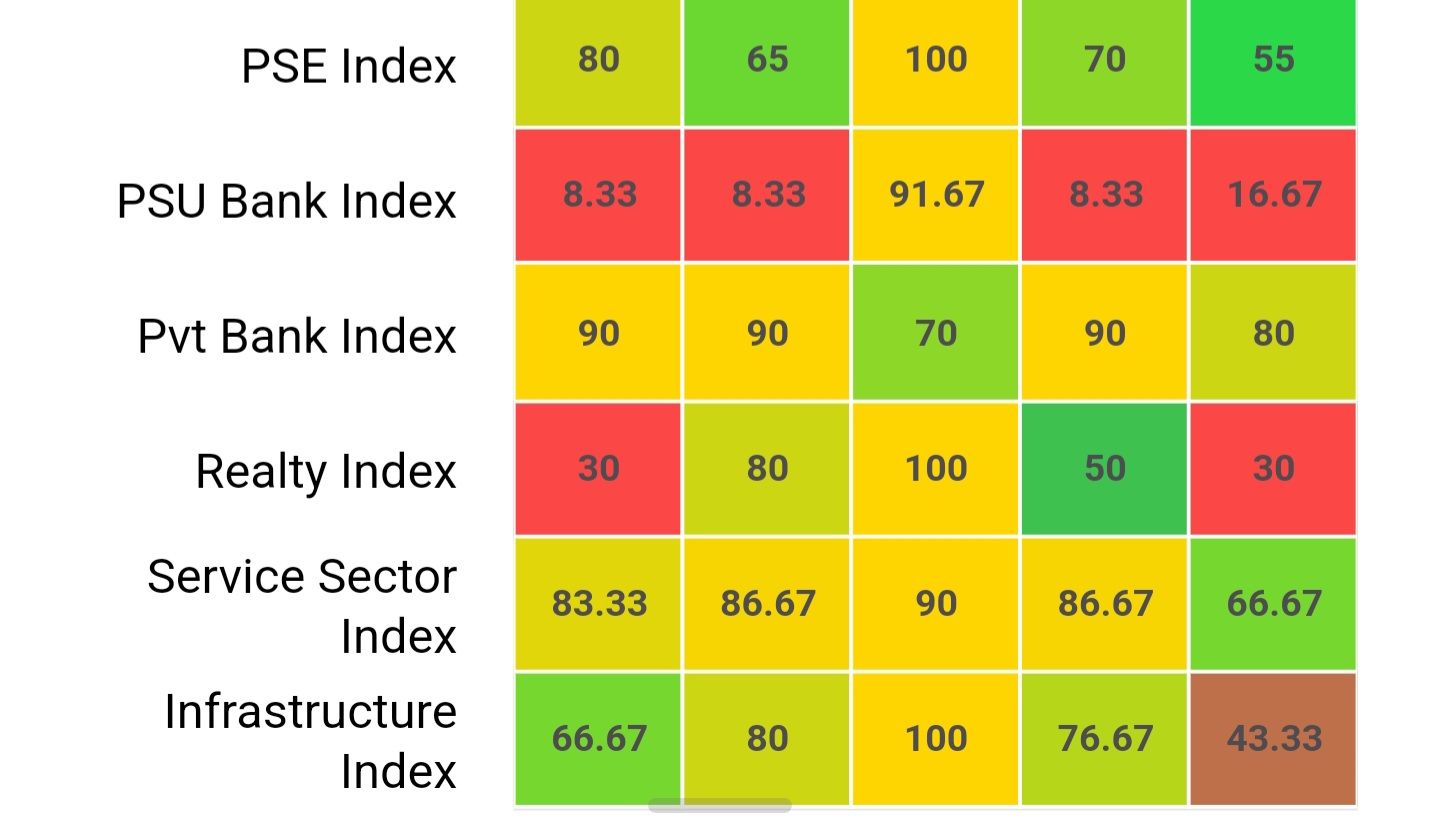
Check Market Breadh on the Go using Zone Mobile
PVR - The Bullish Breakout
Can Private Banks End the Four-Year Drought?
Volume Speaks, Do You Hear It?
Tradingview Integration
Query on weekly charts
PnF PATTERNS
I want to Scan candlestick chart when RSI(14) Crossover & Crossunder any certain number
I want to Scan candlestick chart when RSI(14) Crossover & Crossunder any certain number
PVR - The Bullish Breakout
I want to Scan candlestick chart when RSI(14) Crossover & Crossunder any certain number
Weis Waves: Decoding Market Trends
I want to Scan candlestick chart when RSI(14) Crossover & Crossunder any certain number
I want to Scan candlestick chart when RSI(14) Crossover & Crossunder any certain number
Few people are spamming the Forum by posting irrelevant customer care phone no messages.
I want to Scan candlestick chart when RSI(14) Crossover & Crossunder any certain number
Is there any guidance available on how to match expressions with strategy conditions
PVR - The Bullish Breakout
Volar score definition
One Good Trade – A Story of All the Traders
Analyzing the SPEED of the TREND
Analyzing the SPEED of the TREND
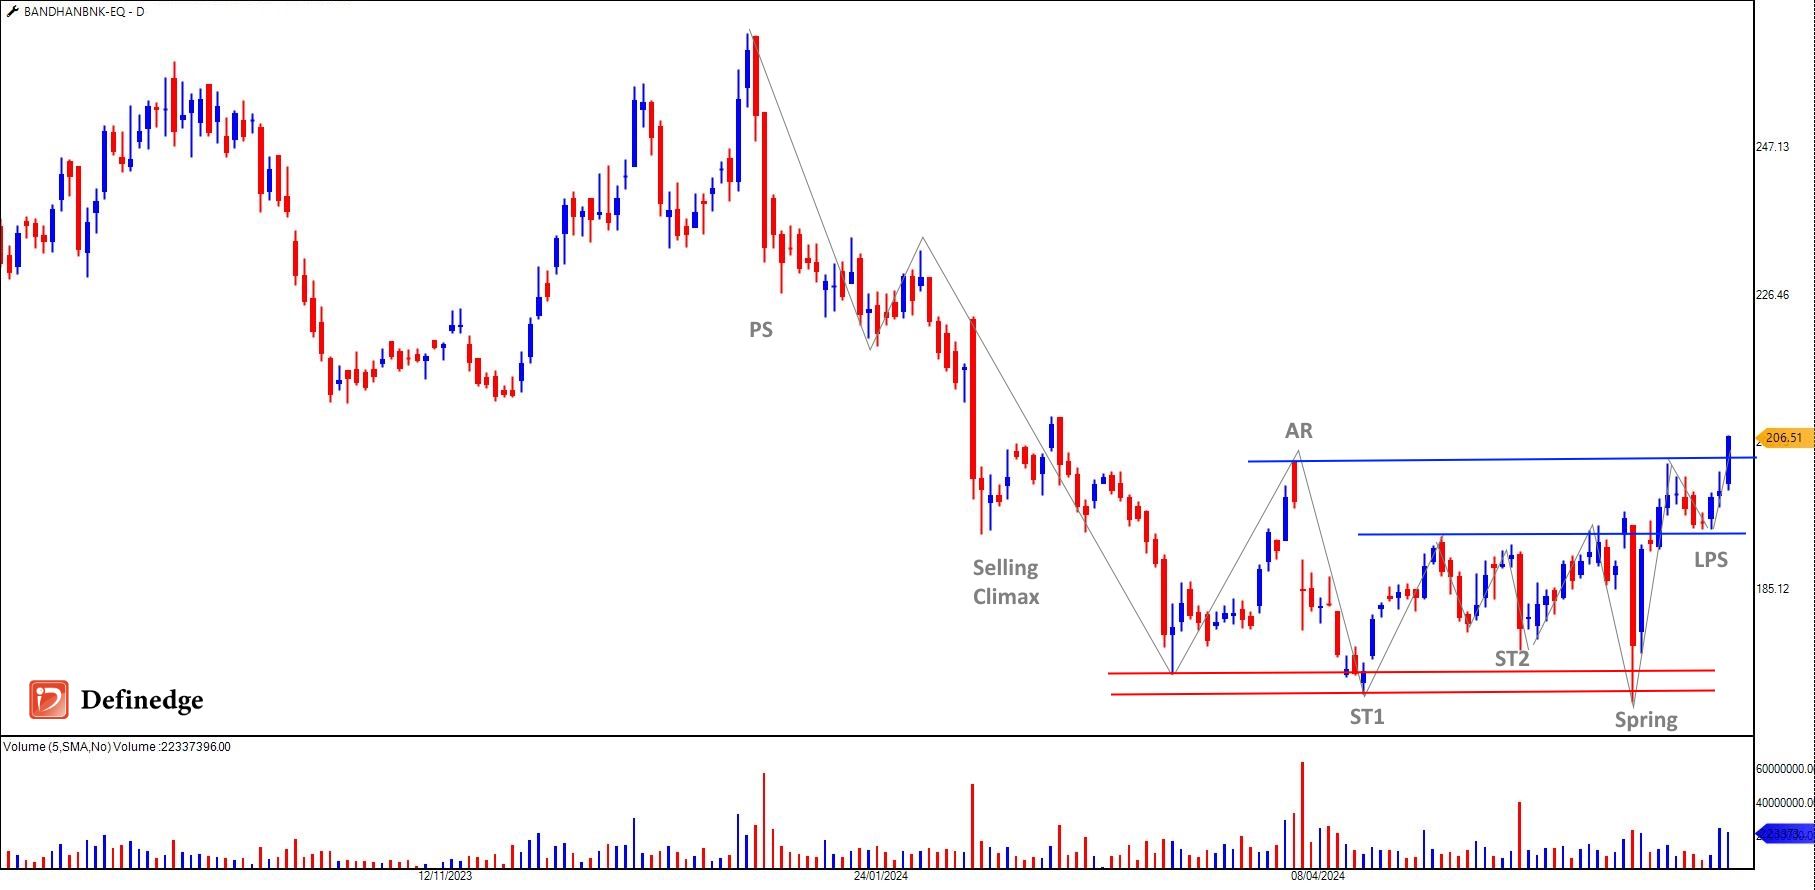
Bandhan Bank - Bullish Wyckoff
**subject : Build Winning Trading Systems with Backtest Results | RZONE | Brijesh Bhatia | Definedge**
Nifty Overview- Are You Using this Zone Mobile Feature?
Adani Ports - Bullish Harmonic
Trading Strategy Using Volumes - With Scanner
RS-alpha scanner You tube video by Brijesh Bhatia
How to set a Default Chart Template in Zone Web / R Zone?
Federal Bank - Trividh Setup - When to Trade
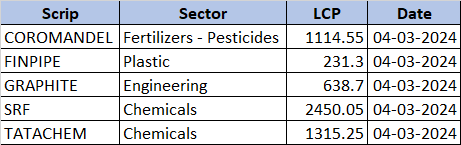
Tata Chem - Bullish Harmonic + Inverted H&S
Nifty - Real Struggle for Bulls Begins Now {Wyckoff}
Bank Nifty - Rising Channel + 200EMA Channel
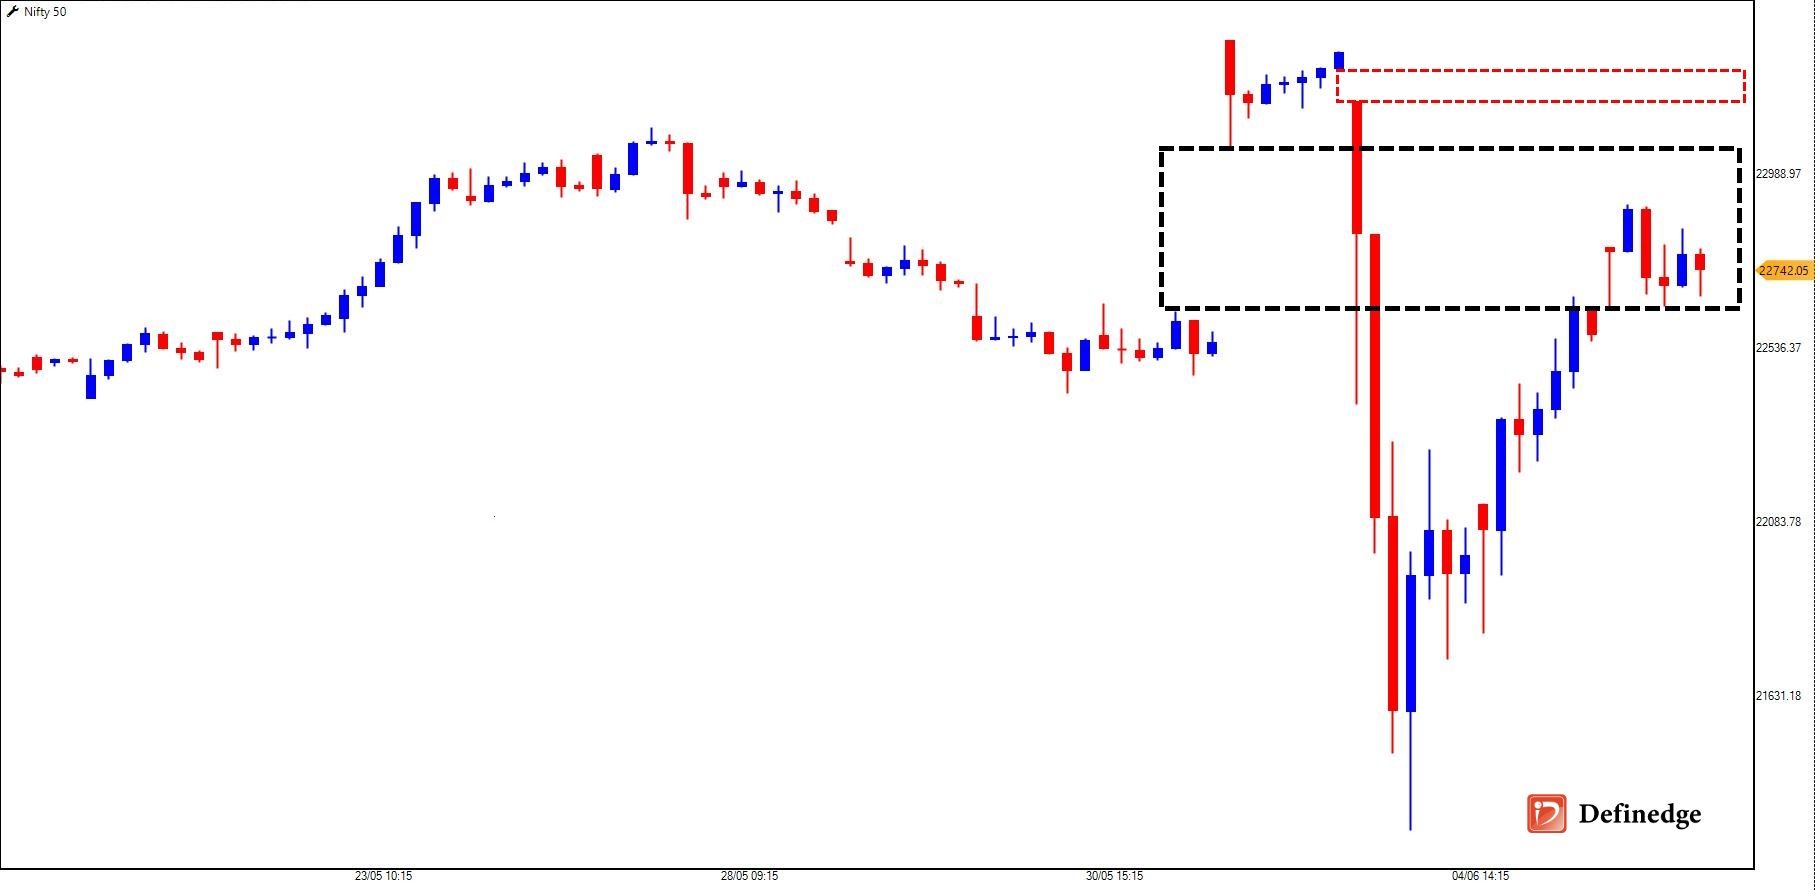
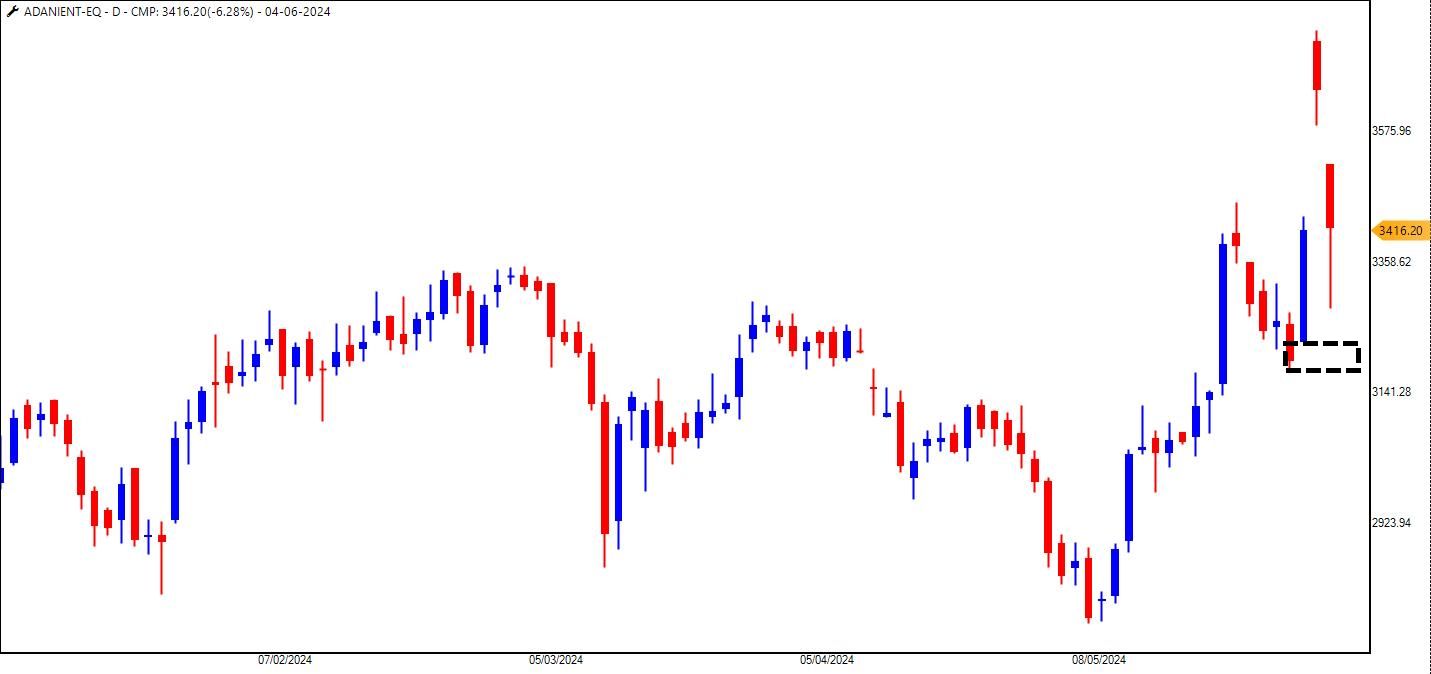
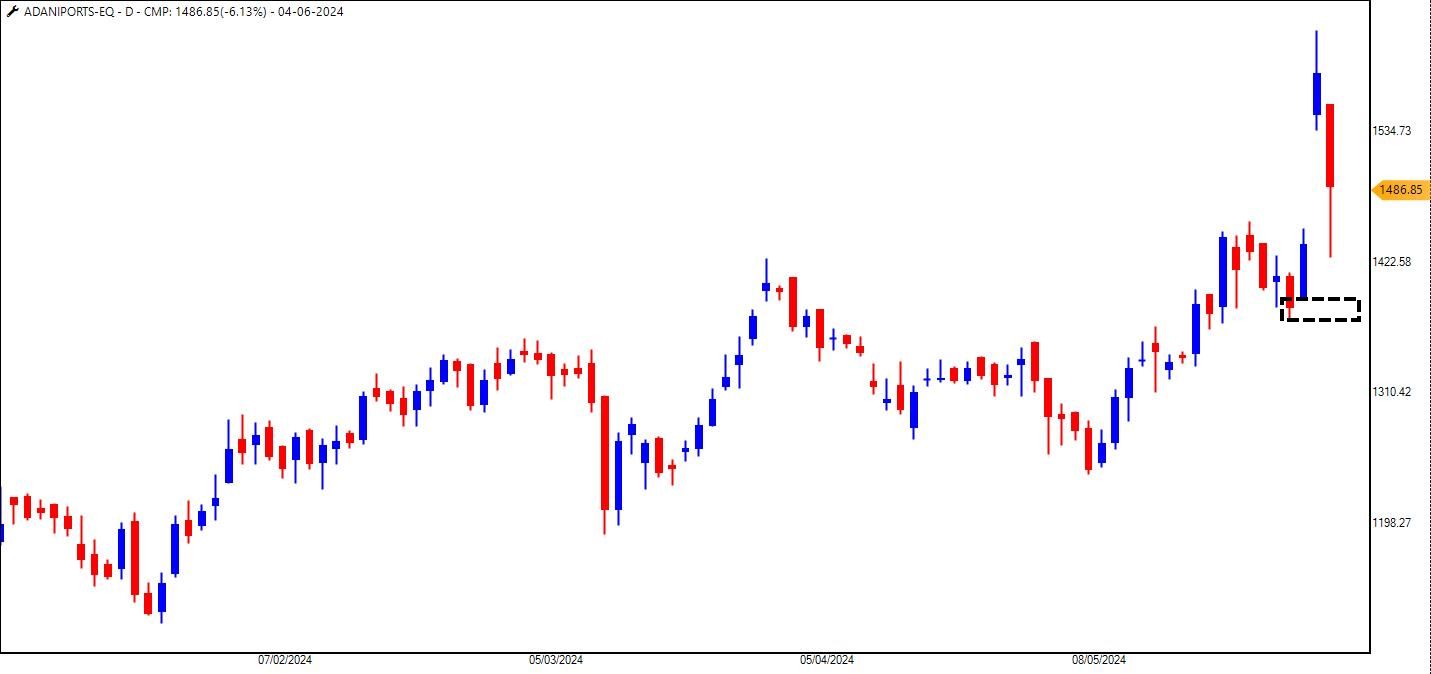
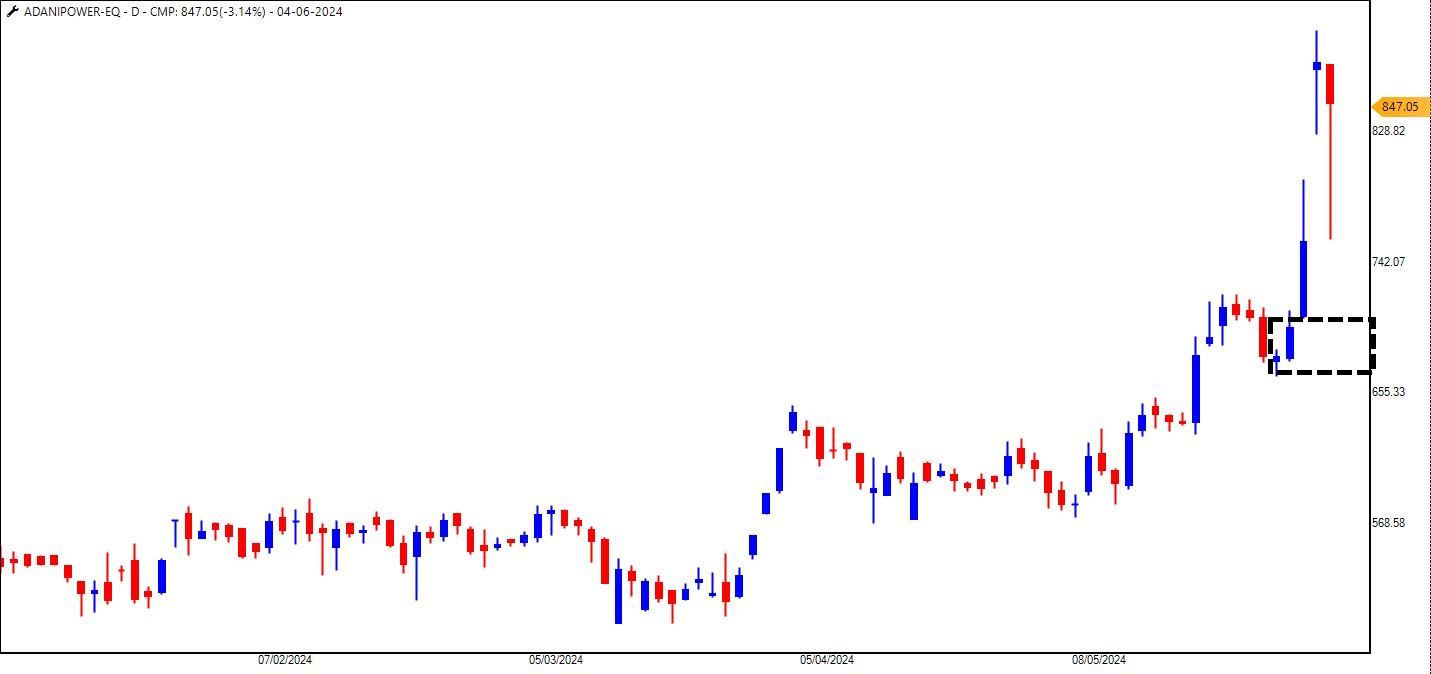
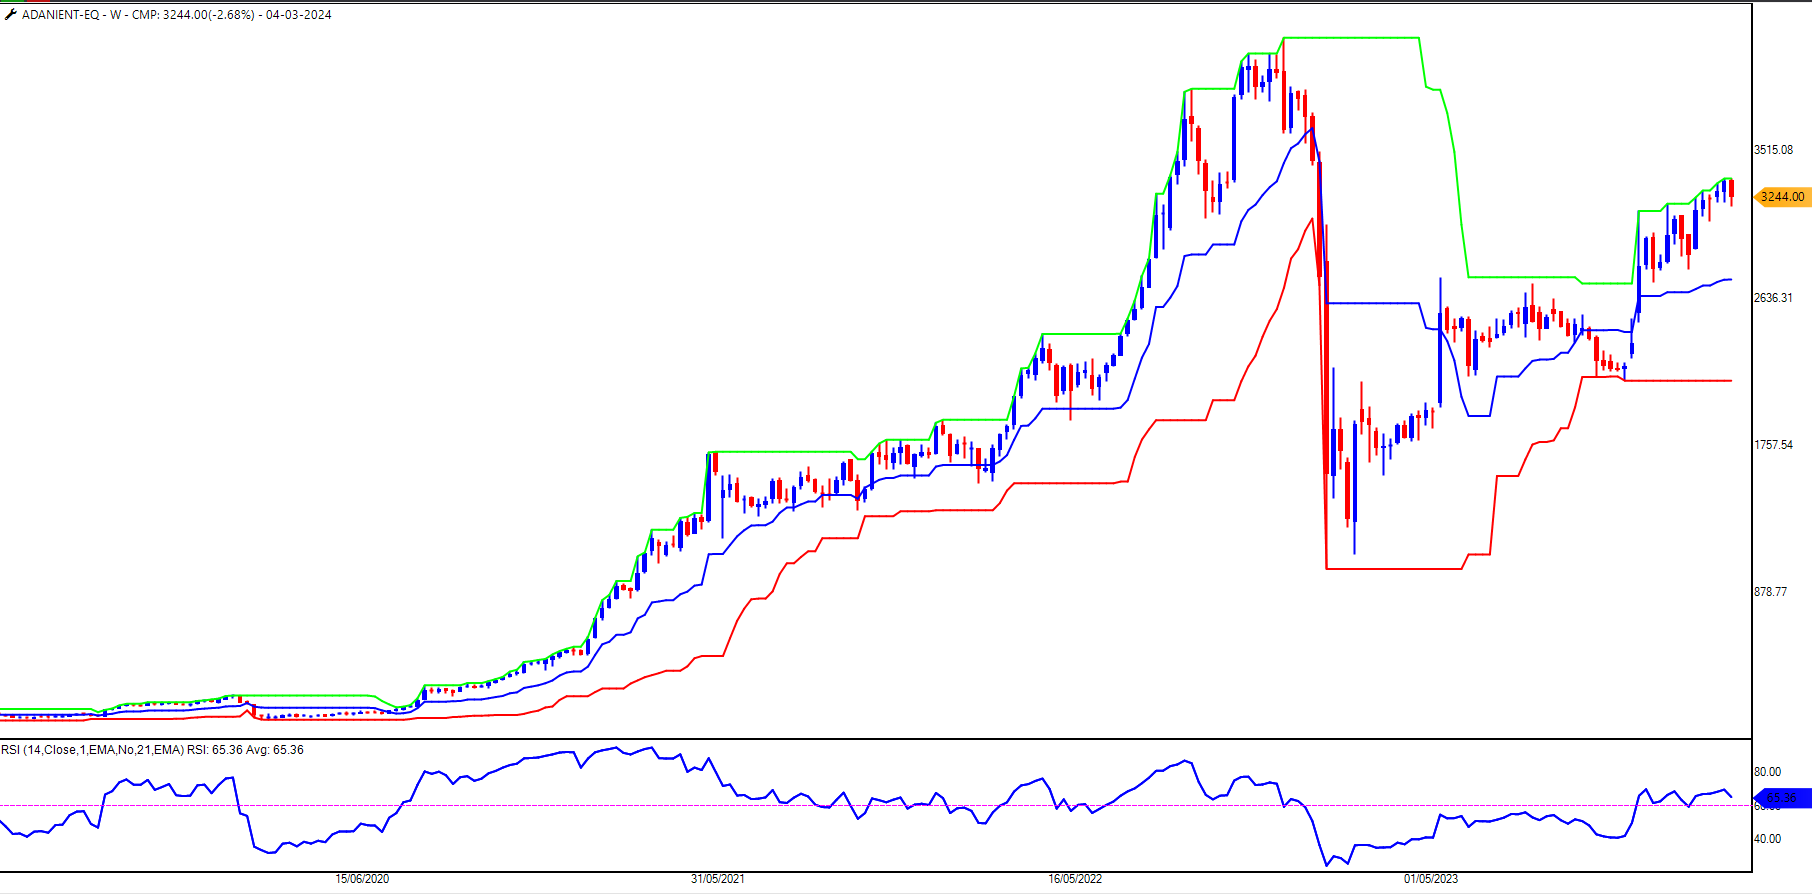
Adani Group giants are Trading Above Their Bullish Breakout Levels
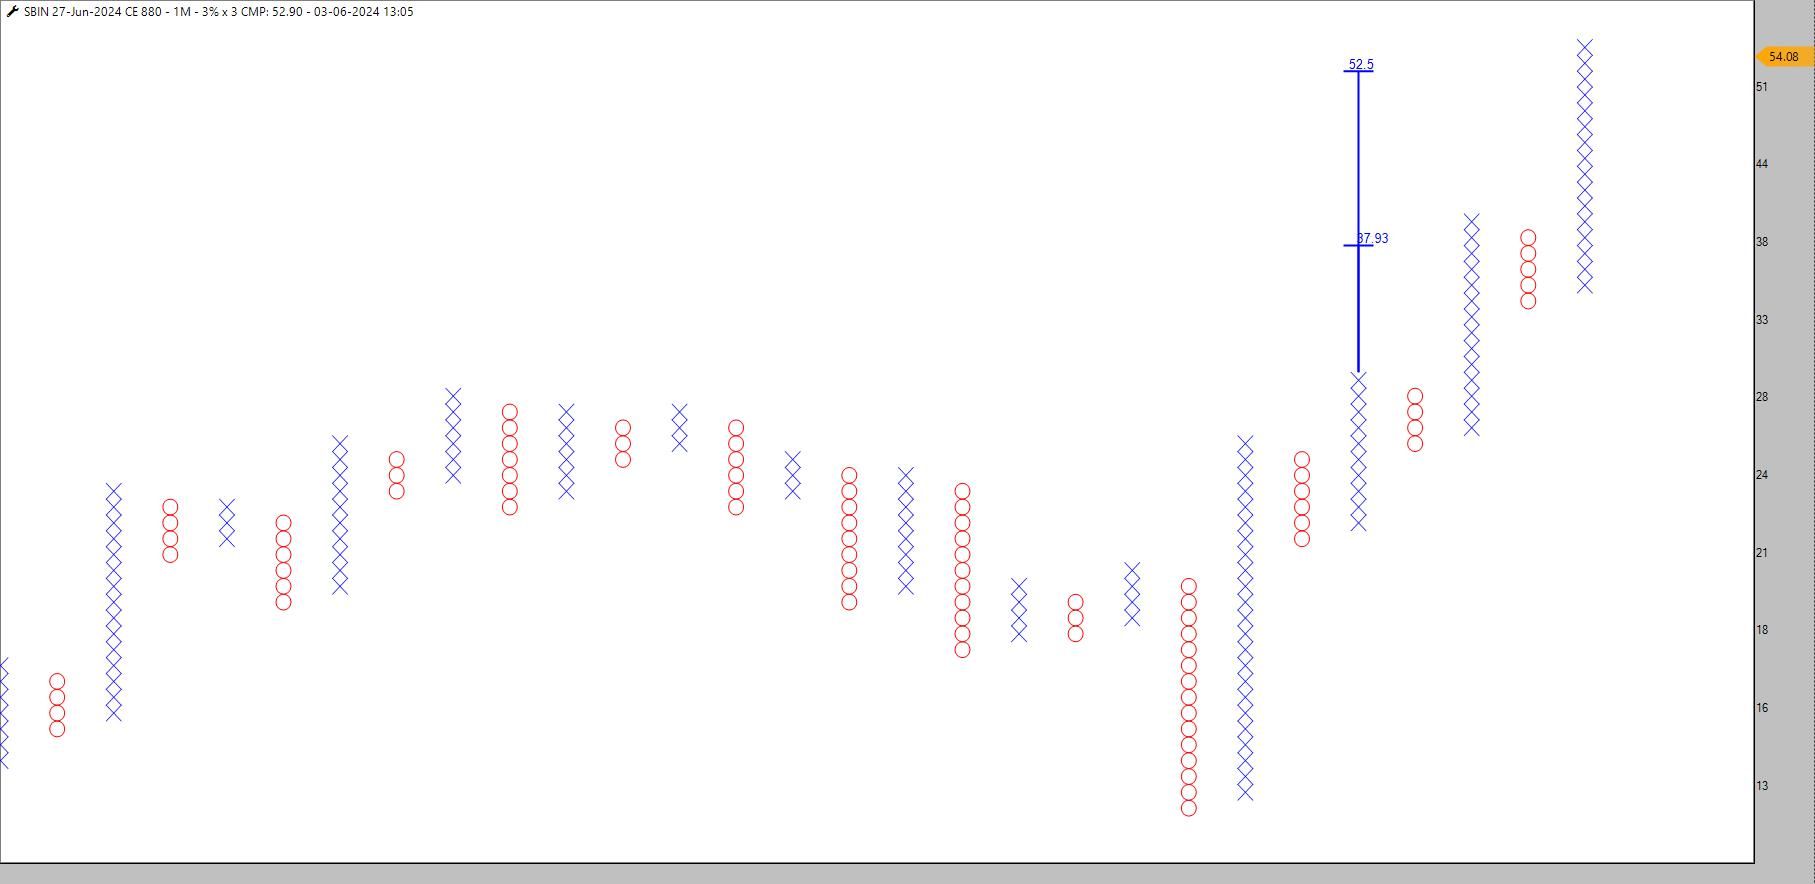
SBIN 880CE - Breakout and Follow-up
Reliance - Bullish Flag
Do You Chase the Gap-Up Opening Markets?
SBIN 880CE - Breakout and Follow-up
SBIN 880CE - Breakout and Follow-up
Bullish Stocks on Radar
Do You Chase the Gap-Up Opening Markets?
Bullish Stocks on Radar
Hindalco - Bullish Cup & Handle
Glenmark 1160CE June - Breakout ABV 95
Glenmark 1160CE June - Breakout ABV 95
Tata Motors - Bullish Harmonic
Glenmark 1160CE June - Breakout ABV 95
Nifty Bullish Harmonic
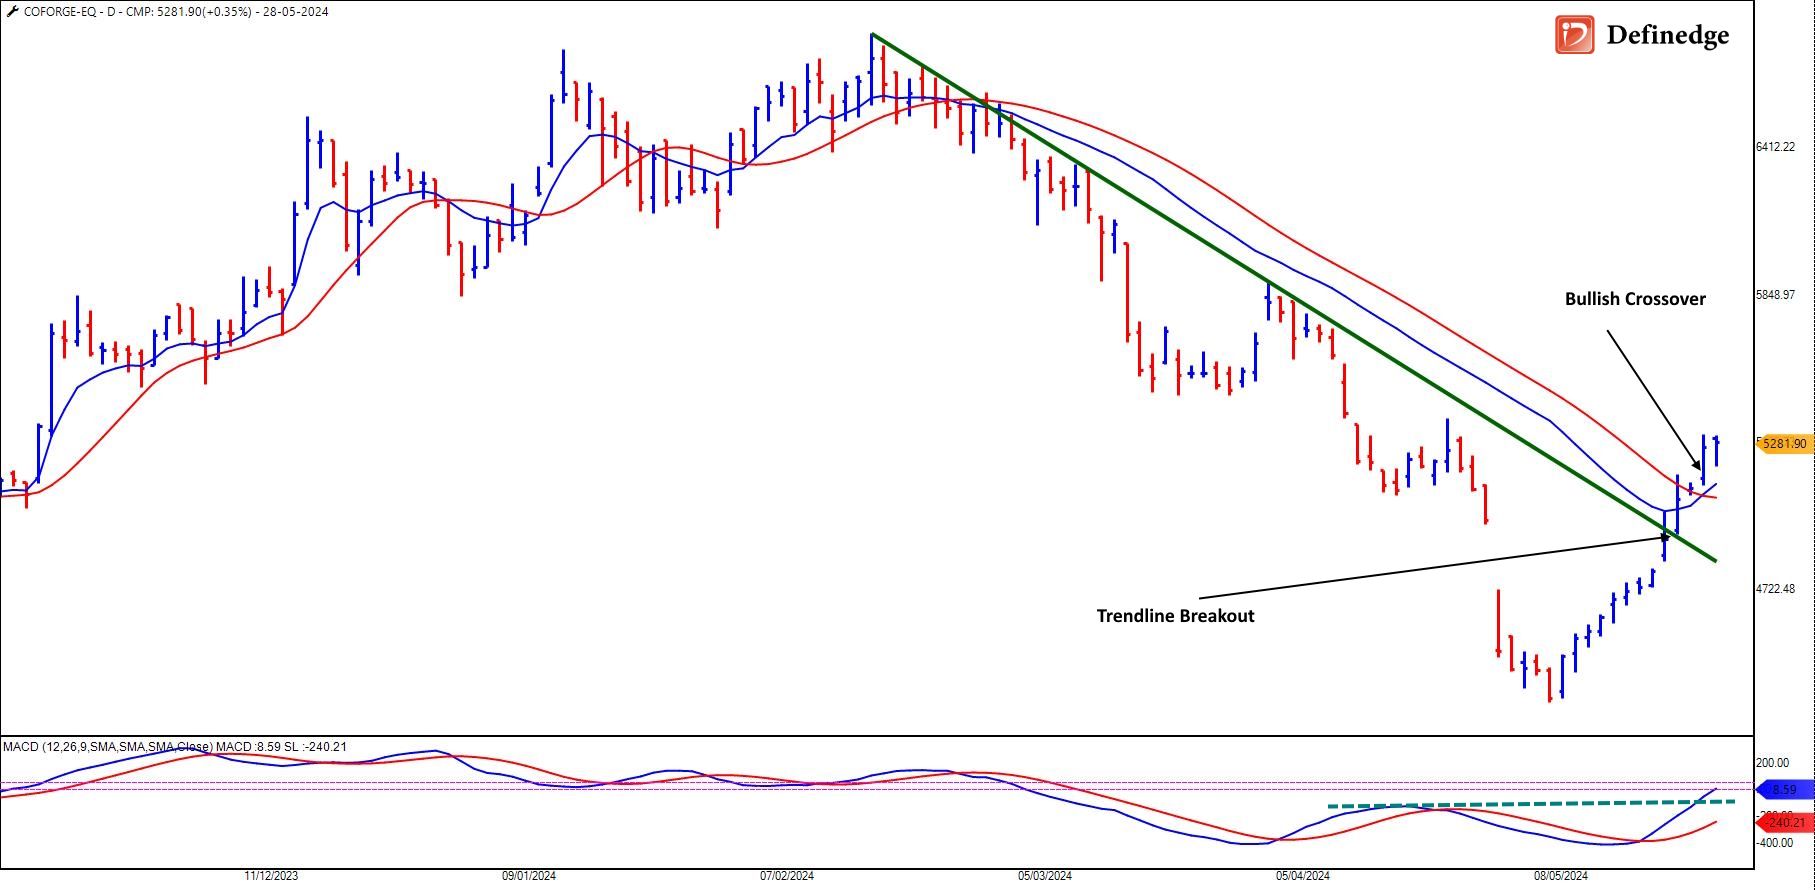
Coforge
PVR Inox - Bullish Harmonic
RSI Indicator Signals Only 50% Stocks Are in Positive Trend
Amara Raja Battery - Multi-Year Breakout {You Can't Miss It!}
Amara Raja Battery - Multi-Year Breakout {You Can't Miss It!}

Laidback Strategy - Stock List
HUL - Breakout ABV 2390-2400 Zone {Bullish Harmonic}
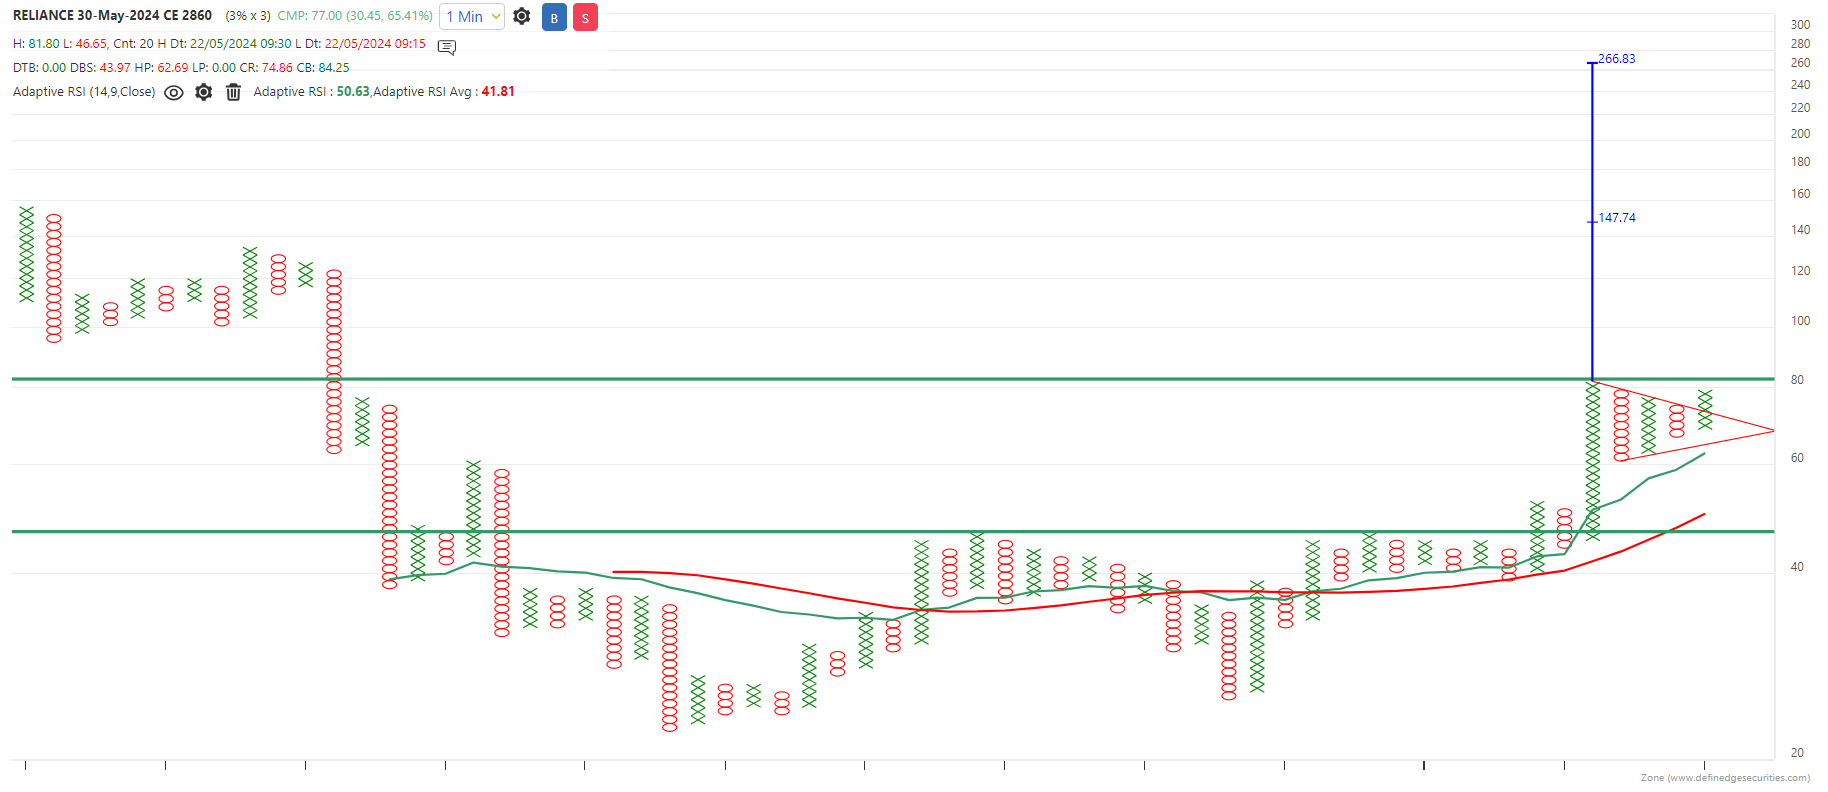
Reliance 2860CE - Breakout ABOVE 85
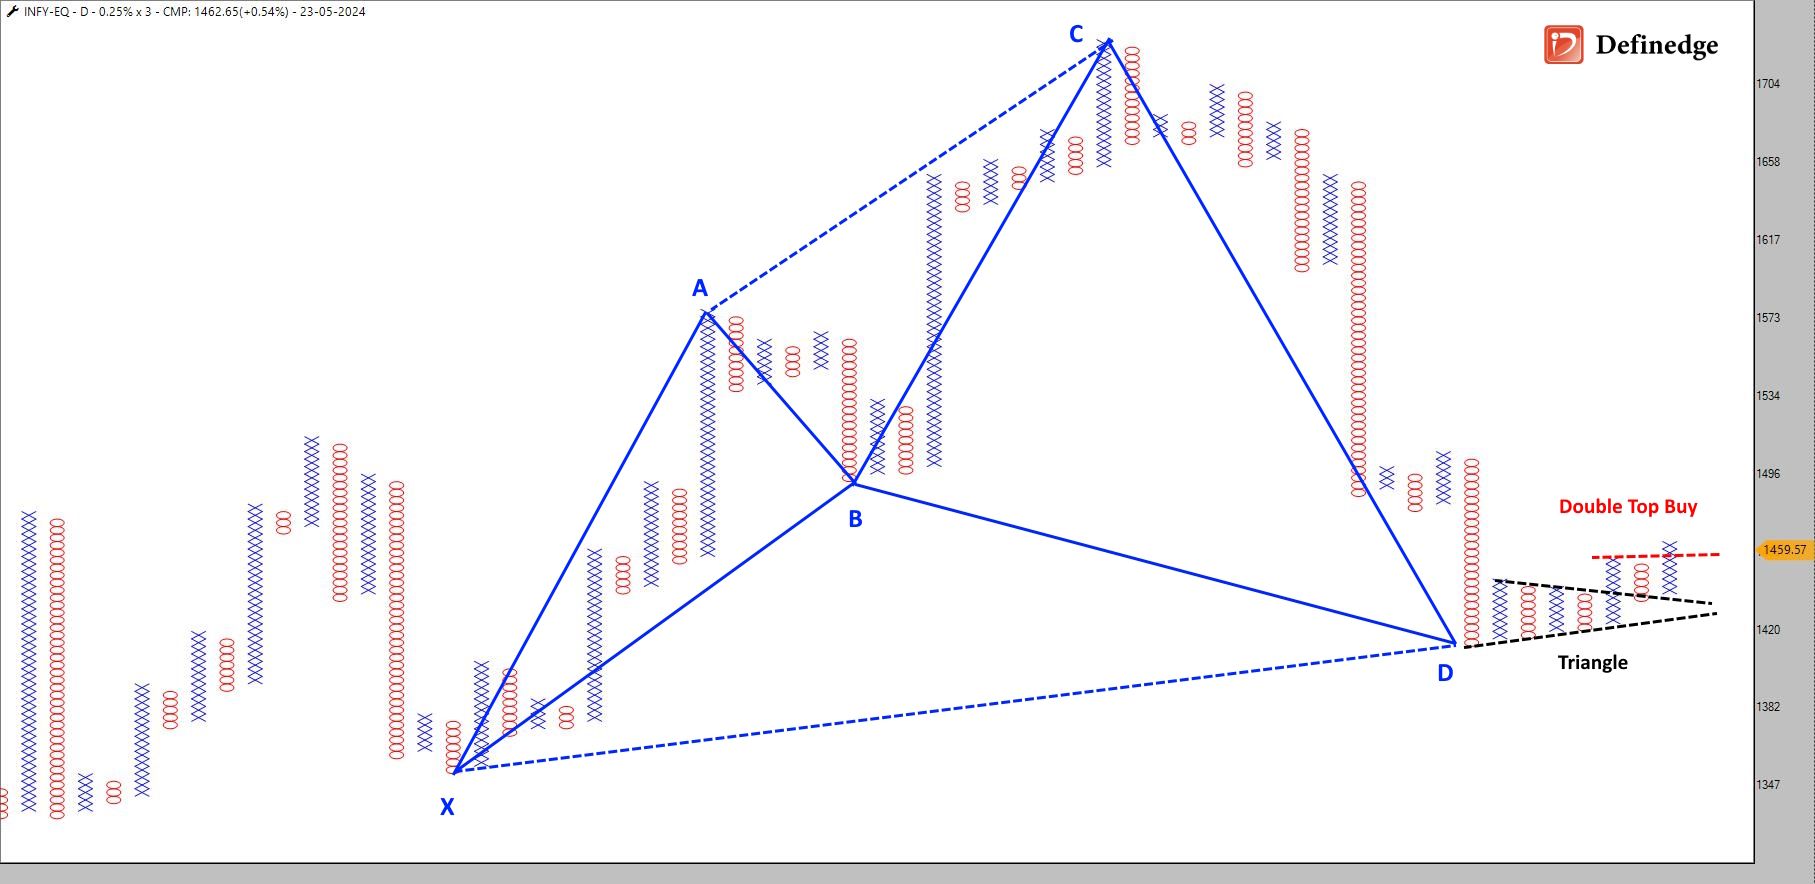
Infosys - Bullish Harmonic
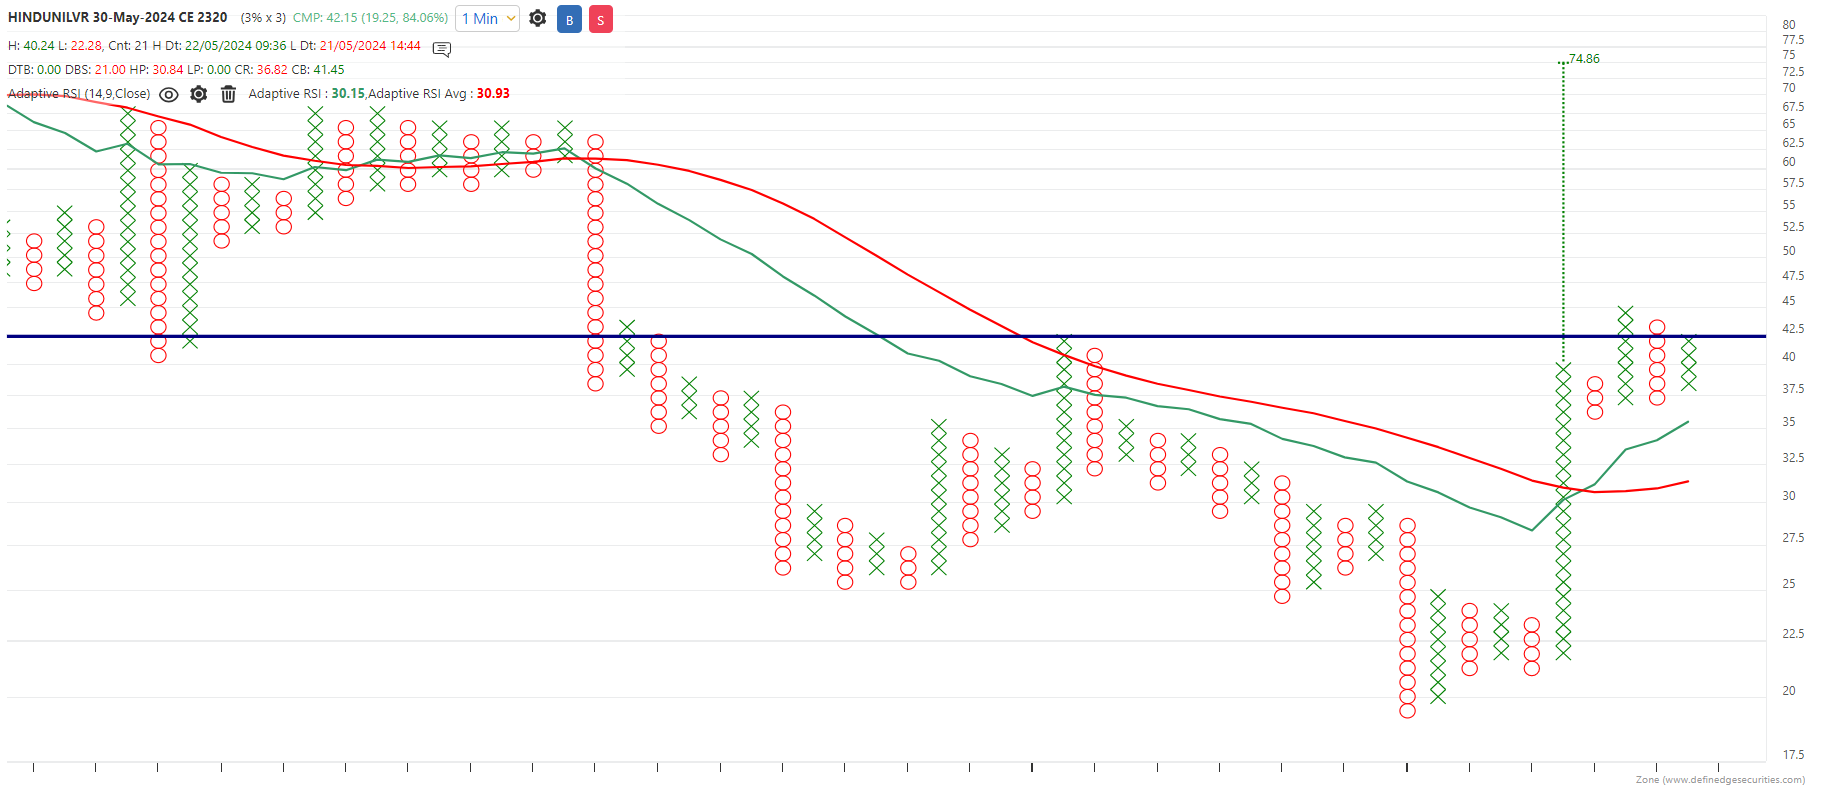
HindUnilvr 2320CE
HindUnilvr 2320CE
Reliance 2860CE - Breakout ABOVE 85
HindUnilvr 2320CE
HindUnilvr 2320CE
HindUnilvr 2320CE
HindUnilvr 2320CE
HindUnilvr 2320CE
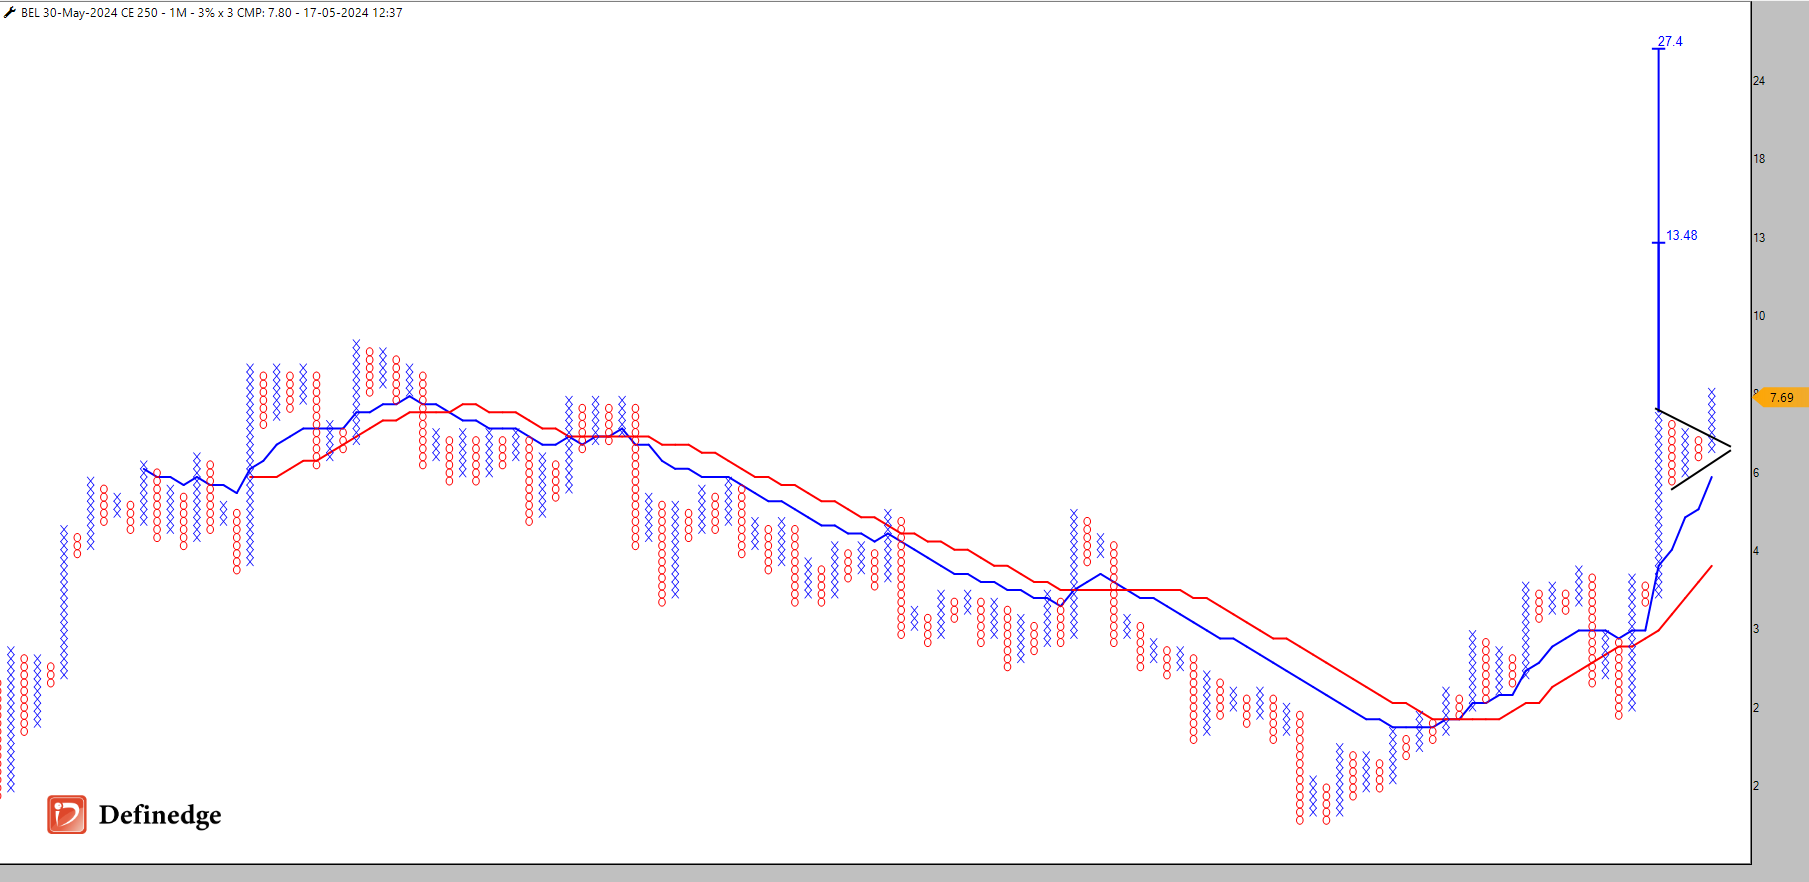
BEL 250CE
Is this "The Sector of 2024"?
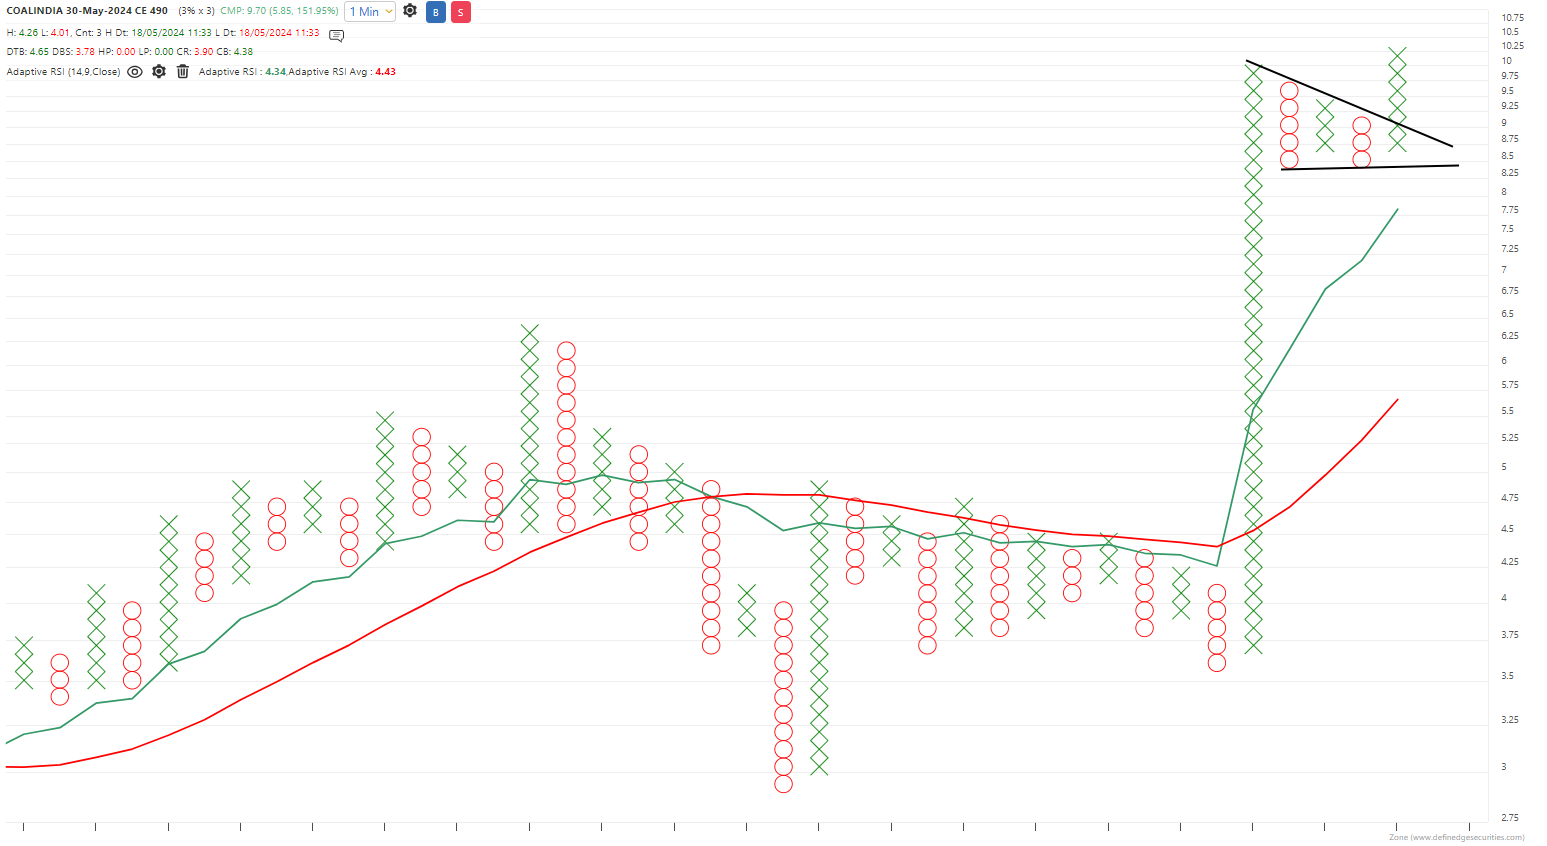
CoalIndia 490CE
Laidback Strategy - Stock List
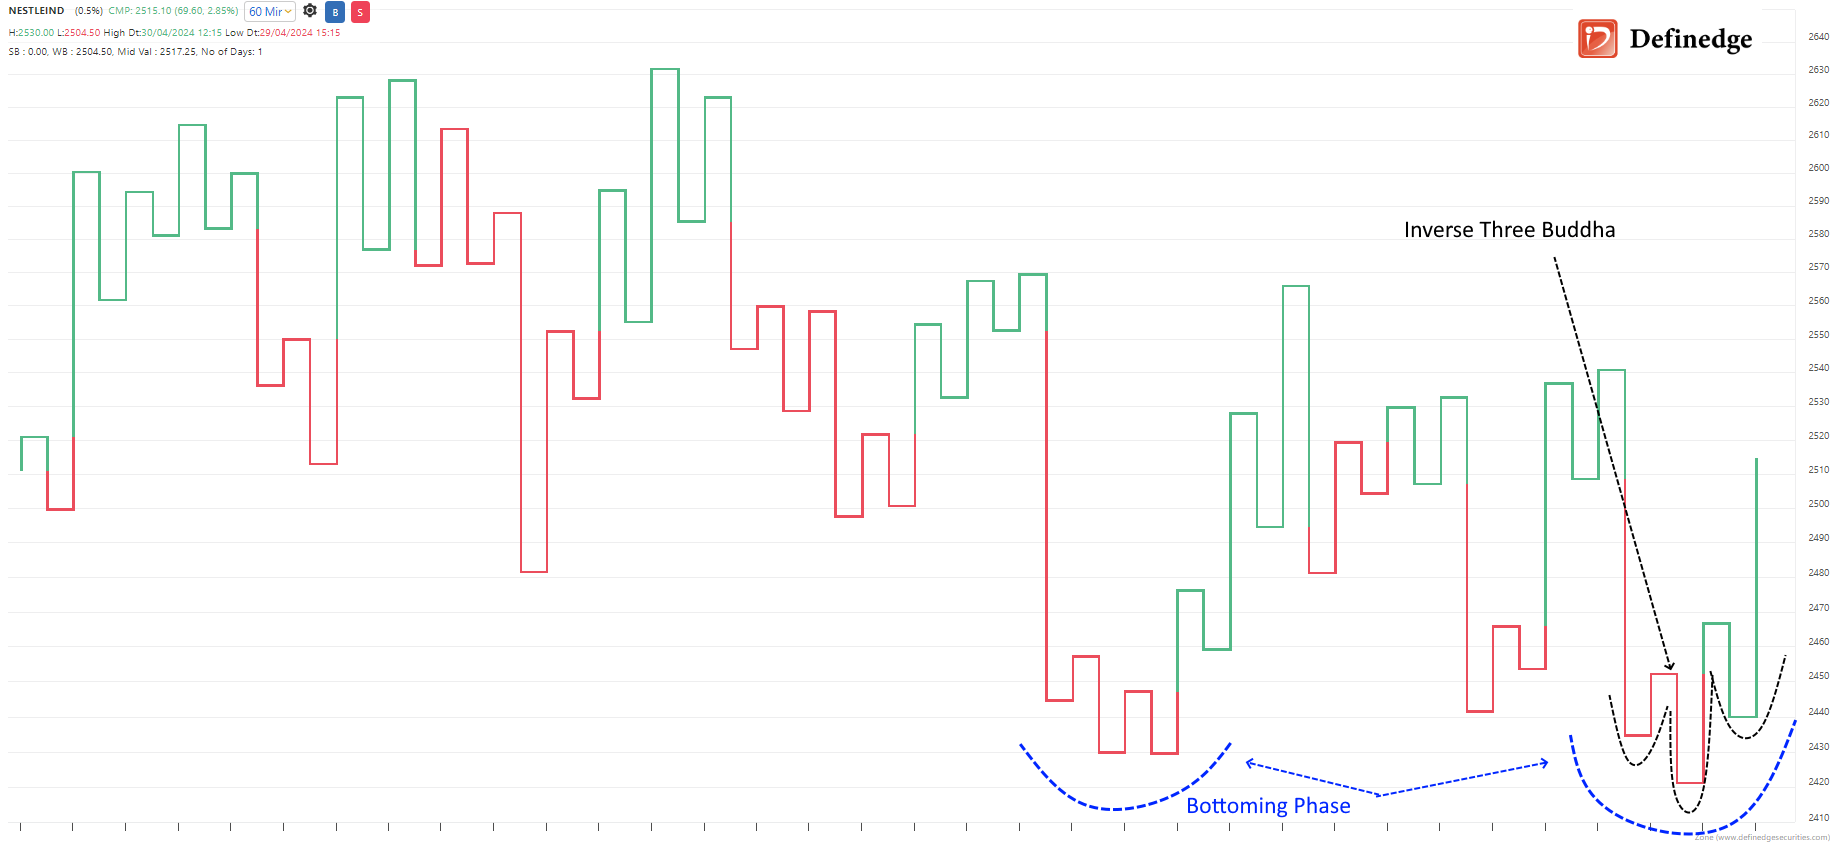
Nestle India - Inverse Three Buddha Bullish Kagi Pattern
BEL 250CE
Bank Nifty - Are You Ready Bulls?
IT Stocks - Bullish Chart Setups
The Bears are Trapped - Stock Watchlist
Adani Ports - Bullish Gartley
Adani Ports - Bullish Gartley
Bullish Stocks on Radar
Laidback Strategy - Stock List
Nifty - Bullish Bat Harmonic Pattern
Adani Ports - Bullish Gartley
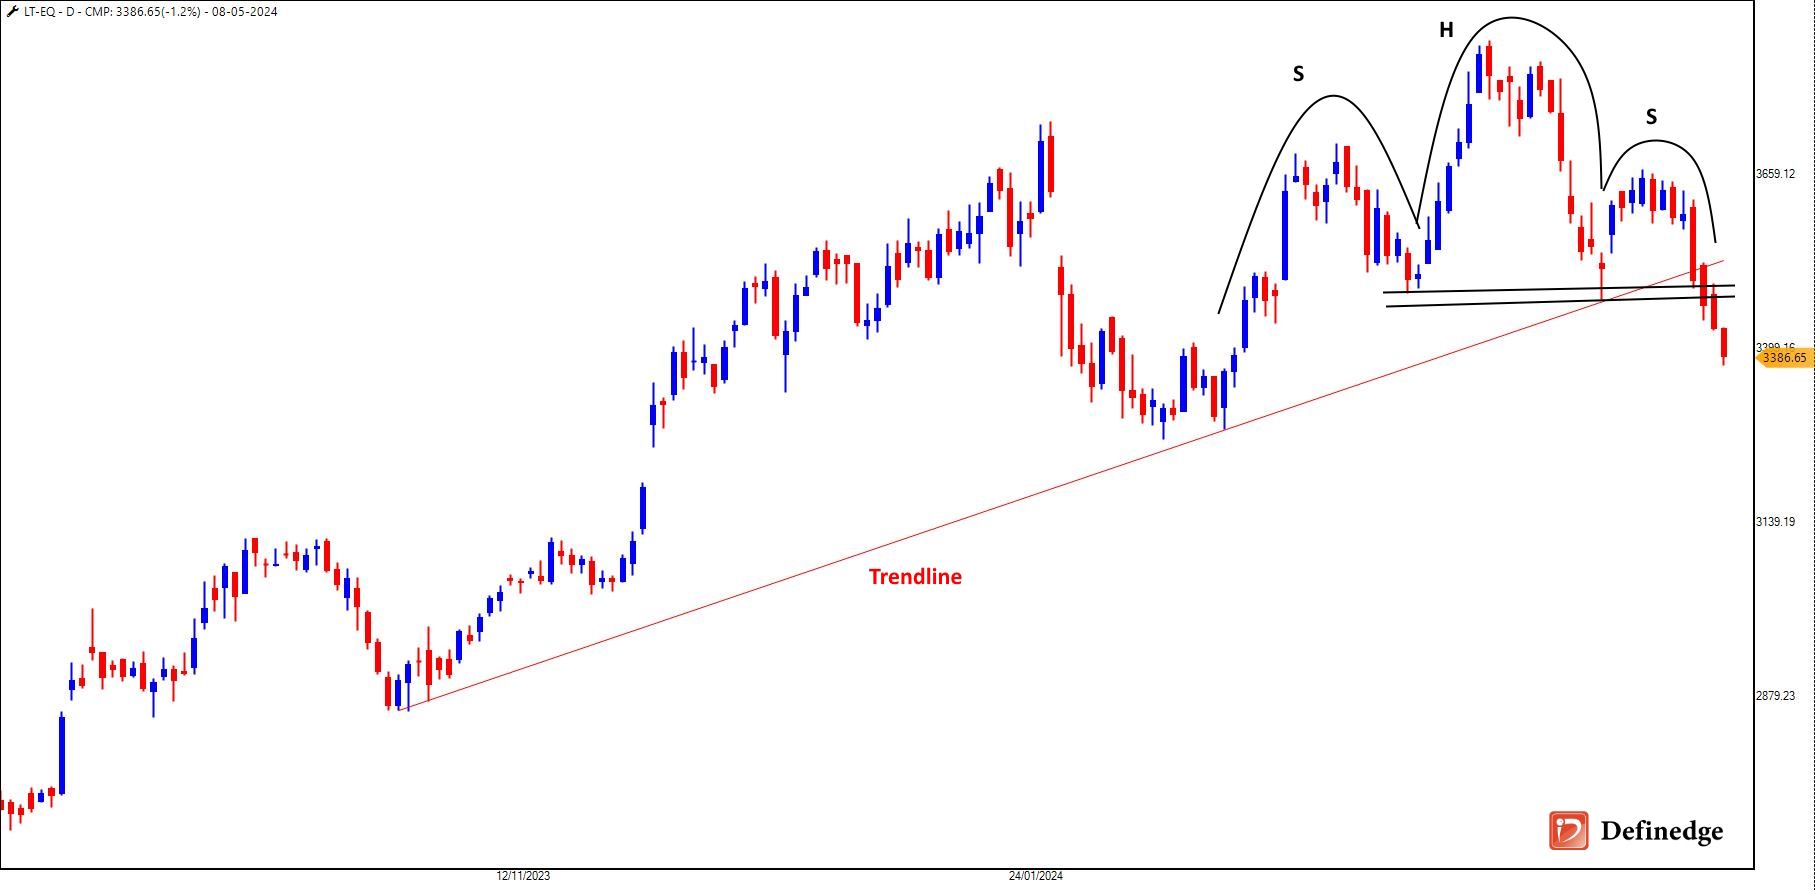
LT - Head & Shoulders {Bearish Pattern}
The Unstoppable Performance of Mutual Funds
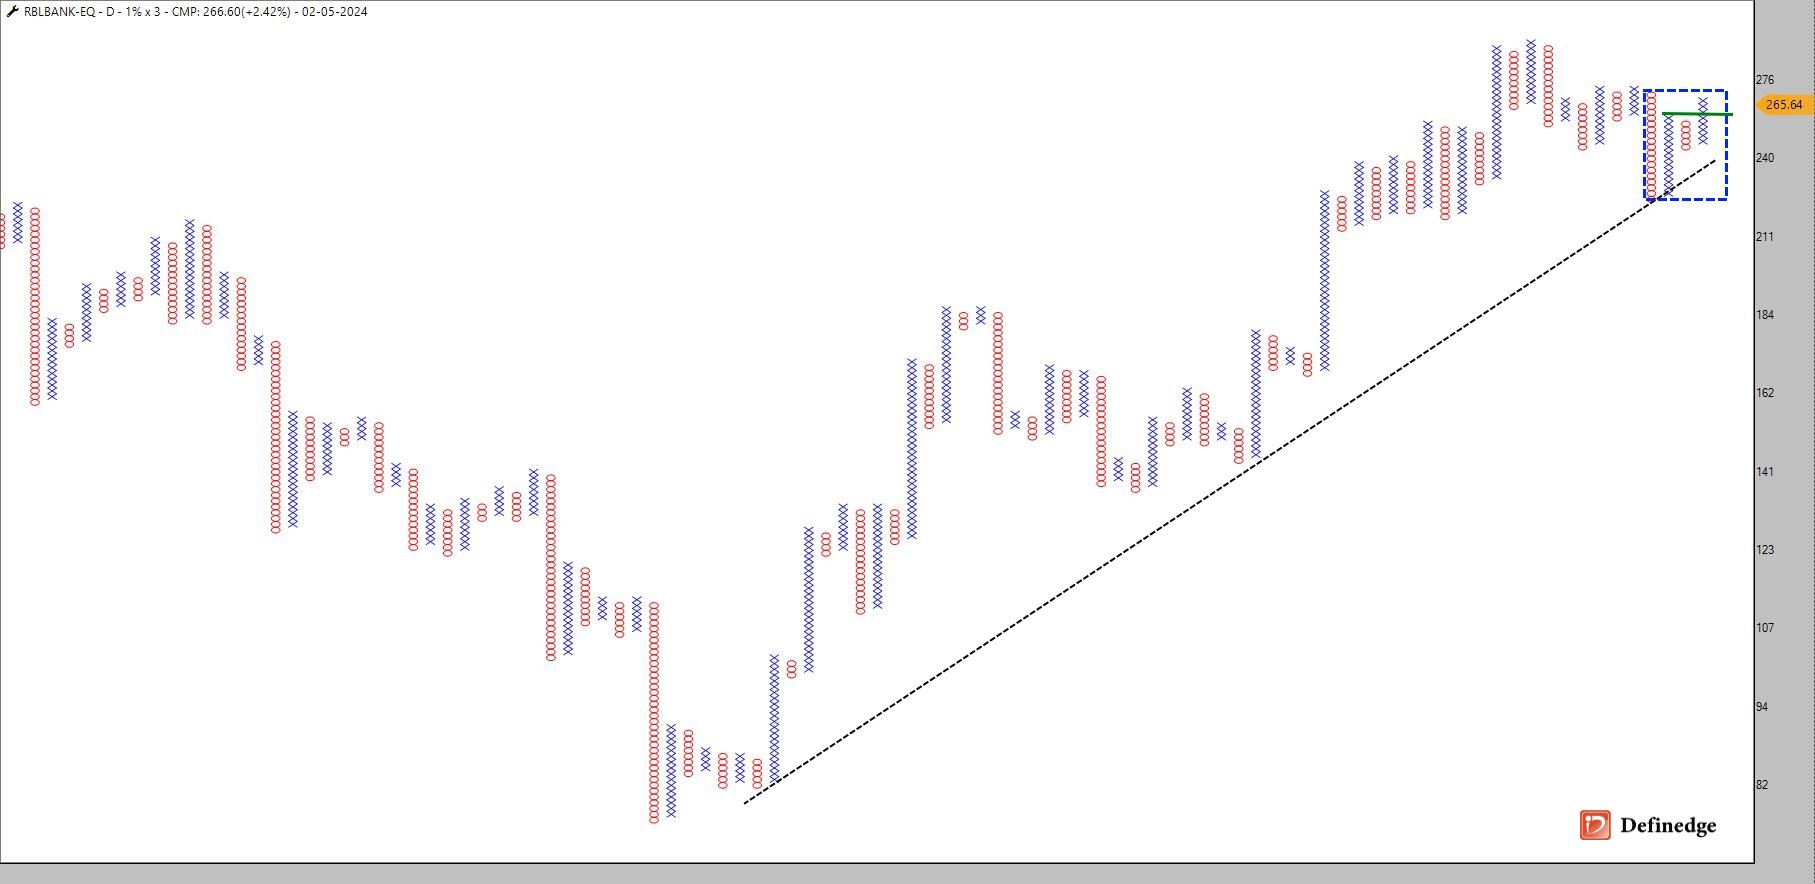
RBL Bank -- Breakout ABV 275
BPCL chart mismatch in RZone and TradePoint Desktop
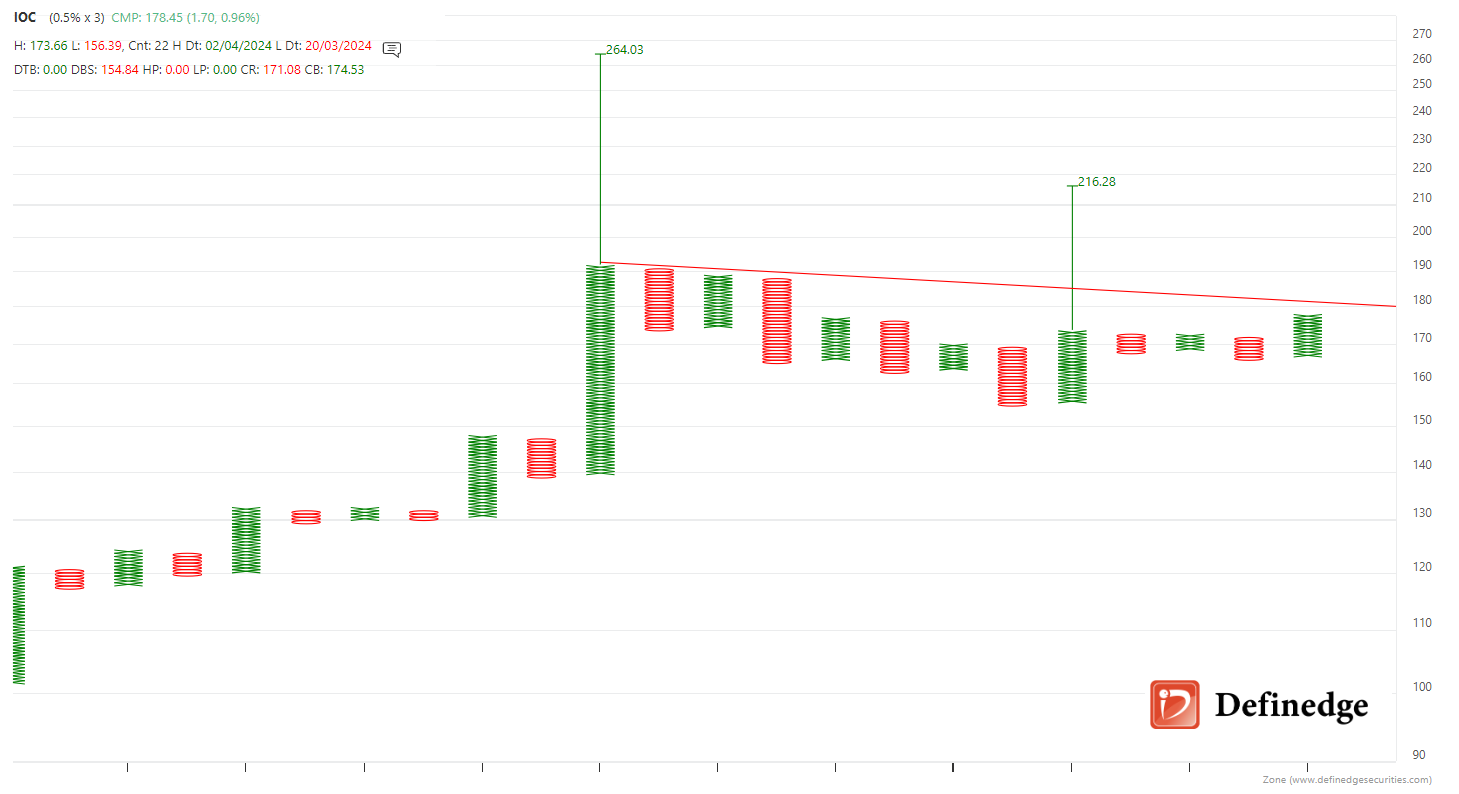
IOC - 45 Degree TL Breakout ABOVE 182
Laidback Strategy - Stock List
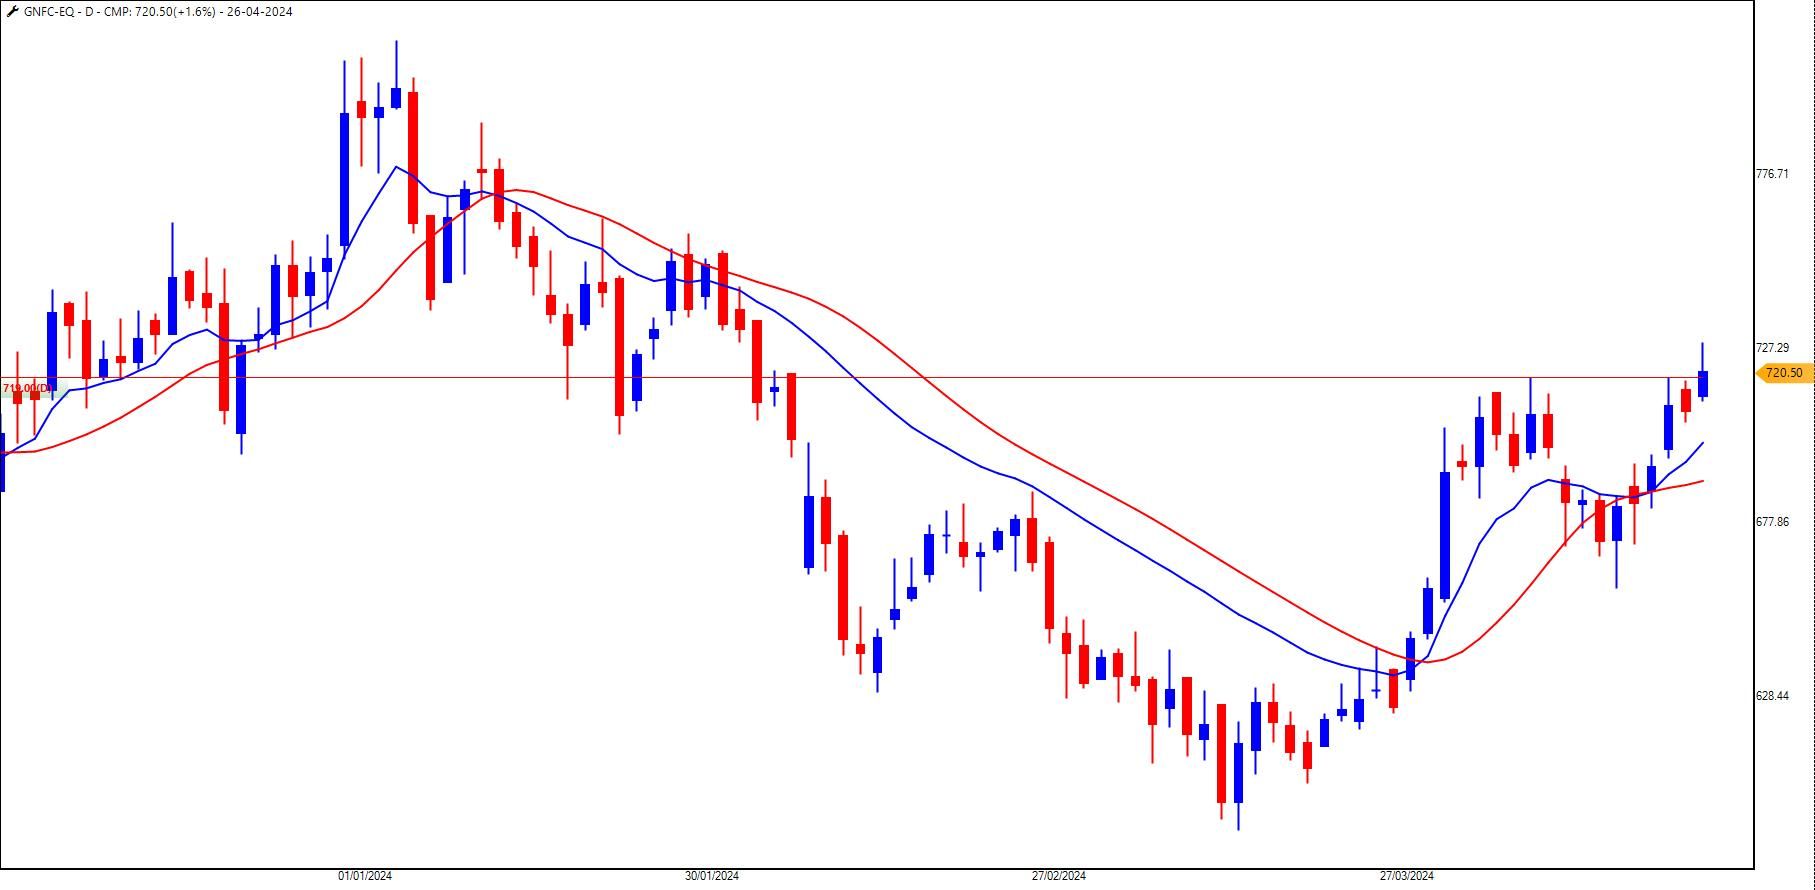
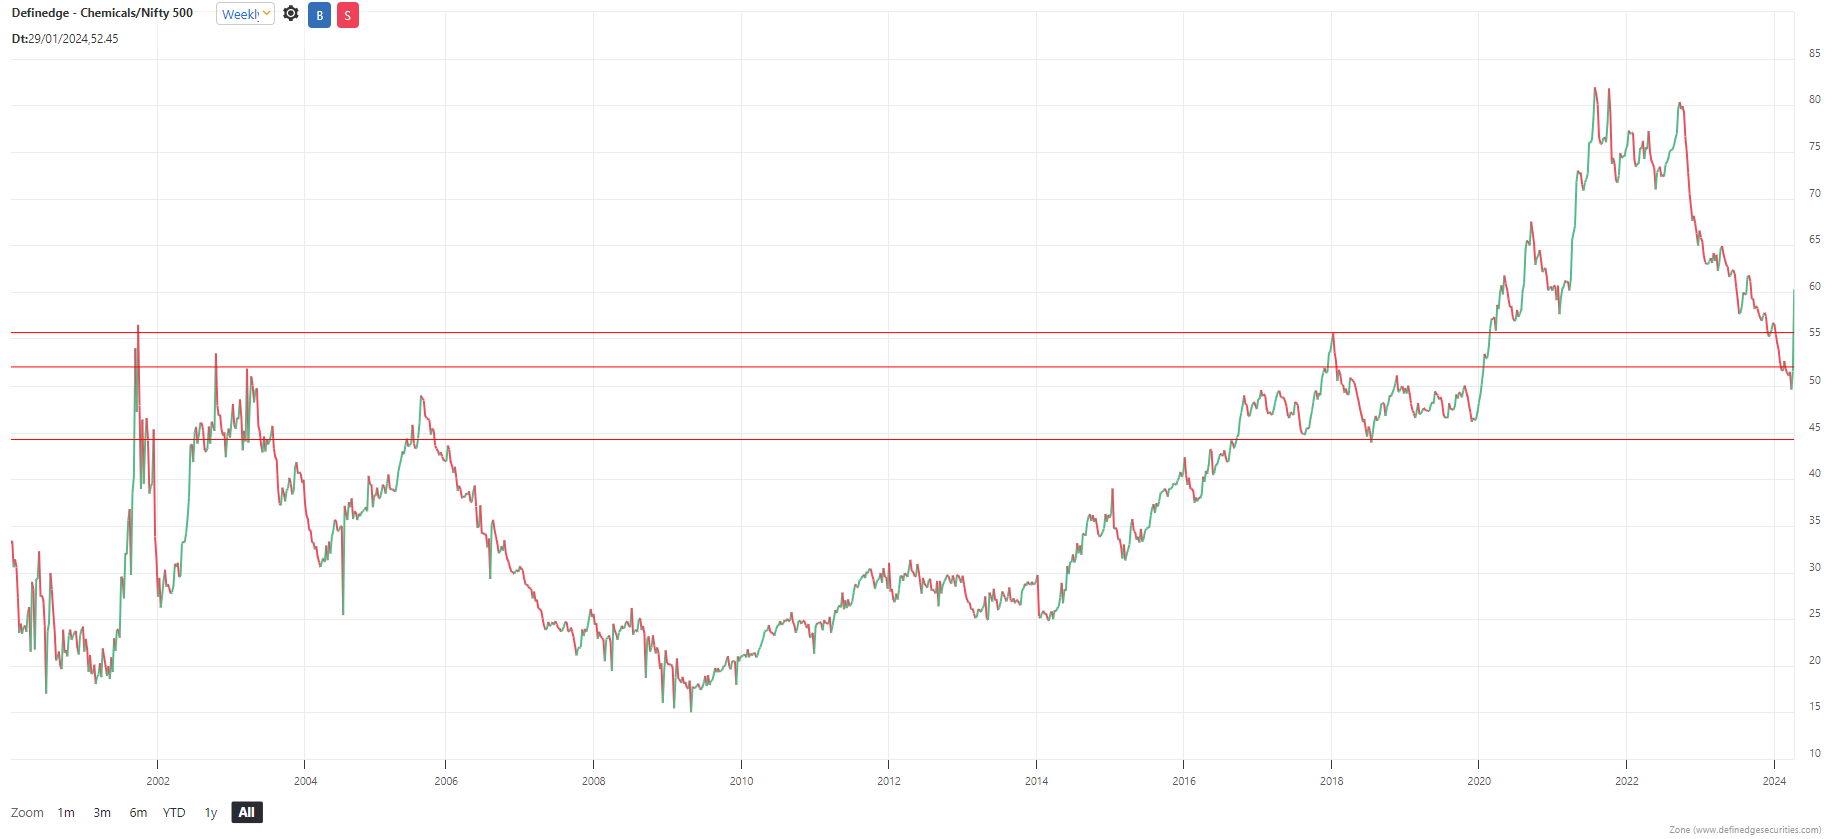
GNFC - Gearing Up for Another Run
Nifty PSU Bank
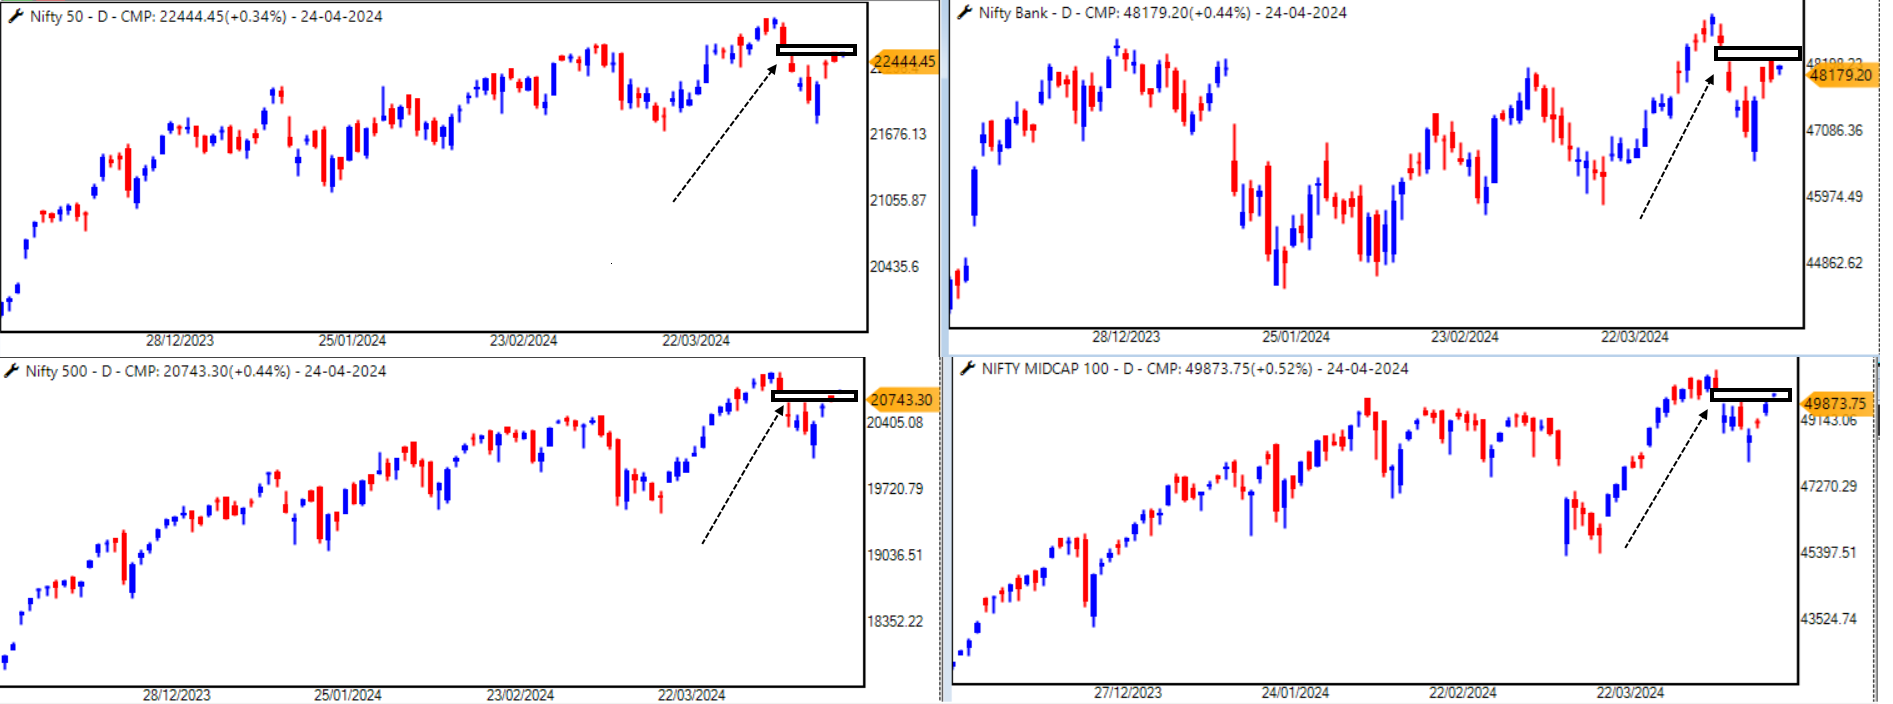
Bulls need to cross these Valleys
Bulls need to cross these Valleys
Announcing Harmonic Trading Course
Bank Nifty - Do-or-Die @ 46,500 for Bulls
Nifty - Do-or-Die at 22,000
HDFCBANK - Should You Buy the Dip?
Red Carpet - When was the last time you saw this?
Focus on this Sector Now!
Bank Nifty - At Make-or-Break Levels
Laidback Strategy - Stock List
DONSHI - An Investment Strategy
RBL Bank - Bullish Gartley
Laidback Strategy - Stock List
Infy - Do - or -Die
Laidback Strategy - Stock List
Ask Me About Moving Average or Moving Average Channel
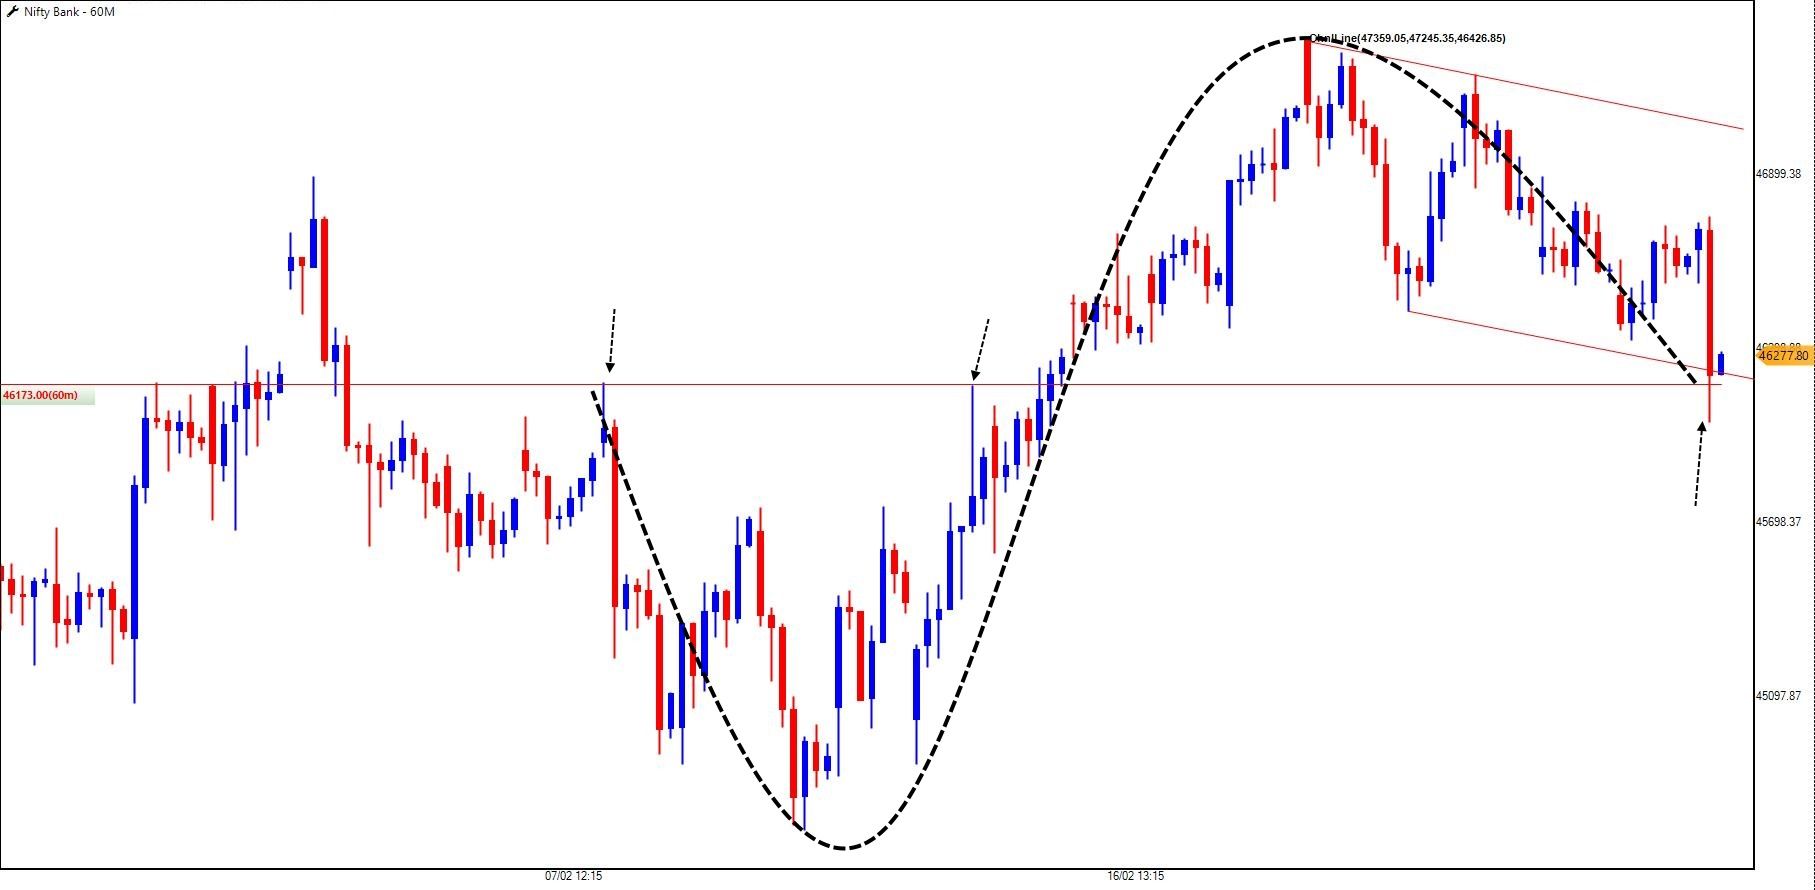
Bank Nifty - Awaiting Range Breakout of 46,500-46,900
Nifty - Bulls unable to Break Moving Average Channel
RBL Bank - Bullish Gartley
GOLDBEES-Breakout
Reliance - Bullish Harmonic
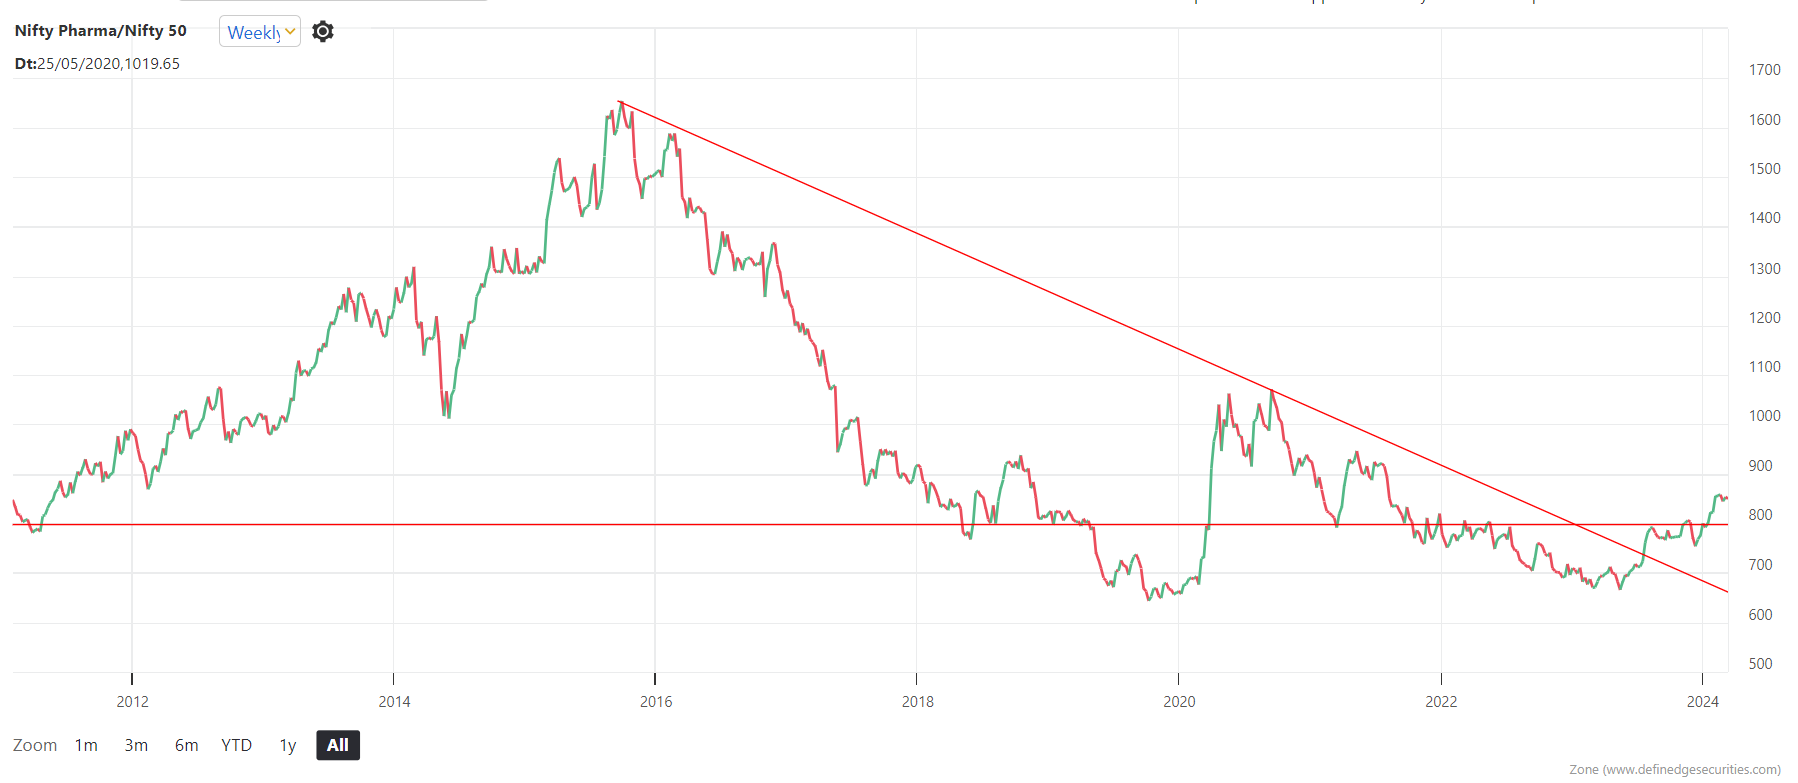
Nifty Pharma - The Next Bull?
Laidback Strategy - Stock List
Stock Market Crash 2024 Coming to India? | Nifty | Midcap Stocks | Definedge Securities | Brijesh B
RBL Bank - Bullish Gartley
Bank Nifty - Bullish Harmonic
Bank Nifty - Bullish Harmonic
Will HDFC Bank Repeat Its Glory Days? #Fractal
Nifty - Multiple Bullish Harmonic Patterns
Large Caps - The Next Big Thing?
Nifty IT Index - The Bullish Pattern at Demand Zone
Large Caps - The Next Big Thing?
Nifty IT Index - The Bullish Pattern at Demand Zone
Laidback Strategy - Stock List
DONSHI - An Investment Strategy
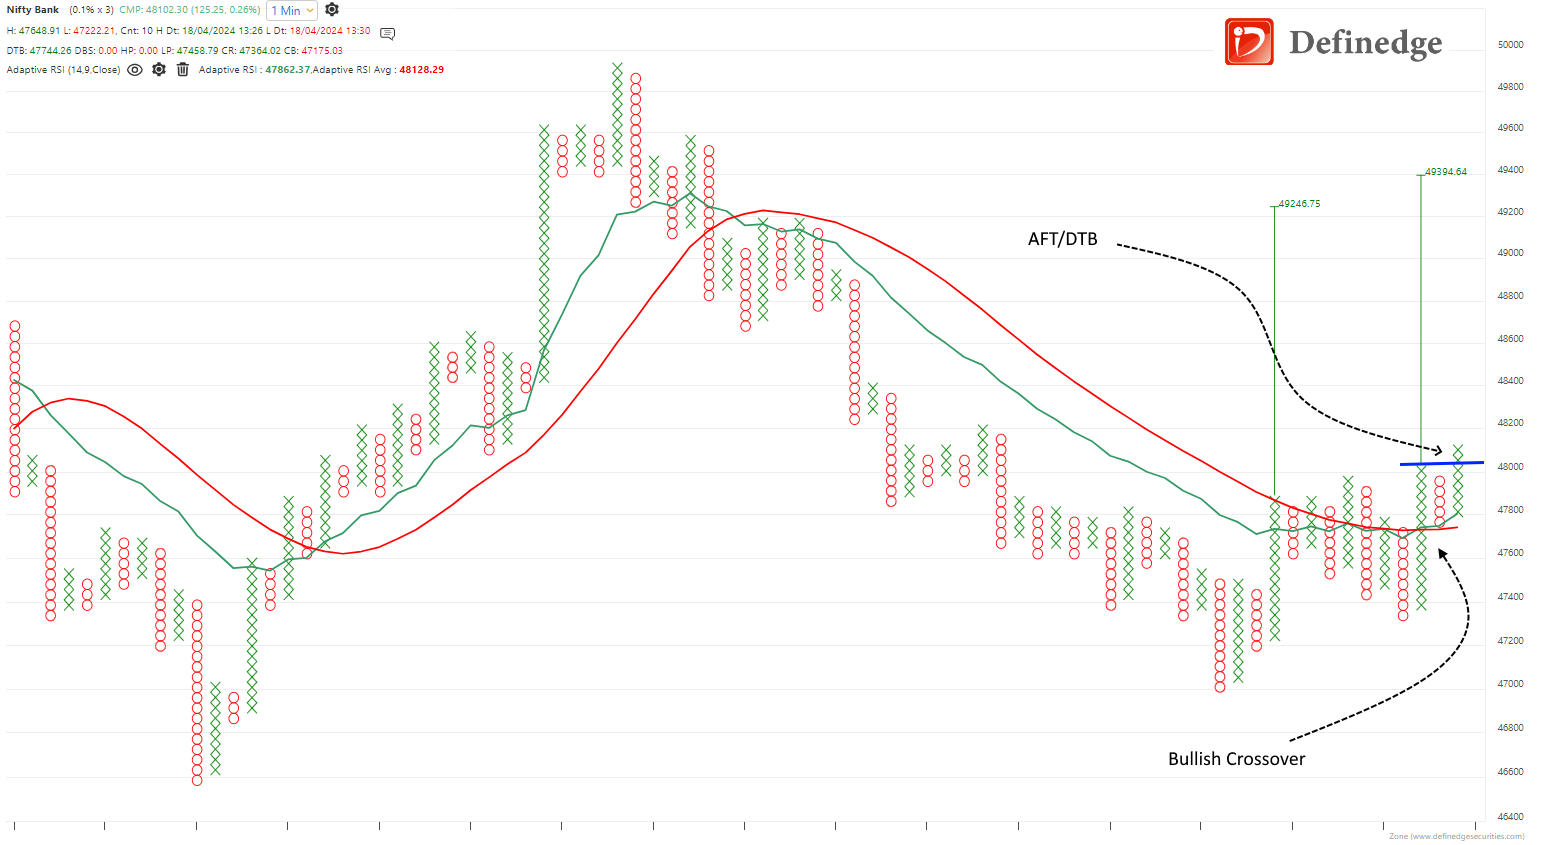
BankNifty - Expect Some Fireworks Above 48,200 {CMP-47,970}
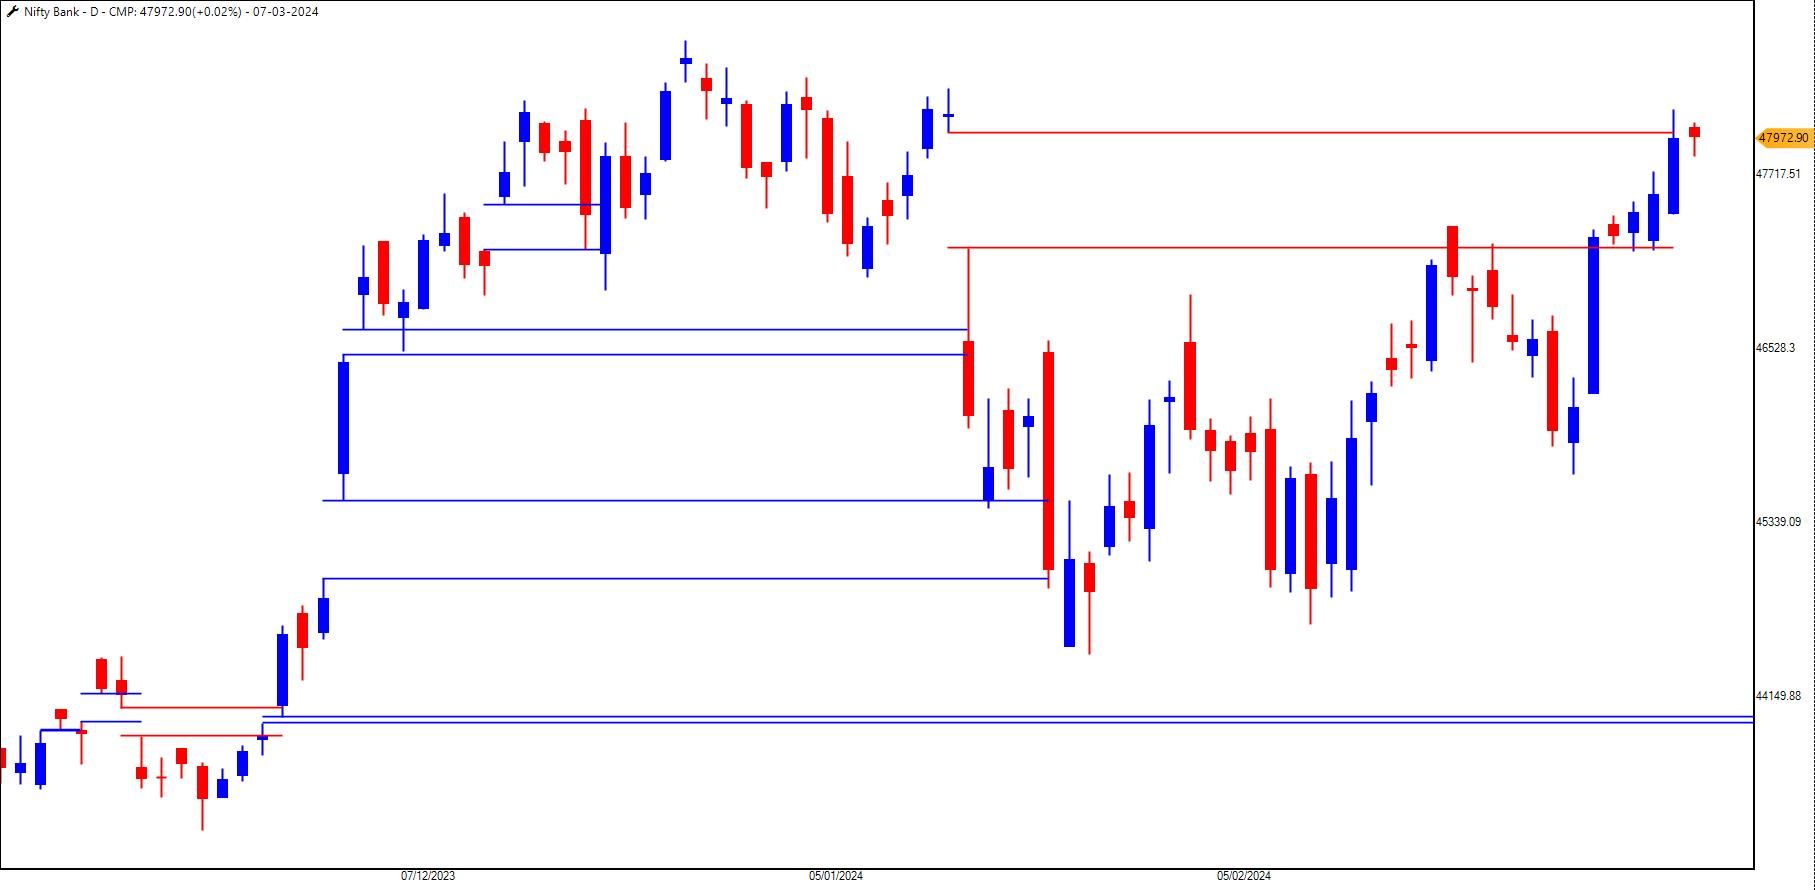
Bank Nifty - 46,000 Will be Decider
FMCG Sector - On the Verge of Breakout
You Can Script the System but Not a Trade
Bank Nifty - Stochastic Positive Divergence
Bank Nifty - Stochastic Positive Divergence
Laidback Strategy - Stock List
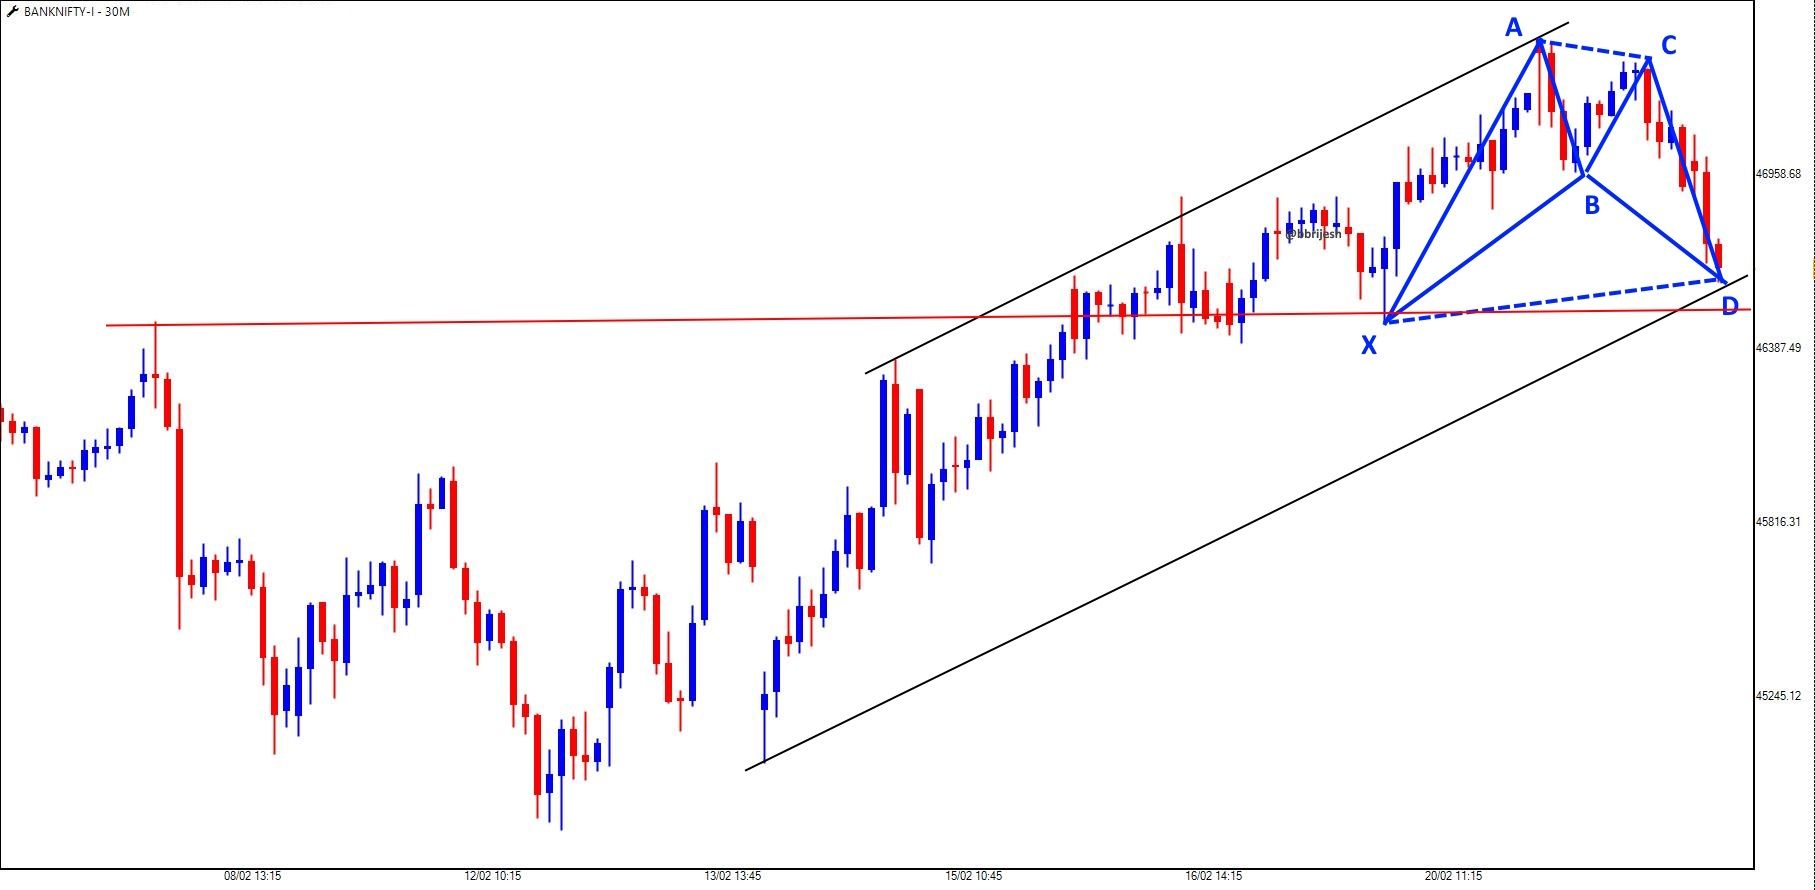
Bank Nifty - Bullish Harmonic {Pattern Negates Below 46,400}
FMCG Sector - On the Verge of Breakout
Nifty Bulls - It's Now or Never
Laidback Strategy - Stock List
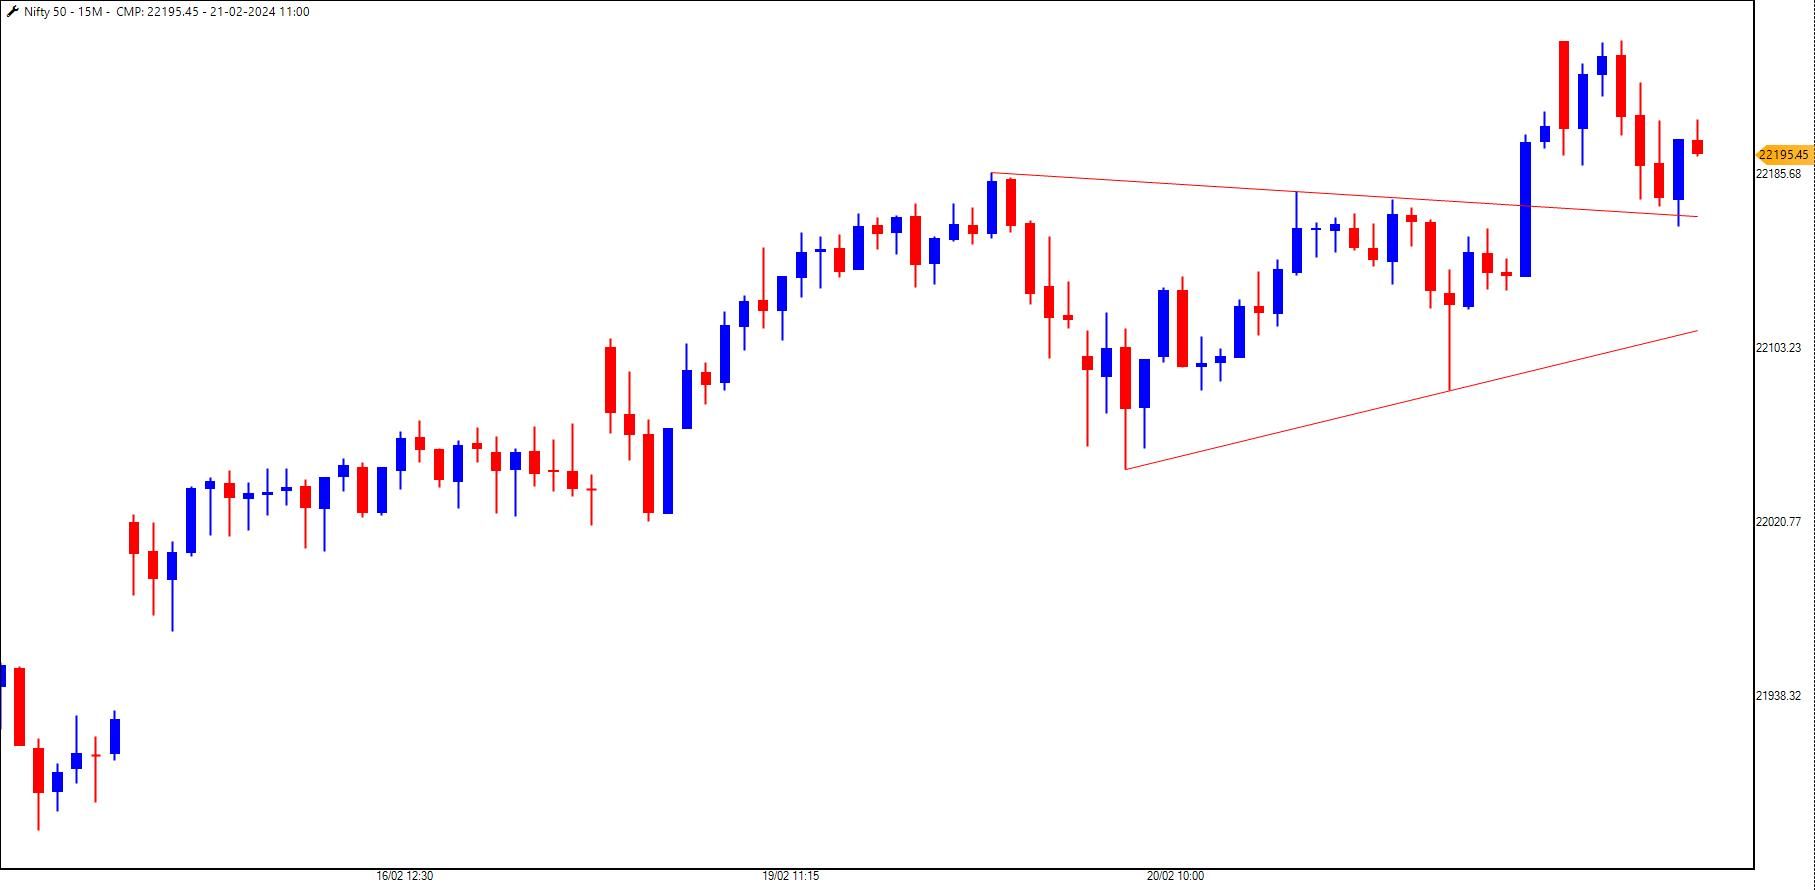
Nifty - Triangle Pattern
Nifty EQW @ ATH
Are You an ADROIT Trader?
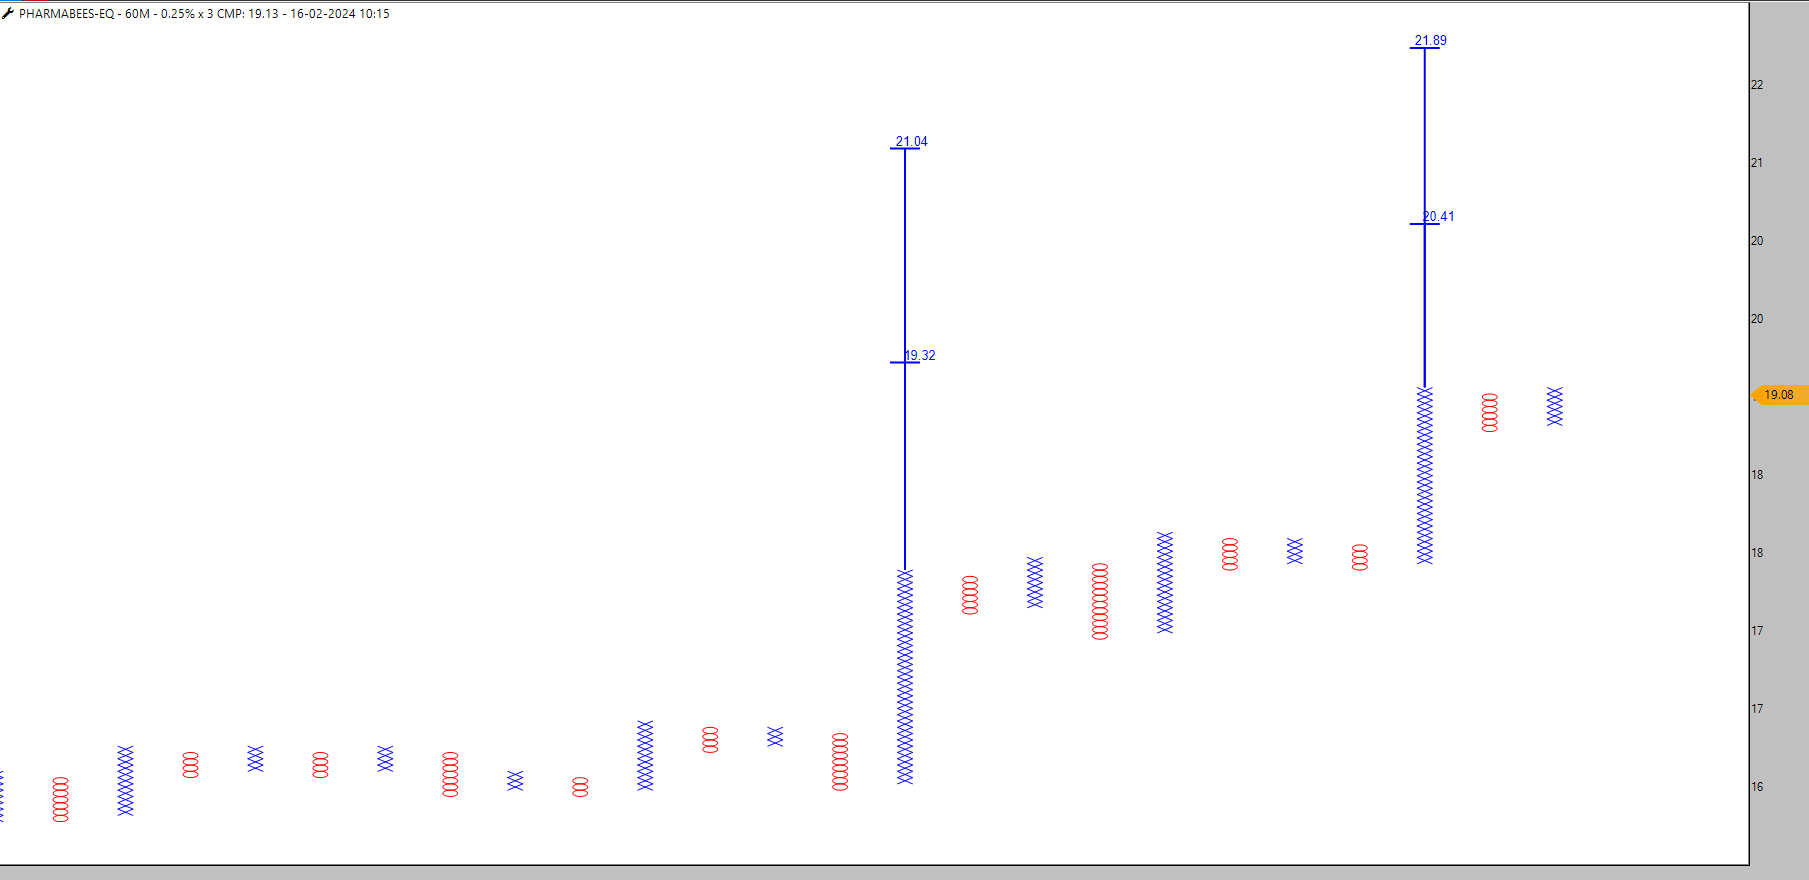
Pharma Bees - DTB
Investing in Mutual Fund {Video}
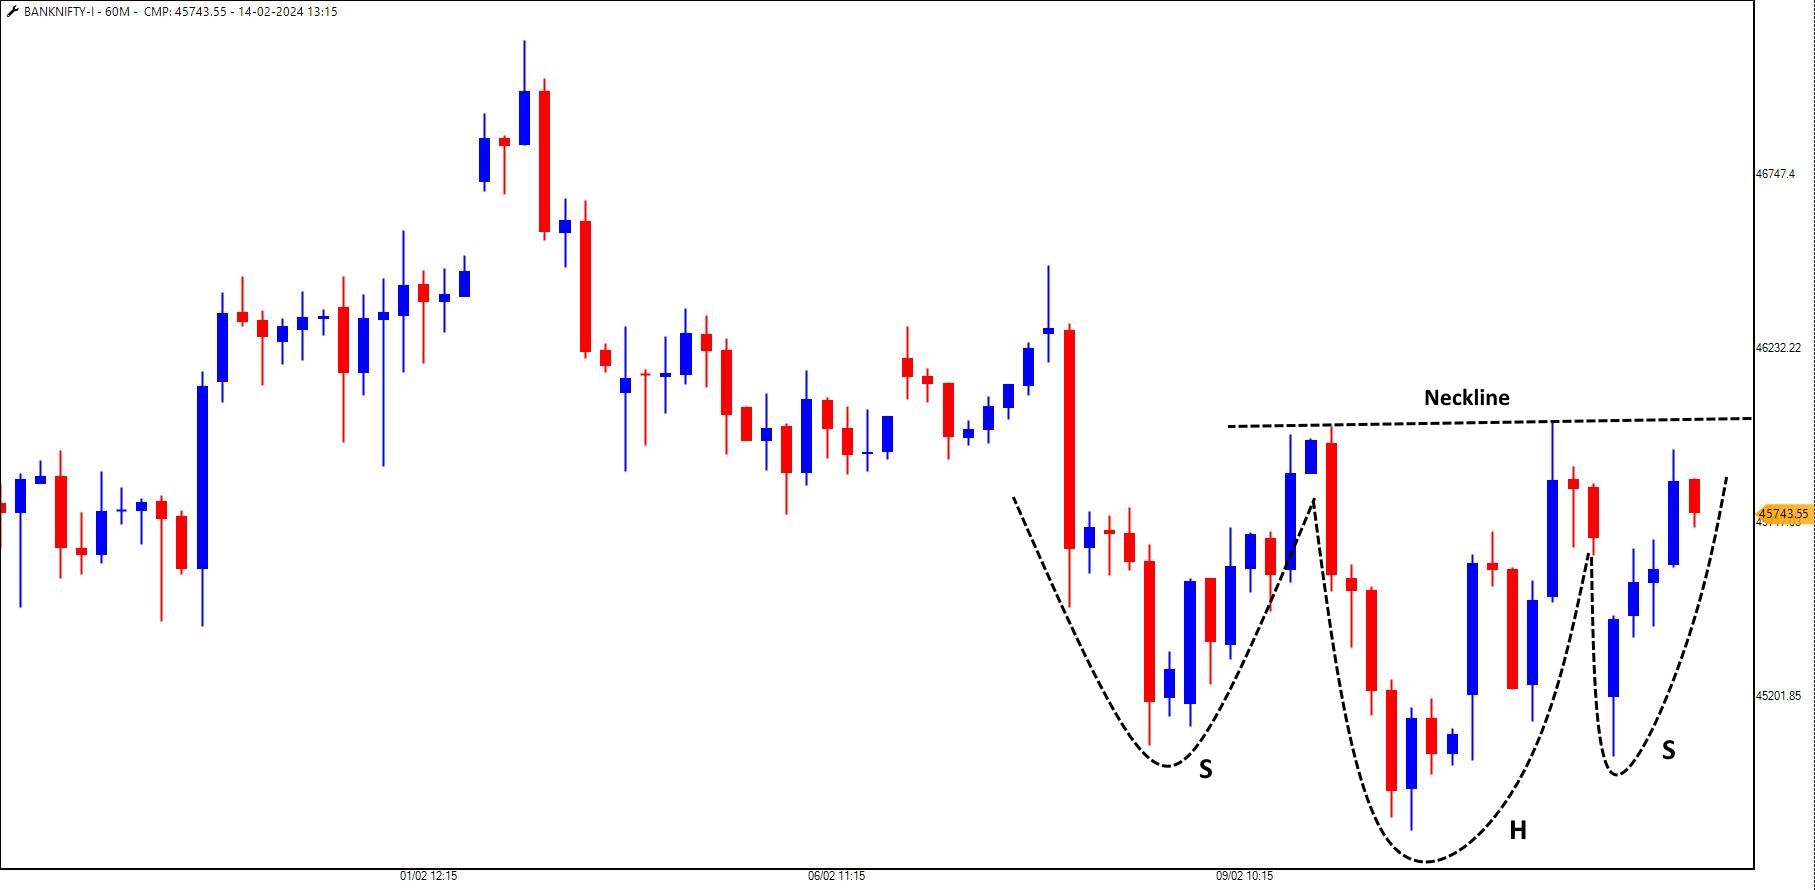
BankNifty (Futures) - Bullish H&S ABOVE 46,100
Valentine's Day for Traders
Trividh Strategy - Apollo Hosp
Trividh Strategy - Apollo Hosp
Trividh Strategy - Apollo Hosp
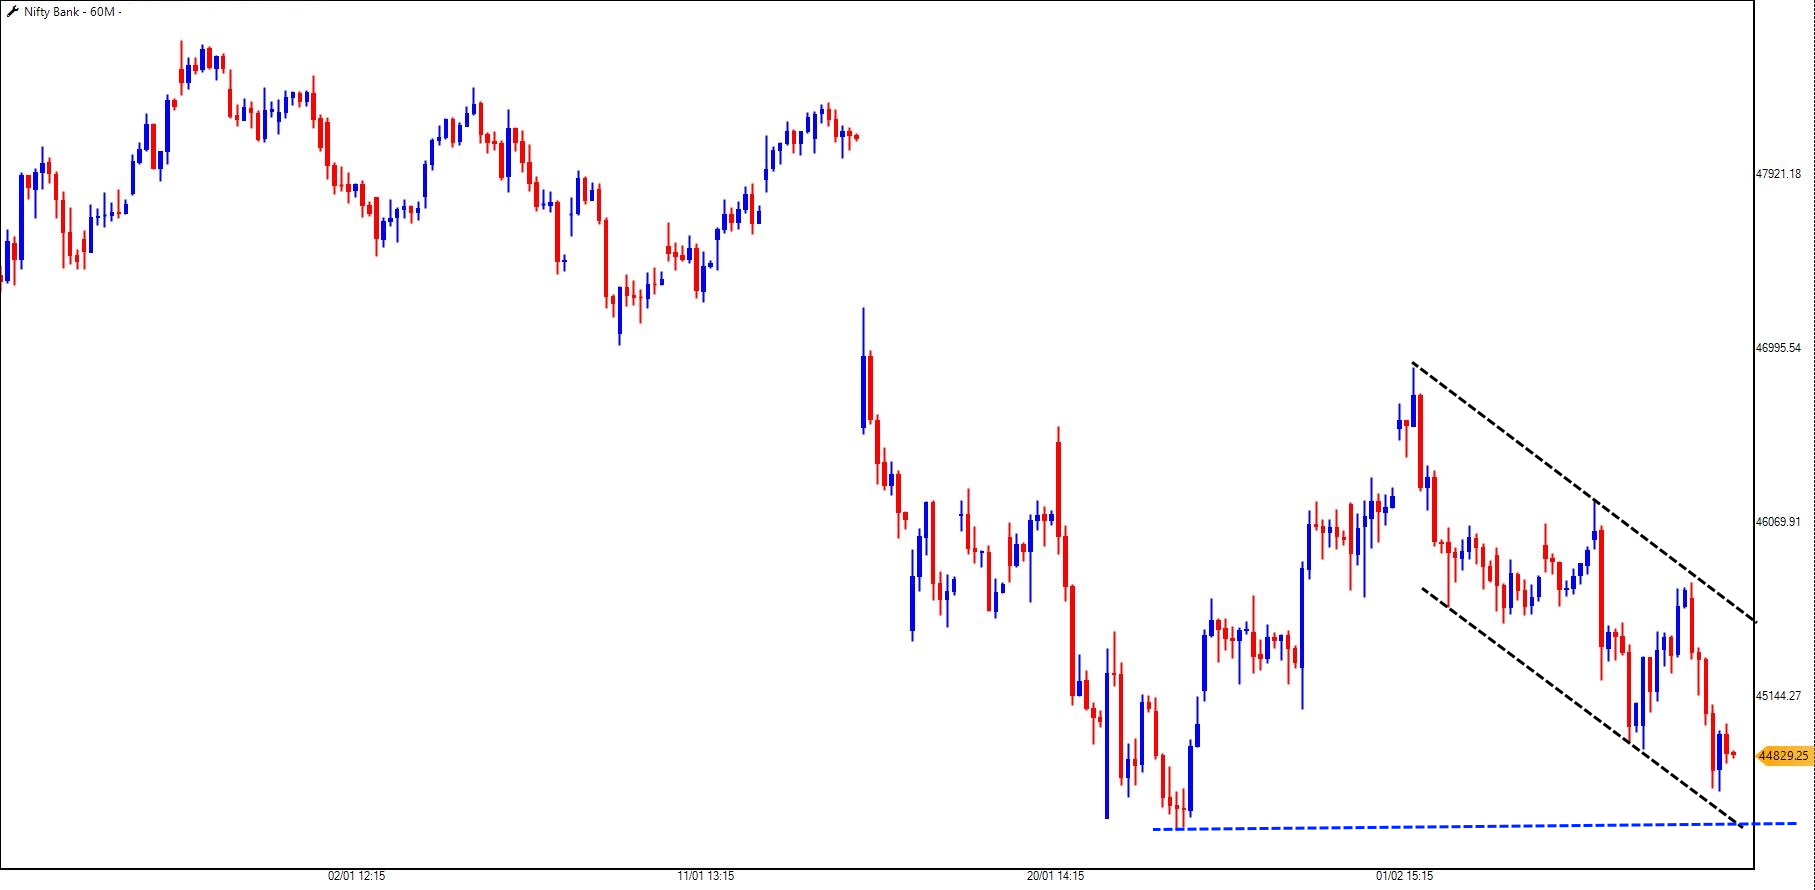
BankNifty - 44,000-44,400 Can be a Trap for Bears
Definedge Securities: Where Technology Meets Strategy in Multi-Time Frame Analysis
Laidback Strategy - Stock List
Zodiac Signs and Stock Market Traders
HDFC Bank - Possible?
The Art of Short Selling
Trividh Strategy - ITC
Trividh Strategy - ITC
HDFC Bank - Possible?
Trade What You See, Not What You Like
Trade What You See, Not What You Like
Kudko & Bhusko - Candlestick Pattern {Video}
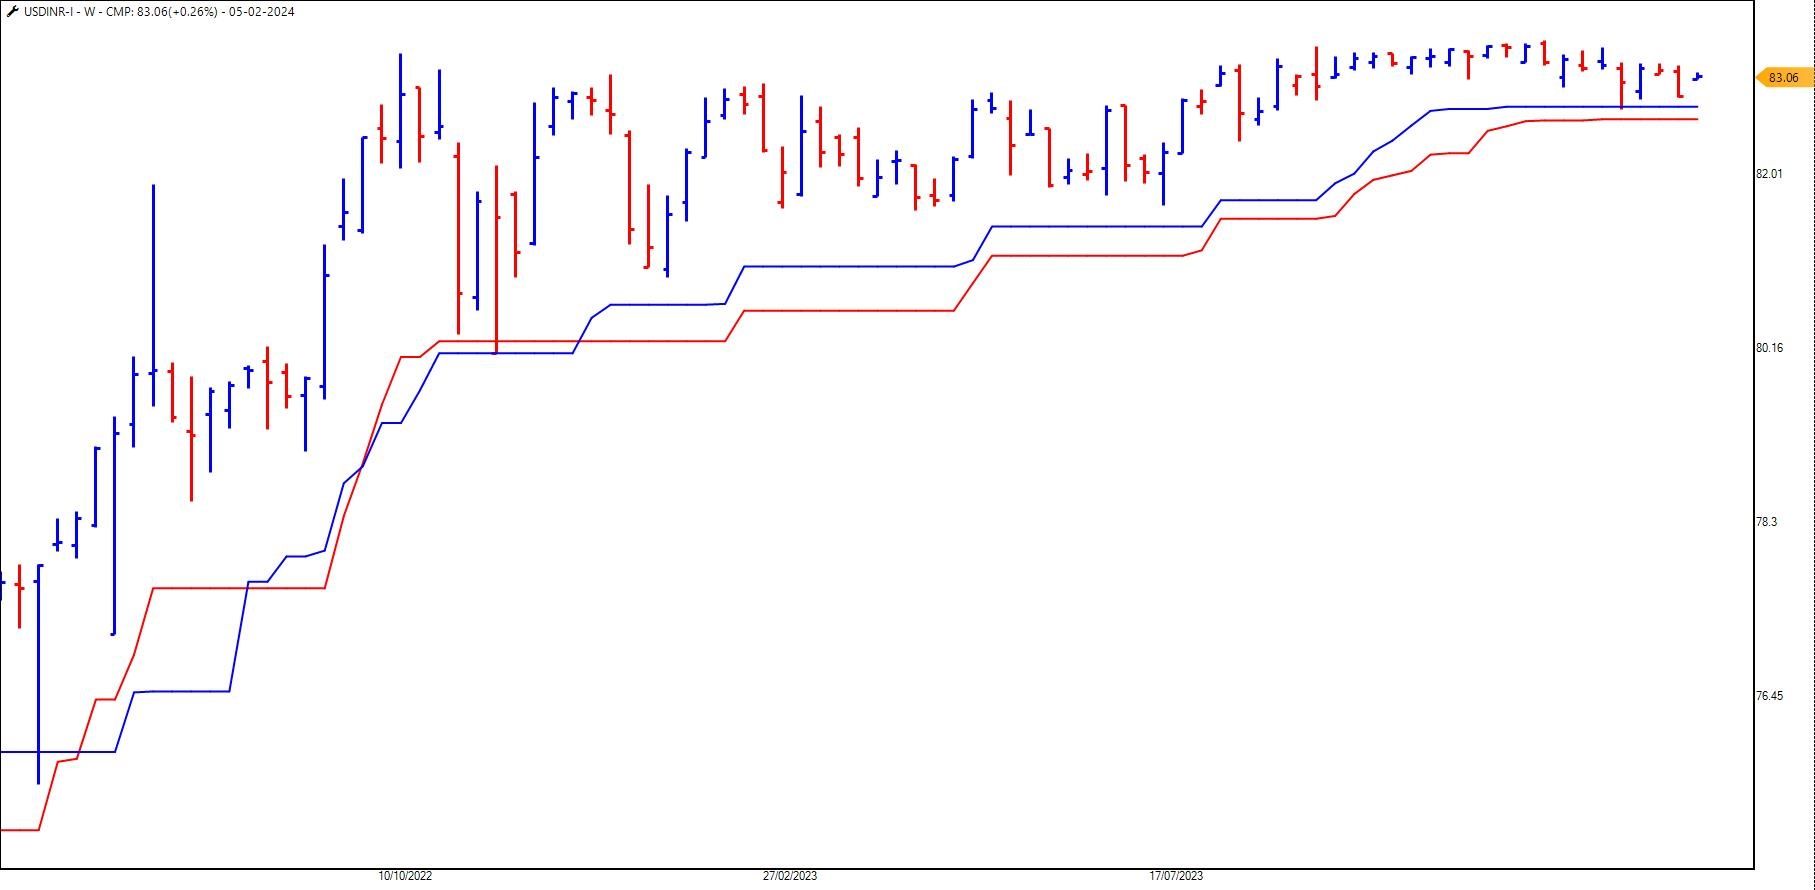
USDINR - Holding the Super Trend Supports
Nifty - Positive Trend on the Horizon
Laidback Strategy - Stock List
The Strategy's Unbelievable Stats Revealed- Video is here
Nifty - Hey Bulls, Act Now or It's a Good Bye for February
The Strategy's Unbelievable Stats Revealed- Video is here
Nifty - Hey Bulls, Act Now or It's a Good Bye for February
Bajaj Finance - Is the Retail Funding Story Over for the Company?