Brijesh Bhatia
Pro User
All Replies
-
@Deven Shah Thanks Sirji
-
Do you know about the Equal-Weighted Index?
Watch the video and learn about the Equal Weighted Index (EQW).
Index are readily available in #Definedge #TradePoint and #RZone
-
@Yogesh Vinayak Joshi Thanks for reading.
-
Warning -
Long Piece,but Worth Reading
Chart patterns are a cornerstone for any technical analyst, regardless of the asset class they are analysing. Whether it's stocks, currencies, or interest rates, chart patterns are crucial in predicting future price movements. However, the effectiveness of technical analysis patterns can vary across asset classes or market segments, such as large-cap, mid-cap, and small-cap stocks.
Technical analysis is a versatile tool traders use to analyse historical price movements and identify potential future trends. It involves studying charts and patterns to predict where prices may move next. However, the success of technical analysis is often debated, with some arguing that it may not work uniformly across all asset classes.
When I was learning technical analysis, my mentor emphasised the importance of objectivity. He used to say, "Cover the name of the left top and give your view." This approach encourages analysts to focus on the chart patterns rather than being influenced by the name or reputation of the asset being analysed.
I am writing this today because there has been a lot of buzz as Reliance's share price gained 7%.
Despite scepticism among traders, a chart analysis posted on a forum indicated a breakout above 2,640. The stock broke above a crucial resistance zone and exhibited a classic pattern of rallying, retesting, and then resuming its bullish trend.
The lesson is that chart patterns are universal, and their effectiveness is not limited to specific stocks or market segments. Whether analysing large-cap, mid-cap, or small-cap stocks, the principles of technical analysis remain consistent.
The key to successful technical analysis is how traders perceive and interpret chart patterns. The name of the stock, especially in the top left corner, should be irrelevant when conducting technical analysis. The patterns, trends, and support/resistance levels matter most.
Confidence in trading these patterns comes from understanding the historical performance of specific patterns and the associated risk management strategies. While technical analysis is not foolproof, having a well-defined stop-loss in place helps mitigate potential losses.
Although the basic principles of technical analysis remain constant, there are nuances to consider when applying them to different market capitalisations. Large-cap stocks, for instance, may be less volatile and follow trends more smoothly, making specific patterns more reliable. On the other hand, mid-cap and small-cap stocks can exhibit greater volatility, requiring traders to adjust their risk management strategies accordingly.
The recent rally in Reliance Industries serves as a reminder that successful analysis depends on understanding and interpreting chart patterns rather than getting swayed by the instrument's name.
-
@JP Yes
-
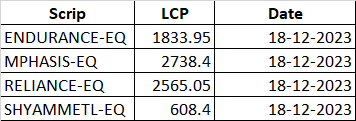
Stock List 27th Jan 2024
-
Coming Soon.....Stay Tuned
")
-
@Debarchan Ghosh Dastidar Book, haven't planned yet.
-
“Insan ka kartavya hota hai koshish karna. Kamyabi, nakamyabi sab uske hath me hai” – the best dialogue from the movie Zindagi Na Mile Doobara.
On a relaxing Sunday, I watched the Zindagi Na Mile Dobara movie and simultaneously browsed my last week's trades. I suddenly realised after the volatile market that you need a break for yourself with your friends.
The Bollywood movie "Zindagi Na Mile Dobara" is one of the iconic movies of Friends and is an inspiration for many as the three friends, Arjun (Hrithik Roshan), Kabir (Abhay Deol) and Imraan (Farhan Akhtar). Little did they know that the film's journey of self-discovery and camaraderie would hold valuable lessons for their expedition in the unpredictable realm of stocks.
In the stock market, much like the characters in the movie, traders embark on a journey filled with ups and downs, joys and sorrows. At the centre of their story is a unique character named Bagwati (a bag); let's make it a symbol of their investments and the market itself.
In the movie, Bagwati is a funny and expensive travel companion. Similarly, in the stock market, stocks become the Bagwati of traders – each with its personality, quirks, and potential for adventure. Just as Arjun, Imran, and Kabir learned to embrace the uncertainties of life, traders must learn to be profitable with the unpredictable nature of the market.
Lesson 1: Risk and Adventure
In "Zindagi Na Mile Dobara," the characters plan a road trip challenging their comfort zones. Similarly, in the stock market, traders must take risks and enjoy adventure. Like the road trip, the market is full of uncertainties, and success often lies in the ability to face challenges head-on.Lesson 2: Diversify Your Portfolio, Diversify Your Experiences
As Arjun, Imran, and Kabir explore different facets of life, traders should diversify their portfolios to minimise risks. Bagwati, with its mix of colour and design, represents the importance of a diversified approach. In the stock market, spreading investments across various sectors can help traders weather the storms and ensure a smoother journey.Lesson 3: Learn from Mistakes and Adapt
As the movie characters learn from their mistakes, stock market traders must adapt and evolve. Traders should analyse past decisions, learn from their mistakes, and adjust their strategies to the changing market conditions.Lesson 4: Cherish Friendships and Mentorships
In "Zindagi Na Mile Dobara," the friendship bond is a cornerstone of the narrative. Similarly, in the stock market, traders should value the importance of friendships and mentorships. Learning from experienced traders and sharing insights with peers can provide an invaluable support system in times of uncertainty. In the forum, we are here to create a bond of friendship and mentorship to shorten your learning curve.Lesson 5: Enjoy the Journey, Not Just the Destination
The movie teaches us that life is about the journey, not just the destination. Similarly, in the stock market, traders should enjoy the process of trading/investing and not just focus on the result. Celebrate small victories, learn from failures, and savour the moments that make the journey worthwhile.Zindagi Na Mile Dobara and the stock market share common threads of unpredictability, risk, and self-discovery. Traders who learn the lessons from this Bollywood masterpiece will find themselves better equipped to drive the twists and turns of the stock market journey, much like the characters who discovered the true meaning of life in Spain.
-
Stock List - 21st Jan 2024
-
Overbought? Oversold? Forget It! Use RSI as Market Breadth NOW.
Think you know RSI? Think again!
This video will forever change how you see this popular indicator.
Unlocking a new dimension for smarter trading decisions.
With the power of the RZone scanner by Definedge to reveal hidden trends and understand the true participation of the market in significant moves.
Whether you're an experienced trader or starting out, this video is a must-watch!
-
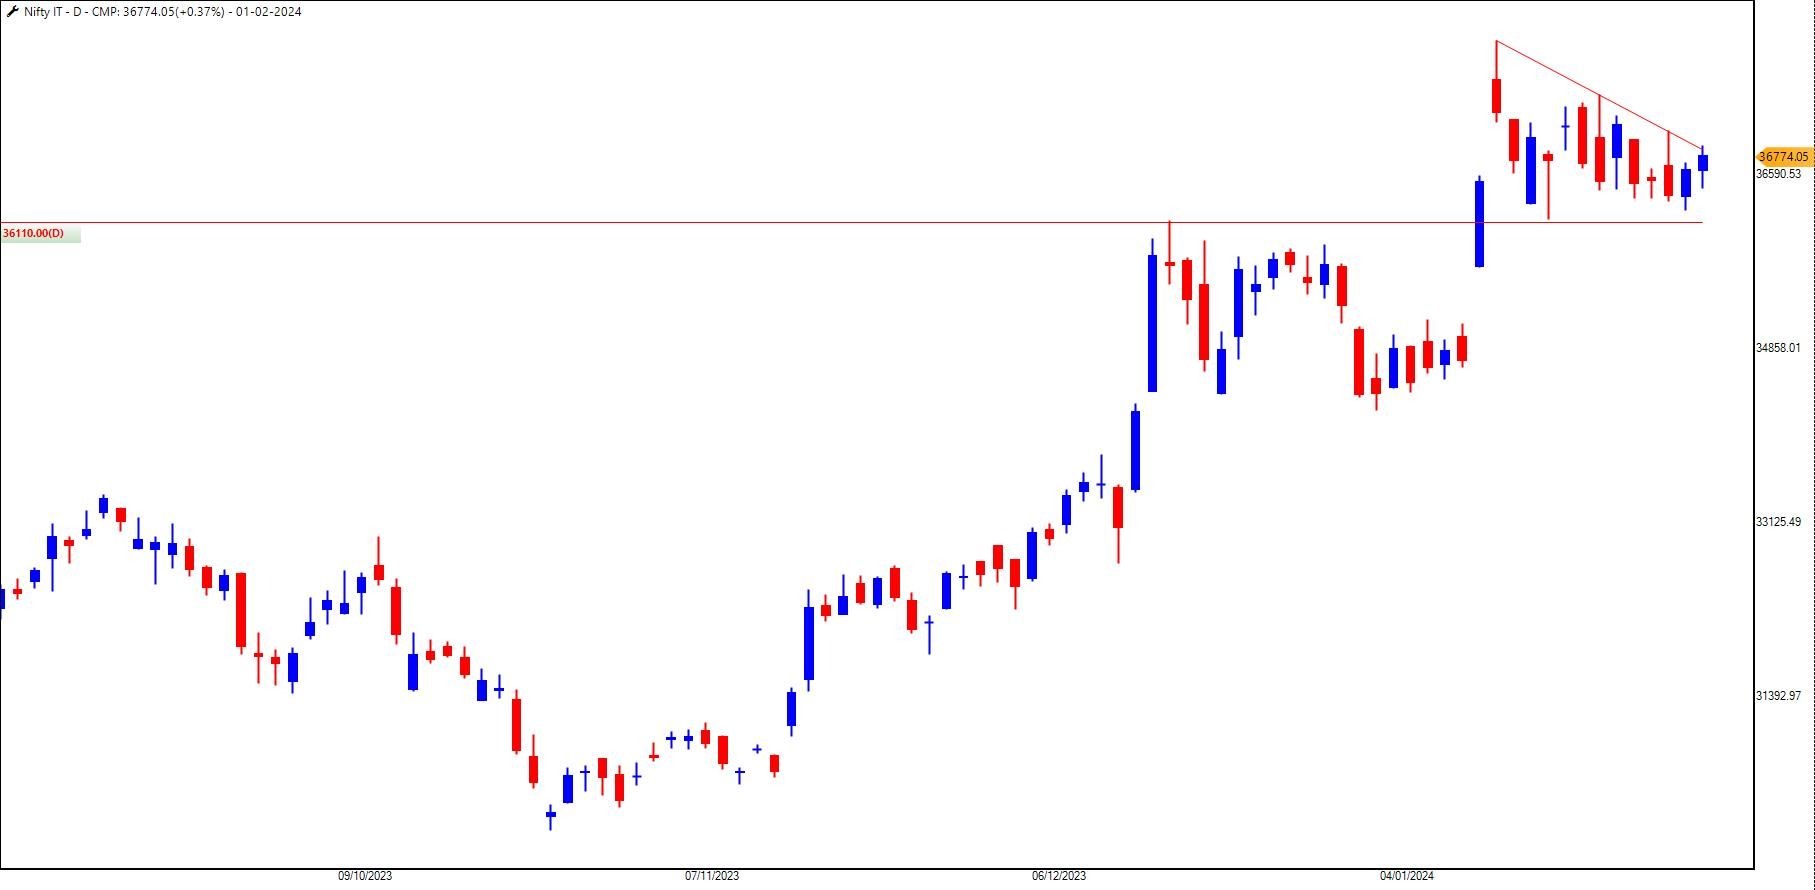
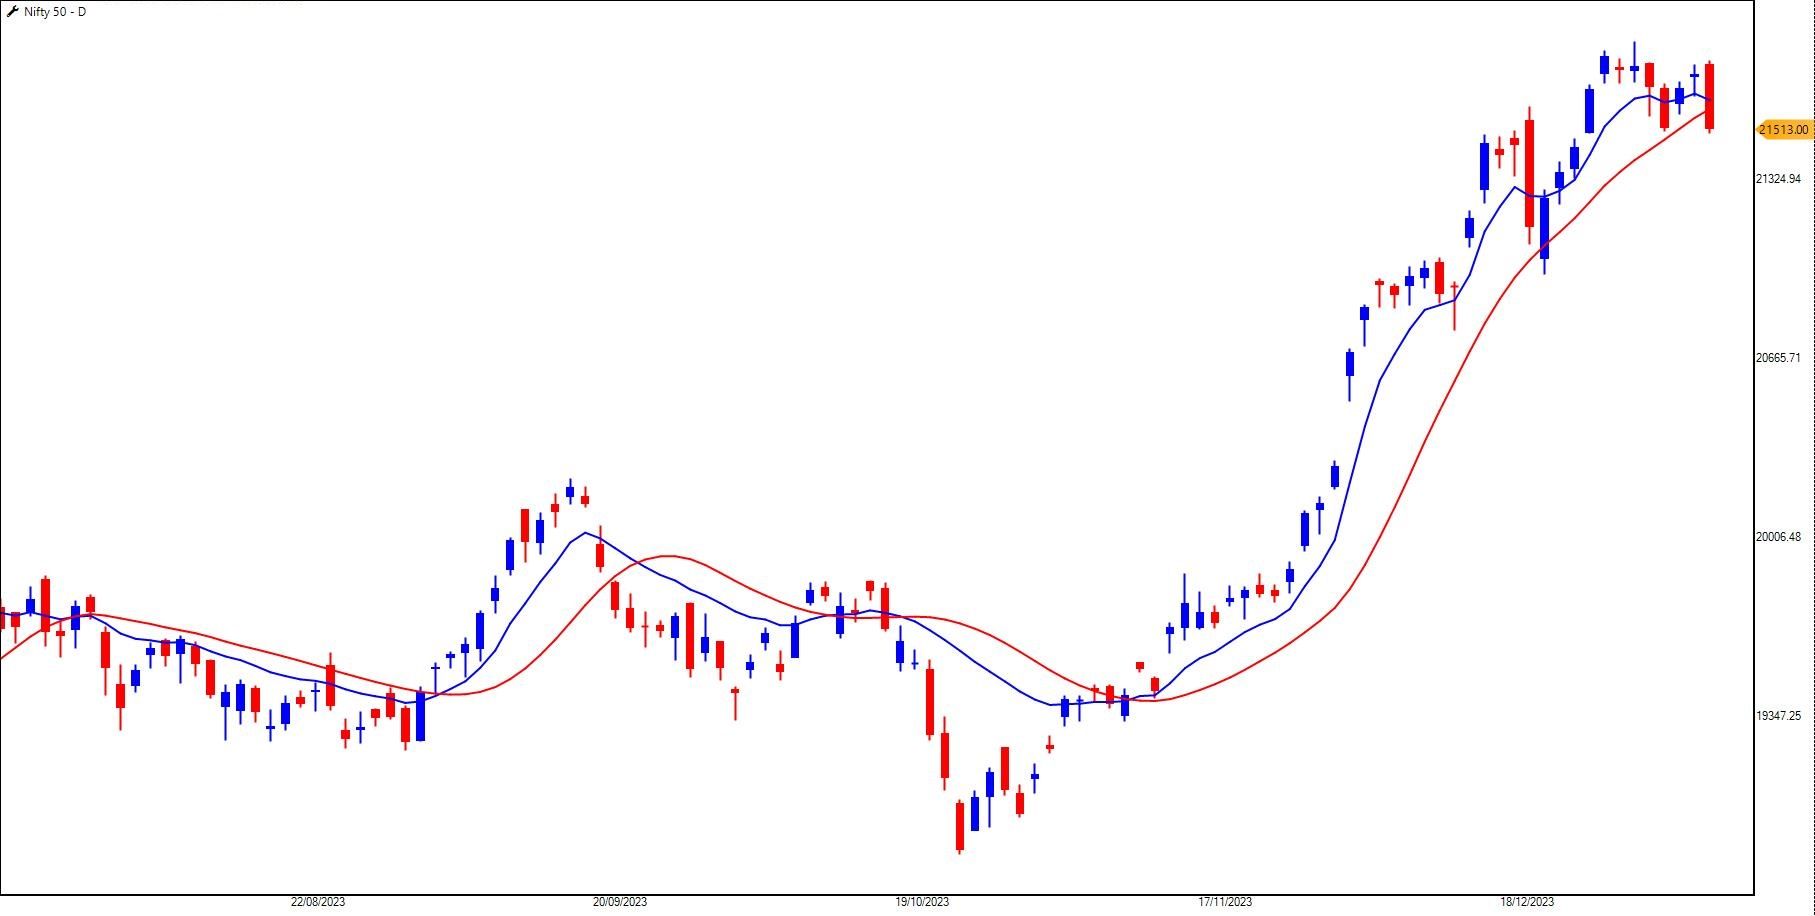
Nifty reversed with the bear gap, forming the island reversal pattern on the daily charts, thanks to the HDFC Bank.
But I am not here to highlight the Nifty50 chart. Check my Nifty Chart analysis here.
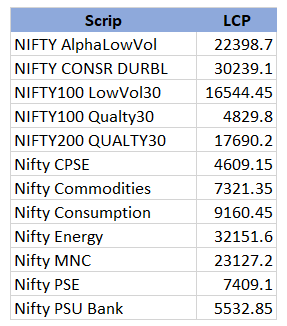
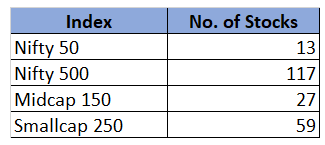
For avid followers of RSI, the latest data reveals some intriguing statistics that warrant attention:
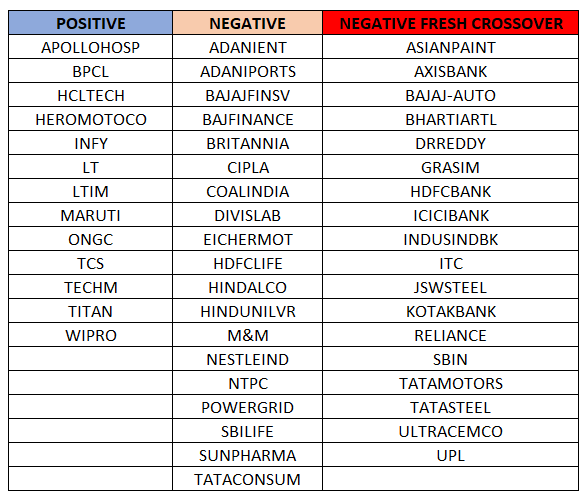
Source: RZone-
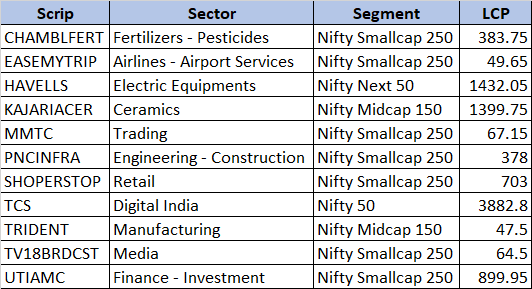
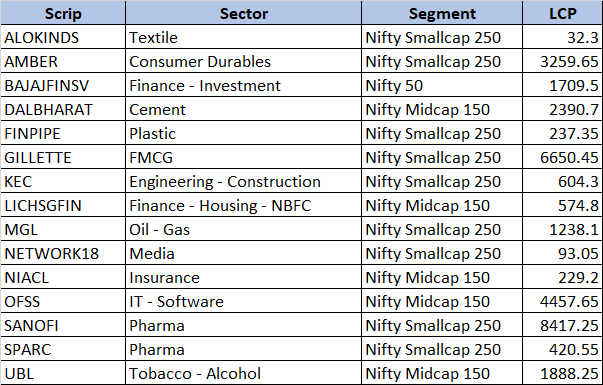
Fresh Negative Crossovers: Today, 18 stocks exhibited a fresh negative crossover on the RSI, indicating a potential shift in momentum to the downside.
-
Existing Negative Crossovers: As of yesterday, 19 stocks were already in a negative crossover on the RSI, suggesting that these stocks might be facing a bearish trend.
-
Bullish Crossovers: Only 13 stocks are currently in a bullish crossover on the RSI, indicating a positive trend. However, if the bears continue to dominate the market, these stocks may also find themselves in a precarious position.
Though the setup does not indicate the trend reversal, it is a sign of caution on longs.
-
-
Thanks for reading.
-
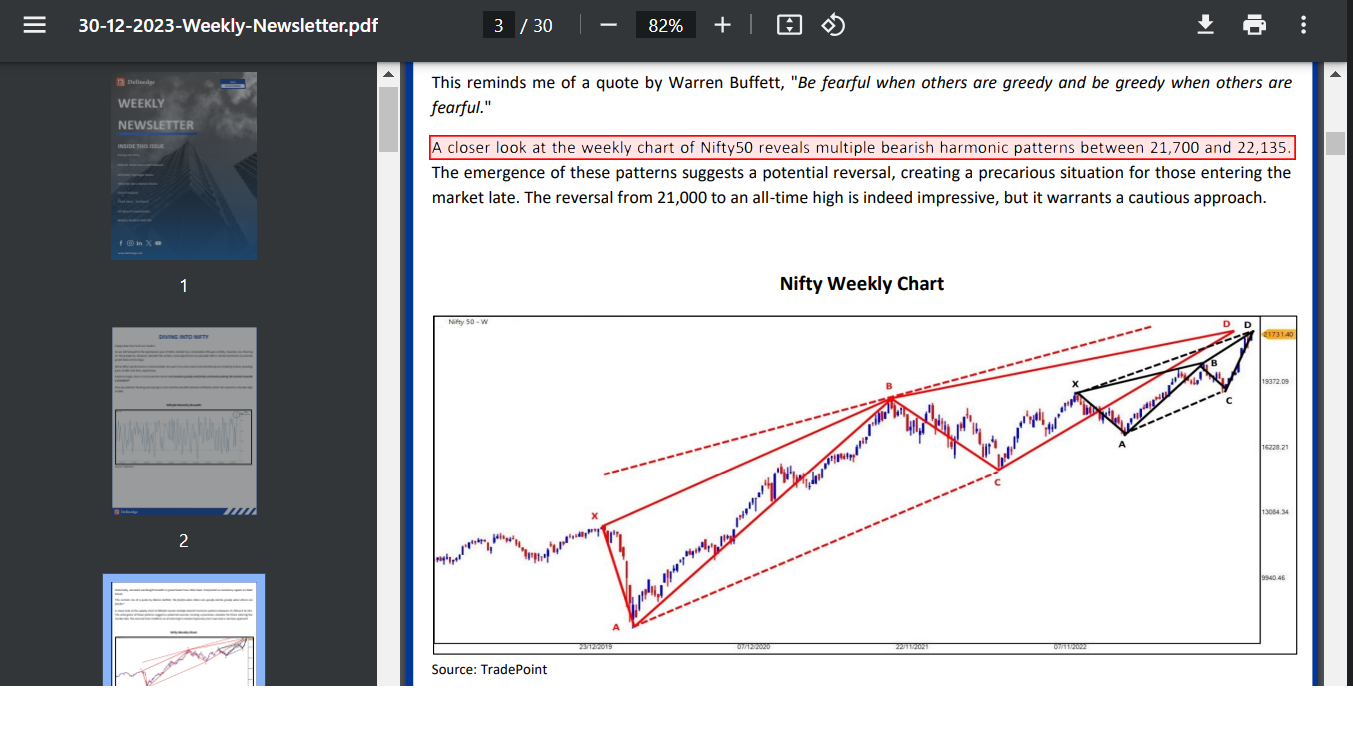
In the latest edition of the weekly newsletter dated December 30, 2023, significant attention was drawn to the emergence of multiple Bearish Harmonic patterns within the price reversal zones of 21,700 and 22,135 for Nifty. As predicted, the index peaked at 22,124 before undergoing a reversal, aligning precisely with the outlined harmonic patterns.
A closer look at Nifty's daily chart reveals the presence of the Bear Sash candlestick pattern at its recent high. For those unfamiliar with this pattern, a comprehensive explanation can be found in the accompanying video linked here.
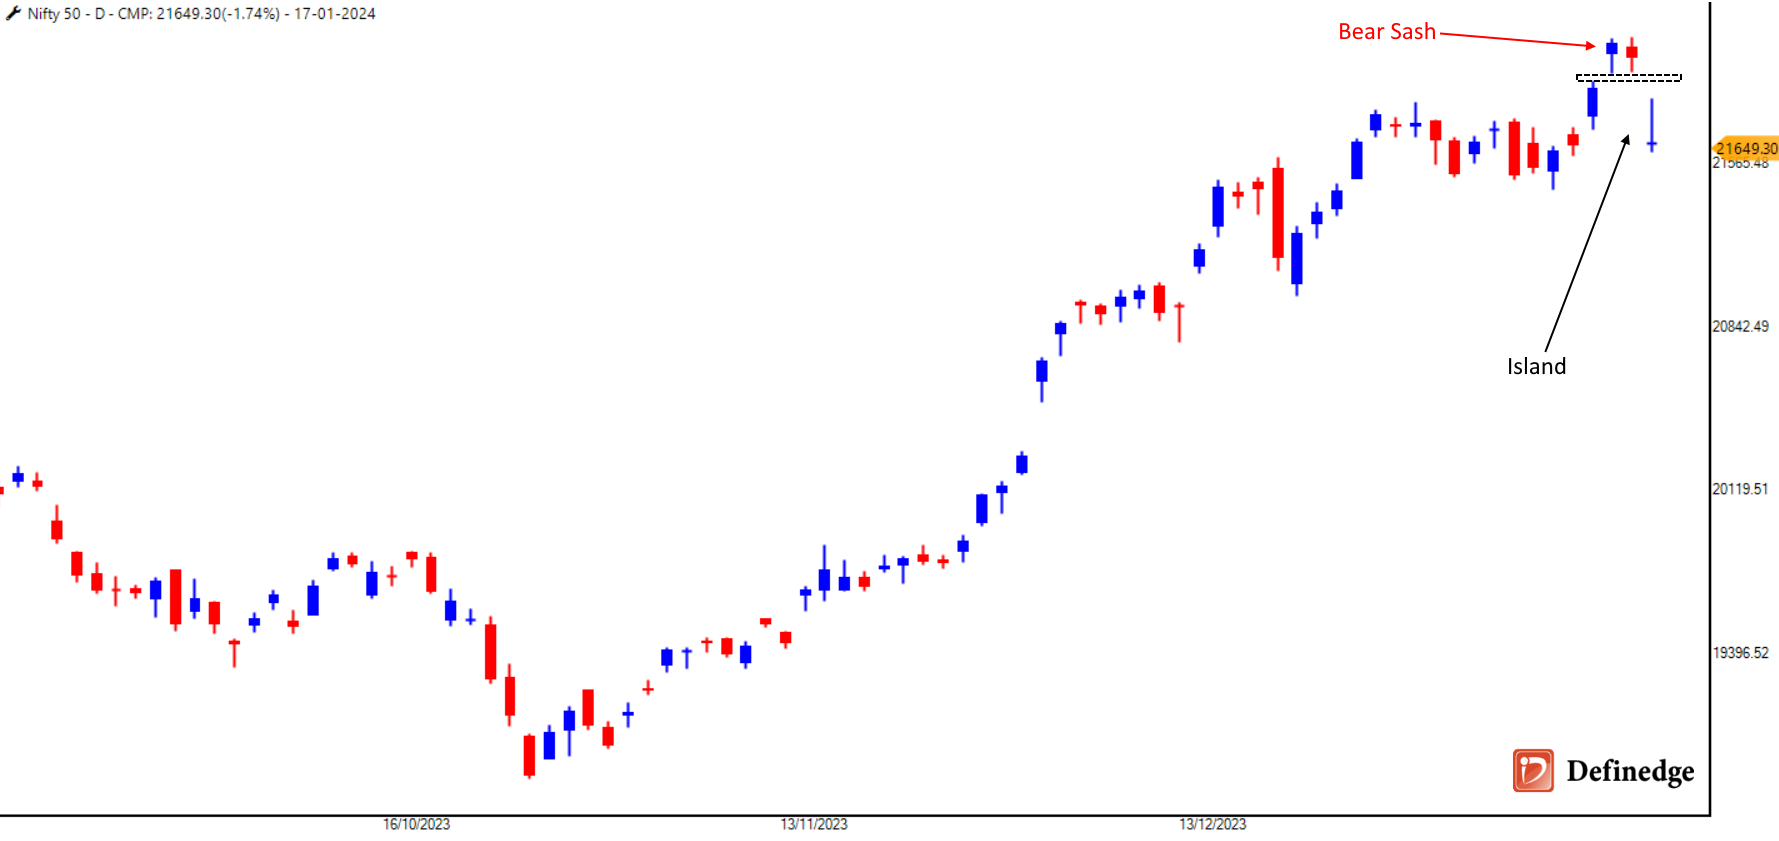
Adding to the cautionary signals, the possibility of a Bearish Island formation is looming, contingent on today's closing performance. A Bearish Island pattern occurs when an isolated price gap up is followed by a gap down formed at the same levels, typically indicating a shift in market sentiment, which forms between two sessions.
What is your trading plan?
-
In this insightful video, I break down the intricacies of Bull Sash and Bear Sash candlestick patterns – powerful two-candle reversal formations that occur after a significant market movement.
Ready to take your trading to the next level?
If you're a Definedge Securities customer, explore the convenience of our ready-built scanner in RZone. Scan for Bull Sash and Bear Sash patterns effortlessly across multiple timeframes, providing you with a strategic advantage in the market.
-
A stock market enthusiast has heard the name Harshad Mehta. Recently, a movie was made about his life, and the dialogue was very popular. One such dialogue is “Kam bolna, zyada kaam karna” which means talk less and work more.
In the stock market, where fortunes are made and lost in the blink of an eye, stock market dealers play a crucial role in executing trades on behalf of clients. Often unseen and unheard, these individuals are the unsung heroes behind the scenes of the bustling financial markets.
As you may have seen in the movies, the dealers in the ring trading are the ones who buy and sell on behalf of clients.
However, with the evolution of technology and the changing landscape of investing, the role of the traditional stock market dealer is transforming, leaving some to wonder about the future of this once indispensable profession.
I recall the early days of my career when I entered the fast-paced world of commodity trading. The trading floor was chaotic with ringing phones, shouting traders, and the constant hum of financial news updates. As a young and eager commodity dealer, my days were to bridge clients and the research desk, make split-second decisions, and field countless calls from anxious clients seeking advice on their next move.
However, the winds of change were blowing even then. The advent of online trading platforms, algorithmic trading, and the democratisation of financial information meant that investors were gaining more control over their trades. The shift was palpable; investors were turning into executors of their trades, armed with real-time market data and the ability to execute orders at the click of a button.
The COVID-19 pandemic further accelerated this trend. As the world grappled with the challenges posed by the virus, technology emerged as a saviour. Online communication platforms became the new norm and the vaccine incorporated immunity into our blood and embedded technology into our minds. Virtual meetings and digital transactions became the lifeline for businesses, including those in the financial sector.
With its rapidly growing tech-savvy population, India embraced this change with open arms. The traditional stock market dealer found themselves in a new era where their once indispensable role was questioned. The phone, which used to ring incessantly with clients seeking advice, was now silent, replaced by the constant hum of servers and algorithms executing trades in milliseconds.
Trading, once seen as a dynamic and social business, took on a new dimension of solitude. The camaraderie among traders, the banter on the trading floor, and the shared adrenaline rush were replaced by the sterile glow of computer screens in empty rooms. The art of negotiation and persuasion, skills honed by veteran dealers, seemed to be fading into obsolescence.
The loneliness of the modern trader became evident. The personal touch, the reassurance in the voice of a seasoned dealer during turbulent market times, was replaced by automated responses and pre-programmed algorithms. The human element, it seemed, was being slowly edged out by the relentless march of technology.
For those nostalgic for the days of broker-client relationships and the reassuring voice of a stock market dealer, the iconic movie "The Wolf of Wall Street" serves as a reminder of a bygone era. The days of pen-and-paper transactions, aggressive sales pitches, and charismatic brokers seem like a distant memory in today's digital age.
Yet, amidst this technological upheaval, some clients still find solace in speaking to a human dealer. The comfort derived from a personal connection, the ability to seek advice from a knowledgeable professional, and the assurance that someone is at the other end of the line during tumultuous market conditions are irreplaceable for some investors.
The days of a bustling trading floor may be fading, but the human touch in trading is not entirely lost. It may be via a digital chat on WhatsApp, Telegram, Twitter or even here at our forum.
I request a few minutes of your to write about your experience on dealer-client relationships.
-
Ok.
-
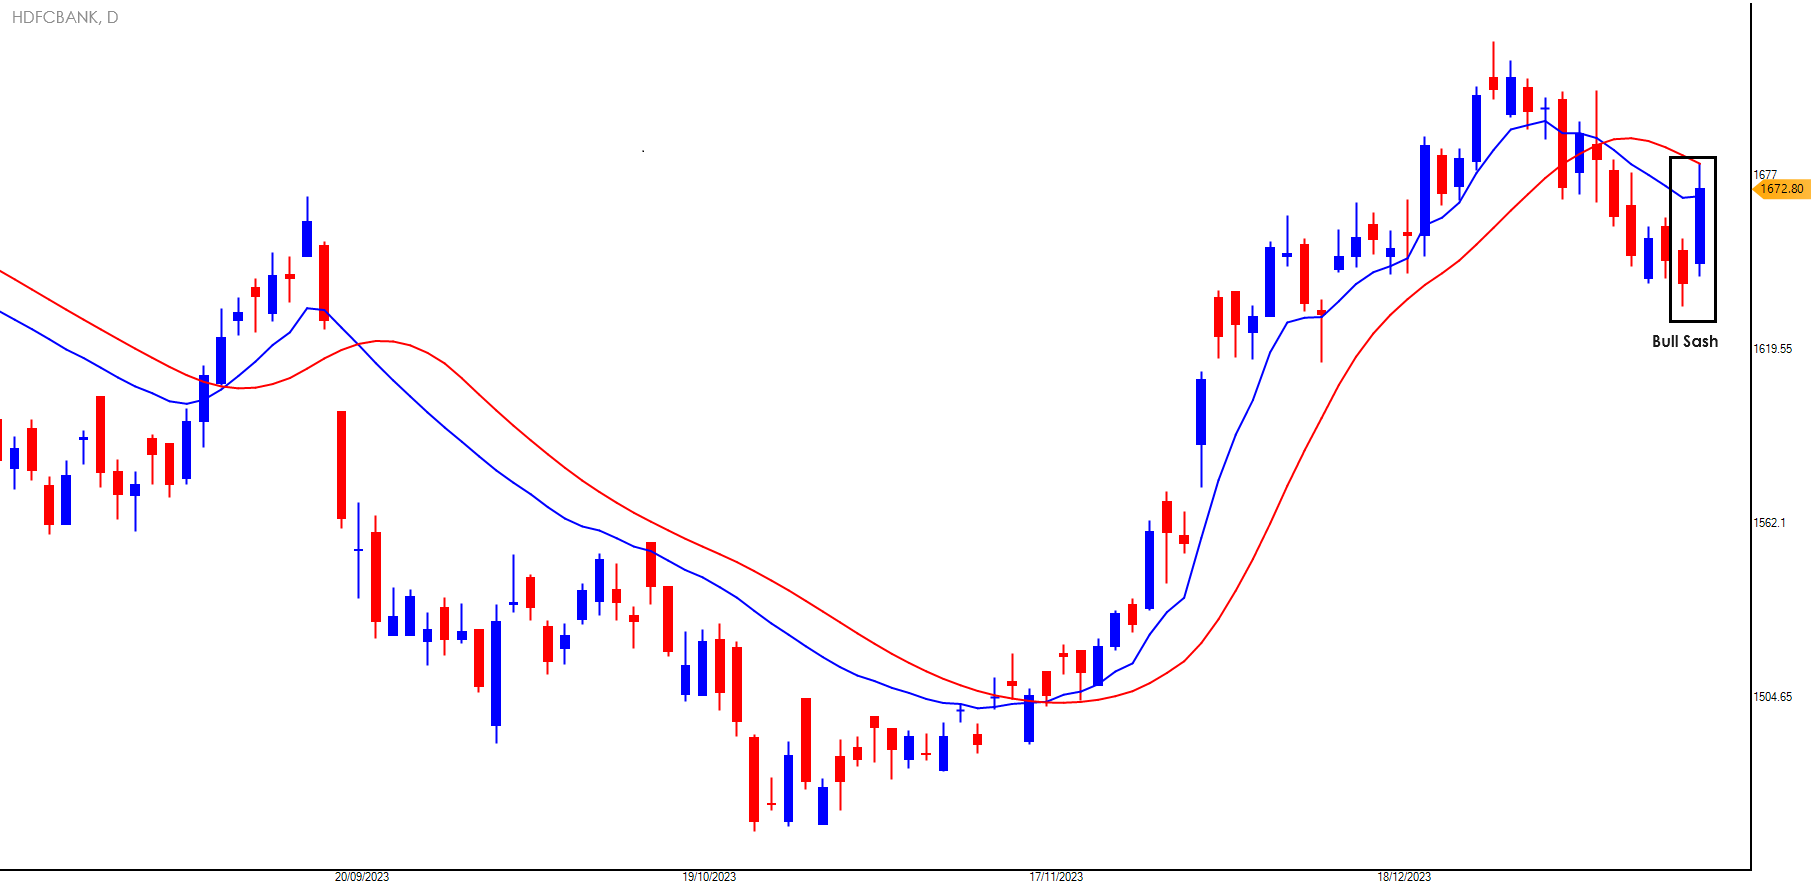
HDFC Bank's share price traded strongly in the banking stock basket, forming the Bull Sash candlestick pattern on the daily chart.
But.......
An Adaptive RSI indicator has turned negative and the stock price have resisted at the signal line of the indicator.
The negative cross and resistance zone of 1,680-1,700 will be a decider for the further bullish momentum. If bulls fail to surpass with strong trend, that may be standing with the white flag.
-
It's working for me. Will check with support team if there is any issue.
-
@Yogesh Vinayak Joshi Thanks for reading.
-
@RAJESH DOSHI Sir, you can watch this video for clarification. https://www.youtube.com/watch?v=o6eO31UgiCI&t=33s
-
The complexity often reigns supreme; I have found refuge in simplicity's soothing embrace. It's not just a hashtag I throw around on social media; it's a philosophy of my trading soul - #KeepItSimple
You've likely noticed my commitment to simplicity as you follow me on social media. But it's not a mere digital slogan; it reflects how I approach life beyond the screens. I enjoy keeping things simple, letting the essence shine through the noise.
Amidst the cacophony of candlesticks and oscillators, one chart stands out with its simplicity – Biocon.
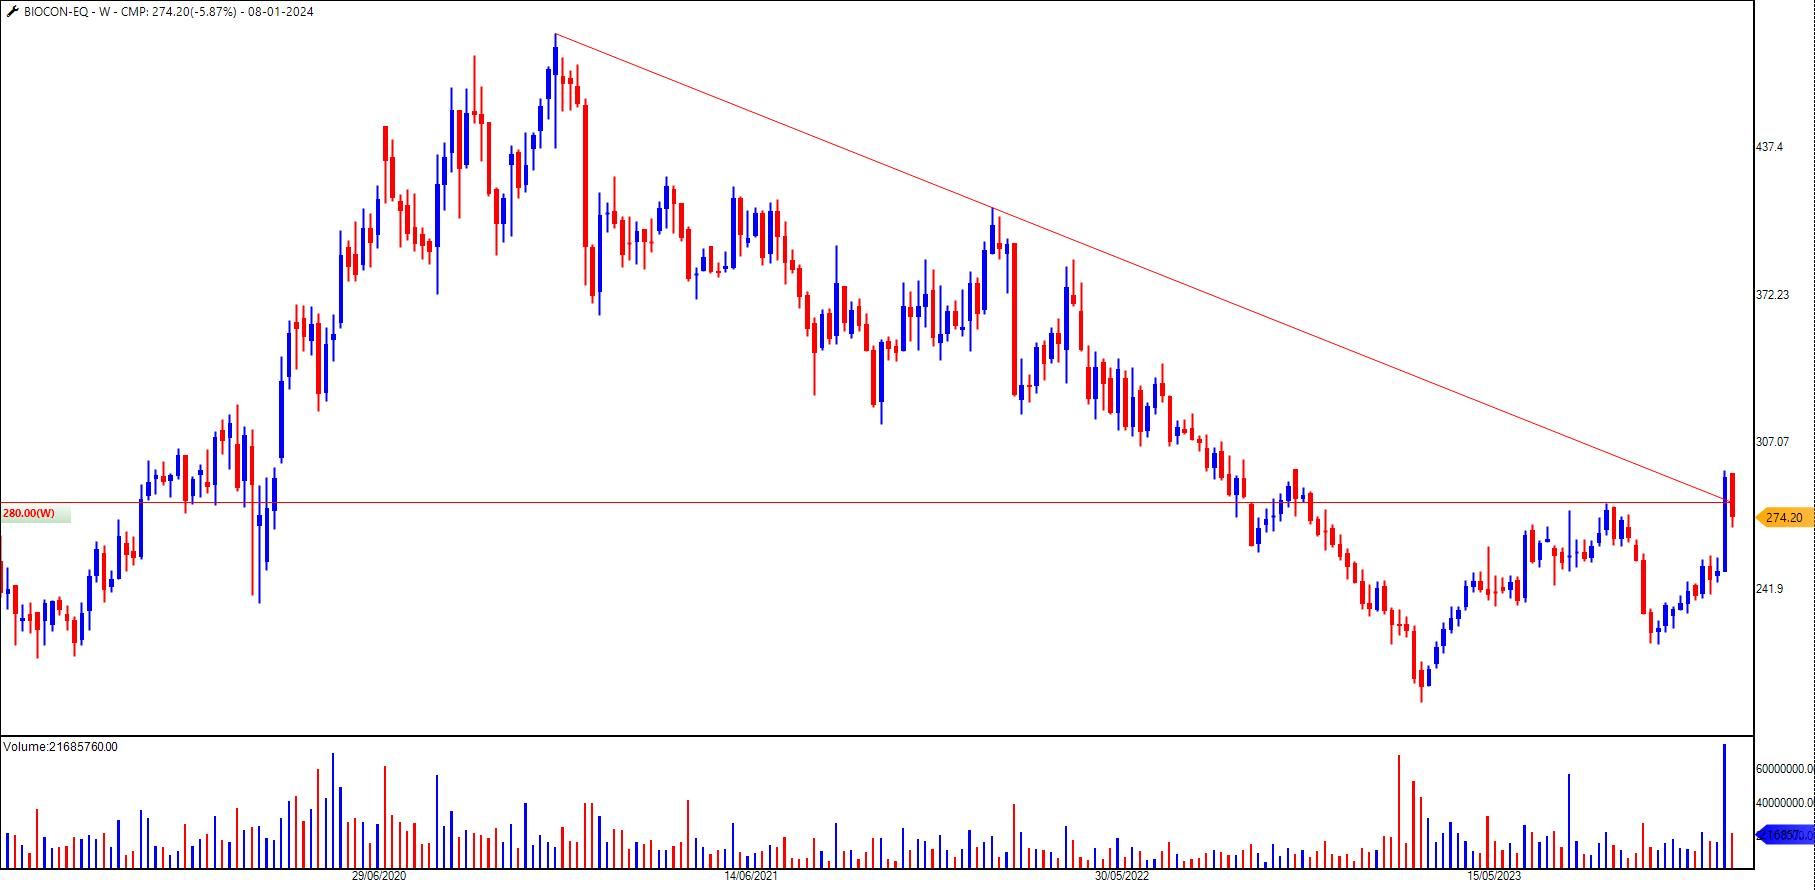
On the weekly chart, my eyes are drawn to the minimalist elegance of trendlines and the heartbeat of the market, the volumes.
The falling trendline, a humble stroke on the chart, speaks volumes about the market's mood. It's not about complicated patterns or convoluted indicators; it's about recognising the artistry in simplicity. Paired with volumes, each bar is a note in the melody of market dynamics.
If you're a fellow learner, the chart isn't just data; it's the strokes of your understanding. And, oh, the joy of witnessing you opening your chart – a sign of your hunger for knowledge and a great learner.
Yet, another character in our financial tale seeks ideas for profits, the one yearning for quick wins. I understand the temptation to skip the verses and seek the chorus. However, my heart resonates with the first kind – the perpetual learner who revels in the long-term symphony of knowledge.
So, here we stand at the crossroads of simplicity and complexity. I urge you to be the learner who seeks understanding, for in the long term learning lies the true magic of the market and life itself.
#KeepItSimple, and let the charts sing the ballad of simplicity in the grand opera of the markets.
-
Stock List - 13th Jan 2024
-
The performance of market indices gauges the stock market trend, the Nifty50. The movements within these indices reflect individual stock performances and are influenced by the weightage assigned to each constituent stock and the overall market breadth.
The Role of Weightage in Index Formation:
The Nifty50, a key benchmark index in India, comprises 50 actively traded stocks from various sectors. However, not all stocks carry the same weight in determining the index's value. The weightage assigned to a stock is based on its market capitalisation, essentially the total market value of its outstanding shares. This means that stocks with higher market capitalisation have a more significant impact on the index.For instance, if a heavyweight stock like Reliance Industries experiences a substantial price movement, it will have a more pronounced effect on the Nifty50 than a smaller stock with a lower weightage. Investors closely monitor these weights as they can significantly influence index movements and individual portfolios.
Market Breadth:
While weightage focuses on the impact of individual stocks, market breadth provides a broader perspective on the market's overall health. Market breadth measures the number of advancing and declining stocks in the market. A strong market breadth occurs when many stocks participate in a market rally, indicating a broad-based uptrend. Conversely, a weak market breadth suggests that only a few stocks drive the market higher, and the overall strength may be limited.Nifty50 Leadership Dynamics:
In the recent few weeks, the Nifty50 witnessed a change in leadership. HDFC Bank, TCS, and Infosys led the index, demonstrating the market's dynamic nature. However, the recent surge in Reliance Industries' stock has turned heads. As an elephant in the market with substantial weightage, its influence on the Nifty50 is undeniable.Investor Dilemma: Single Stock Leadership vs. Weak Market Breadth
The question for investors is whether a single stock's leadership, despite its weightage, can indicate the broader market's health. Should one change their view on the Nifty50 based on the performance of a dominant stock while the market breadth remains weak? Or should investors stick to analysing the levels of the Nifty50 itself?Balancing Act:
It is finding the right balance between individual stock movements and the overall market dynamics. While a single stock may dominate the headlines, a holistic approach to analysing market breadth and the overall composition of the index is essential. A narrow leadership with weak market breadth may indicate a less sustainable market rally, potentially leading to increased volatility.Understanding the dynamics of index weightage and market breadth is essential for informed decision-making. Investors must evaluate the impact of individual stocks on indices like the Nifty50 while keeping an eye on broader market participation. Striking the right balance between these factors can help investors navigate the complex world of stock trading and make more informed decisions in pursuing long-term success.
-
Dive into the promises, deals, and disruptions of the Vibrant Gujarat Global Summit and explore how it could paint a golden future for the Indian stock market.
Read article - https://www.definedgesecurities.com/blog/whats-trending/gateway-to-the-future-how-vibrant-gujarat-2024-illuminates-the-stock-market/
-
@Rajeev Talasikar Adaptive RSI - 14,9
-
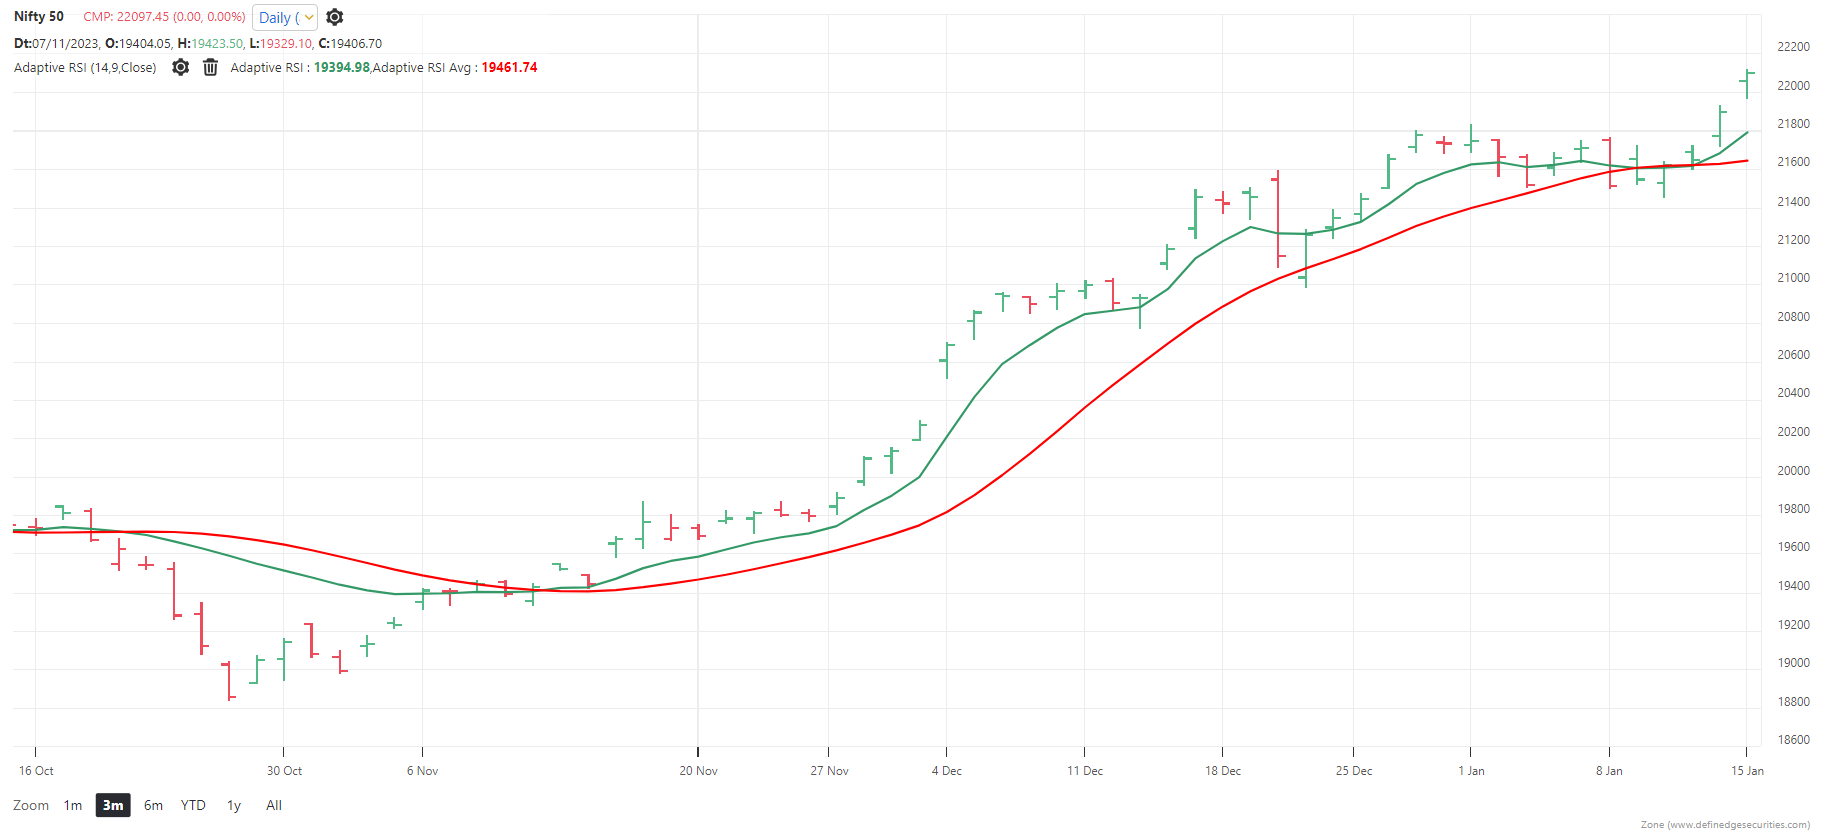
In yesterday's session, the Nifty index witnessed a momentum shift as bearish forces led by the banking sector.
A glance at the daily chart of Nifty reveals concerning indicators for bulls. The emergence of a doji candlestick pattern, coupled with a bearish momentum, paints a gloomy picture for those who were hoping for a sustained upward trend. Furthermore, the Bearish Three Line Strike candlestick pattern yesterday that followed is a clear signal of an impending bearish reversal.
Adding to the bearish outlook is the convergence observed on the Adaptive Relative Strength Index (RSI). This technical indicator, which measures the trend's strength and momentum, shows signs that the once-dominant bullish sentiment is fading. If the bearish crossover on the Adaptive RSI triggers, it will be the icing on the cake for bears.
The primary driver behind this bearish momentum is the banking sector. As a leading indicator for the overall market sentiment, the weakness in banking stocks is a cause for concern.
Are You Trading Nifty or Focusing on Individual Stocks?
-
As the stock markets soar to new heights, the minds of investors and traders are not solely focused on charts and portfolios. Instead, they are eagerly planning their holidays, seeking a reprieve from the hustle and bustle of daily life.
The year 2024 brings myriad choices, but one destination that has captured the attention of many is the enchanting beaches and sports adventure of Lakshadweep.
For those who revel in the soothing sound of waves and the warmth of golden sands, Lakshadweep emerges as the talk of the town. This idyllic destination boasts pristine beaches, crystal-clear waters, and vibrant coral reefs, making it a haven for beach lovers. The archipelago, consisting of 36 islands, offers a serene escape from the chaos of urban life, making it an ideal choice for those looking to unwind and rejuvenate.
As the weekends approach, families seek the perfect destination to spend quality time together. The upcoming long weekend around Republic Day on 26th January provides an excellent opportunity to embark on a memorable journey. With numerous diverse attractions across the country, the only dilemma is choosing the perfect destination.
With its rich cultural tapestry and diverse landscapes, India has become a magnet for tourists worldwide. The burgeoning tourism industry is a golden opportunity for locals to explore their backyard. From the snow-capped peaks of the Himalayas to the sun-kissed beaches of Goa, the choices are as varied as the country itself.
Where to Next? Deciding Your Ideal Destination?
With an array of options, the decision ultimately rests on personal preferences. If the idea of unwinding on secluded beaches is your dream holiday, then Lakshadweep beckons. For those seeking adventure amidst historical wonders or cultural richness, the vast canvas of India offers countless possibilities.
As India's tourism industry thrives in 2024, the country emerges as a prime destination for both domestic and international travellers.
Lakshadweep's pristine beauty and the upcoming long weekends present an enticing proposition for those yearning for a beach retreat. However, with India's diverse offerings, the decision on the next destination ultimately depends on individual preferences and interests.
Are you ready for your holidays?
Do share your recent holiday experience.
-
Stock List - 6th Jan 2024
-
Euphoria markets, characterised by exuberant investor sentiment and soaring prices, can be a double-edged sword for traders and investors. While these markets offer the potential for significant gains, the challenges of finding the right stocks on the chart become increasingly pronounced.
-
Technical Overextension:
One of the primary challenges in identifying stocks on the chart during the euphoric phases is the potential for technical overextension. Price movements may deviate significantly from historical patterns and indicators, challenging relying on traditional chart analysis techniques. Traders accustomed to technical signals may grapple with distorted patterns and false signals, complicating their decision-making process. -
Irrational Exuberance:
Euphoria markets are often marked by irrational exuberance, where market participants become overly optimistic and speculative. This exuberance can result in exaggerated price movements that do not align with the stock's underlying fundamentals. Do traders bother about fundamentals?
Traders relying on technical analysis may struggle to make sense of the disconnect between price action and the actual health of the companies. -
Herd Behaviour:
The psychological phenomenon of herd behaviour is amplified during euphoric markets. Traders may be swayed by the collective actions of the crowd rather than relying on individual chart analysis. This herding behaviour can lead to crowded buses, as referred by @AP , making it difficult for traders to identify stocks with genuine technical strength amidst the noise of mass market movements. -
Increased Volatility:
Euphoria markets are notorious for heightened volatility. While volatility can present trading opportunities, it also introduces challenges for chart analysis. Sharp price fluctuations and sudden reversals can invalidate technical patterns, causing frustration for traders who rely on historical price data to make informed decisions. -
Emotional Rollercoaster (FOMO):
The psychological impact of trying to identify stocks on the chart during euphoric markets can be profound. The fear of missing out (FOMO) may drive impulsive decisions, and the constant pressure to stay ahead of rapidly changing trends can lead to emotional exhaustion.
Traders may experience anxiety, stress, and emotional fatigue as they navigate the intense highs and lows of euphoric market conditions. -
Risk of Correction:
Euphoria markets are susceptible to corrections, where prices may experience a sharp decline after reaching unsustainable levels. Traders relying solely on technical analysis may find it challenging to anticipate these corrections, leading to unexpected losses.
The fear of a sudden market reversal can further amplify the psychological stress associated with identifying stocks on the chart during the euphoric phases.
-
-
You have been following my Laidback Strategy on stocks for many months now.
In this video, I have explained the Laidback Strategy on ETFs, shedding light on how Definedge Securities clients can seamlessly analyse and trade in ETFs directly from their accounts.
Do share your feedback on the Laidback Strategy.
-
It is very important to rotate between Largecaps, Midcaps and SmallCaps in your portfolio, but how will you decide?
One chart you should follow regularly is Ratio Charts.
Watch this video to analyse and time your allocation between large, mid and smallcaps.
-
@GUTTIKONDA VENKATA SAI It is available on the Library of Definedge Securities page.
Click here https://www.definedgesecurities.com/library/close-above-previous-n-bars-heikin-ashi/
-
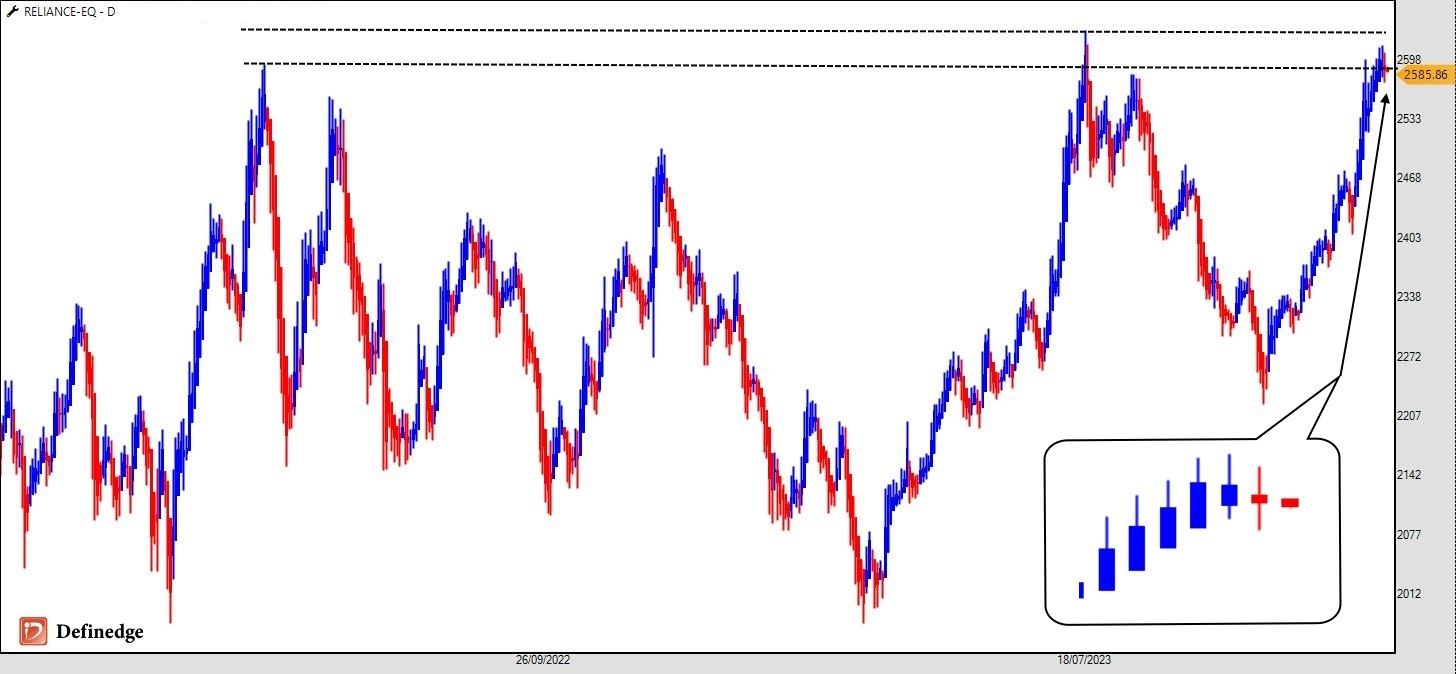
Reliance Industries has been experiencing a bullish rally, but the daily Heikin Ashi chart shows signs of exhaustion.
Following the bullish surge, a couple of doji candles suggest a potential momentum loss for the bulls. Interestingly, this exhaustion is particularly evident as the stock approaches the 20-month resistance level.
Despite the apparent signs of exhaustion, there are no clear bearish Heikin Ashi candles yet. This absence of bearish reversal patterns indicates that the bulls still maintain some control over the market.
The range breakout for Reliance is placed at 2,640, making this a crucial level for traders to watch. If the stock breaks above this resistance, it could signal a renewed bullish momentum. On the other hand, a failure to break through this level may intensify the exhaustion signals and potentially lead to a reversal. A successful breakout could propel the Nifty towards the 22,000 level.
-
Stock List - 30th December 2023
-
The Vriddhi strategy suggests a bullish momentum for ITC, with the Adaptive RSI providing a perspective on the stock's strength. However, the optimism generated by this signal is tempered by the stock's current trading pattern—a falling channel.
A falling channel typically indicates a downtrend consolidation, with the stock moving between two downward-sloping trendlines. The breakout level, set at Rs. 461 could potentially signify a shift in the prevailing trend. If the stock manages to surpass this level, it may resume the bullish momentum for ITC.
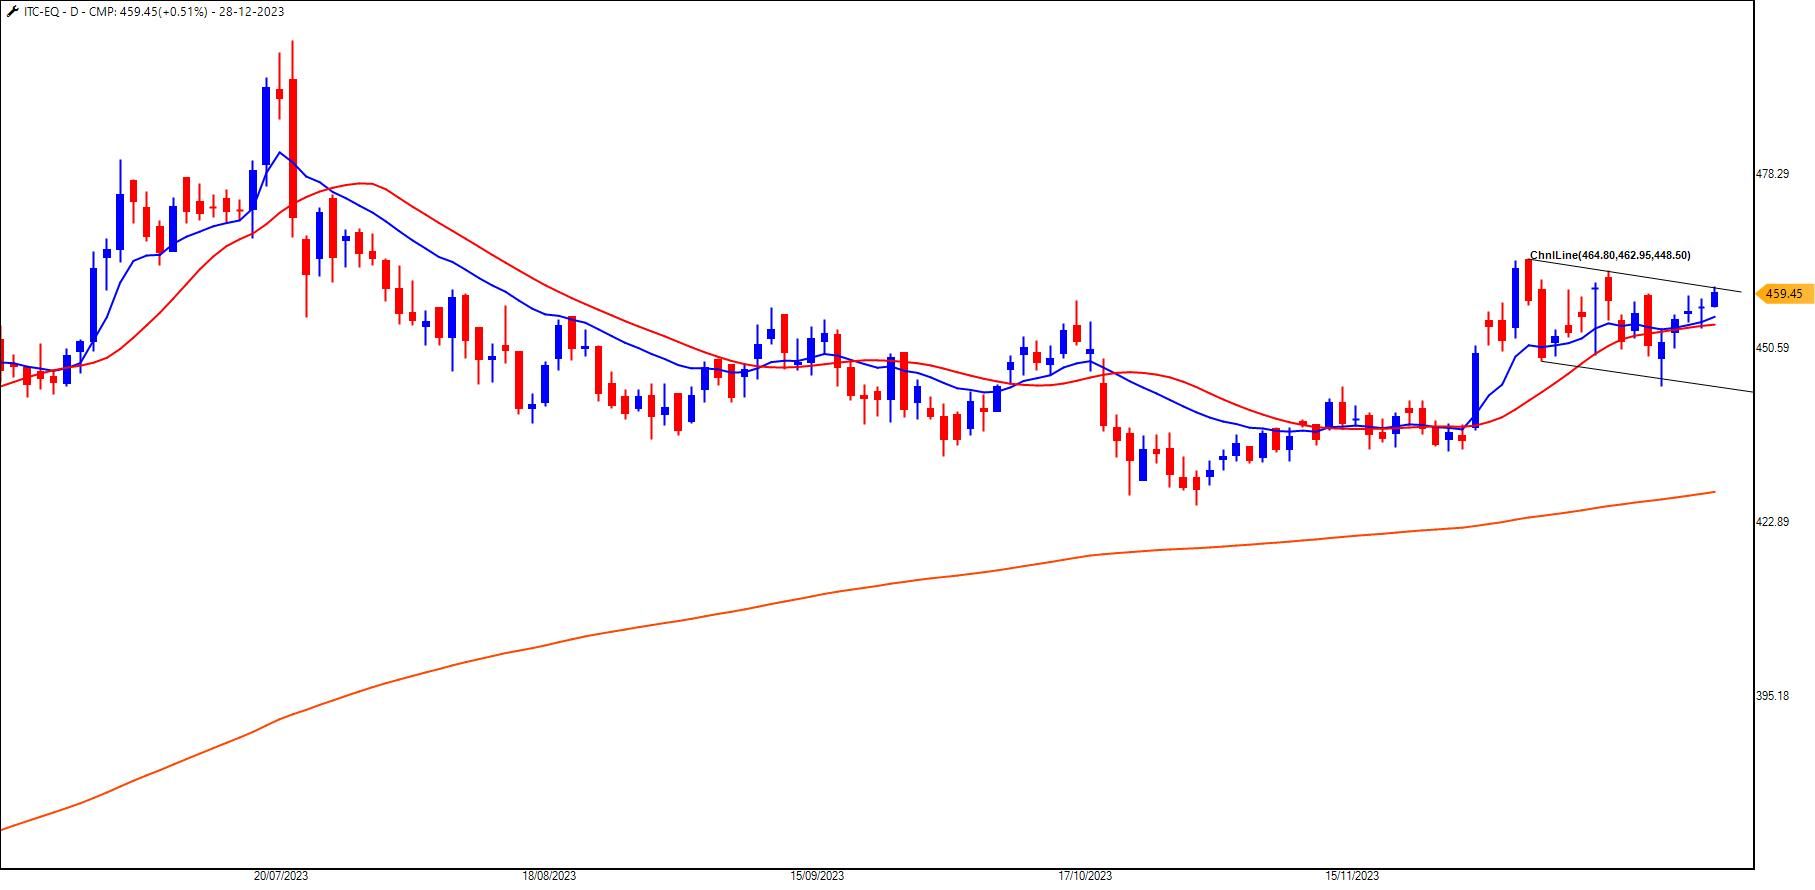
Happy Trading!
-
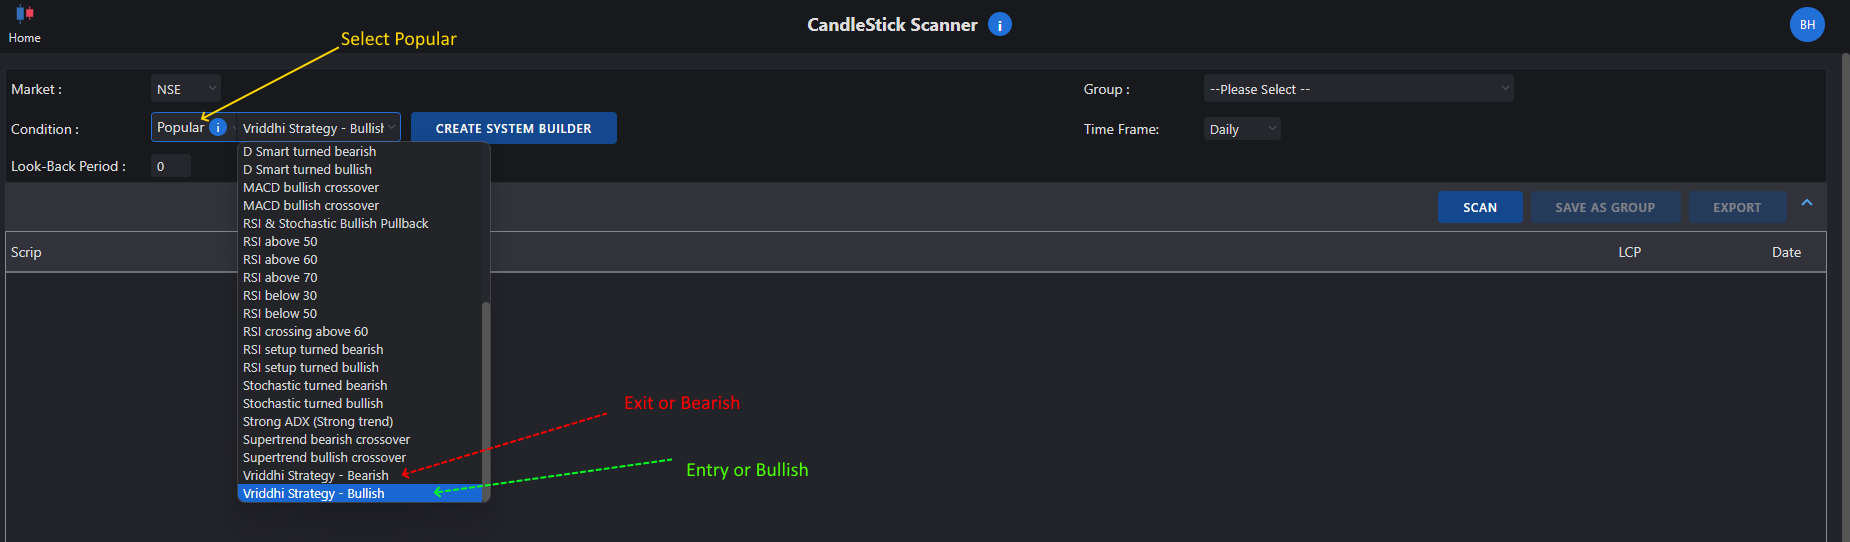
@Shyam S Sir follow these steps
Price Scanner > Candlestick Scanner > Under Conditions Select "Popular" > Next to that, you will find "Vriddhi Strategy"
-
@Rajeev Goyal Sure. How about a video on this pattern?
-
Good Morning Siddharthji,
You can watch this video on TOI explained by @AP and @Raghunath-Reddy
https://www.youtube.com/watch?v=MRZ8epTK-PY -
@Rajeev Talasikar Good to know you are following this pattern.
-
@Debarchan Ghosh Dastidar I haven't tried MRS so unable to comment as of now. Let me go through this Indicator.
-
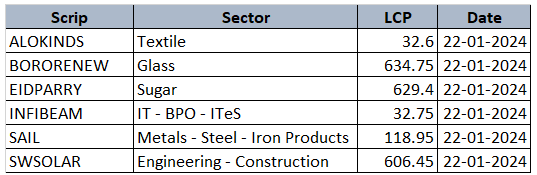
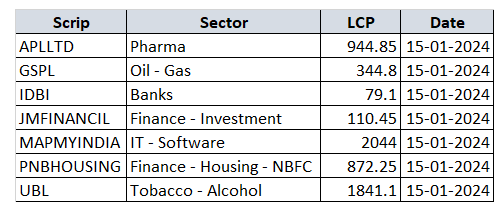
Good Morning Readers!
As I sat sipping my morning tea and being a trader, you tend look at charts
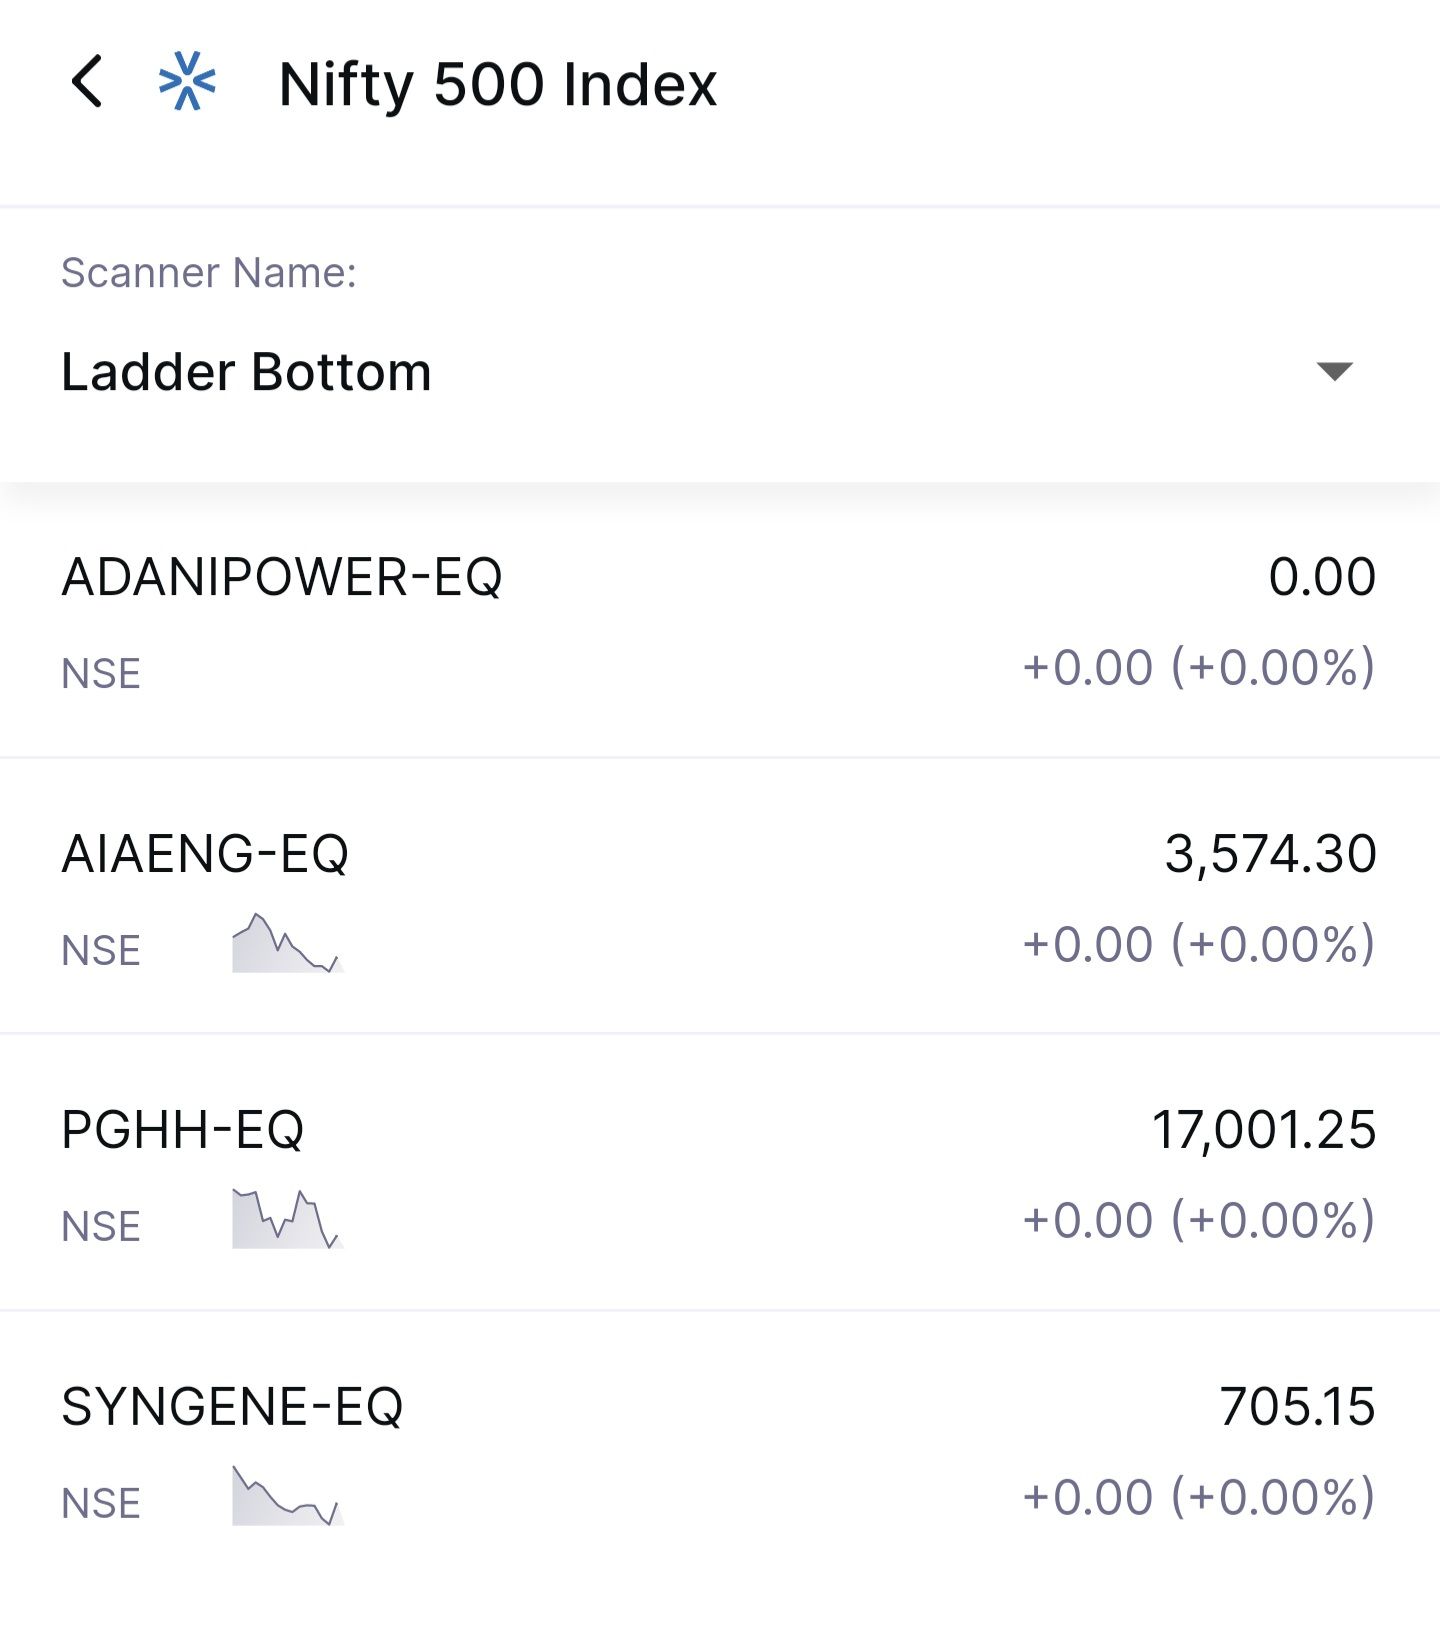
searching for potential momentum opportunities for the day.In the bullish trending markets, I always prefer the Ladder Bottom Candlestick Pattern.
The Ladder Bottom Candlestick Pattern is a compelling indicator used in technical analysis to identify potential bullish reversals. This pattern usually emerges after a downtrend and signifies a shift in market sentiment, suggesting that buyers are gaining control.
Characterized by a series of candlesticks with small real bodies and long lower shadows, the Ladder Bottom Pattern visually resembles a ladder, with each candlestick forming a distinct rung.
In the stock trading, having tools that can swiftly analyze and present data is invaluable. Personally, I use the Zone Mobile App to effortlessly scan through stocks and identify potential opportunities. With just a click of a button, I can access a curated list of stocks, making my morning routine more efficient.
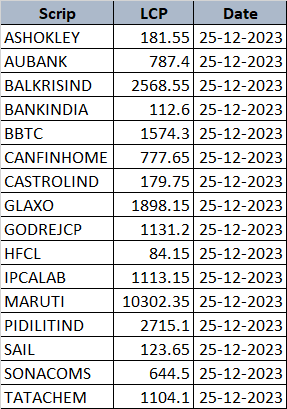
As of the closing on December 22nd, 2023, here is a list of stocks were the pattern exists.
Have a Great Trading Day!
-
Stock List - 23rd December 2023
-
Last weekend at our Manthan event in Hyderabad, we had a session on Options but uncovered some fascinating insights during our Trader's Meet.
Seeing how many traders, despite the recent market rally, found themselves held back by psychological barriers was eye-opening.
In this video, I share our candid discussions about the mental hurdles that often hinder trading success. Many admitted to missing out on the rally due to the recurring thought, "Isse Jyada Market Kya Jayega"
I explore the following crucial parameters that I believe every trader should pay attention to:
- Fear, Greed, and Impatience
- Unrealistic Turning Realistic
- Patience and Discipline
- Risk Management
- Building a Support System of Traders
Whether you're a seasoned trader or just starting out, this video provides valuable insights to help you overcome psychological barriers and elevate your trading game. Don't let your mindset limit your potential profits!
Watch Video here https://www.youtube.com/watch?v=Se2FxzYU9HQ
-
@Rajeev Talasikar It works on all TF.
-
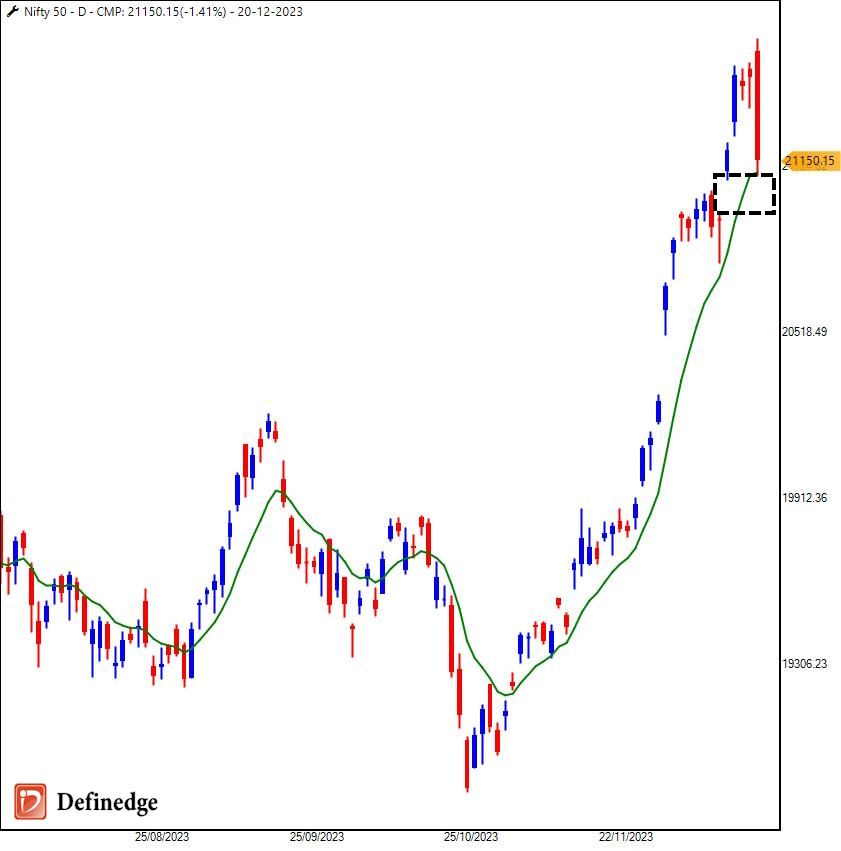
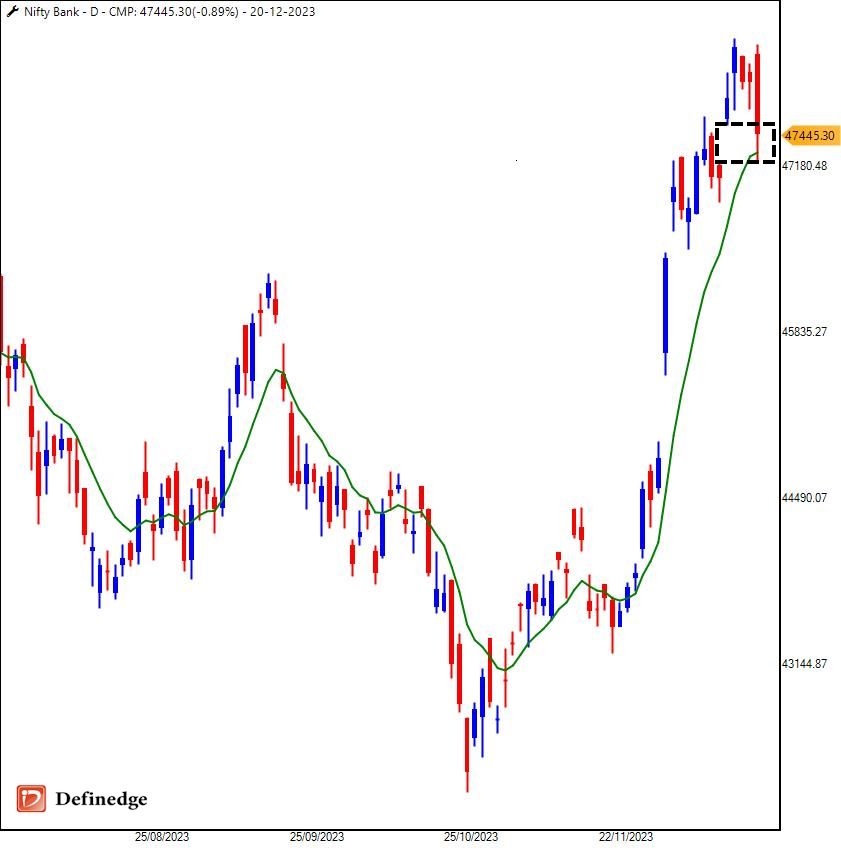
The bulls have a ray of hope on Nifty and Bank Nifty as the indices have multiple support areas at 10DEMA and the gaps.
The levels of 20,900-20,950 on Nifty and 46,700-46,900 on Bank Nifty will be crucial. If bears take control below these levels, the bearish momentum may accelerate.
Nifty Daily Chart
Bank Nifty Daily Chart
Happy Trading!
-
In the aftermath of reaching an all-time high during the early hours of the trading session yesterday, the Indian equity markets experienced a notable shift in momentum as the day progressed. The latter half of the trading day was notably dominated by bears, with the market sentiment taking a downturn.
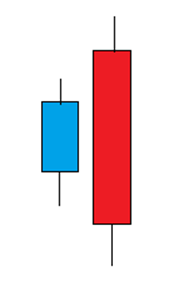
Amidst this bearish turn, one particular candlestick pattern that swiftly comes to mind, even without glancing at the charts, is the Bearish Engulfing pattern.
The Bearish Engulfing Candlestick pattern is a significant reversal pattern in technical analysis that often signals a potential trend reversal from bullish to bearish. This pattern consists of two candles, with the first being a smaller bullish candle followed by a larger bearish candle that completely engulfs the body of the preceding candle.
The practical aspect of the Bearish Engulfing pattern lies in its ability to reflect a shift in market sentiment. When this pattern occurs after a prolonged uptrend, it suggests that the bears have gained control, overpowering the bulls and potentially indicating a reversal in the prevailing trend. Traders consider selling or taking short positions, anticipating a downward price movement.
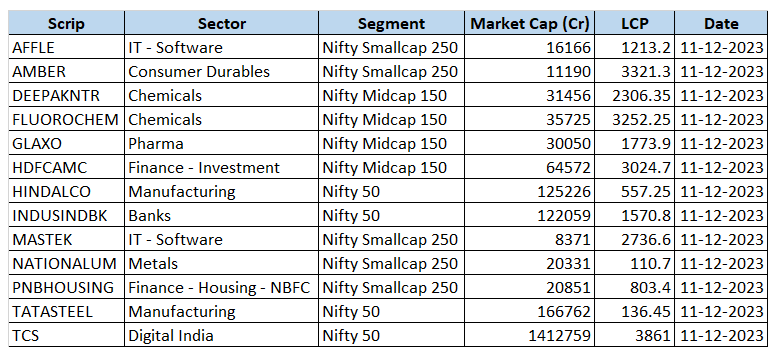
Here are some stats of sectorial indices and stocks were Bearish Engulfing pattern is visible.
Let's look at the stats on the number of stocks were this bearish pattern is visible.
I have scanned this pattern using the scanner feature of RZone.
You can find the stocks list by following this steps.
- Go to Price Scanner
- Select Candlestick Scanner
- Select the Group
- Under Condition, Select Engulfing Pattern Bearish
- Finally, Click on Scan and you are ready with the stock list.
Have a Happy Trading Day!
-
@Ravi Shinde Well said sir.
-
@Pramathesh Shrivastav Thanks Pramatheshji
-
The Nifty had a correction of 400 points from the high today, triggering a wave of reactions across social media platforms. The online financial community is immersed in discussions about overbought breadth, overbought Relative Strength Index (RSI), and various other technical indicators that enthusiasts believe shed light on the market's health.
Is it necessary to find the reason for every move that happens in the stock market?
Some argue that understanding the cause behind market movements is crucial, while others assert that successful trading is about anticipating moves rather than playing detective after the fact.If I ask you, "Are you a Trader or a Forensic expert?" - What is your answer...
The Trader's Approach:
For a trader, success lies in making informed decisions based on analysis and strategy before market moves unfold. Traders must set predefined levels, establish entry and exit points, and employ technical and fundamental analysis to anticipate future price actions.The trader's mindset revolves around proactive decision-making. Before executing a trade, a trader formulates a hypothesis based on market trends, economic indicators, and other relevant factors. The emphasis is on staying ahead of the curve and making strategic moves that align with a well-thought-out plan. Traders thrive on disciplined execution and risk management, minimizing the need to find the reason behind every market swing.
The Forensic Expert's Perspective:
On the other hand, a forensic expert in the stock market is someone who deep dives into the reasons behind price movements after they occur. This retrospective analysis involves scrutinizing news, financial reports, geopolitical events, and other factors that may have influenced the market. While understanding the root causes of past movements can provide valuable insights, it may not be the primary focus of a trader.They aim to decipher the narrative of the market, unravelling the mysteries left behind by past events. This approach can be informative but may not be as actionable for those seeking to trade in real-time actively.
The Balance between Trading and Forensic Expertise:
In reality, successful market participants may incorporate trading and forensic expertise elements. While traders focus on proactive decision-making, understanding the broader market context and the reasons behind historical movements can enhance their overall market awareness.The key lies in finding a balance that aligns with individual goals and preferences. Traders may incorporate forensic analysis elements into their strategy to better understand market dynamics. Likewise, forensic experts may adopt a more forward-looking approach to complement their retrospective analysis.
Whether you consider yourself a trader or a forensic expert, the stock market offers a diverse playground for those seeking to navigate its complexities. While traders prioritise anticipating moves based on proactive analysis, forensic experts uncover the reasons behind market actions after the fact. Ultimately, the ideal approach may involve a blend of both perspectives, striking a balance that enhances one's ability to navigate the ever-evolving landscape of the stock market.
-
In India, gold has long been regarded as many investors' first preference over equity. The cultural significance attached to gold and its historic role as a store of value has ingrained a deep-seated trust in the precious metal among Indian households.
Traditionally, gold has been perceived as a symbol of wealth and security, often passed down through generations as a form of inheritance. Additionally, the stability and tangible nature of gold investments resonates well with the risk-averse nature of a significant portion of the Indian investor base.
While equity markets offer the potential for higher returns, the allure of gold persists due to its perceived safety and enduring value, making it the cornerstone of investment portfolios for many Indian investors.
With the evolving investment options in Gold, Sovereign Gold Bonds (SGBs) have emerged as a compelling choice for investors, especially in the Indian market.
With the current price of Rs. 6,149 per gram, the question arises: Should you invest in Sovereign Gold Bonds?
Let's look into the advantages of Sovereign Gold Bonds, considering the prevailing price and associated features.
-
Interest-Earning Potential:
One of the primary attractions of Sovereign Gold Bonds is their interest rate. At 2.5%, this rate is higher than physical gold investments typically provide. In a scenario where gold prices may change, the interest earnings act as a buffer, ensuring investors gain even if the gold prices remain stagnant or experience a moderate rise. -
Hedge Against Inflation:
Gold has historically been considered a hedge against inflation. By investing in Sovereign Gold Bonds, investors gain exposure to the price movements of gold and secure an additional 2.5% interest. This dual benefit can be advantageous in maintaining the actual value of the investment in the face of inflationary pressures. -
Lock-in Period and Future Planning:
The locking period of 5 years for Sovereign Gold Bonds encourages a long-term investment horizon. This feature aligns with the traditional role of gold in preserving wealth over time. Investors looking to hedge against future uncertainties or those with a strategic perspective on gold prices may find this locking period advantageous. It provides a stable foundation for financial planning, especially for long-term goals. -
Capital Gains Tax Exemption:
Sovereign Gold Bonds offer a tax advantage over physical gold. The capital gains arising from the redemption of these bonds are exempted if held until maturity. This exemption adds a layer of tax efficiency to the investment, making it an attractive option for those mindful of tax implications. -
No Storage Hassles:
Unlike physical gold, Sovereign Gold Bonds eliminate the need for safe storage arrangements. Investors can participate in the gold market without worrying about the security and insurance costs of storing physical gold. This feature adds to the convenience of investing in gold through bonds.
These are the few advantages to investing in Sovereign Gold Bonds, but does the long-term trend look promising to invest?
Let’s look at the medium to long-term chart of MCX Gold price which are related to the spot prices.
MCX Gold Price Chart
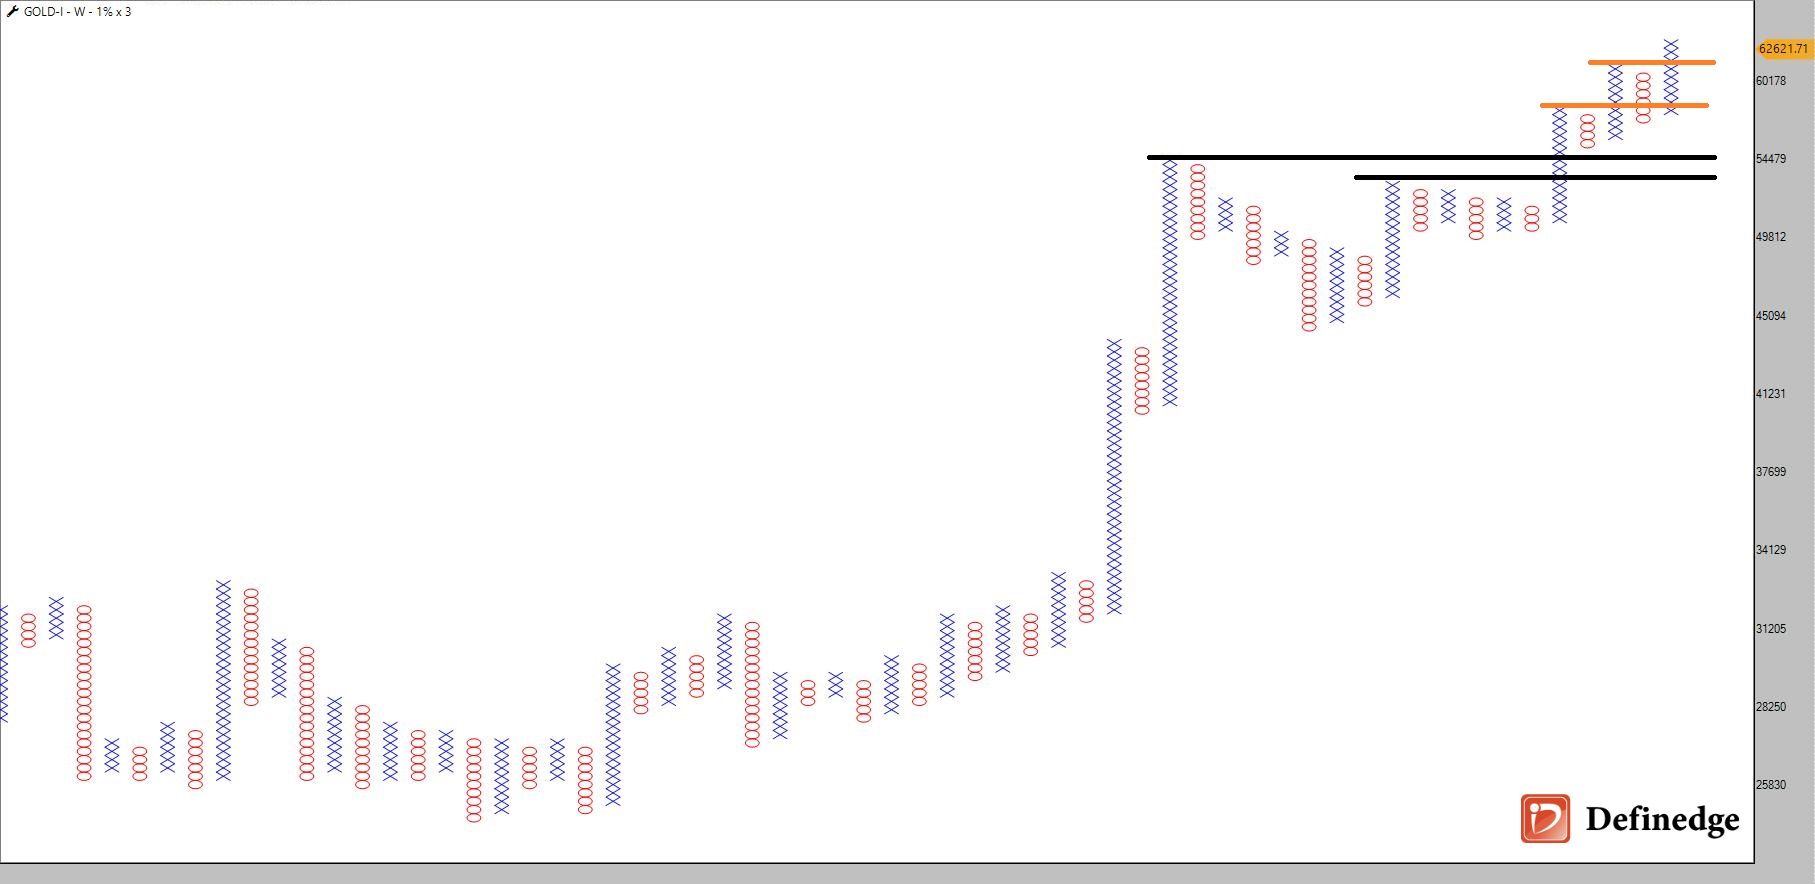
Source: TradePointThe Point and Figure (P&F) weekly chart for Gold is currently exhibiting a bullish trend, having successfully breached the resistance zone delineated by two black horizontal lines.
The breakout is further supported by a succession of Double Top Buy signals, signalling the potential for a sustained upward trajectory. This chart pattern strongly indicates that the price of gold is on an upward trend, with the Double Top Buy signals suggesting a continuation of the bullish momentum.
The positive outlook on the P&F chart augurs well for investors, implying that there may be more favourable opportunities and potential gains in store for those involved in the gold market.
In conclusion, investing in Sovereign Gold Bonds at the current price of Rs. 6,149/gm presents a compelling opportunity for investors in the Indian market. The 2.5% interest rate and the 5-year locking period are a strategic hedge against potential gold price fluctuations. Additionally, the tax benefits and the absence of storage concerns make SGBs attractive for those seeking exposure to gold while optimising their investment portfolio.
-
-
ధన్యవాదాలు హైదరాబాద్ - Thank You Hyderabad!
On Saturday, 16th December 2023, Hyderabad witnessed a financial extravaganza as over 100 participants gathered for the much-anticipated Manthan event. Interestingly, we had participants from cities like Delhi, Bangalore, Jalna and many more.

The overwhelming response resulted in a fully booked venue, leaving us with sincere apologies to those who missed out on this enriching experience. The success of the event was owed entirely to the enthusiastic participation of our attendees, and we extend our gratitude to each one of them.
Event Highlights:
-
Options Greeks Unveiled by Raghunath Reddy:
The event commenced with an insightful session by Raghunath Reddy on Options Greeks and various strategic approaches. A notable highlight was the participant's extensive use of the Options Strategy Builder in Opstra. To know more about Opstra's features, Click here.
The engagement and interest in these advanced strategies showcased the participant's dedication to mastering the intricacies of options trading. -
P&F Charting Essentials with Prashant Shah:
Prashant Shah, CEO of Definedge, took the stage to explain the basics of P&F charting and share insights into stock selection through the Relative Strength feature. The positive response indicated that many participants had already utilised P&F charts, while others found the subject intriguing.
For those seeking free charts, a valuable resource awaits at www.definedgesecurities.com, where enthusiasts can sign up for access to comprehensive charting tools. -
Abhijit Phatak's Insightful Session on TOI:
The final session featured Abhijit Phatak, a renowned options trader known for using charts to identify trading opportunities. He emphasized the significance of understanding trends through the use of Straddles. The session gave participants a deeper understanding of practical trend analysis and options trading strategies.
At Definedge, we believe in empowering subscribers to be independent traders. The commitment to providing valuable insights showcased through videos and forums, was well-received by participants who expressed their appreciation during the event.
Once again, our heartfelt thanks to all the participants for their active involvement and contribution to Manthan's success. The event wouldn't have been as impactful without the enthusiasm and engagement of each attendee.
If you were among the attendees at Manthan, we invite you to share your experiences and insights in the comments below. Your feedback is valuable, and it will contribute to making future events even more enriching for the financial community.
-
-
Stock List - 16th December 2023
-
@Subramanya Joshi RSI100 and Donchian 62period on Weekly chart
-
@ASHISH MAURYA Ashishji, check the Definedge Media index, an equal-weighted media index because Nifty Media depends on the move of Zeel and SunTV due to their high weights. In contrast, equal-weighted will give you a clear picture.
-
The Indian stock market recently witnessed a bullish surge following the Federal Reserve’s indication of potential rate cuts in 2024. This positive sentiment reverberated globally, with the Dow Jones reaching a historic high of 37,094. The Nifty and Sensex also opened with a substantial gap, signalling a buoyant market atmosphere.
In the middle of this excitement, one stock that caught the attention of hot stock chasers is NBCC India Ltd.
NBCC India Ltd: A Hot Stock in the Headlines
NBCC India Ltd made headlines by securing a significant order worth Rs. 1,500 crores, propelling its stock to a 52-week high with an impressive gain of over 3%. For hot stock chasers eager to capitalize on the news, assessing whether it’s the right time to enter the market or if they might already be late to the party is crucial.NBCC Weekly Heikin Ashi Chart
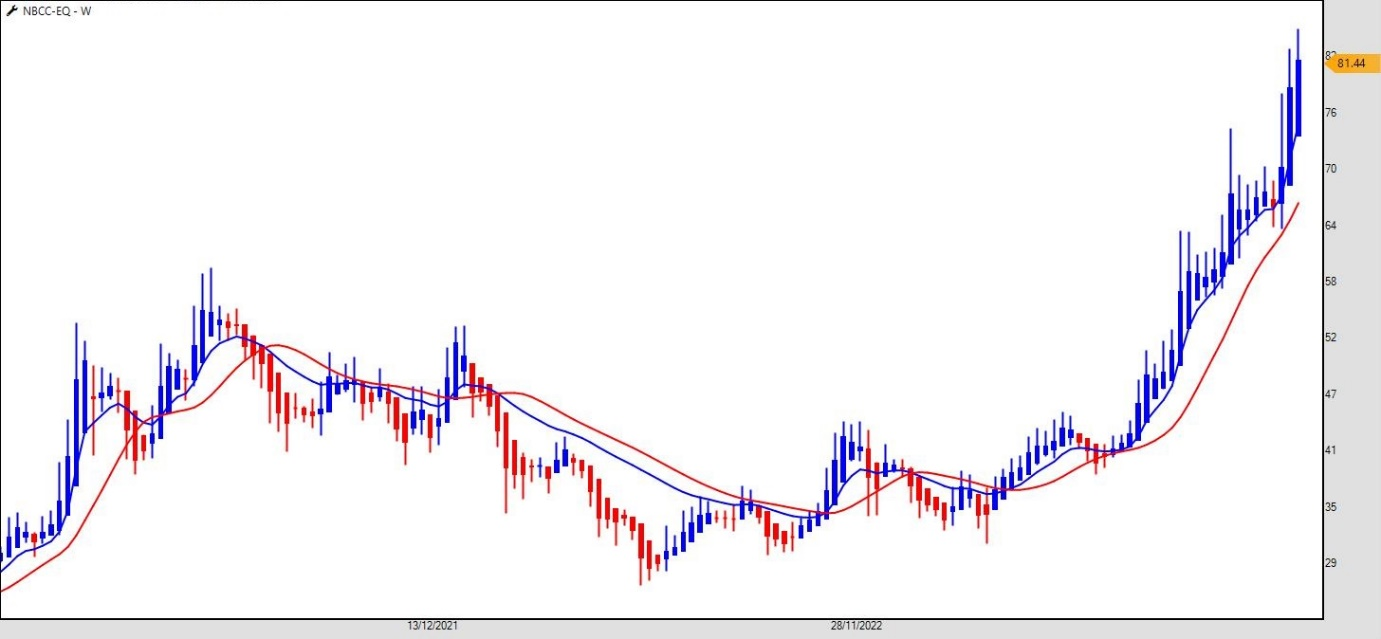
Source: TradePointFor a more informed decision, let’s turn our attention to technical indicators, specifically the Adaptive Relative Strength Index (ARSI) and Heikin Ashi. These tools provide valuable insights into the stock’s current trend and potential future movements.
1. Adaptive Relative Strength Index (ARSI):
The ARSI, available exclusively in TradePoint by Definedge, evaluates both strength and volatility, resembling a moving average. Observing the chart, the ARSI has been in a bullish mode since the stock was at Rs. 36. The positive crossover at this level indicated a bullish scenario, while the breakout above Rs. 44 confirmed a bottoming structure on the chart.2. Heikin Ashi:
Heikin Ashi, a popular trend-following indicator, displays candlestick patterns that help identify the strength and direction of a trend. Remarkably, since the bullish crossover and breakout, there hasn’t been a single bearish Heikin Ashi candle on the chart, reinforcing the sustained bullish sentiment.As tempting as it might be for hot stock chasers to jump in based on recent positive news, it’s crucial to heed the signals provided by technical indicators. In the case of NBCC India Ltd, the Adaptive RSI and Heikin Ashi have consistently shown bullish trends, with no signs of a reversal.
The chart speaks volumes, and hot stock chasers should consider these indicators before making hasty decisions. Timing is everything in the stock market, and understanding the signals can help traders make more informed and strategic investment choices.
So, are you a hot stock chaser? Don’t let the charts leave you behind – pay attention, analyse, and make decisions wisely.
-
In the raging bull market, everyone is eager to make money. The pigs are always on their toes to gain while the sheep will use all their contacts to get the stock tips.
But which stocks should you buy? Bluechips, midcaps, or smallcaps?
The recent market dynamics have seen an extraordinary surge, with every dip being aggressively bought by both Domestic Institutional Investors (DIIs) and retail investors.
The paradox lies in the fact that blue-chip stocks have not performed as anticipated despite the Nifty reaching all-time highs.
Let’s get into the ratio analysis of Nifty50, Midcap100, and SmallCap100 and compare them with the broader market index, Nifty500.
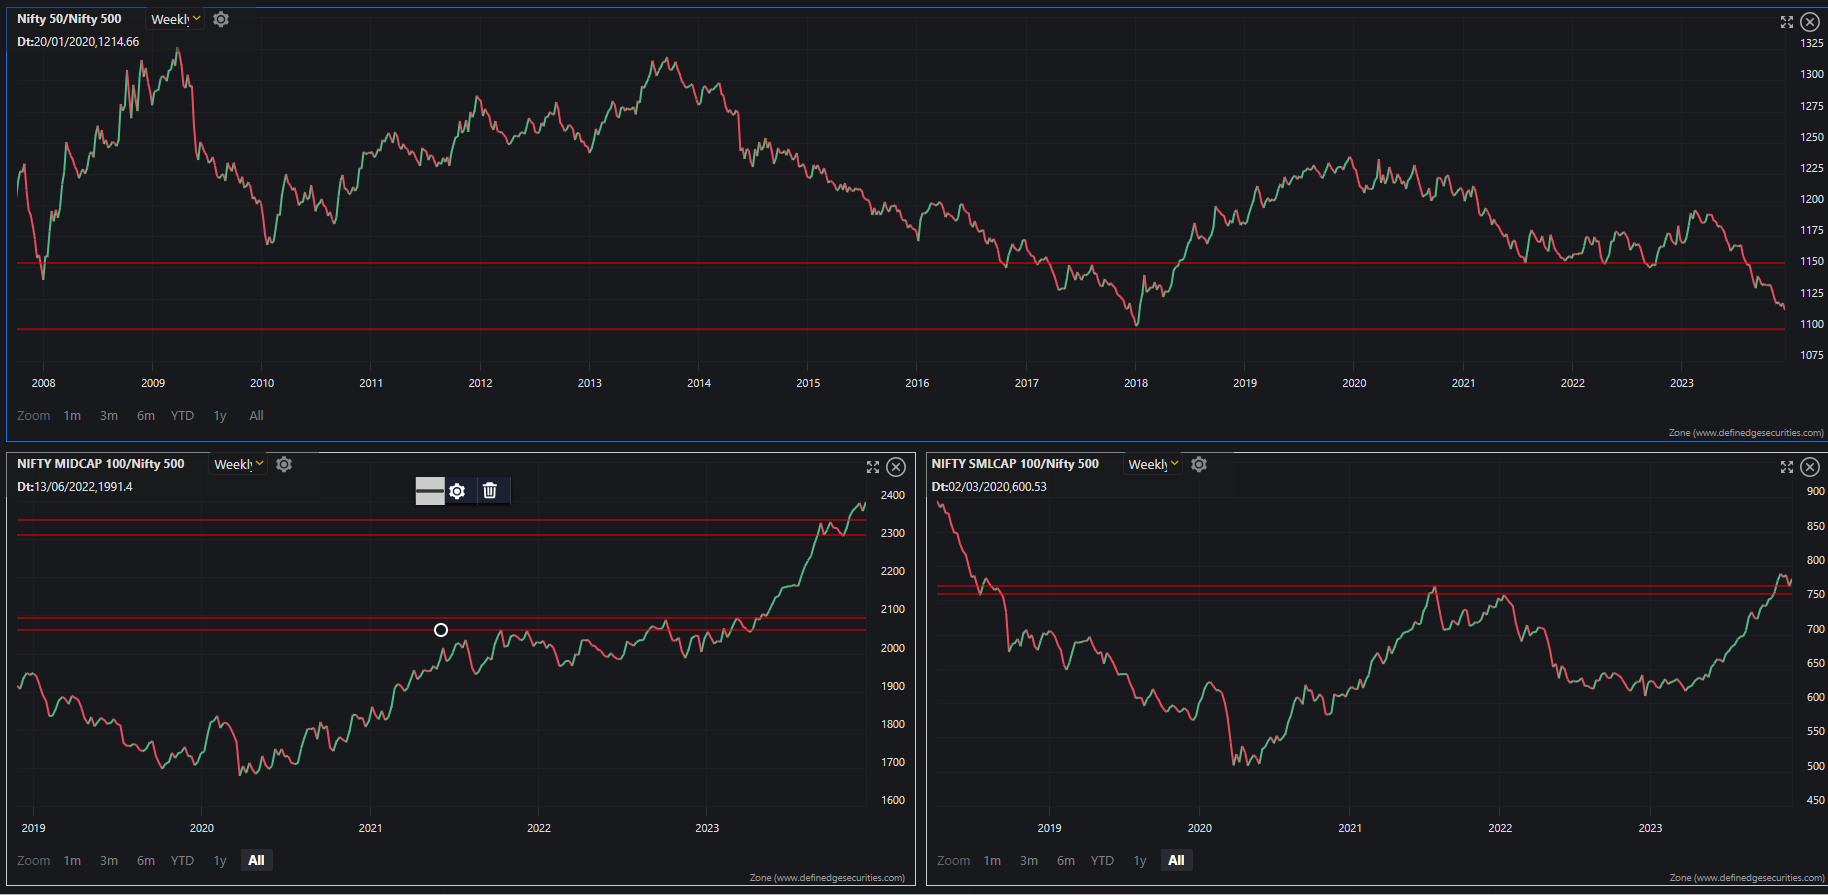
Source: Zone Web, DefinedgeNifty50 vs. Nifty500
If you want to make it big,forget the bluechipsor Nifty50 stocks. The Nifty50/Nifty500 ratio chart shows that bluechips have underperformed the broader market.Nifty Midcap100 vs. Nifty500
The Nifty Midcap100/Nifty500 ratio chart is trending at an all-time high. This means that midcap stocks are outperforming the broader market. Midcap stocks current trend is like Virat Kohli hitting a cover drive - they are offering a lot of opportunities for growth.Nifty SmallCap100 vs. Nifty500
The Nifty SmallCap100/Nifty500 ratio chart has just broken out from its technical resistance. This means that smallcap stocks are poised for a rally. However, smallcap stocks are also more volatile than midcap and bluechip stocks.So, what should you buy?
It depends on your risk tolerance. If you are risk-averse, you should stick to bluechip stocks. If willing to take on more risk, you could consider midcap or smallcap stocks.
The comment section awaits your insights – what segment are you favoring in this dynamic market? Share your thoughts below.
-
Herd mentality is a phenomenon that often grips traders and investors, especially during market euphoria.
As the Nifty Metals index witnesses a robust rally, it becomes crucial for market participants to discern whether they should follow the herd or exercise caution.
In this article, I have highlighted crucial technical patterns that suggest a potential reversal in the prevailing bullish trend on the chart of the Nifty Metals index.
November saw the Nifty Metals index surge by an impressive 8.76%, and the momentum carried forward into the first half of December with an additional gain of 6% to ~7,500. While such gains may be enticing for many investors, it's essential to take a closer look at the technical aspects of the market to avoid succumbing to herd mentality.
Nifty Metals Index, Daily Chart
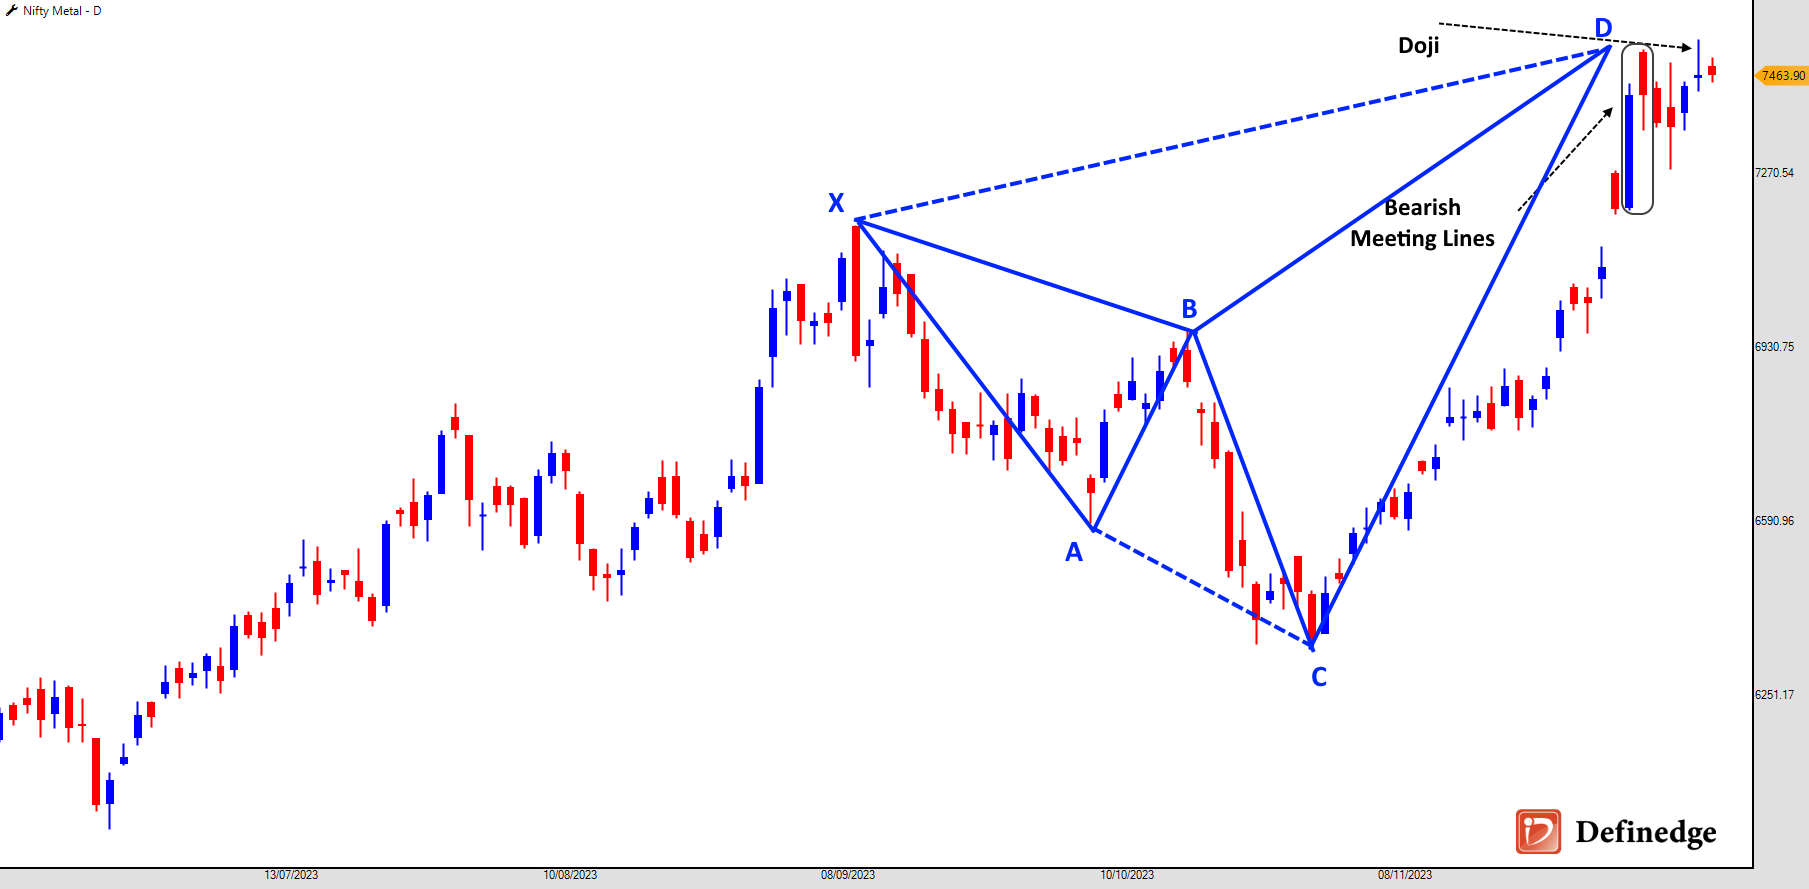
Source: TradePoint, Definedge-
Bearish Harmonic Pattern:
A bearish harmonic pattern is visible on the daily chart of the Nifty Metals Index. The bearish harmonic pattern indicates a potential reversal in the ongoing uptrend. The harmonic patterns help to identify key turning points in the market. -
Bearish Meeting Lines Candlestick Pattern:
The bearish meeting lines candlestick pattern is another noteworthy signal on the chart. This pattern occurs when two consecutive candlesticks have almost the same closing prices but differ in their overall trend. In this case, the bearish meeting lines pattern suggests a potential shift in sentiment from bullish to bearish. -
Doji Candlestick Pattern:
The appearance of a Doji candlestick on the chart adds another layer of complexity to the analysis. A Doji occurs when the opening and closing prices are virtually the same, signalling indecision in the market. In the Nifty Metals Index context, the Doji pattern may indicate a struggle between buyers and sellers at the highest levels, potentially heralding a reversal.
To sum up, with the recent bullish run in the Nifty Metals Index, investors must exercise prudence and not blindly follow the crowd. The presence of bearish harmonic patterns, bearish meeting lines candlestick patterns, and Doji candlestick patterns on the daily chart suggest the potential exhaustion of bullish momentum. Traders and investors should consider these technical signals and conduct further research before making investment decisions.
-
-
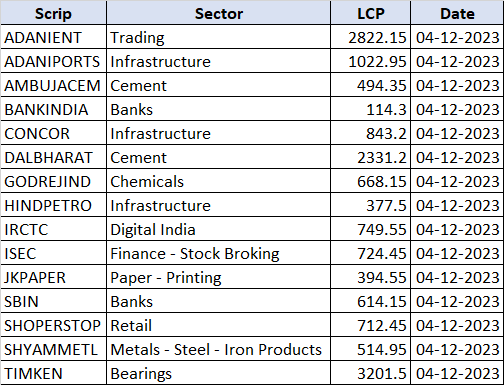
Here is the list of stocks trending around the Ceiling of Darvas Box on an hourly chart. This is generated using Darvas Box scanner.

-
Prices are reflecteing on the TradePoint desktop app while on RZone; it will be solved in the following software updates. Sorry for the inconvenience.
-
@Ritesh Badai Team is working on it.
-
@OMESH YADAV
Risk-Reward Ratio is a measure of the potential profit compared to the potential loss in a trade. It is calculated by dividing the potential reward (profit) by the potential risk (loss). Anything above 2 is considered good.Expectancy is a measure of the average amount of profit or loss that can be expected per unit of risk over a series of trades. A positive value implies that, on average, each trade contributes positively to the account balance. The higher the positive expectancy, the better.
-
@Krushnakumar Rathi Will check sir.
-
Stock List - 9th December 2023
-
@Sugapriya Thimma As the data date changes, the back testing results will change for any strategy.
-
@Rajeev Talasikar You can use any based on your trading style.
I would prefer daily to catch momentum in bullish stock while weekly will give you emerging medium-term trend.
-
How do you find trading stocks when markets are trending at an all-time high?
A trader is constantly in fear of the downside when the market is trading at an all-time high, like the rally we witnessed this week.
There are a few questions in his mind:
- The market is overheated, should I buy now?
- What if the market retraces or reverses from the current level?
- The stop-losses are deep, is it the right time to enter the market?
All these questions might be in your mind too, right?
It's always difficult to catch the running markets, be it bullish or bearish. As Paul Tudor Jones said, “The meat is not in the middle of the trend but it is when you catch tops and bottoms.”
He is Paul Tudor Jones - a successful trader, but catching tops and bottoms is not everyone’s cup of tea.
Some traders wish to play the momentum and catch the trend as much as they can.
For them, this is one study you should look at – it is Darvas Box.The Darvas Box is a technical analysis tool used in stock trading by Nicolas Darvas, a dancer turned self-taught investor. Darvas achieved significant success in the stock market during the 1950s, and he detailed his trading methods in his book, "How I Made $2,000,000 in the Stock Market."
The Darvas Box visually represents price movements and helps traders identify potential breakout and breakdown points. The method is based on the idea that stocks tend to trade within a specific range before making a significant move. The key components of the Darvas Box include:
1. Box Formation:
Darvas identified a stock trading in a narrow price range, forming a box on the price chart. This box is created by drawing horizontal lines at the upper and lower boundaries of the recent trading range.2. Volume Confirmation:
Darvas also paid attention to the volume associated with the stock's price movements. He believed that a breakout or breakdown from the box should be accompanied by increased volume, confirming the move's strength.3. Buy Signal:
Darvas would initiate a buy position when the stock's price broke out above the upper boundary of the box, and this breakout was confirmed by higher-than-average trading volume.4. Stop-Loss Placement:
To manage risk, Darvas set a stop-loss just below the lower boundary of the box. He would exit the trade to limit losses if the price fell back into the box, indicating a potential false breakout.5. Trailing the Box:
As the stock price continued to rise, Darvas would adjust the upper boundary of the box to capture the ongoing trend. This allowed him to ride the upward momentum while protecting profits by adjusting the stop-loss.6. Sell Signal:
Darvas would sell his position when the price fell below the lower boundary of the box on increased volume, signalling a potential reversal or breakdown.It's important to note that while the Darvas Box method gained popularity and has been used by some traders, it is not foolproof. Like any trading strategy, it comes with risks, and market conditions can change.
Traders should consider using the Darvas Box as part of a comprehensive trading plan and incorporate risk management techniques to enhance their chances of success.
At Definedge, we believe in simplifying the trading experience with our unique trading platforms, Trade Point and RZone.
We have an inbuilt Smart Scanner to filter the stocks at the ceiling or break out of the Darvas Box.
Ceiling:
The ceiling, also known as the "top" or "upper boundary," is the highest price level a stock reaches within a specific period. In the context of the Darvas Box, the upper limit of the price range forms a box on the chart.Breakout:
The breakout occurs when the stock's price moves above the upper boundary or ceiling of the Darvas Box. This is a crucial event for traders following the Darvas method, as it signals a potential upward trend and an opportunity to enter a long (buy) position.
While using a scanner, the user needs to select the breakout stocks or stocks on the verge of breakout (ceiling).Here is how you can go to the Darvas Box scanner.
The sample result from the scanner is attached from the group of NSE All Indices.
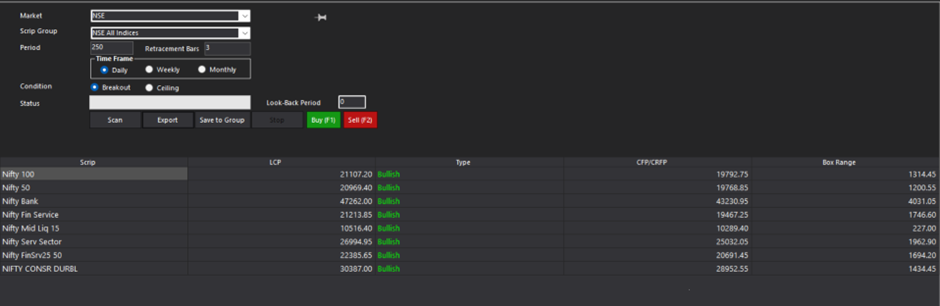
Source: Tradepoint, Definedge SecuritiesIf you use the Darvas Box scanner, share your experience in the comment below.
-
@RAGUNATH_AG Will check sir.
-
@Deven Shah Yes it works on any stock. You can even backtest the performance of each stock.
-
@RAGUNATH_AG It's already there in the Public condition.
-
Nifty50 was just an example to highlight. You can select any group or your group.
We have an inbuilt scanner for Entry and Exit in RZone Scanners, you can explore it.
-
Re: Vriddhi Strategy {Long Only}
As promised, we have added Vriddhi Scanner to our Candlestick Scanners in RZone.
-
@Somen Sangani Not yet.
-
The primary objective of the Vriddhi strategy is to identify and capitalize on bullish opportunities in the stock market. The strategy focuses on stocks in a bullish trend by meeting two critical criteria: being above their long-term 200-Day Exponential Moving Average (200DEMA) and signalling bullish momentum through a positive crossover of the Adaptive Relative Strength Index (ARSI).
Here is the backtesting result on the current Nifty50 stocks:
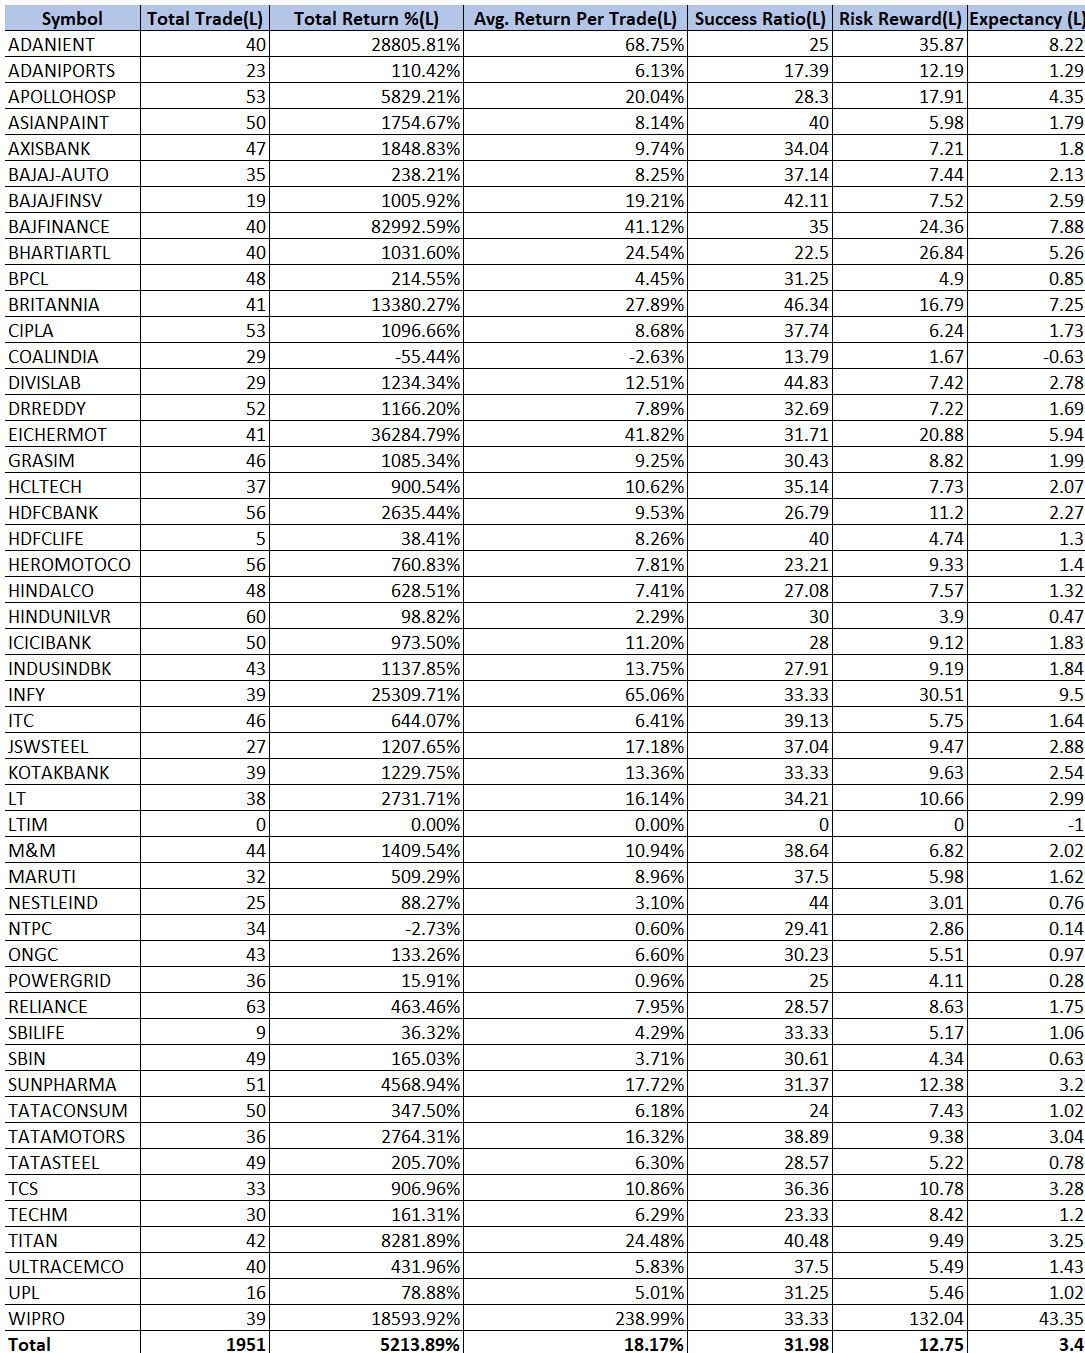
Source: Definedge ScannerThis scanner will be available soon to existing Definedge Securities users.
-
@PRANAV GULABANI Yes they do.
Check ICICI Bank Weekly chart on the same Super Trend parameters. Also check similar structure on Axis Bank when it was around 930.
-
@Vishal Shah Will check with Team and update.
-
@Sharad Girad Soon Sir....Patience is the key to ride the trade
-
Re: My Indicator Signals Hurdle at 20366 on Nifty
Human psychology is inherently inclined to adapt to acquired knowledge, and this inclination is equally applicable to traders.
In my 17 years of engagement with thousands of traders, each on their quest for the holy grail. If you're one of those traders relentlessly looking for that perfect strategy, then DON'T READ THIS ARTICLE.
The technical analysis arsenal is vast, comprising thousands of patterns and hundreds of indicators. Over the years, I've learned that the key to success lies not in mastering every tool available but in carefully selecting a few that align with your unique trading style.
Before filtering through indicators, it's imperative to grasp the fundamental aspects of each. This foundational knowledge serves as the bedrock upon which successful trading strategies are built. Read for free on pattern and indicators here
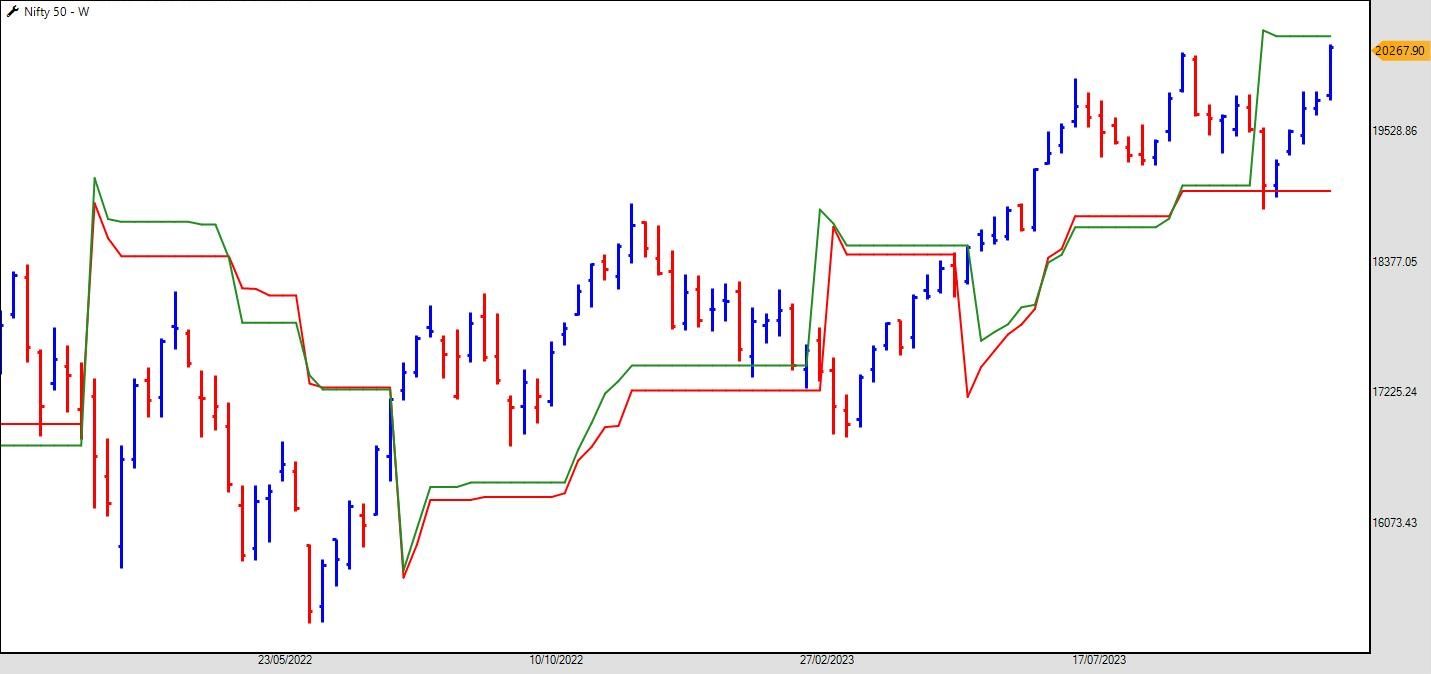
On the weekend, I shared insights into the modification of the Super-Trend indicator's period, pinpointing a resistance zone at 20,366. You might have been intrigued by the seemingly arbitrary numbers 5 and 13. I addressed the 'why' behind these choices, but the true beauty of the Super Trend lies in its remarkable adaptability to ever-changing market conditions.
Here is an updated chart of Nifty - Weekly.
Reflecting on the past week, which concluded on a high note with Mumbai's bars abuzz with stock market traders, I was celebrating too
.The 5-week Super Trend prominently signalled resistance at an all-time high (ATH). Did you sense something suspicious in the air?
We humans always love the good things, but sometimes the role of devil's advocate is important too and that was played by my 5-week Super Trend.
Historically, whenever the index breaches the 5-week and 13-week Super Trend range, the ensuing trend mirrors the intensity of Vin Diesel driving in Fast & Furious.
The journey through the complexities of trading has taught me the importance of adaptability and the selective mastery of tools. Instead of chasing the unattainable holy grail, focus on understanding the fundamentals of indicators and customizing them to suit your individual preferences.
-
If you have read this, You didn't miss Adani

Re: Emerging Trend on Adani Stocks – Says our Exclusive Indicator
-
Options trading involves buying and selling financial contracts known as options. Options give you the right, but not the obligation, to buy or sell an underlying asset (such as stocks) at a predetermined price before a specified expiration date. There are two main types of options: call options and put options.
With more than 180 million users, ChatGPT is valuable for theoretical knowledge. However, when engaged in trading, practical knowledge holds equal significance. Let's begin by examining the information provided by ChatGPT.
Here's a basic overview of how options trading works:
-
Understand the Basics:
Call Option: This gives you the right to buy the underlying asset at a specified price (strike price) before the expiration date.
Put Option: This gives you the right to sell the underlying asset at a specified price (strike price) before the expiration date. -
Learn Key Terms:
Strike Price: The price at which the option can be exercised.
Expiration Date: The date when the option contract expires.
Premium: The price you pay to buy an option contract.
Option Holder (Buyer): The person who buys the option.
Option Writer (Seller): The person who sells the option. -
Choose a Brokerage:
You need to open an options trading account with a brokerage that offers options trading. Make sure to choose a reputable and reliable broker. At Definedge Securities, we care for our clients. -
Educate Yourself:
Before you start trading options, it's essential to educate yourself. There are numerous resources, including online courses, books, and tutorials, that can help you understand the complexities of options trading. -
Risk Management:
Options trading can be risky, and managing your risks is crucial. Set a budget for your options trades, use stop-loss orders, and diversify your portfolio.
Remember, options trading involves significant risk, and it's important to only invest money you can afford to lose. If you're unsure or new to options trading, consider consulting with a financial advisor or mentor for guidance.
That’s interesting points to learn THEORITICALLY. What about practical stuff?
At Definedge, our emphasis lies in imparting both theoretical and practical knowledge. While ChatGPT can provide extensive academic education akin to a bookworm, venturing into the trading realm demands a reasonable understanding.
Recently, our Options Mentor, Abhijit Phatak, wrapped up a session on Options Trading during the weekend. We're pleased to note that participants express satisfaction and actively share charts within our WhatsApp group.
To enhance your learning experience, you can access insightful videos from our mentors at https://www.definedgesecurities.com/products/insight/.
For exclusive insights, kindly login using your Definedge Securities client code.
Combining theoretical knowledge with practical insights is vital to empowering individuals on their trading journeys.
Do share your experience with trading options?
-
-
Market are opening with gap-up and you may be confused what to buy, right?
We at Definedge always streamline and ease trader's journey to find the stock. You can use this scanner to find the most outperforming Sector or Stocks. Let's understand about the scanner.
What is Eagle Price and RS Scanner?
Eagle scanner is a combination of multiple scanners related to P&F patterns, RS patterns and 52-week high low. Scanner output shows below mentioned things.DTB and DBS levels as well as distance from current price. DTB stands for P&F Double top buy pattern and DBS stands for P&F Double bottom sell pattern.
P&F Setup and Pattern counter Trend ratio is calculated on 0.25%, 1% and 3% box-values.
Total price performance and ranking score of Fusion matrix (Calculated on default multiple box-values)
Total RS performance and ranking score of Fusion matrix (Calculated on default multiple box-values)
52-week high and low price of the security
Current retracement percentage from the 52-week high and low of the securityMore bullish (positive) scores and near its 52-week high is a bullish pattern. More bearish (negative) scores and near its 52-week low is a bearish pattern.
I ran the scanner on NSE Sectors and found this result which will help me in identifying the sectors to invest. You can scan more on to the following sector to find the stocks.
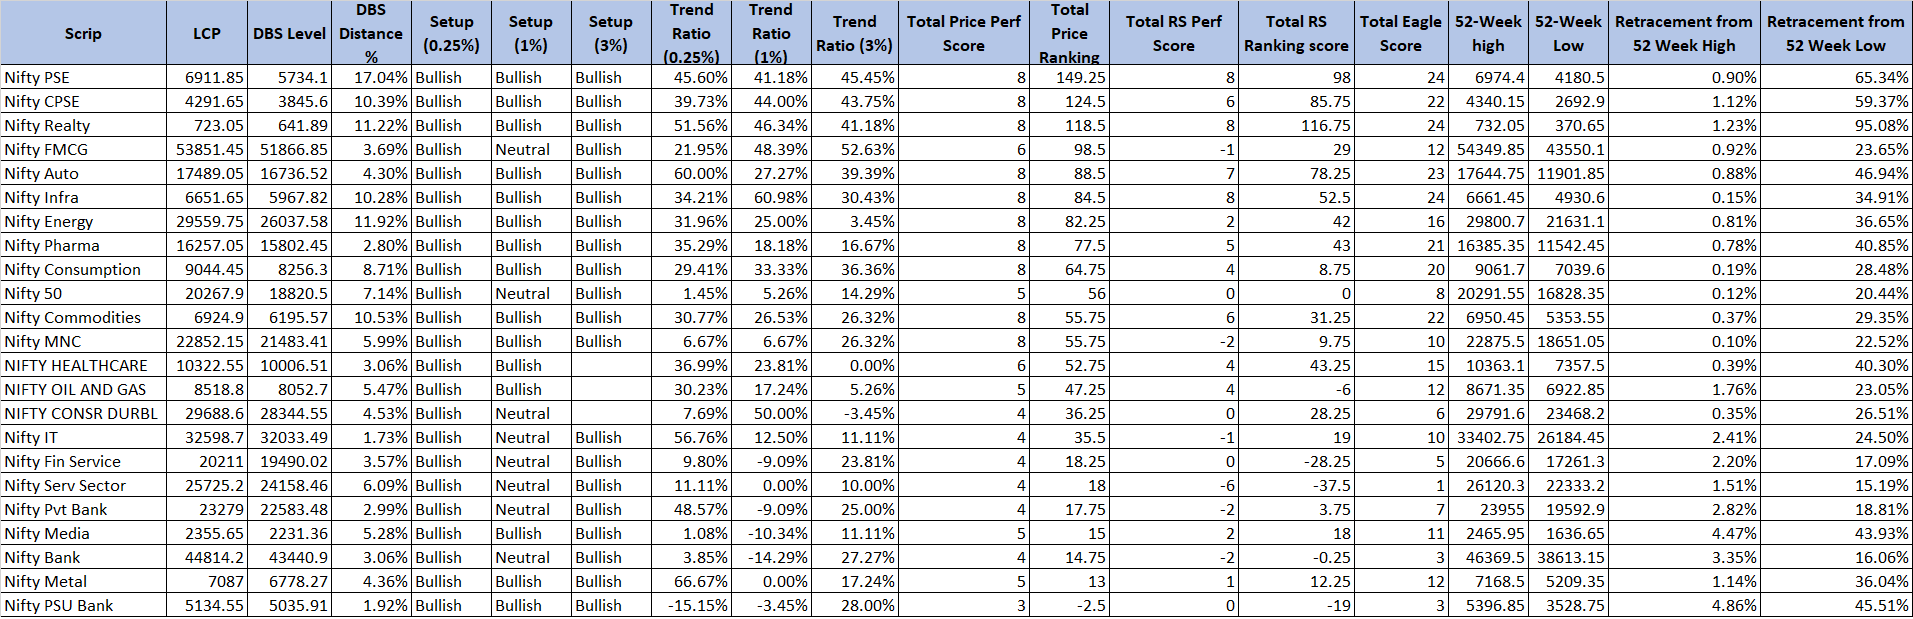
*Data as per closing of 1st December 2023.If you are the Definedge customer, you can find this scanner in our premium segment.
-
@Yogesh Vinayak Joshi Default - 3
-
@Ilyas Shaikh Good to know you are following it. And yes, SIP is the best approach to long-term investing.
-
The pro version offers advanced features such as scanners and indicators, streamlining your trading experience.
Visit here to know more about Premiun features: https://www.definedgesecurities.com/products/rzone/
-
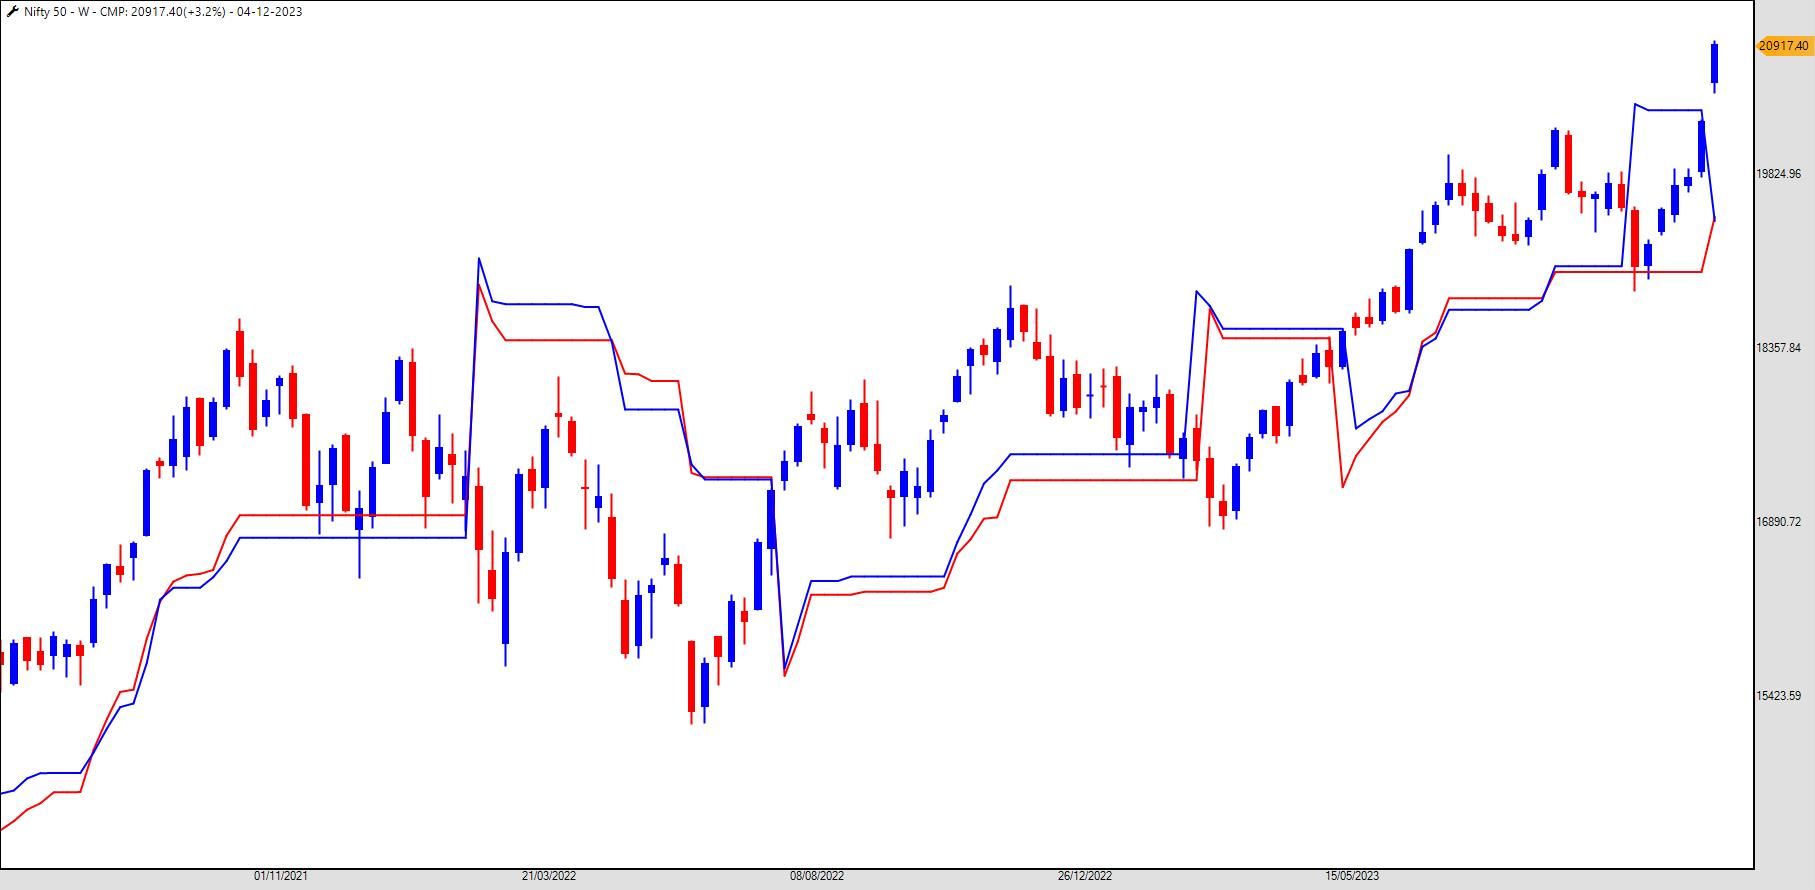
It’s jashan on D-street as the Nifty achieved an all-time high, hitting records of 20,291 that have left many traders optimistic.
According to my trading system, the level of 20,366 might pose a significant hurdle in the upcoming week.
For Trend Traders, the Super Trend indicator is an indispensable tool in their arsenal. What sets it apart is its ability to factor in market volatility when determining trends. This results in a smoother and more effective trend-following indicator than traditional methods.
To read more about Super Trend, Click here https://www.definedgesecurities.com/library/super-trend/
Let’s understand how the Super Trend works in the current Nifty scenario
Source: TradePointThe default period for Super Trend is set at 10 periods. However, my preference leans towards a 13-period setting for medium-term analysis and a 5-period setting for short-term insights.
Why these specific numbers? The rationale is quite simple – both 13 and 5 are Fibonacci numbers, chosen for their unique mathematical properties that align well with market dynamics.
As of now, the 13-period Super Trend is highlighting a bullish trend, signalling positive sentiments in the medium term. But, the 5-period Super Trend is pointing to a potential resistance level at 20,366. If bulls manage to breach this level, it could trigger a rapid and forceful rally in the market during the upcoming week.
Ending the Year on a High Note:
The indication of a potential breakout above 20,366 implies that the Nifty might be wrapping up the year on a high note. The market's reaction to this resistance level will likely set the tone for the beginning of the new year, shaping trading strategies for the months ahead.As we are in the last month of 2023, What levels can we expect on Nifty?
Share your predictions in the comments below. -
Stock List - 2nd December 2023
-
@Shashank Jain There are many stocks; I just highlighted this to explain the system on how it performs on multiyear breakouts.
-
Currently, we only offer IPOs listed on the NSE. The two missing IPOs are for the BSE and are not yet available on RZone.
-
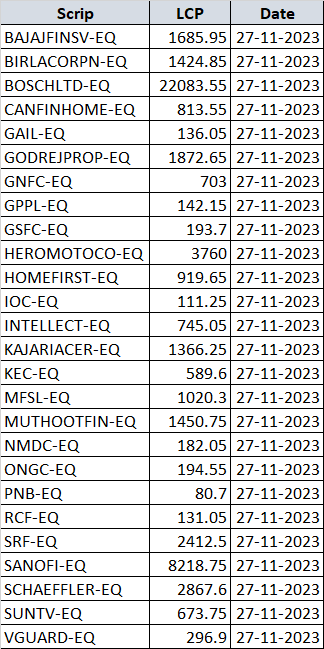
The Laidback Strategy has gained significant traction among Definedge users, and I am writing here to share new opportunities that align with this strategy.
A recent video highlighted the successful application of the Laidback Strategy on Suzlon over the past decade.
You can watch both videos by clicking here: Video1 Video2
Now, we've identified three stocks that meet the strategy's entry criteria:
1. HeroMotoCorp - The leading motorcycle manufacturer
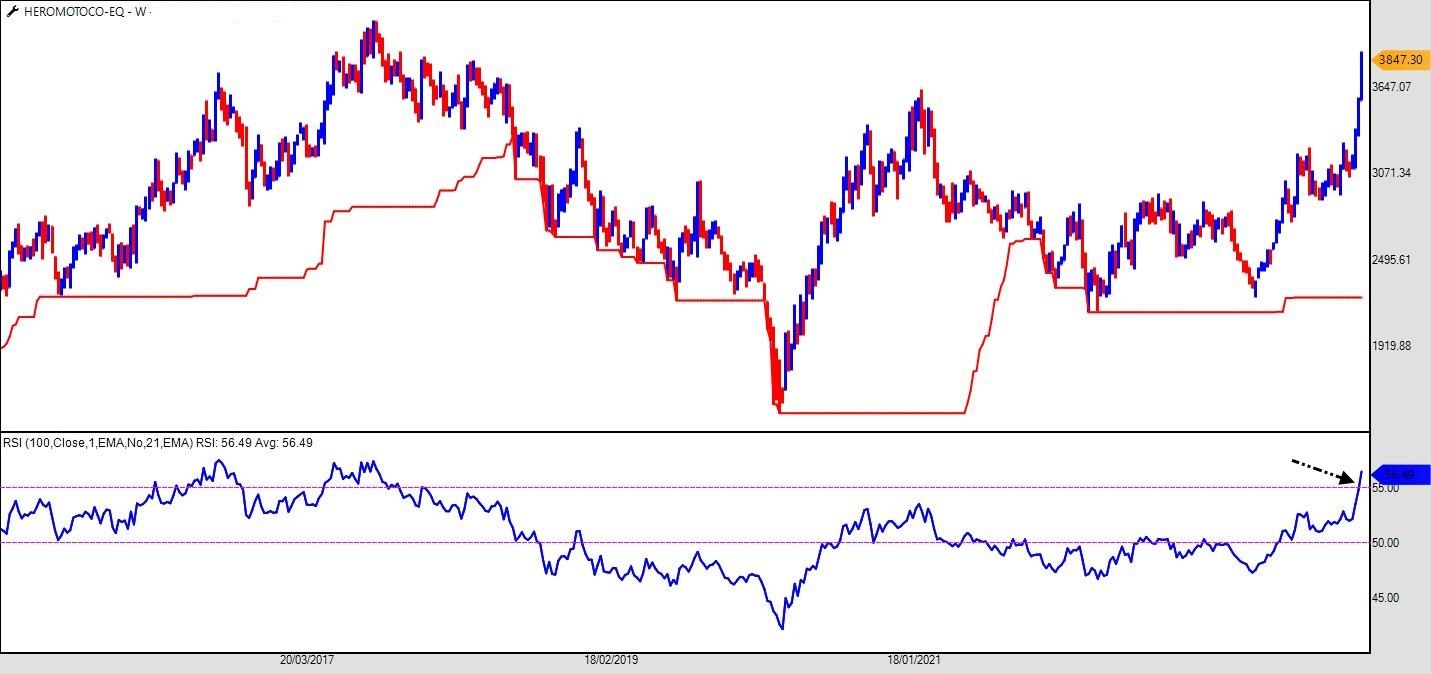
2. Bosch Ltd - A global leader in automotive technology
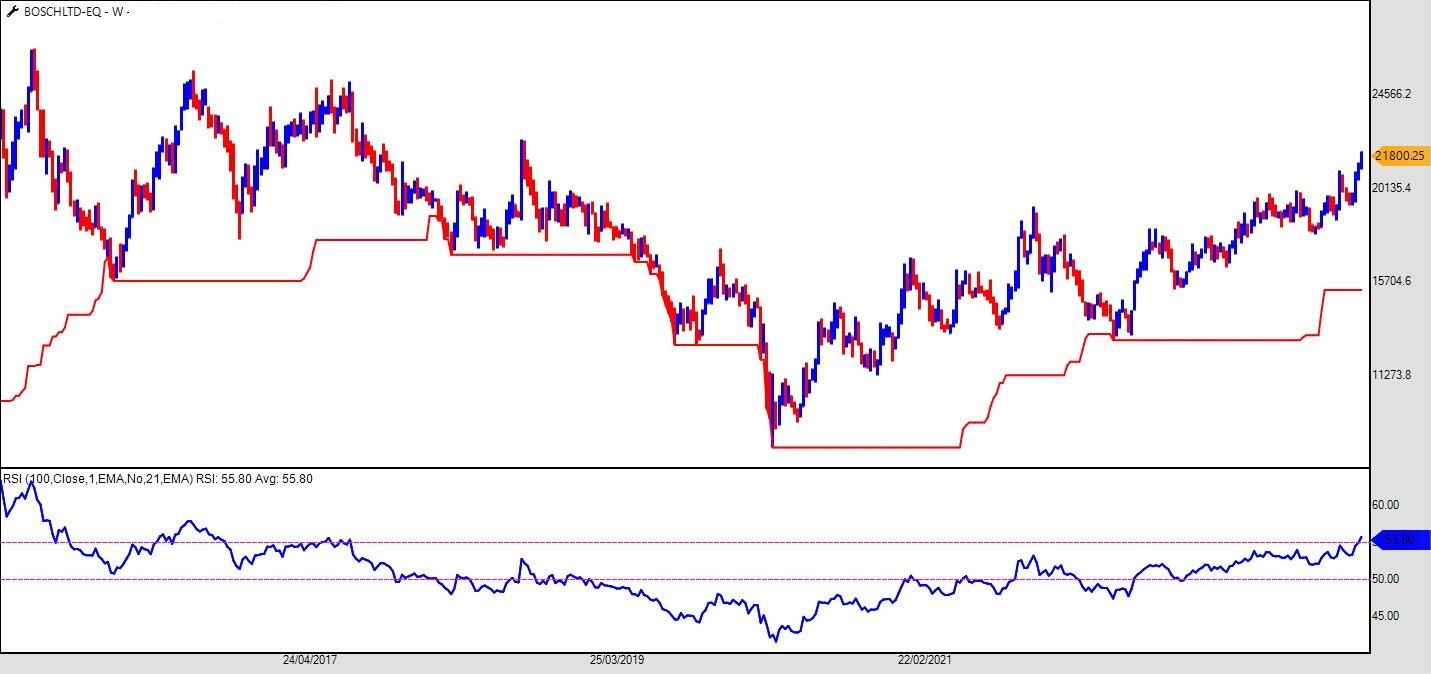
3. IOC Ltd - A prominent player in the oil and gas sector
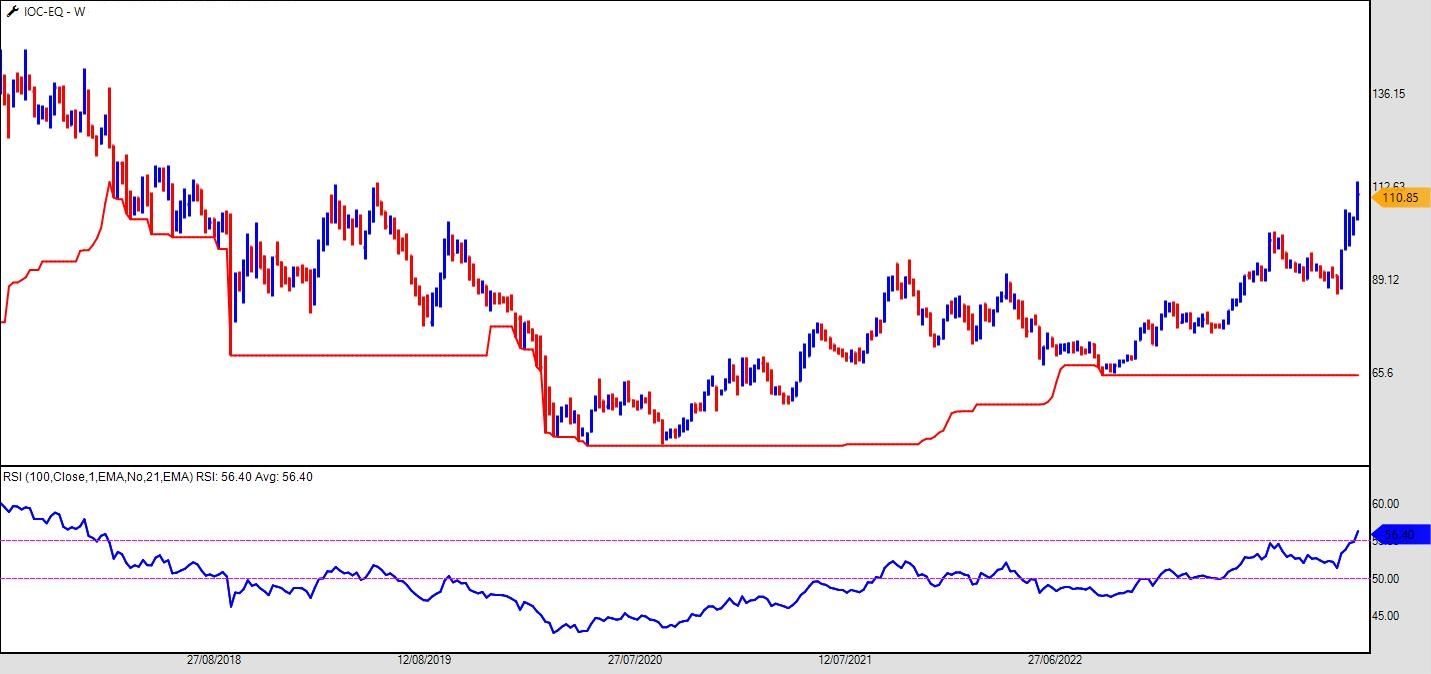
To effectively scan for Laidback Stocks, follow these simple steps:
Go to RZone > Scanners > Candlestick Scanner > Select your Markets and Groups > In Conditions, Select Public > Find "The Laidback Strategy (Entry)" > Change Time Frame to Weekly
This scanner is exclusively available in Trade Point and RZone.
Remember, the Laidback Strategy is designed for long-term investors seeking stocks with the potential for steady growth and minimal risk. By carefully evaluating these potential Laidback Stocks, you can make informed investment decisions that align with your risk tolerance and financial goals.
-
TradePoint desktop has a feature oof Auto Refresh while the RZone scanner doesn't. That may be the reason for the difference in the stock list.
-
As we are on the last day of November, the Nifty has experienced a gradual reversal, moving from 19,000 to 20,000. The monthly high and low levels are crucial from a chartist's perspective.
Technical analysis is an influential tool traders use to make informed decisions based on historical price data and market trends.
While daily and weekly charts are commonly used, monthly charts have a special significance, providing a broader perspective for traders and investors.
Let’s understand the importance of monthly closing prices and chart patterns, exploring how they can be leveraged for effective decision-making.
Importance of Monthly Closing Prices:
Monthly closing prices play a pivotal role in technical analysis as they offer a longer-term view of market trends, helping traders identify significant price levels and potential reversal points. The closing price reflects the consensus of market participants over an entire month, smoothing out short-term fluctuations and noise. This provides a more reliable signal for traders looking to make strategic decisions.Chart Patterns on Monthly Charts:
Chart patterns on monthly charts can offer valuable insights into the market's overall direction. Identifying the patterns on a monthly chart provides a more reliable signal due to the extended timeframe, reducing the impact of random price movements.Traders suited for Monthly Charts:
Monthly charts are particularly beneficial for long-term investors, position traders, and those looking to ride major trends. Swing traders can also use monthly charts to confirm the broader trend before executing shorter-term trades. The monthly perspective helps filter out noise and focus on the primary market direction.Interpreting Support and Resistance with Monthly Highs and Lows:
Support and resistance levels are critical in technical analysis, indicating potential turning points in the market. Monthly highs and lows offer robust support and resistance levels due to the extended timeframe. Here's how to interpret them:-
Monthly Highs as Resistance: If the price struggles to surpass a previous monthly high, it indicates strong resistance. Traders should watch for potential reversals or corrections when approaching these levels.
-
Monthly Lows as Support: Conversely, if the price consistently bounces off a previous monthly low, it suggests strong support. Traders can look for buying opportunities when prices approach these levels.
-
Breakouts and Breakdowns: A breakout above a significant monthly high or a breakdown below a monthly low can signal a change in trend. This is a powerful indication for traders looking to capitalise on significant market movements.
To sum up, incorporating monthly closing prices and chart patterns into technical analysis provides traders with a more comprehensive and reliable perspective on market trends. The extended timeframe of monthly charts is especially valuable for long-term investors and position traders. By interpreting support and resistance levels using monthly highs and lows, traders can make well-informed decisions and navigate the markets more confidently.
If you are trading by looking at the monthly levels on charts, write about the strategy in the comment section so like-minded traders can benefit from it. If you are uncomfortable to write, we can write for you. You need to DM me in the chat section.
-
-
Explore the Latest Buzz with Definedge Securities on the "What's Trending" Page!
We're thrilled to announce the launch of our brand-new "What's Trending" page, your go-to destination for the hottest market trends and insights!
Make sure to add this page to your daily routine because you want to experience everything interesting happening in the dynamic world of finance. Stay ahead of the curve, discover emerging opportunities, and keep your finger on the market pulse.
https://www.definedgesecurities.com/blog/category/whats-trending/
-
@Neha V Video will be out soon....Stay Tuned
-
The "Unusual Volume Activity" indicator is a tool used in trading to identify significant increases in trading volume for a particular financial instrument, such as stocks or options.
Trading volume refers to the total number of shares or contracts traded during a given period. Unusual volume typically occurs when there is an unexpected surge in trading activity, often indicating increased interest or attention from market participants.
Traders and investors pay attention to unusual volume because it can suggest potential changes in market sentiment or the initiation of a new trend. But it is difficult to check each and every stock and we at Definedge have solved this problem.
Before we explain how to find such stocks let's understand the "Unusual Volume Activity" indicator and how traders might use it:
Understanding Unusual Volume:
-
Baseline Volume:
Before identifying unusual volume, traders establish a baseline or average trading volume for a particular asset. This baseline is usually determined over a specified time frame, such as a day, week, or month. -
Detecting Deviations:
Unusual volume is identified when the current trading volume deviates significantly from the established baseline. The magnitude of the deviation is subjective and depends on the trader's chosen parameters.
How to Trade Based on Unusual Volume:
-
Confirmation with Price Movement:
Unusual volume is most meaningful when accompanied by a notable price movement. For example, a significant increase in volume coupled with an upward price movement may signal bullish sentiment. In contrast, the same volume increase with a downward price movement could indicate a bearish sentiment. -
Breakout Confirmation: - Traders often use unusual volume as a breakout confirmation tool. If a stock breaks out of a key resistance level on high volume, it may suggest strong buying interest, reinforcing the likelihood of a sustained uptrend.
-
Contrarian Indicators:
In some cases, extreme levels of unusual volume may be viewed as a contrarian indicator. For instance, a massive surge in volume after a prolonged uptrend could signal exhaustion and the possibility of a reversal. -
Risk Management:
Traders should implement proper risk management strategies when acting on unusual volume signals. Just because the high volume doesn't guarantee a particular price movement and unexpected events can occur. -
Watch for News Catalysts:
Significant news events, earnings releases, or other market-moving information may trigger unusual volume. Traders should be aware of potential catalysts driving the increased activity.
Scanner in Trade Point and Zone
Definedge Zone and TradePoint, traders can access a powerful tool through the OHLC Scanner. This versatile scanner caters to various timeframes such as Intraday, Daily, Monthly, and Weekly charts. The scanner provides a comprehensive view of Open, High, Low, and Close prices over these timeframes, allowing traders to assess price dynamics effectively.
For instance, the 60-minute scanner captures price movements within each hour. Combined with the Unusual Volume Activity indicator, it becomes a potent tool for identifying short to medium-term trading opportunities. Here is the stocklist from the scanner on the candle closed at 10:15 am.
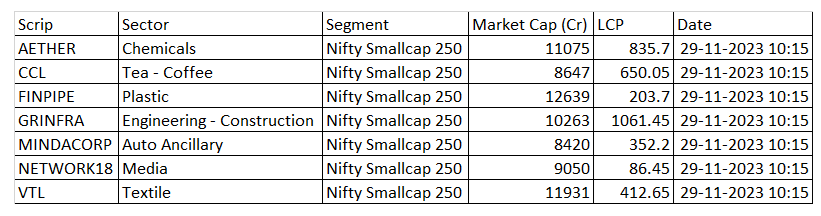
Are you using this scanner? If yes, write your experience in the comment below.
-
-
@Ilyas Shaikh Yes sir
-
Charlie Munger, the Vice Chairman of Berkshire Hathaway and longtime business partner of Warren Buffett, is renowned for his wisdom, wit, and insightful approach to investing and life.
With a heavy heart, we bid farewell to one of the finest financial minds of our time, Mr. Charlie Munger at the age of 99.

Charlie Munger's legacy extends far beyond the balance sheets and market dynamics. His keen intellect, multidisciplinary thinking, and unwavering principles have shaped the way we approach not just investments, but life itself. He was more than a financial wizard; he was a mentor to countless aspiring minds, a beacon of rationality in a world often driven by speculation.
Do you know Charlie Munger's investing style?
1. Value Investing:
Like Warren Buffett, Munger is a proponent of value investing. This involves identifying undervalued companies with strong fundamentals and holding them for the long term. The focus is on the intrinsic value of a business rather than short-term market trends.2. Quality Businesses:
Munger emphasizes the importance of investing in high-quality businesses with durable competitive advantages. Such companies, often referred to as "moats," have a strong market position that protects them from competition and allows them to generate consistent returns over time.3. Long-Term Perspective:
Munger's investing style is characterized by a long-term perspective. He believes in the power of compounding and favors investments that can grow steadily over many years. This patient approach aligns with the idea of holding onto quality businesses through market ups and downs.4. Conservative Investing:
Munger and Buffett are known for their conservative approach to investing. They prefer businesses with a history of stable earnings, strong management, and a track record of prudent capital allocation.5. Concentrated Portfolio:
While diversification is a common strategy for reducing risk, Munger and Buffett take a different approach. They believe in concentrating their investments on a few businesses they thoroughly understand. This strategy requires in-depth research and a high level of conviction in their investment choices.Here are some key lessons to learn from Charlie Munger:
-
Multidisciplinary Thinking:
Munger emphasizes the importance of being well-versed in various disciplines. He advocates for a broad mental model incorporating insights from multiple fields, including psychology, economics, physics, and biology. This multidisciplinary approach helps in making more informed and nuanced decisions. -
Circle of Competence:
Munger advises investors to operate within their "circle of competence." This means sticking to areas where you have expertise and understanding. It's about knowing your limitations and not venturing into complex areas you don't understand. This principle aligns with Warren Buffett's famous saying, "Risk comes from not knowing what you're doing." -
Invert, Always Invert:
Munger often suggests solving problems by thinking backward. Instead of focusing on how to achieve success, consider what might lead to failure. By inverting the problem, you can uncover hidden risks and avoid potential pitfalls. This approach is a cornerstone of Munger's critical thinking process. -
Lifelong Learning:
Munger is a strong advocate for continuous learning. He believes in developing a latticework of mental models over time. Reading extensively and learning from various sources contribute to intellectual growth and better decision-making. -
Independent Thinking:
Munger encourages individuals to think independently and avoid being swayed by popular opinion. Being a contrarian thinker can lead to unique insights and opportunities that the crowd may overlook. This aligns with Buffett's advice to "be fearful when others are greedy, and greedy when others are fearful." -
Patience and Temperament:
Munger stresses the importance of patience in investing. He believes in waiting for the right opportunities and not being swayed by short-term market fluctuations. Additionally, maintaining emotional discipline and a calm temperament are crucial for long-term success. -
Avoiding Cognitive Biases:
Munger is known for his deep understanding of human psychology and the impact of cognitive biases on decision-making. He advises investors to be aware of these biases, such as overconfidence and confirmation bias, and work to minimise their influence.
In summary, learning from Charlie Munger involves adopting a multidisciplinary approach, staying within one's circle of competence, thinking independently, and practising patience in investing and life. His investing style, closely aligned with Warren Buffett's, emphasises value, quality, a long-term perspective, and a concentrated portfolio of carefully selected businesses.
The book Munger, The Complete Investor and Poor’s Charlie Almanack is a must-read.
RIP The Legend Charlie Munger
-
-
Adani Group stocks as they surge with bullish momentum, triggered by the recent Supreme Court development in the Adani-Hindenburg case. As of 10:00 am, Adani Stocks dominates the Top 10 gainers for the day, showcasing a promising start.
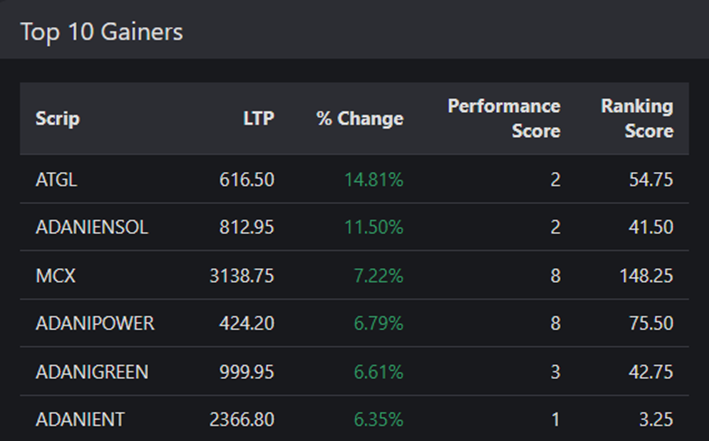
Source: Rzone, TradePointOur Leading Indicators Says.....
Our cutting-edge proprietary indicator, the Adaptive RSI, points towards a renewed bullish wave across most Adani Stocks. Exclusively available to our Definedge clients in the indicator section, this tool sets the stage for informed investment decisions. Signup here for Definedge SecuritiesWe're thrilled to offer our existing Definedge clients to access to this exclusive indicator. Elevate your trading experience – it's available now in the indicator section.
Let's dissect the charts of Adani Enterprises (top left), Adani Ports (top right), Adani Green (bottom left), and ATGL (bottom right).
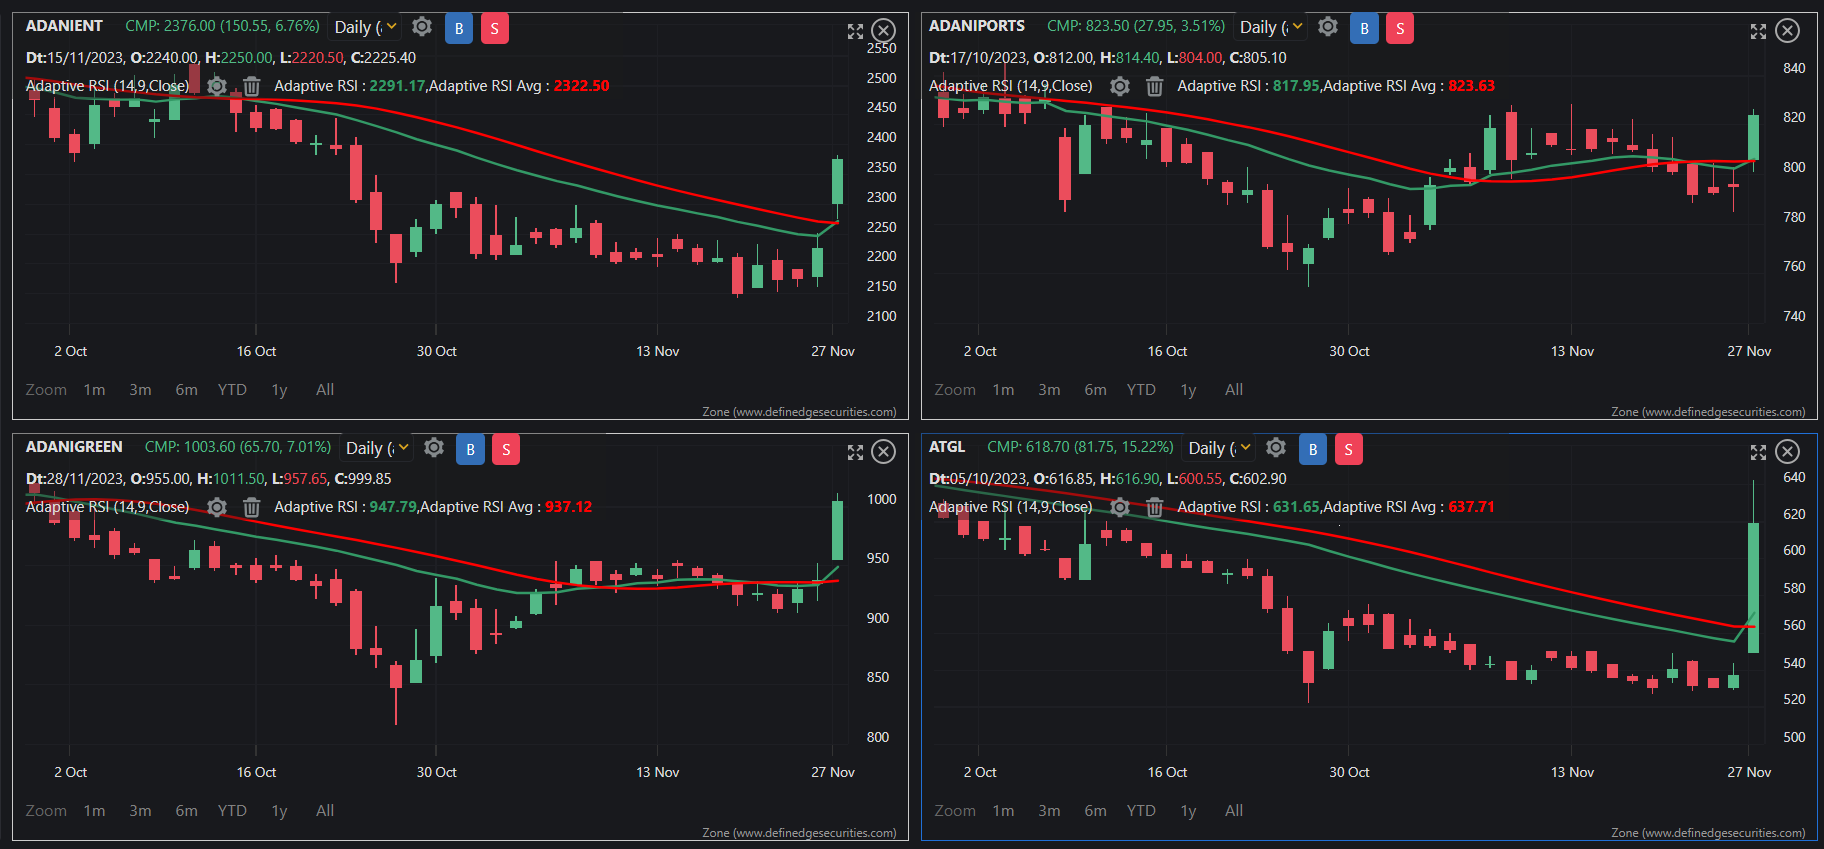
Observe the two lines on the chart? That's the Adaptive RSI (ARSI) indicator, a unique feature available only on TradePoint. Ready to leverage this powerful tool for your trades? Just open an account with us.
The ARSI isn't your typical indicator – it factors in both momentum and volatility in its calculations. A bullish crossover coupled with widening indicates the emergence of a strong bullish trend, and it's unfolding in Adani Group stocks. Seize this opportunity, as highlighted by our distinctive indicator.
Don't miss out on the potential gains – ride the Adani wave with confidence and TradePoint's exclusive Adaptive RSI indicator.
Note: We are highlighting the emerging trend, as signalled by the indicator, and this should not be considered as a recommendation.
-
@Subramanya Joshi In the public library, the scanner is named Laidback Strategy.
-
@Gaurav Garg Yes you can take entry if you have missed it.
Request you to watch the first video too.
-
Thanks for reading.
-
As the curtains draw on 2023 with 35 days to go, the stock market arena has witnessed a riveting performance, with PSU Banks emerging as the unsung heroes on D-Street.
The Performance in 2023, so far...
The twists and turns with the impressive gains of 15% on the Nifty PSU Bank Index leave its counterpart the Nifty Private Bank in the dust with a mere 4% gain.Buckle up as we dissect the trendline breakout on the Nifty Private Bank/Nifty PSU Bank ratio chart and uncover the potential for short-term reversals as the year concludes.
Investors and traders should keep an eye on the ratio chart of Nifty Private Bank/Nifty PSU Bank, showcased in the chart section of TradePoint, to decipher the potential market shifts.
Trendline Breakout: A Game-Changer in the Making
The ratio chart doesn't lie, and a conspicuous trendline breakout signals a potential reversal in the short-term trend.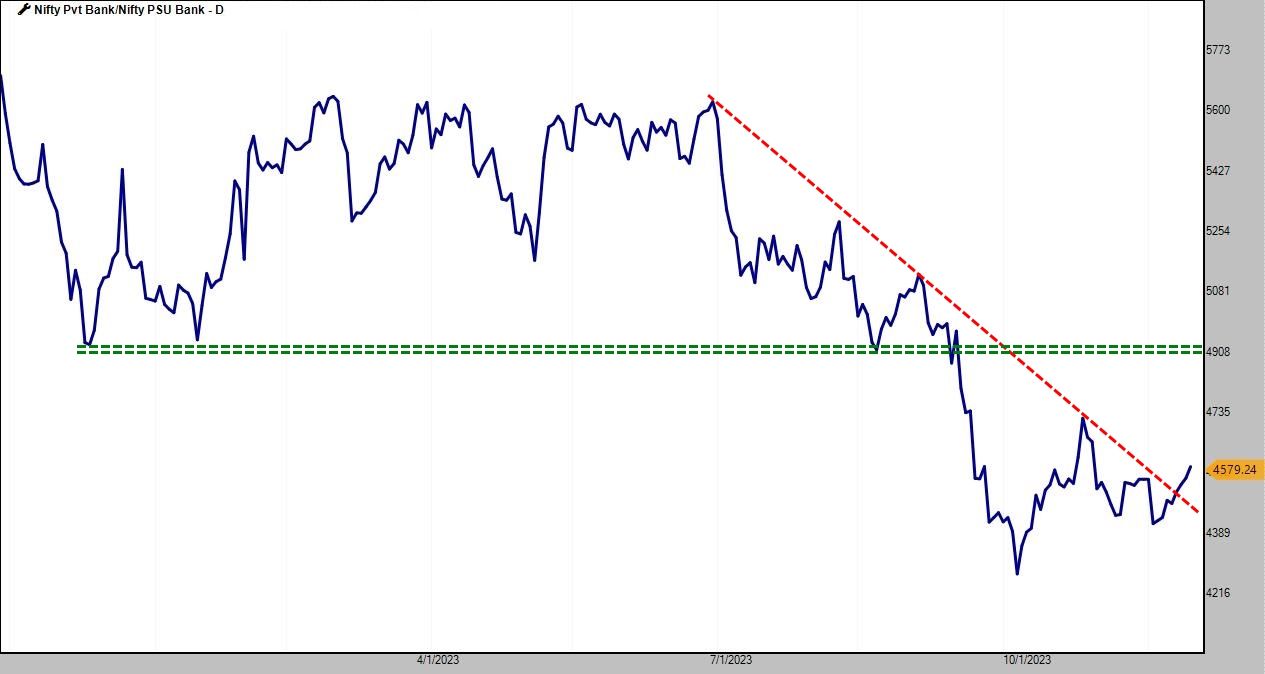
As we approach the tail end of 2023, this breakout becomes a critical focal point for investors looking to capitalize on evolving market dynamics. The breakout means the Nifty Private Bank will likely outperform Nifty PSU Bank.
Market Elephants vs. Tom and Jerry: A Metaphor for Movement
In finance, the analogy of market elephants and nimble midcap/small-cap players as Tom and Jerry holds when the trend begins. Larger market-cap Private Banks as elephants here, exhibit a slower pace of movement than their more agile counterparts like PSU Banks, who are into midcaps and small-cap baskets. Midcap and Small Cap Bank's Performance in 2023 has surprised many investors.The Green Line Conundrum: Short-Term Surge or Long-Term Victory?
A green line on the ratio chart marks the initial level where Private Banks could potentially take the lead. However, it's crucial to understand that this scenario is a short-term view. Meanwhile, the long-term chart continues to favour PSU Banks, indicating a sustained trend of outperformance.TradePoint: Your Gateway to Market Insights
For those eager to dive deeper into the numbers, TradePoint emerges as the go-to platform. The chart section on TradePoint hosts the ratio chart, offering a visual representation of the market tides and helping traders make informed decisions based on real-time data. -
Indian investors have embraced Mutual Funds, particularly through Systematic Investment Plans (SIPs), showcasing disciplined investment strategies. The Indian Mutual Fund Industry has experienced remarkable growth, with the Assets Under Management (AUM) reaching ₹46.72 trillion as of October 31, 2023, witnessing a more than 5-fold increase in the past decade from ₹8.34 trillion in 2013.
Opportunity Spotlight: Kotak Healthcare Fund (NFO):
I wish to bring attention to an exciting investment opportunity in the healthcare sector through the ongoing New Fund Offer (NFO) of Kotak Healthcare Fund. The healthcare sector is showing promising signs of a bullish trend as highlighted by the charts utilizing a top-down approach to support this claim. Click here1. Nifty Monthly Chart:
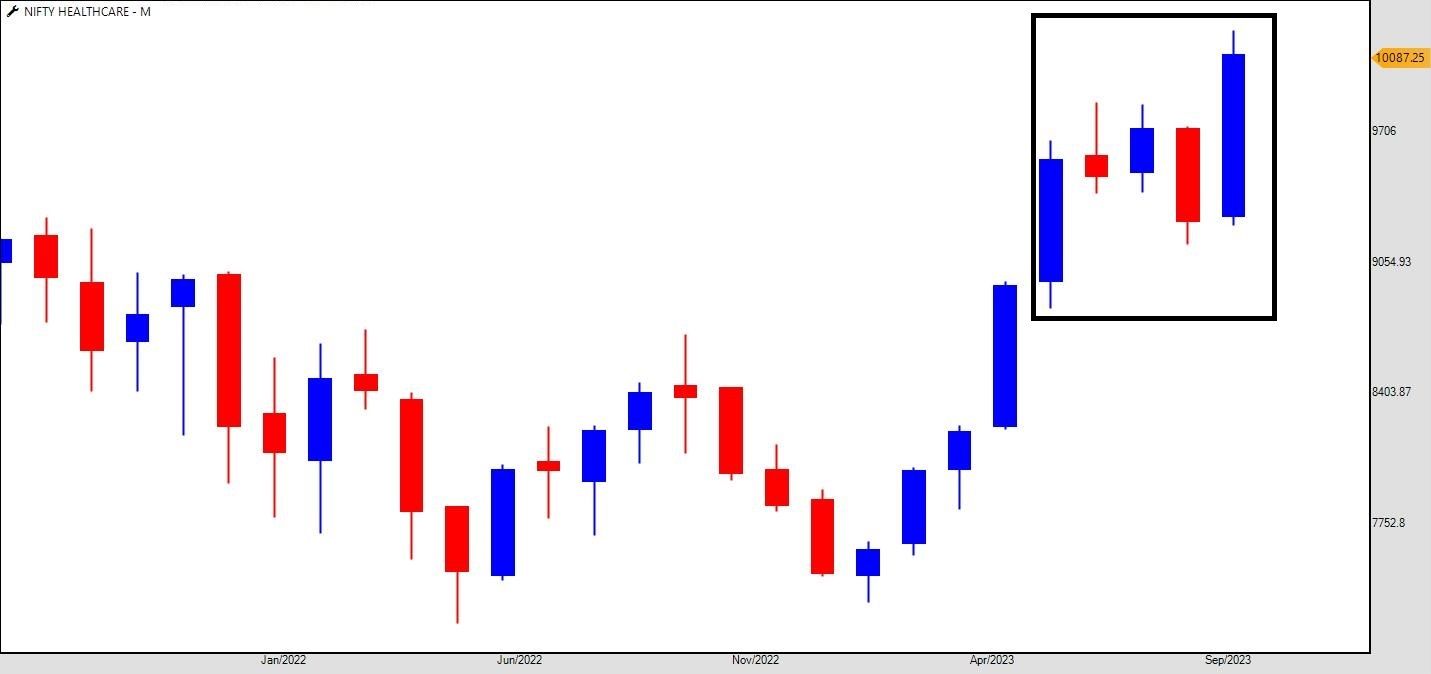
The Nifty Monthly Chart reveals a compelling rising three-candlestick pattern, signalling the resumption of a bullish trend. This pattern, occurring on a monthly timeframe, suggests a long-term breakout, making investments in mutual funds a prudent choice.
The rising three-candlestick pattern is a bullish continuation pattern that consists of a long bullish candle, followed by three smaller bearish candles, and concluded with another long bullish candle. This pattern indicates a brief consolidation before the prevailing uptrend resumes, affirming a potential long-term bullish trajectory.
2. Nifty Weekly Chart:
The Nifty Weekly Chart provides additional confirmation of the bullish trend, with two significant candlestick patterns: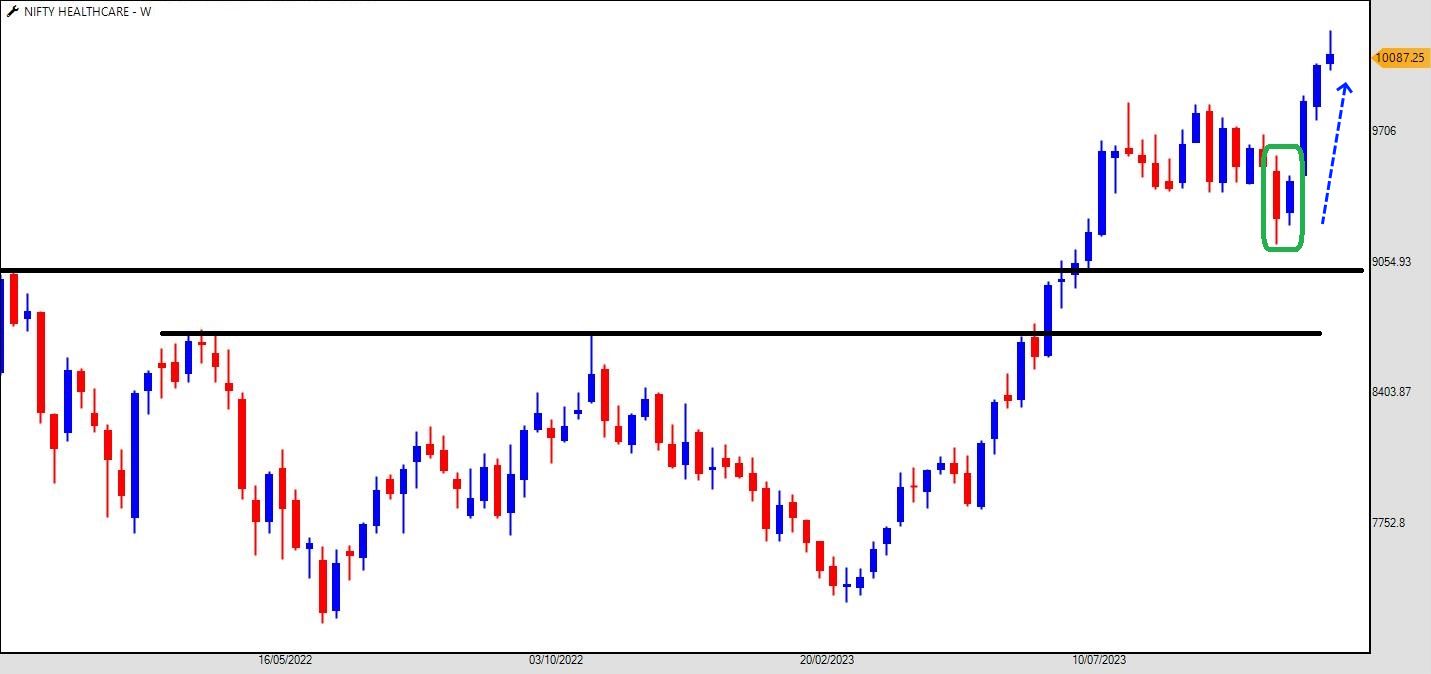
a. Bullish Engulfing:
- A bullish engulfing pattern occurs when a small bearish candle is followed by a larger bullish candle that engulfs the preceding one.
- This signals a shift in market sentiment from bearish to bullish, often indicating the start of an upward trend.b. Three White Soldiers:
- The three white soldiers pattern consists of three consecutive long bullish candles, reflecting a strong upward momentum.
- This pattern is a robust indicator of a bullish reversal, suggesting a potential trend change from bearish to bullish.Investment Platform: Definedge Securities:
At Definedge Securities, our commitment is to educate and empower our clients to make informed investment decisions. We offer a comprehensive investment platform, including a dedicated Mutual Fund Zone with advanced charting tools such as Point and Figure charts. This unique feature enables investors to conduct in-depth research on various Mutual Funds before making investment decisions.The Nifty Monthly and Weekly Charts analysis strongly suggests the resumption of a long-term bullish trend. The ongoing NFO of Kotak Healthcare Fund presents a compelling opportunity to invest in a sector poised for significant growth.
Definedge Securities is pleased to provide our customers with a platform that facilitates thorough research and informed decision-making. To seize this opportunity in the healthcare sector, investors can consider the Kotak Healthcare Fund NFO. Click here to explore and invest.
*Note: Investors are advised to conduct their due diligence and consult with financial advisors before making investment decisions.
-
This week, the stock market lacks strength ahead of a long weekend on account of Guru Nanak Jayanti on Monday. The Indian benchmark index Nifty and Sensex stay within a narrow range, concluding close to their previous closing value.
Attention and investments appear to be directed towards Tata Technologies, the latest IPO from the Tata Group, drawing funds from the secondary markets.
Following our Fundamental expert's @Prasiddh-Shroff in-depth analysis of the ongoing IPO, Technical expert @Mangesh-Joglekar emphasized the chart setup of the Tata Group 25 Cap, suggesting a breakout. The Definedge post seems to have gained significant traction
, evidenced by the 53 times subscription by 3 pm today.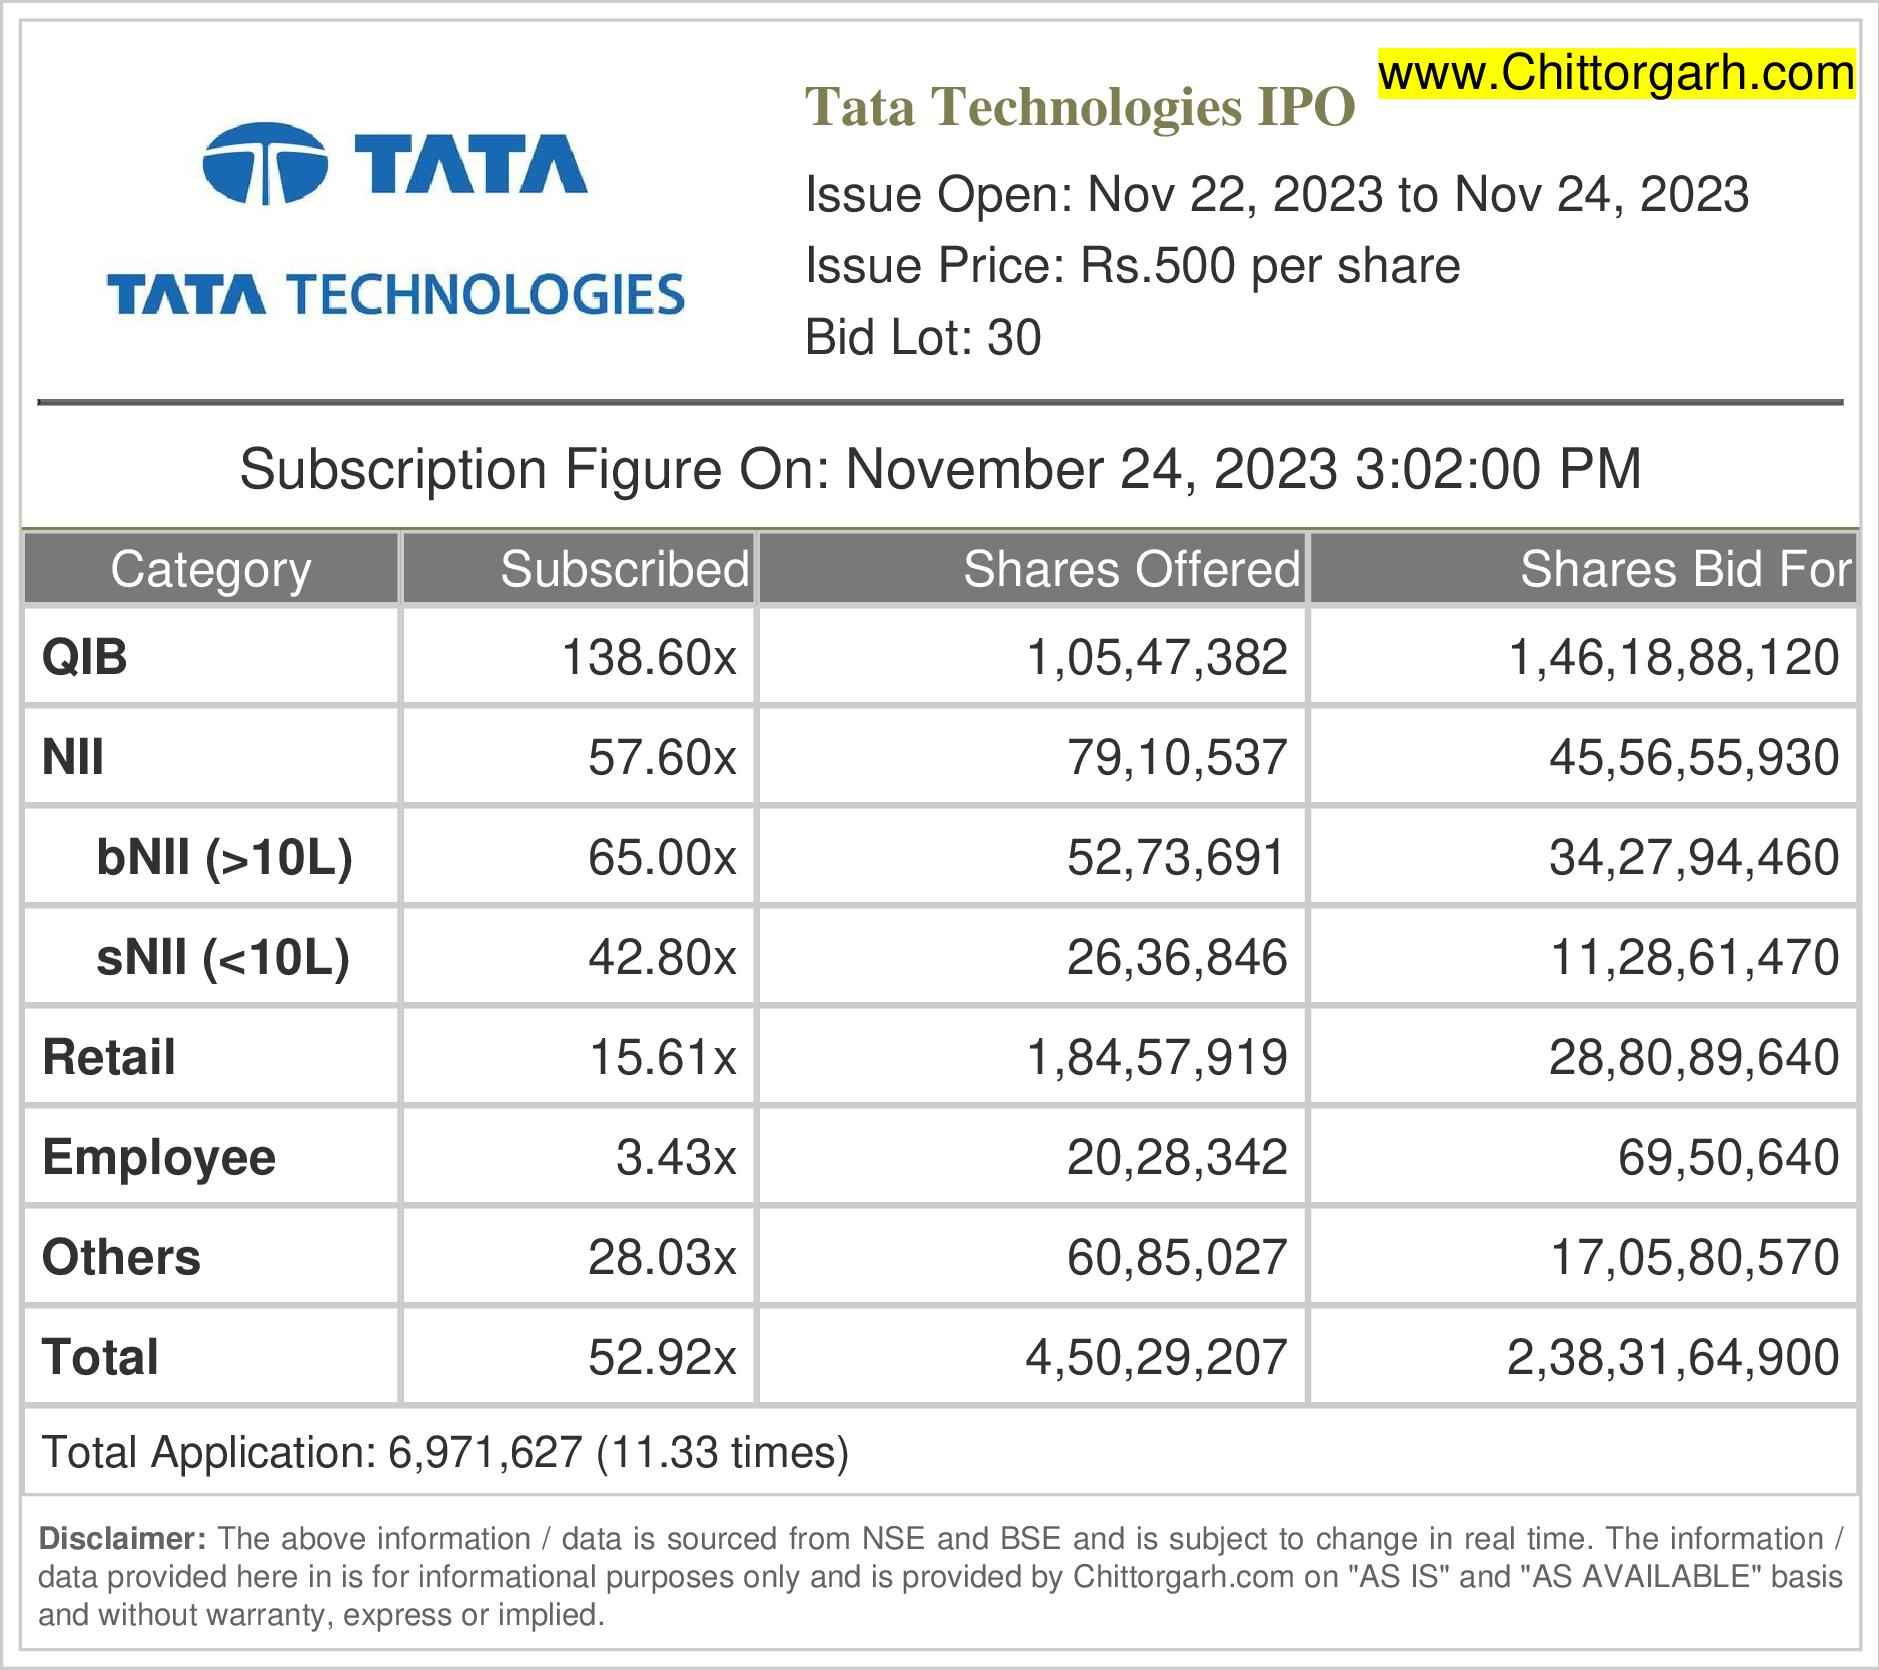
Source: [https://www.chittorgarh.com/ipo_subscription/tata-technologies-ipo/1418/](link url)Are you still planning to subscribe?
If you wish to subscribe, click on https://ipo.definedgesecurities.com/ongoingipo
Read the detailed report by Prasiddh here: https://insight.definedgesecurities.com/research/tata-technologies-ipo-notes/
To refer chart by Mangesh, Click here https://forum.definedgesecurities.com/topic/1112/tata-25-cap-index
-
Yes Sachinji.
We have created scanner of this system.
Second part of video will be out on 25th November, do watch that too.
-
Interesting chart setup @Mangesh-Joglekar
On the Candlestick chart, the index has formed a 3C Pullback - Bullish pattern, and resuming the northward journey indicates the strength in the index.
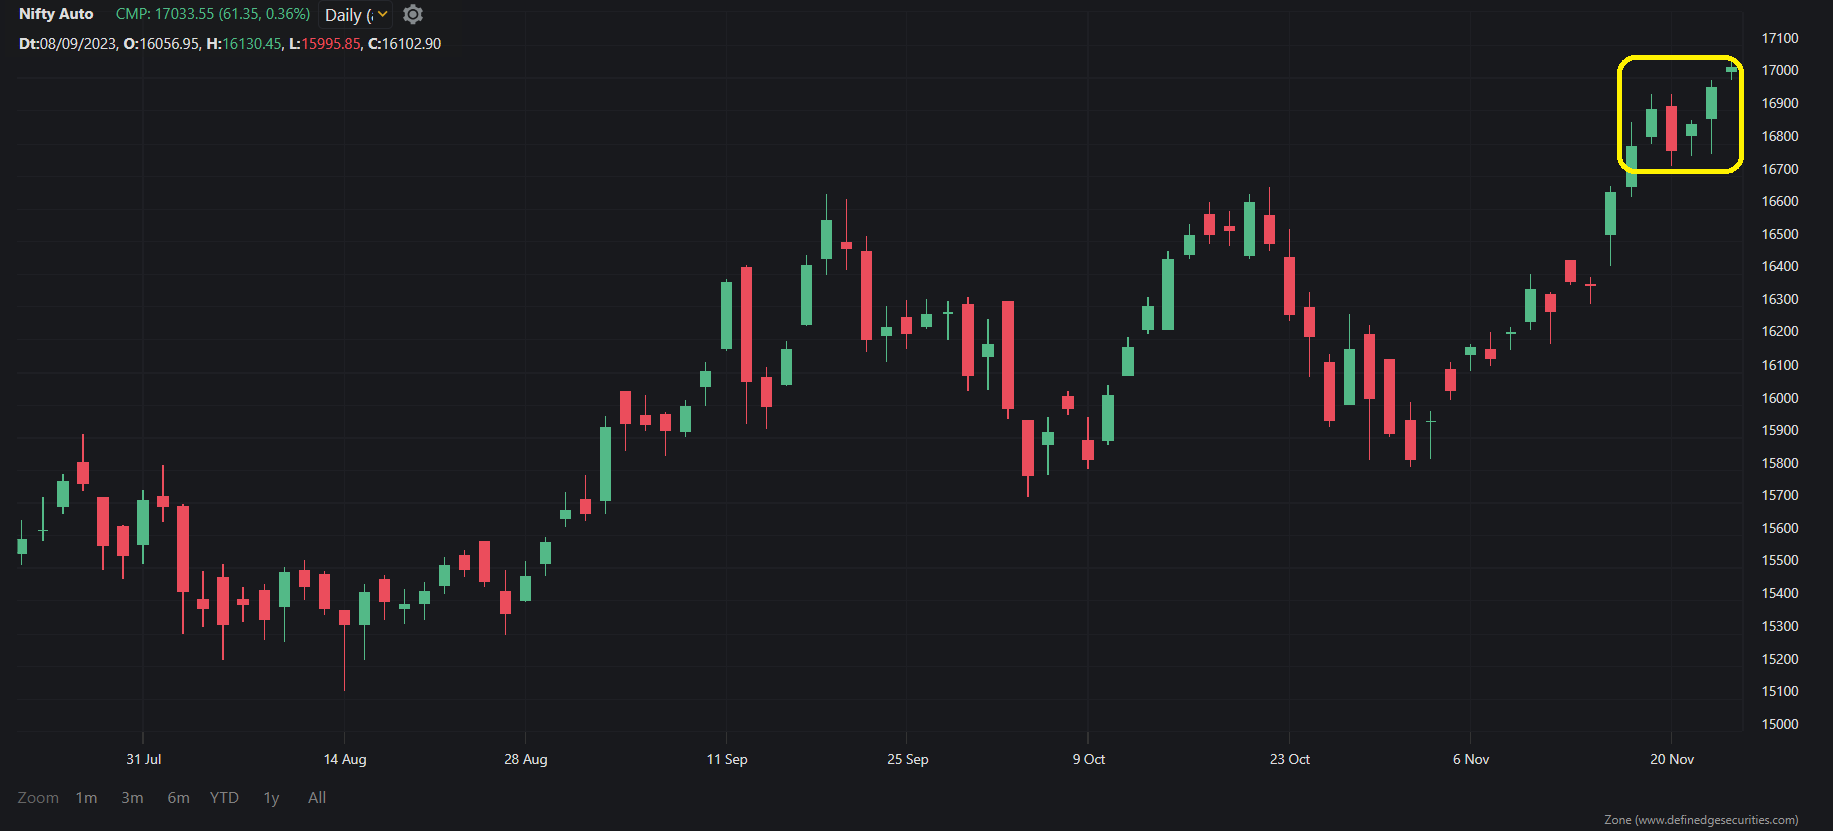
Not only the Nifty Auto Index but also the Healthcare and Pharma sector indexes are forming the same candlestick pattern. I found this using the Scanner feature of the Zone App of Definedge.
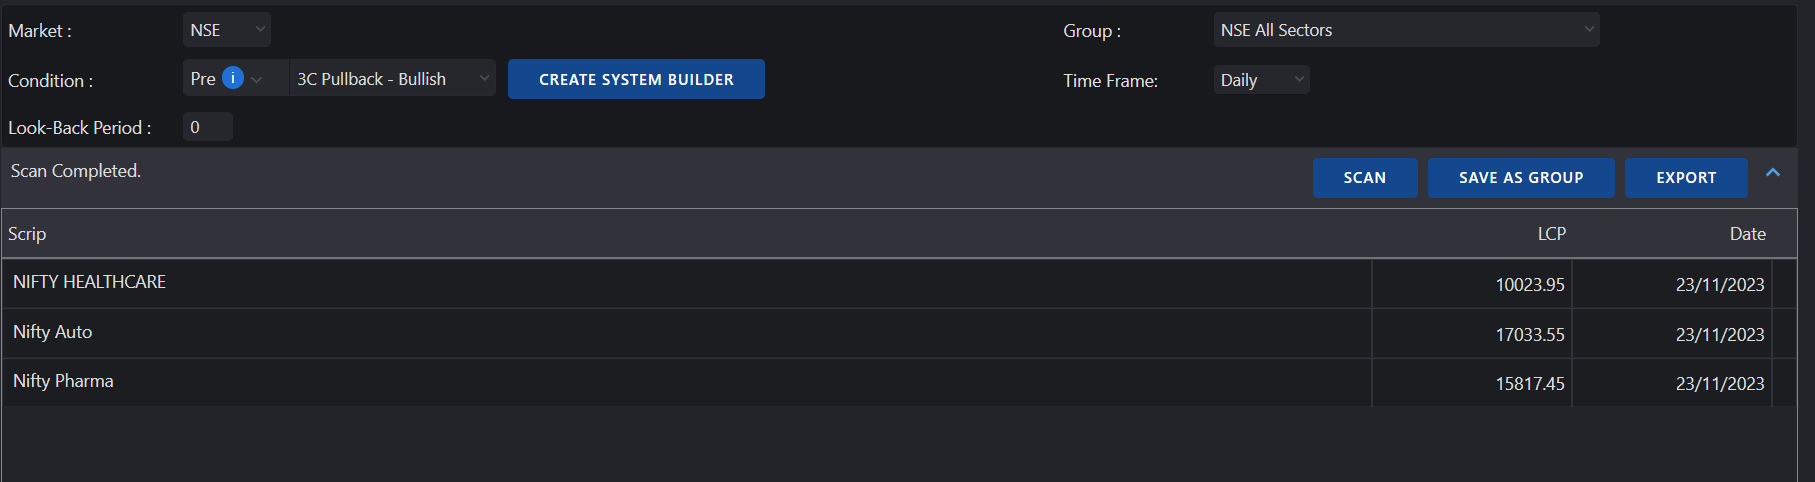
Heard this pattern for the first time? Read about the pattern here https://www.definedgesecurities.com/trading-strategies/3c-pullback-pattern-trading-strategy-on-candlestick-chart/
-
We're excited to share some updates and an exclusive offer with our esteemed forum community.
As many of you know, I have been consistently posting the stocks list related to the Laidback Strategy on the Definedge Telegram group since its recording in May 2023. Watch the strategy video here https://www.youtube.com/watch?v=opYHnfDP6l8&t=76s
Now, as part of Definedge, we will be sharing the stocks list on our forum: https://forum.definedgesecurities.com
Why should boys have all the fun?
The Laidback Strategy has proven to be quite rewarding for many as markets are trending bullish, and we hope all our forum members are enjoying the benefits. Now, we encourage you to spread the wealth of knowledge by sharing this strategy with your friends and family so that they can have some fun too.Our forum is open to everyone, and we invite you to register to actively participate in discussions and seek clarification on any queries you may have.
Returning to the Laidback Strategy, @AP and I have recorded a new video to address some of the commonly asked questions:
- Navigating a bull market: How to choose among the 3-5 stocks in the scanner every week?
- A case study on a stock that remained stagnant for years but signalled a buy after 15 years, showcasing remarkable performance.
- Insights into the Laidback Strategy applied to trending stocks like JP Power and Idea.
- A detailed explanation of pyramid strategy, a topic many of you have expressed interest in.
- An enhanced EXIT criteria featuring a unique indicator available exclusively in Trade Point and RZone by Definedge.
And now, for our forum users, we have a special surprise! We are offering you 24-hour early access to the upcoming video.
You just need to bookmark this article and comeback on November 25th, 2023, at 11 am; the video will be published exclusively for you. It will be available to the general public on November 26th, 2023.
If you received this link from a friend, we invite you to register and join us for exciting offers and enriching learning experiences.
Thank you for being a valued member of our community. We look forward to your active participation and hope you enjoy the exclusive early access!
Related article on Laidback Strategy https://forum.definedgesecurities.com/topic/810/why-i-trust-my-laidback-strategy
-
Tata products, from humble toothbrushes to luxurious linens, have become an integral part of our daily lives. This legacy traces back to 1868 when the visionary Late Shri Jamsetji Nusserwanji Tata established the Tata Group with a modest investment of Rs.21,000 in Mumbai, India's financial hub.
I am a book reader and would urge everyone to read the book "The Tata Group - From Torchbearers to Trailblazers" which will take you to the history of Tata Group and how they built this empire in the 150 years.
Today, Tata Group presents an enticing investment opportunity for savvy investors – the Initial Public Offering (IPO) of Tata Technologies. This venture, aiming to raise Rs. 3,042.51 crores, marks the group's triumphant return to the IPO arena after a 19-year hiatus.
Tata Technologies, a leading player in the Engineering Research and Development (ER&D) sector within the automotive domain, is poised to revolutionize the future of mobility. This IPO offers a unique opportunity for investors to become stakeholders in this dynamic and innovative company.
As an investor, you might be contemplating this investment's viability and potential profitability. Rest assured, Definedge cares for its clients.
Our expert analyst, @Prasiddh-Shroff , has written a comprehensive report encompassing the industry landscape, a company SWOT analysis, and insightful company's global offerings. This report empowers you with the knowledge to make informed decisions and confidently navigate the investment realm.
To access this valuable report, log in with your Definedge Securities client code and password. Click here https://insight.definedgesecurities.com/research/tata-technologies-ipo-notes/
Whether you've been a loyal consumer of Tata products or are a seasoned investor seeking a promising opportunity, now is the time to explore the potential that Tata Technologies' IPO brings to the table.
-
Thanks Everyone
-
@RAGUNATH_AG Gald you liked it.
-
The early signs of TCS outperforming HDFCBANK are on the cards, and indications suggest that this trend might persist for the upcoming quarters. As market dynamics evolve, it becomes crucial for investors to adapt and align their portfolios with emerging trends.
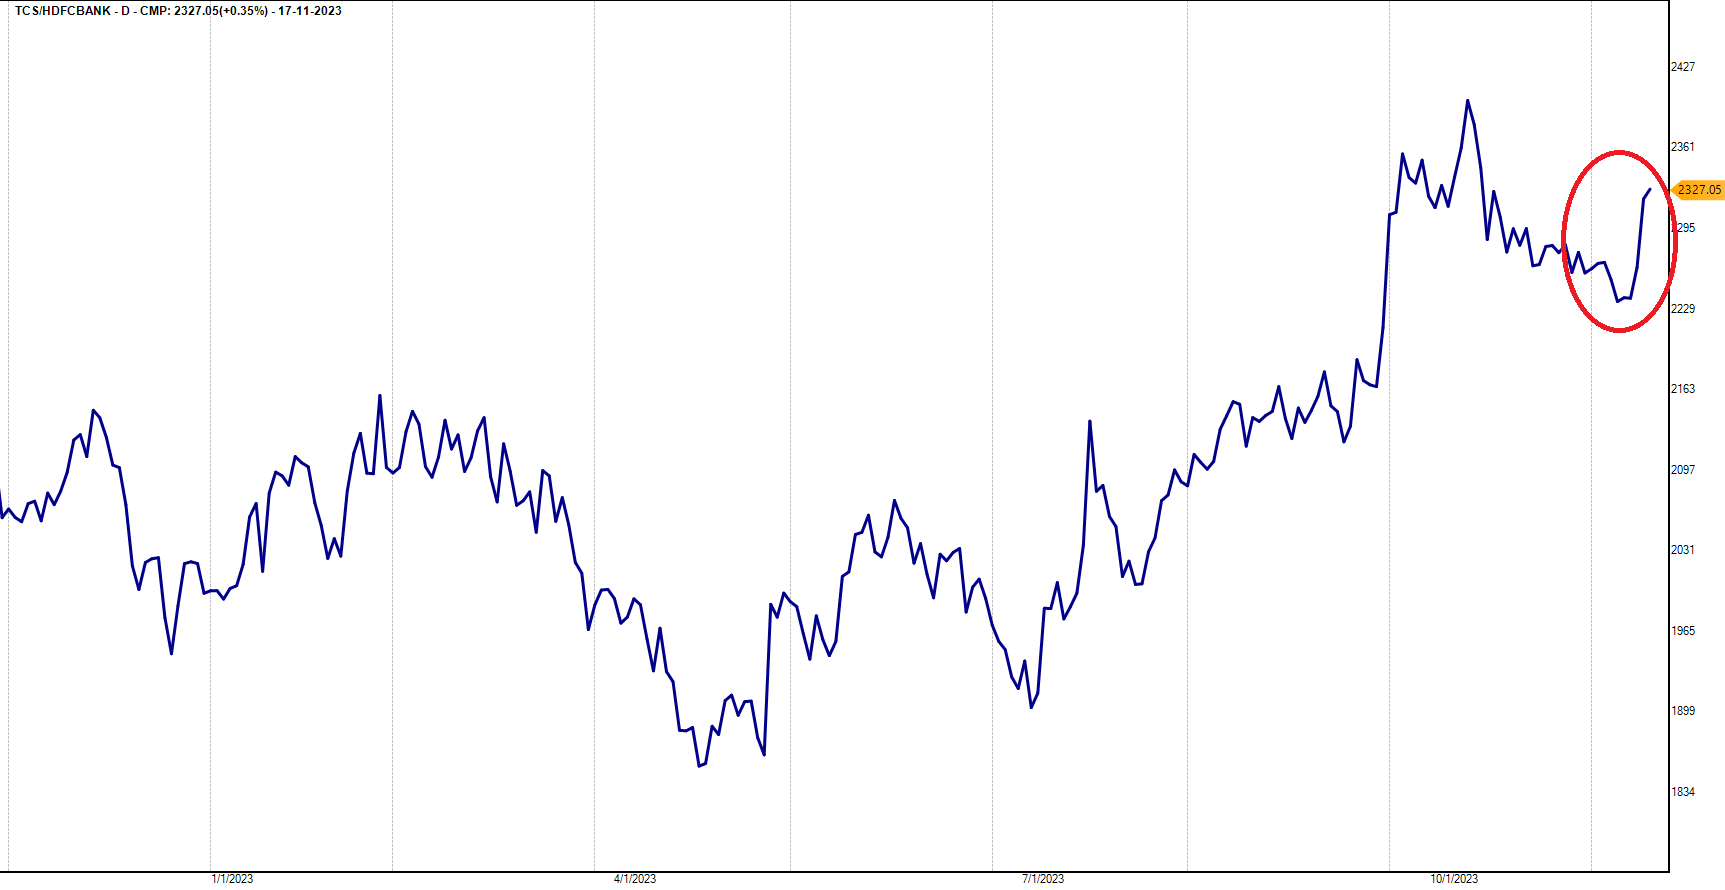
Source: TradePointA notable observation from the ratio chart update is the likelihood of the banking sector lagging while the IT sector takes the lead in performance. This paradigm shift prompts investors to reevaluate their holdings and consider a realignment towards sectors exhibiting more robust growth prospects.
Considering the emerging trends, investors are urged to turn their attention to TCS over HDFCBANK.
Are You Ready to Make the Swap?
-
Investing in the stock market is akin to navigating a labyrinth of opportunities and risks. It requires a keen eye for trends, an understanding of market dynamics, and the ability to decipher complex charts.
I recently met with my stock market friends on the weekend and discussed the cautious approach investors should take towards private banks.
Let me write my thoughts on analysis and the quest for the right investment moves.
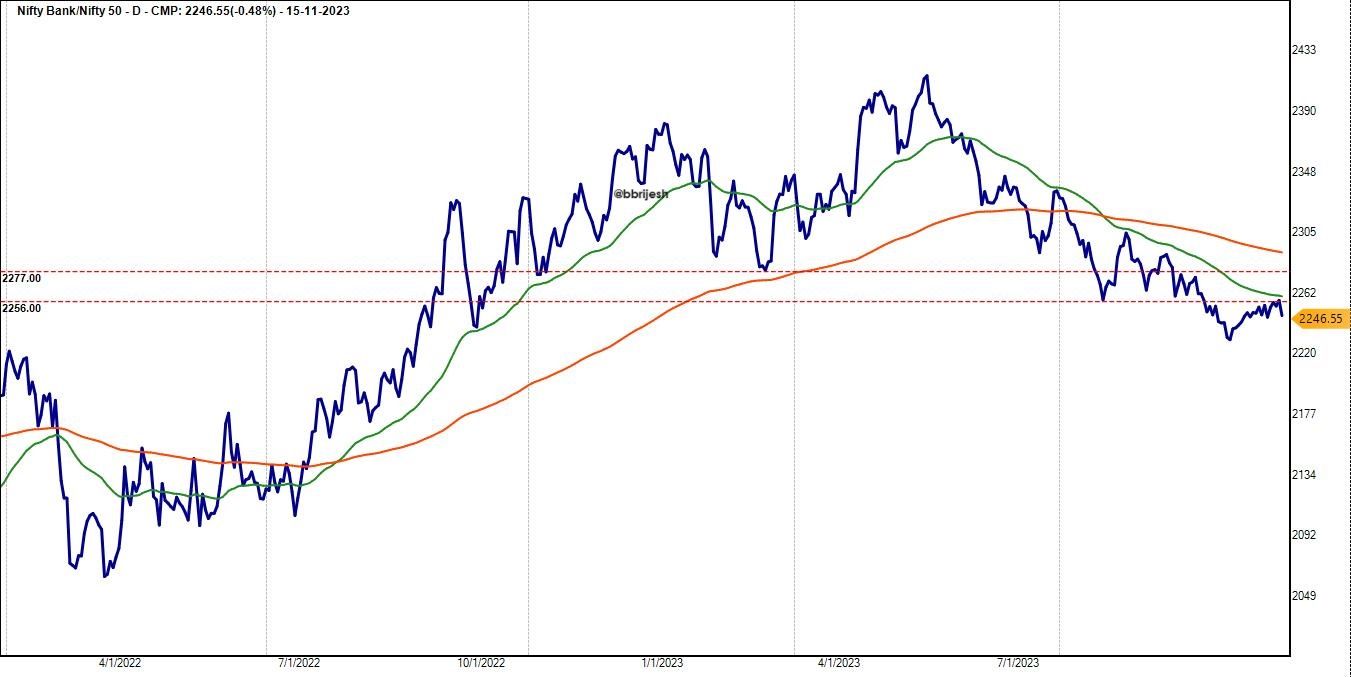
Me: Hey there! Have you ever considered why some investors avoid private banks in their portfolios?
Trader Dost: Well, not really. I've always considered banks as a stable investment. What's the deal?
Me: It's interesting. I've been looking at the BankNifty/Nifty50 ratio chart, and it's telling me a compelling story.
Trader Dost: Ratio chart? What's that?
Me: It's a chart that compares the performance of two indices, in this case, BankNifty and Nifty50. Lately, the ratio has resisted at the breakdown level, suggesting that Nifty50 is gaining strength and outperforming BankNifty. Banking stocks weigh 36% in Nifty50 and if they underperform, other sectors may lead the Nifty higher.
Trader Dost: So, what does that mean for private banks?
Me: Well, the series of breakdowns and lower highs/lows indicate an underperformance of BankNifty compared to Nifty50. It might be time to switch out of banking stocks.
Trader Dost: How and where are you making this analysis?
Me: I'm using the TradePoint ratio chart, which allows me to add indicators like the Double-Moving Average of 50EMA and 200EMA. The Death Cross between these moving averages is a signal that BankNifty might underperform Nifty50.
Trader Dost: Death Cross? That sounds ominous. What is it?
Me: It's when the short-term moving average crosses below the long-term moving average, indicating a potential downward trend. In our case, it suggests an underperformance of BankNifty.
Trader Dost: Wow, that's a powerful analysis tool. Why haven't I used this before?
Me: Exactly! It adds more conviction to your analysis. I'm betting on this to guide my investment decisions.
Trader Dost: So, if not banks, where are you looking to invest?
Me: Funny you ask. I recently suggested selling HDFC Bank and buying TCS. If that pans out, it could support the theory of BankNifty underperforming Nifty50. Read here https://forum.definedgesecurities.com/topic/1042/buy-tcs-sell-hdfc-bank-a-sound-decision
Trader Dost: Interesting move. What's your take on this?
Me: I'd love to hear what others think. The comment section is open for discussions. What's your view on the current state of private banks and alternative investment options?
Trader Dost: I'm intrigued. I'll definitely share my thoughts. Let's keep the conversation going!
-
Making decisions about which stocks to swap within your investment portfolio is never a simple task. It involves careful evaluation of various factors, including past performance, future potential, and broader market trends.
Among the tools and techniques available to investors, one of the most insightful is ratio analysis. By assessing the relative performance of different assets through ratios, you can gain valuable insights that inform your stock-swapping decisions.
It's not just about what you buy or sell; it's also about when you do it.Today, I am sharing a compelling strategy: Buy TCS - Sell HDFCBANK Bank
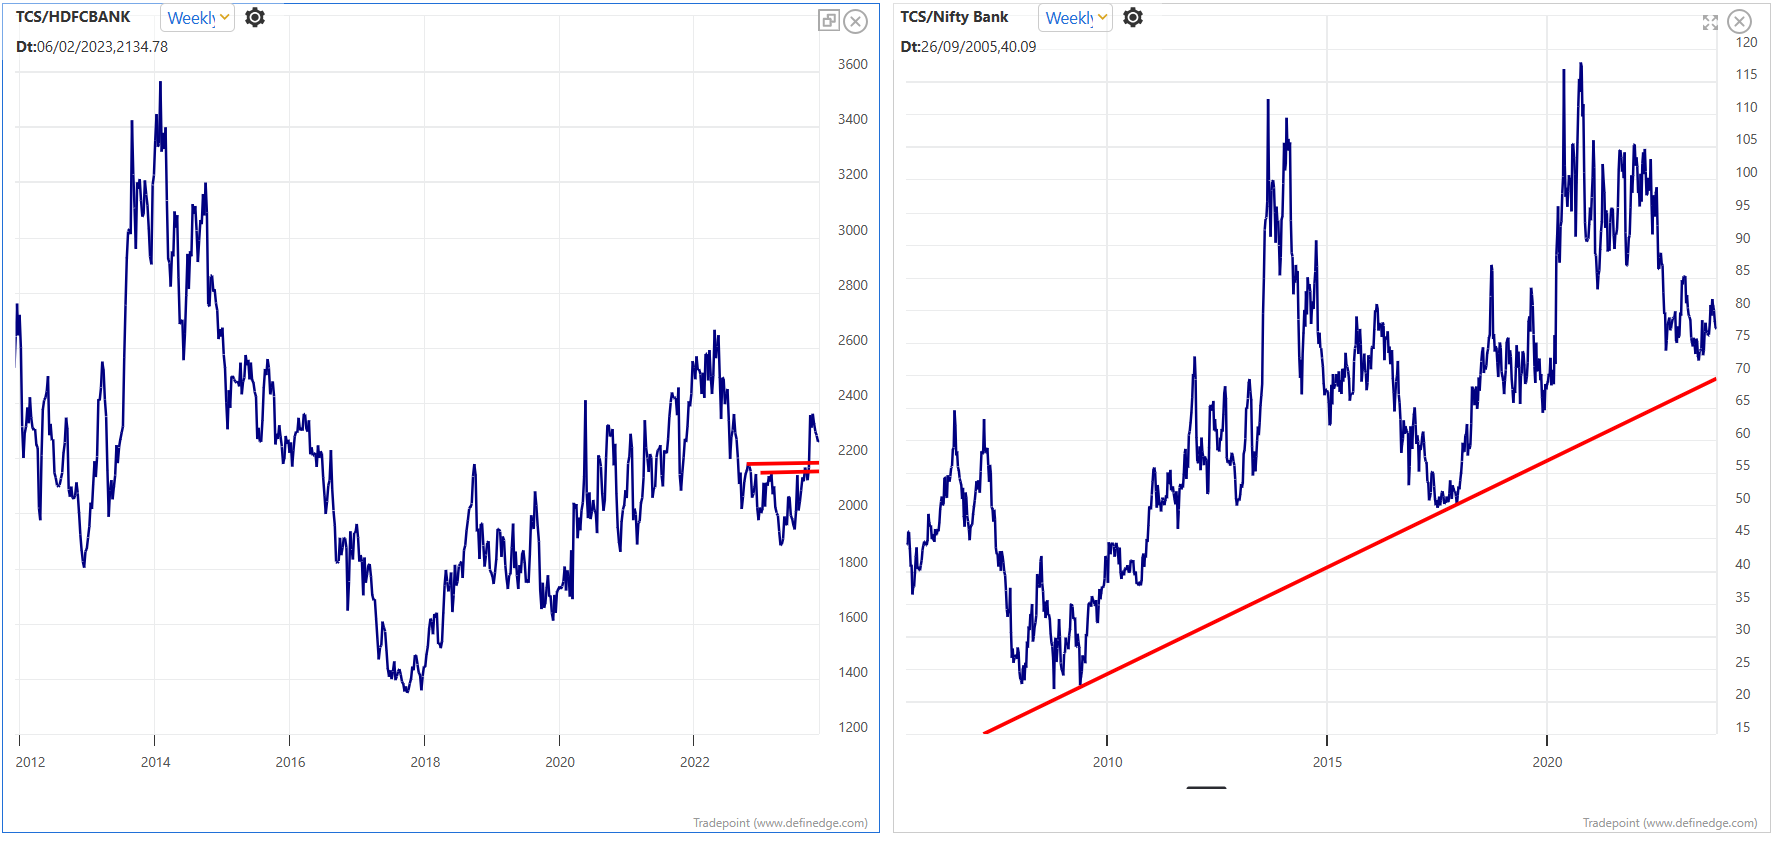
Understanding the Ratio Chart:
A ratio chart is a powerful tool that allows investors to assess the relative performance between two assets, making it easier to identify trends and potential investment opportunities. In our case, we'll focus on the TCS/HDFCBANKBANK ratio chart to help shed light on the decision to rebalance portfolios.1. Higher Highs and Higher Lows:
The weekly ratio chart for TCS/HDFCBANK exhibits a fascinating pattern - the "higher high - higher low" structure. This structure suggests that TCS has consistently outperformed HDFCBANK over the given timeframe. In simpler terms, TCS's performance is on an upward trajectory compared to HDFCBANK, indicating that it might be time to reduce your portfolio's weight in HDFCBANK and consider reallocating those resources to TCS.2. TCS/BANKNIFTY Ratio:
Another essential ratio chart to consider is TCS in comparison to the BANKNIFTY index. This ratio chart depicts a long-term rising trendline, hinting at the possibility of a reversal. In other words, it suggests that TCS is poised to outperform the broader BANKNIFTY index in the foreseeable future.3. Impact on Sector Weightage:
HDFCBANK carries a substantial weight in the BANKNIFTY index. With a growing presence of the IT sector in the market, spearheaded by TCS, it's becoming increasingly clear that banking stocks, including HDFCBANK, may face competition. As the weightage of HDFCBANK decreases in the index, the influence of the IT sector is rising, and this transition has the potential to impact the overall sector dynamics.Leveraging Ratio Charts on TradePoint:
The ratio charts in TradePoint and RZONE have made it easier for investors to make data-driven decisions. With these charts, you can compare various instruments, such as stocks, indexes, commodities, and bonds, to evaluate their relative performance.Are You Ready to Make the Swap?
The question on every investor's mind is, "Are you prepared to transition from HDFCBANK Bank to TCS?"
The answer depends on your investment objectives, risk tolerance, and belief in the trends revealed by ratio charts. It's crucial to consult with your financial advisor before making any substantial changes to your portfolio.We encourage you to share your thoughts and insights in the comments section below.
-
@Pavan Talwani Will check with Definedge Team and update.
-
@Neha V Good to know Neha.
-
@Purav Choksi HUF Yes it went long at 1:15pm.
-
Gratitude to all the participants of DECMA2023 who are following my Heikin Ashi Strategy.
My motto in developing trading strategies is to #KeepItSimple. I'm glad that some of the DECMA2023 participants are following my Heikin Ashi strategy and coming up with different time-frame ideas, we discussed them in detail.
The Last Nifty Short Trade of 719 points
The reason I'm writing this today is to highlight the last trade of over 700 points in Nifty Futures short.
I have no shame in admitting that my discretionary style was unable to catch this fall, but discipline and confidence in the Heikin Ashi system helped me to profit from the recent decline. I watched the decline unfold without any short trades in my discretionary view. Yes, you read it right, not a single short trade in my discretionary view.
Here is the trade as per the HeikinAshi System (refer chart below):
-
Went short on 18th October 2023 at 19,730 in October Futures.
-
The open position was rolled over to the November series at a premium of 100 points. Net Sell Price is 19,830.
-
The stop-loss triggered today at 19,111.
This trade resulted in a profit of 719 points.
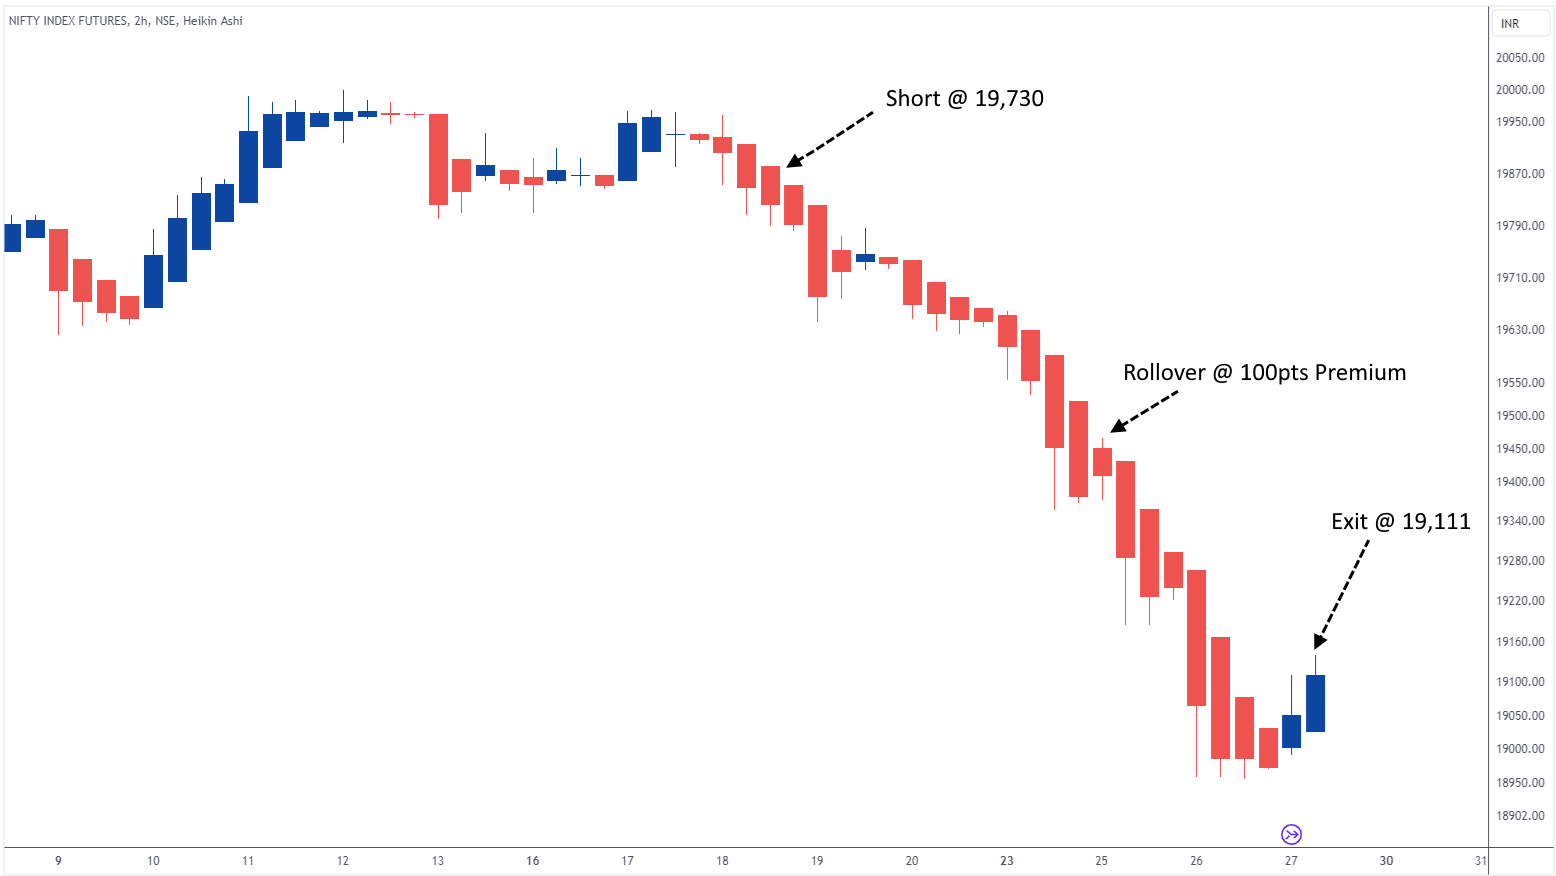
The Heikin Ashi strategy is a simple and effective way to trade. It is a disciplined approach that can help traders to avoid emotional trading and to make consistent profits.
I want to emphasize the importance of discipline and confidence in trading. Even though I had no discretionary short trades in this case, I was able to profit from the decline because I had confidence in the Heikin Ashi system.
If you have doubts about the Heikin Ashi strategy, feel free to connect.
-
-
@Satish Vijaykumar Thanks Satish
-
@Prasiddh Shroff Thanks a lot Prasiddh Sir.
-
Small Cap Index has experienced a remarkable rally in 2023, achieving a significant gain of over 30%. However, this surge has prompted investors to question whether this represents a market top. Recent profit-taking activity has pushed the index down by more than 5% from its peak of 13,148. This report aims to assess whether the Small Cap Index has reached its peak and to provide insights into its current status.
At the outset of this week, the market witnessed broad-based selling, leading to concerns among traders and investors about the possibility of a market top. It is crucial to evaluate whether this recent downturn is indicative of a more significant trend reversal.
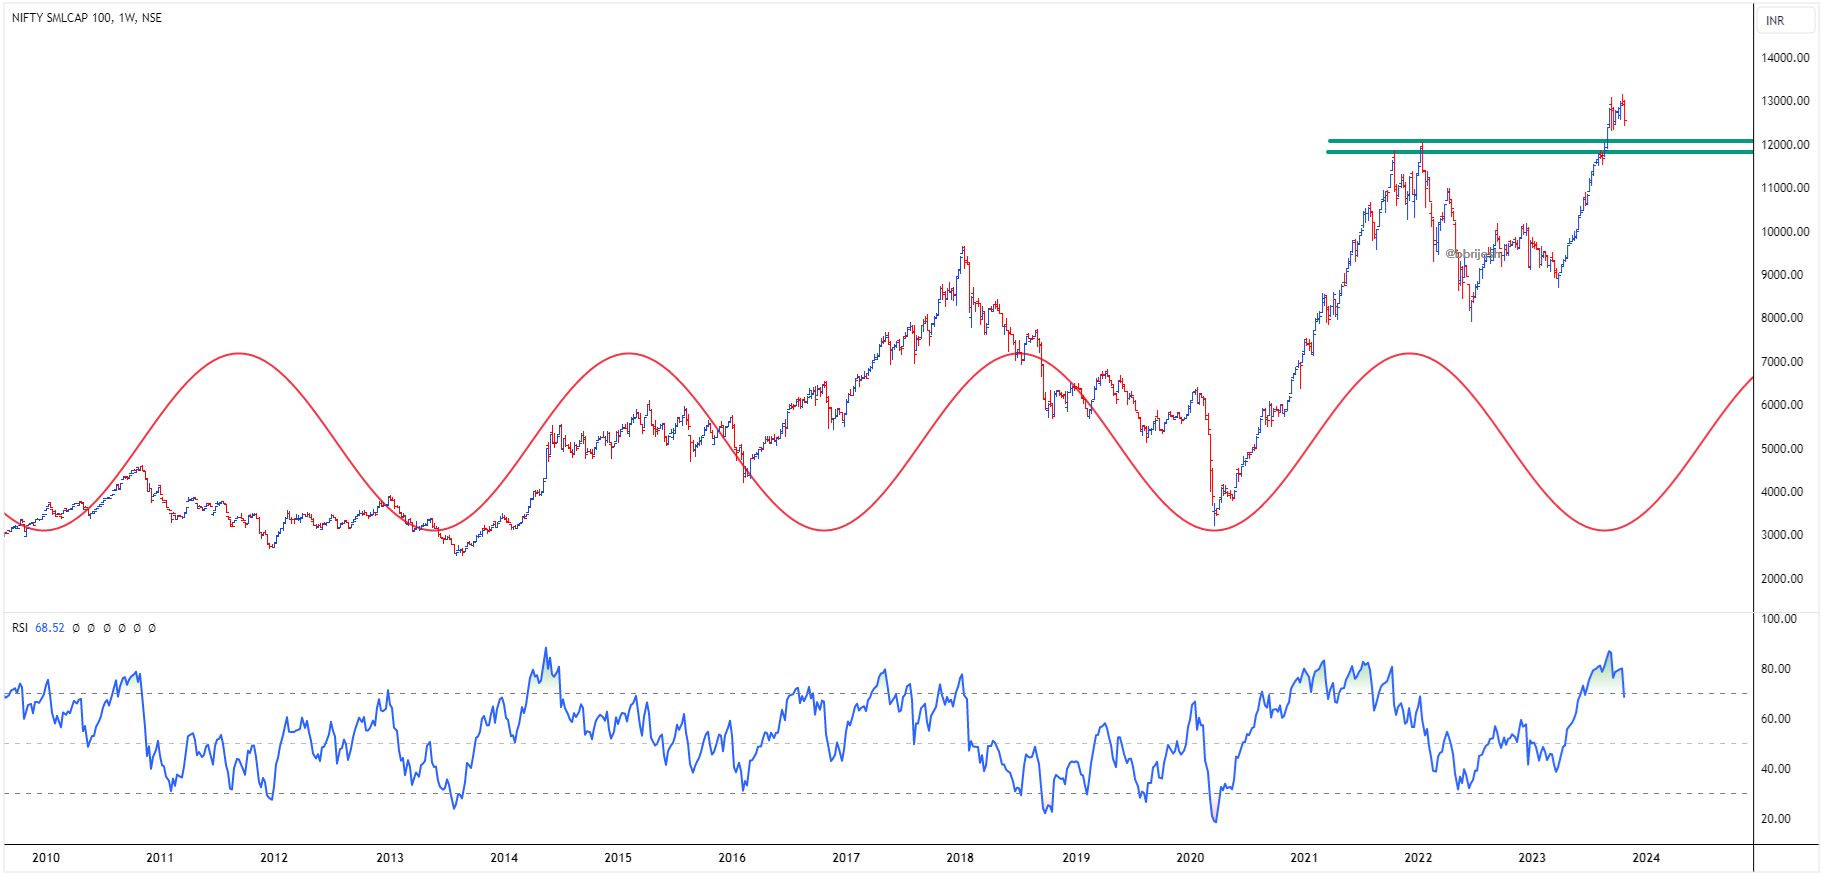
Small Cap Index currently stands above a crucial support zone from 11,600 to 12,000. While recent events may have caused anxiety, it is essential to consider the index's position within this range. As long as the index maintains its position above this support zone, it is more likely to experience a time correction rather than a significant price correction.
Despite short-term fluctuations, there is reason to remain optimistic about the Small Cap Index's performance. The potential for the index to reach levels of 16,000 by the second quarter of 2024 remains a plausible scenario.
On a technical note, the Sine Wave on the weekly chart indicates a bullish scenario. This suggests that the recent dip to 12,000 can be viewed as an opportunity for investors to accumulate shares of small-cap stocks that are outperforming the market or those with strong fundamentals.
One of the red flags that has caught the attention of market participants is the overbought Relative Strength Index (RSI). It is essential to acknowledge that the RSI appears stretched now. However, it is crucial to emphasize that a possibility exists for a time correction rather than a significant price correction. This could bring the RSI back within the 50-60 range in the coming weeks, thereby reducing concerns about overbought conditions.
While it may be premature to declare that the Small Cap Index has reached its peak at the current market price of 12,500, a cautious approach is advisable. Instead of calling a top, it may be prudent to consider buying opportunities on dips to 12,000, given the index's strong position within the 11,600-12,000 support zone. Traders and investors should closely monitor the market, considering the potential for a time correction and the bullish signals from the Sine Wave, which could support further upside potential in the small-cap segment.
-
A Mumbaikar will never forget the night of the July 26, 2005 floods which is depicted in the second season of Mumbai Diaries on Amazon Prime. In this season, the doctors find themselves in a war room of their own, battling a relentless influx of patients.
Meanwhile, in the world of finance, traders are engaged in a different kind of war room, navigating the unpredictable seas of the stock market. Despite the apparent differences between these two professions, there are striking similarities that often go unnoticed.
Having spent 17 years as a Research Analyst in the retail broking industry, I've had the privilege of meeting numerous doctors who are actively engaged in trading equity and commodity derivatives.
As I immersed myself in the world of trading and observed their involvement, I couldn't help but draw parallels between these two seemingly distinct professions.
While opinions may vary, I firmly believe that doctors have the potential to excel as traders. The combination of their discipline, analytical mindset, and ability to make critical decisions under pressure positions them well to navigate the complexities of financial markets.
It's a convergence of skills and attributes that may surprise some, but in my experience, it's a path to success that can yield impressive results.
1. Dedication to Learning
One of the key similarities between traders and surgeons lies in their unwavering dedication to learning. Both professions require years of rigorous education and continuous training to stay at the top of their game.
Surgeons spend years in medical school followed by intensive residencies and fellowships. They are constantly updating their knowledge with the latest advancements in medicine and surgical techniques.
Similarly, successful traders invest time in studying financial markets, economic trends, and various trading strategies. They attend seminars, read research reports, and adapt to the ever-evolving landscape of the stock market.
2. Laser-Like Focus
In the world of trading, distractions can be costly. A successful trader must maintain a laser-like focus on market movements, news, and their own strategies. The same applies to surgeons who must concentrate entirely on the patient and the procedure at hand, often for long hours.
In both fields, split-second decisions can have life-changing consequences. A trader needs to make quick decisions about buying or selling stocks, just as a surgeon must make critical choices during surgery.
The ability to stay focused under pressure is a shared trait that sets apart the best in both professions.
3. Specialization of Knowledge
Both surgeons and traders understand the importance of specialization within their respective fields. Surgeons often choose to specialize in specific areas such as neurosurgery, orthopaedics, or cardiology. This specialization allows them to develop a deep understanding of a particular aspect of medicine, making them experts in their chosen field.
Similarly, traders often specialize in certain financial instruments or sectors. They may focus exclusively on stocks, commodities, or currencies. This specialization enables them to become specialists in a particular market or study niche, allowing for more in-depth analysis and a higher likelihood of success.
By the way, attendees of #DECMA2023 were fortunate to receive a valuable asset in the form of the book "Trading Options - The Definedge Way," highlighting the expertise and specialization that takes years to cultivate, thanks to the authors @Prashant-Shah @AP @Raghunath-Reddy @Raju-Ranjan
4. Managing Risk
Risk management is another fundamental aspect that traders and surgeons have in common. Surgeons are well aware of the risks associated with surgical procedures and take meticulous precautions to minimize them. Similarly, traders must assess and manage risks associated with their investments to protect their capital.
Both professionals understand that success does not mean eliminating risk entirely but rather managing it effectively. They use their expertise to make informed decisions that balance potential rewards with potential risks.
If you've watched this web series, you will encountered the crucial aspect of risk management as the doctors operated on the eight-year-old child.
While on the surface, trading and surgery may seem like entirely different worlds, the similarities between these two professions are remarkable. The dedication to learning, laser-like focus, specialization of knowledge, and risk management are shared traits that contribute to the success of both traders and surgeons.
If you are a doctor and reading this post, do share your experience.
-
@Ilyas Shaikh Thanks
-
@Ritesh Badai Thanks Malik
-
@RAGUNATH_AG Thanks Sir.
-
In the dynamic world of stock trading and investment, finding a strategy that consistently delivers results can feel like searching for a needle in a haystack.
Over the years, I've had countless discussions about the Laidback Strategy with subscribers of Definedge, whether it's been online through WhatsApp, Telegram, or in person at Manthan, DECMA, or DECNOCH.
My conviction in this strategy has grown over time, fueled by its consistent performance and the multiplier effect it offers in certain market conditions.
The current market environment has been characterized by a stellar rally in midcap and smallcap stocks, attracting the attention of system traders and investors alike.
It's worth acknowledging and commending the well-timed release of the video presentation on the Laidback Strategy by @AP sir.
The strategy aligns perfectly with the ongoing market trends, making it especially relevant and attractive.
If you haven’t watched the video yet, Click here https://www.youtube.com/watch?v=opYHnfDP6l8&t=76s
One of the primary reasons for my conviction in the Laidback Strategy is its remarkable ability to harness the multiplier effect during favourable market trends.
Having employed this strategy for many years, I can confidently assert that such opportunities arise only 2-3 times in a decade and this rally is one of them.
While predicting market rallies is not always possible, having a reliable system in place simplifies the process allowing the rally itself to generate substantial profits. With each profitable rally, my conviction in the Laidback Strategy multiplies and it surprises me with its potential.
As part of my regular stock updates on the strategy in the Definedge Telegram Group, Suzlon was highlighted during the week ending June 9, 2023. This stock holds a special place in trader's and investor's discussions due to its fascinating history. As highlighted in the video, this system helps to eliminate the toxic stocks and Suzlon serves as a prime example of how this strategy helps eliminate toxic stocks.
Interestingly, Suzlon had not given a buy signal since 2008 until June 2023, when the Laidback Strategy finally triggered a buy signal at Rs.14.xx, after a 15-year gap. This extraordinary event is a testament to the strategy's prowess.
Acting on this signal without hesitation, I invested, and within a few months, the stock had doubled in value. It is currently trading at Rs.29 with no exit plan in place.
This is not the first time such a setup has been highlighted by Laidback Strategy.
I've encountered a similar setup in Tata Teleservices (TTML), which presented a buying opportunity at Rs.9 in January 2021. Remarkably, this marked the first long signal for the stock since 2007. What followed is now history, as the stock surged to over Rs.200.
Let's not set our expectations too high for Suzlon
The key takeaway from these experiences is the importance of remaining loyal to a single system over the years and comprehending its integral components. This steadfast approach can unveil the full potential of the system, consistently multiplying conviction with every successful trades.
I firmly believe that the success of any trading system hinges on the discipline with which its rules are followed. The Laidback Strategy, with its well-defined principles and ability to adapt to market conditions, exemplifies the importance of disciplined execution.
The Laidback Strategy continues to be a source of surprises which raise the conviction bar and profitability in my trading journey, and I encourage all traders and investors to explore its potential.
-
Investing in the stock market can be a rewarding but a challenging journey. To make informed decisions, investors or traders often turn to various tools and methods, one of which is technical analysis.
Technical analysis involves studying historical price and volume data to forecast future price movements. One crucial aspect of this analysis is identifying rejection points, where stock prices show signs of resistance or reversal.
Understanding Technical Analysis
Before delving into spotting rejection, it's essential to understand the fundamentals of technical analysis:
-
Price Charts: Technical analysts use price charts, such as candlestick, bar, or line charts, to visualize historical price movements. These charts display price data over time, helping analysts identify patterns and trends.
-
Support and Resistance: Support represents price levels at which a stock tends to find buying interest, preventing it from falling further. Resistance, on the other hand, is where selling pressure emerges, preventing the stock from rising higher.
-
Indicators: Technical analysts employ various indicators like moving averages, Relative Strength Index (RSI), and MACD (Moving Average Convergence Divergence) to gain further insights into price trends and momentum.
Spotting Rejection Points:
-
Identify Support and Resistance Levels: The first step in spotting rejection is to identify support and resistance levels on the price chart. These levels are usually determined by previous price highs and lows or key psychological levels (e.g., round numbers like $50 or $100).
-
Patterns: Patterns provide valuable clues about market sentiment.
For example reversal candlestick patterns, such as shooting stars, doji, or bearish engulfing patterns near resistance levels, and bullish patterns near support levels. These patterns often indicate potential rejection points. -
Volume Analysis: Pay attention to trading volume at potential rejection points. A significant increase in volume as the price approaches resistance may signal a potential rejection. Conversely, a surge in volume near support could indicate a rejection of lower prices.
-
Overbought and Oversold Conditions: Use oscillators like RSI to gauge whether a stock is overbought (near resistance) or oversold (near support). An RSI above 70 suggests overbought conditions, while an RSI below 30 indicates oversold conditions. These extremes can signal potential reversals.
-
Trendlines: Simple and effective, draw trendlines on the price chart to visualize the stock's trend. When the price approaches an upward trendline in an uptrend or a downward trendline in a downtrend, it could act as a rejection point. A break of the trendline may signify a reversal.
-
Moving Averages: Moving averages can help smooth out price data and identify trends. The interaction between the stock's price and moving averages (such as the 50-day or 200-day) can indicate potential rejection points. A stock crossing below its moving average may face resistance at that level.
-
Fibonacci Retracement Levels: Fibonacci retracement levels are ratios derived from the Fibonacci sequence. They are often used to identify potential support and resistance levels. Traders look for price reactions at these levels as potential rejection points.
Spotting rejection points in stock prices through technical analysis is a valuable skill for investors and traders. By identifying these points, you can make more informed decisions about when to enter or exit a position. However, it's important to remember that no analysis technique is foolproof, and it's crucial to combine technical analysis with other forms of research and risk management strategies.
Additionally, staying updated with market news and events can help you refine your rejection-spotting abilities and make more confident investment choices in the ever-changing world of the stock market.
-
-
@Ilyas Shaikh Glad you liked it.
-
Ah! Finally, the stock price reached my ENTRY-LEVELS AFTER YEARS.

Have you ever experienced this feeling and situation before?

Investors who initially buy stocks based on herd mentality often find themselves in a unique predicament when their short-term trades unexpectedly transform into long-term investments.
This is what most of the investors are experiencing in the PSU and PSE stocks.
Driven by the fear of missing out (FOMO) and influenced by the crowd's enthusiasm, these investors may hastily jump into stocks, only to discover that they are now stuck with them for years. This unintended shift from short-term speculation to long-term commitment can lead to a range of psychological and financial challenges, as they navigate the complexities of holding onto investments that were never intended for the long haul.
This brings me to explore the psychological impact on long-term investors when their stocks finally reach the buying prices after holding them for 3-5-7-10 years.
Let's jump into the emotional journey, behavioural patterns, and decision-making processes of investors in such situations. The insights are derived from general market dynamics and investor behaviour.
Buy and HOPE
Long-term investing is a strategy where investors buy stocks with the intention of holding them for an extended period, often years, with the hope of realizing substantial capital gains.
The journey of long-term investing can be chaotic, and investors often face significant psychological challenges along the way.
One of these challenges is the psychological impact when stocks finally reach the buying prices after an extended period.
Psychological Impact
Patience and Anxiety
Long-term investors often exhibit patience and resilience during prolonged periods of underperformance. However, as the stock price approaches their initial buying price, anxiety may set in.The fear of losing gains, also known as "loss aversion," can make investors uneasy about whether to sell or continue holding.
Regret Aversion
Investors may experience "regret aversion" as the stock price nears their buying price. They might recall missed opportunities to invest elsewhere or regret not selling earlier during the holding period when the stock's value was lower. This regret can lead to a sense of hesitation and indecision.Anchoring Bias
Anchoring bias is another psychological phenomenon where investors fixate on their initial buying price as a reference point.When the stock price approaches this reference point, they may become overly focused on breaking even, even if the stock's fundamentals have improved significantly since their initial purchase.
Confirmation Bias
Confirmation bias can lead investors to seek out information that supports their decision to hold or sell when the stock approaches the buying price.They may ignore negative news and disproportionately emphasize positive information to validate their choice.
Case Study (Hypothetical)
Consider an investor who purchased shares of XYZ Inc. at Rs.50 per share. The stock went through a roller-coaster ride, hitting a low of Rs.15 per share before gradually climbing back to Rs.50 after 7 years. During this time, the investor experienced a range of emotions, including anxiety, regret, and anchoring bias.
Initially, the investor was optimistic about XYZ Inc.'s potential and believed in its long-term prospects. However, as the stock price approached Rs.50, the investor started questioning their decision to hold, fearing they had missed better opportunities elsewhere. They also clung to the notion of breaking even, even though the company's fundamentals had improved.
Ultimately, the investor decided to hold onto their XYZ Inc. shares, partly due to confirmation bias, as they selectively focused on positive news about the company's future growth prospects.
What Should an Investor Do?
Diversification:
Investors should maintain diversified portfolios to mitigate the psychological impact of a single stock underperformance.Emotional Awareness:
Self-awareness of emotional reactions and biases when stock prices approach buying levels. Investors should seek professional advice when needed.Long-Term Perspective:
Emphasize the importance of a long-term perspective and the role of time in investment success. Highlight that short-term fluctuations are a natural part of the market.Stress-Testing:
Investors should stress-test their investment decisions by considering various scenarios, including the possibility of the stock never reaching their buying price again.Exit Strategy:
Investors should develop a clear exit strategy when their investments approach the buying price. This strategy should be based on a rational assessment of the stock's current fundamentals, technical and market conditions.Summing-up
Long-term investors often face significant psychological challenges when their stocks finally reach their buying prices after holding them for years.
Understanding the emotional and behavioural aspects of such situations is crucial for investors to make informed decisions.
By promoting diversification, emotional awareness, and a long-term perspective, investors can better navigate the psychological impact of these scenarios and make more rational investment choices.
-
Traders are often engrossed in perfecting their trading strategies, honing risk management techniques, and optimizing position sizing. It's an essential aspect of the trading world.
The cornerstone of technical analysis teaches us that history repeats itself in the market. Yet, if traders neglect to delve into their own trading history, they miss out on a valuable opportunity to enhance their most critical asset—their capital account.
The often-overlooked asset I'm referring to is your own trading journal. This journal not only captures your trading history but serves as a treasure trove of insights and lessons that can ultimately lead to more informed and profitable trading decisions.
A trade journal is important to review for several reasons:
-
Track Progress: It allows you to track your progress over time. By regularly reviewing your trade journal, you can see how your trading strategies are performing and identify patterns or trends in your trading activity.
-
Learn from Mistakes: It helps you learn from your mistakes. When you document your trades, you can analyze what went wrong when you incur losses, helping you avoid making the same errors in the future.
-
Develop and Refine Strategies: It aids in strategy development and refinement. You can assess which trading strategies are most effective and make adjustments based on your journal's data.
-
Emotional Control: It promotes emotional control. Trading can be emotionally charged, and a journal can help you identify emotional triggers that may lead to impulsive decisions.
-
Risk Management: It assists in risk management. You can review your position sizes, stop-loss levels, and risk-reward ratios to ensure you are managing your risk effectively.
-
Accountability: It holds you accountable for your decisions. When you have a record of your trades, you're less likely to deviate from your trading plan.
-
Tax and Compliance: It can be crucial for tax and regulatory compliance. Accurate record-keeping is essential for reporting capital gains or losses and ensuring compliance with tax laws.
-
Performance Evaluation: It provides a basis for evaluating your overall trading performance and making informed decisions about whether to continue or adjust your trading activities.
In summary, a trade journal is a valuable tool for traders to track their performance, learn from their experiences, and make data-driven decisions to improve their trading strategies and results.
-
-
@Prashant Bhimte Glad to know it adds values for the readers.
-
@RAGUNATH_AG Thanks

-
Market breadth is a crucial aspect of analyzing equity markets. It provides valuable insights into the overall health and direction of a stock market index or the broader economy.
Market breadth refers to the measurement of the number of stocks advancing or declining within a particular stock market index. It serves as an indicator of the overall strength or weakness of the market and provides essential context for traders and investors.
Market breadth indicators include metrics such as the advance-decline ratio, new highs vs. new lows, and the percentage of stocks trading above their moving averages. These indicators help investors assess market sentiment, identify potential reversals, and make informed trading decisions.
By examining the significance and limitations of market breadth, we can arrive at a more informed perspective on its role in the analysis of equity markets.
Significance of Market Breadth
-
Broad Market Overview: Market breadth offers a comprehensive view of market dynamics beyond the performance of a few prominent stocks.
A market may appear bullish based on the performance of a few blue-chip stocks, but a deeper analysis of breadth indicators can reveal underlying weaknesses or strengths. -
Confirmation of Trends: Market breadth can confirm or diverge from the primary trend of a market index as we witnessed in the last few months.
When most stocks participate in an uptrend (positive breadth), it confirms a bullish market. Conversely, when more stocks are declining (negative breadth), it can signal a bearish market. -
Early Warning Signals: Breadth indicators can be early warning signals for potential market reversals. Looking at today's market breadth, is it reasonable to consider whether the top is in place?
Divergences between market indices and market breadth can indicate an impending shift in sentiment and help investors prepare for market corrections. -
Risk Management: The inclusion of market breadth analysis in investment strategies enhances risk management. A diversified portfolio that considers the breadth of the market is less susceptible to the adverse impacts of isolated stock underperformance.
-
Contrarian Opportunities: Extreme market breadth readings can present contrarian investment opportunities. When market sentiment becomes overly bullish or bearish, it can lead to reversals, allowing contrarian investors to profit.
Weightage Considerations
The weightage assigned to market breadth indicators should be considered within the broader context of equity market analysis. Several factors should influence the decision on how much weight to give to market breadth:
-
Market Conditions: Market breadth is more relevant during volatile or uncertain market conditions. In stable and predictable markets, other fundamental and technical factors may carry more weight.
-
Investment Horizon: Short-term traders may place higher importance on market breadth, as it can provide insights for quick trading decisions. Long-term investors may prioritize fundamental analysis and economic indicators over daily market breadth fluctuations.
-
Risk Tolerance: Risk tolerance varies among investors. Those with lower risk tolerance may pay more attention to market breadth for risk management, while high-risk tolerance investors might rely more on individual stock analysis.
-
Complementary Analysis: Market breadth analysis should complement other forms of analysis, including fundamental analysis, technical analysis, and macroeconomic analysis. A holistic approach is often the most effective.
Limitations of Market Breadth
While market breadth is a valuable tool, it has its limitations:
-
Lack of Specificity: Market breadth indicators do not provide detailed information about individual stocks. They convey the overall market sentiment but may not pinpoint specific investment opportunities.
-
Noise and False Signals: Breadth indicators can produce false signals, especially during short-term fluctuations. A single outlier stock can distort the overall breadth readings.
-
Macro Factors: Market breadth may not account for macroeconomic factors, geopolitical events, or central bank policies that can significantly impact equity markets.
-
Timing: It may not always provide precise timing for market entry or exit. Investors should use it in conjunction with other timing indicators.
Market breadth is a vital component of equity market analysis, offering insights into market sentiment and overall health. The weightage assigned to market breadth indicators should be flexible and dependent on various factors, including market conditions, investment horizon, risk tolerance, and the need for complementary analysis. While market breadth has limitations, it is a valuable tool when used in conjunction with other forms of analysis, helping investors make more informed decisions and manage risk effectively in the ever-changing world of equity markets.
-
-
Arvind, a prominent player in the textile and apparel industry, has been making waves in the financial markets as its stock price achieves an all-time high and breaks through a multiyear resistance zone.
Let's analyze both Point and Figure (P&F) chart and bar chart patterns to provide insights into the company's bullish momentum and potential implications for investors.

Point and Figure Chart Analysis (Left):
The Point and Figure chart for Arvind Fashion reflects a significant breakthrough. The stock's climb above the previous resistance zone is a noteworthy event that suggests a change in market sentiment.Additionally, the recent continuation breakout from the double top buy (DTB) pattern indicates that the bulls are taking control of the price action. This pattern typically signals a continuation of a previous bullish trend, indicating an upward movement in the stock's price.
The P&F chart's observations align with the idea that Arvind Fashion is experiencing a strong bullish trend, with the potential for further price appreciation.
Bar Chart Analysis (Right):
On the bar chart, the stock has broken multiyear highs and ventured into uncharted territory. This achievement is significant as it indicates the stock's ability to overcome historical resistance levels and reach new price levels that were previously unseen.Breaking into uncharted territory often suggests that the stock's momentum is strong and that investors have become increasingly optimistic about the company's future prospects.
-
Asian Paints stock has rallied from Rs.2,700 to Rs.3,568 but showing signs of caution at higher levels.
The stock has shown resistance at the long-term resistance zone of Rs 3,600 and witnessed a bearish momentum.
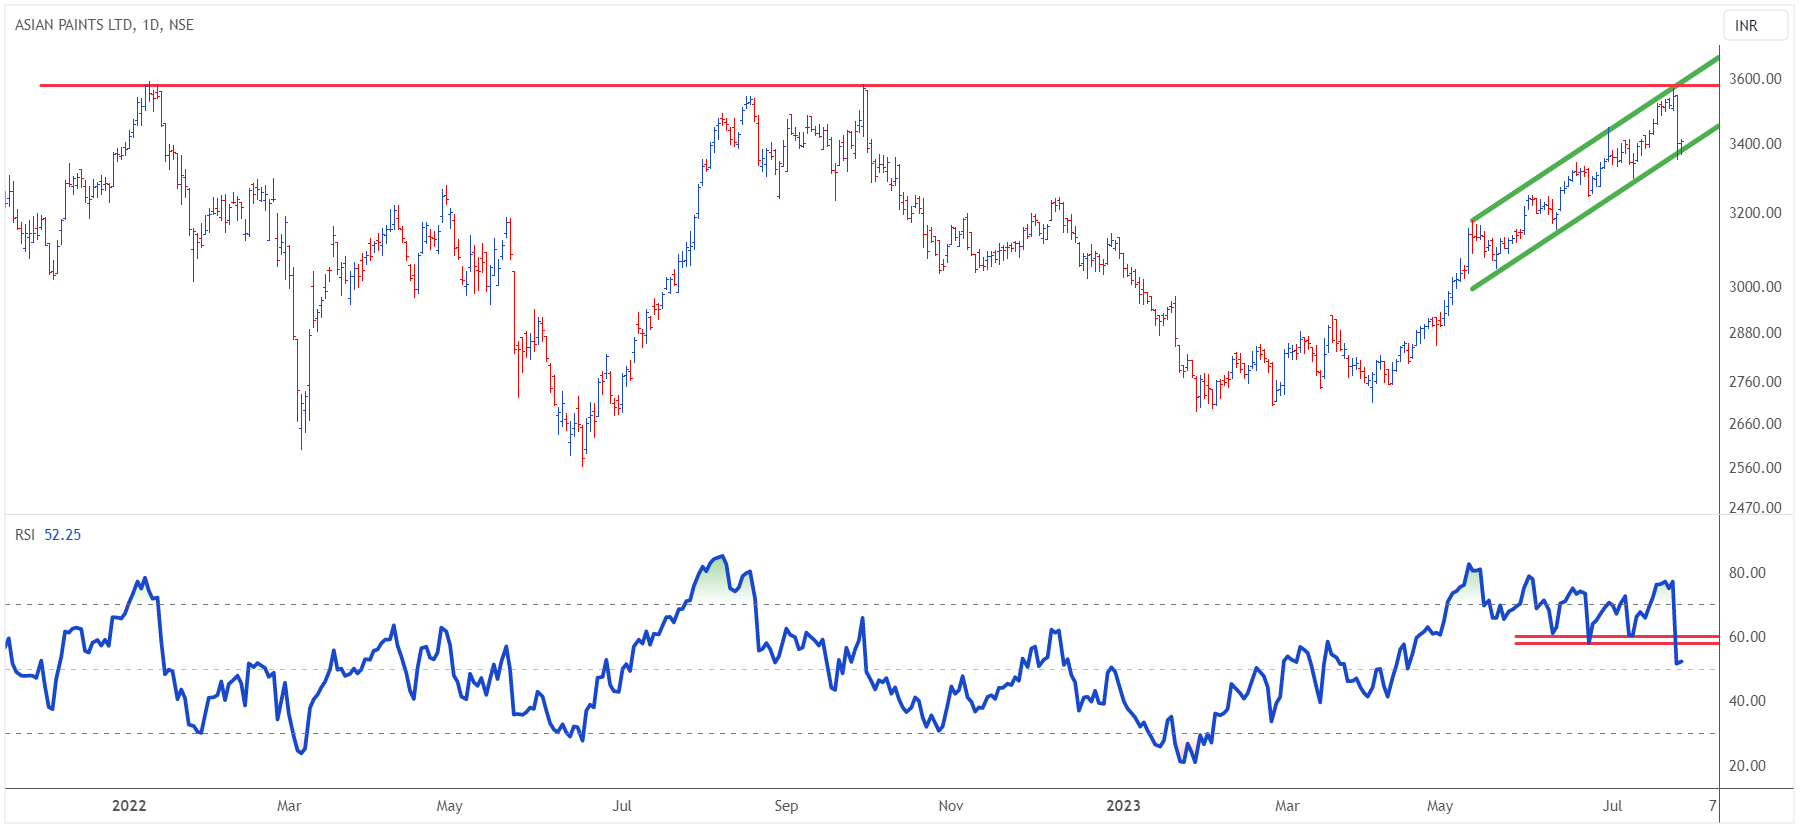
Long-term Resistance at Rs 3,600:
Asian Paints stock has encountered resistance at the long-term price level of Rs 3,600. Historically, this level has acted as a significant barrier to upward price movement.The inability of the stock to breach this resistance suggests that there is selling pressure in the market at this price level.
Breakdown from Rising Channel:
The recent price action of the stock indicates a breakdown from a rising channel pattern.A rising channel is characterized by an upward-sloping support and resistance line, which confines the stock's price within a defined range.
The breakdown from this pattern suggests a weakening of the uptrend and the potential for a bearish move.
The critical price level to watch is Rs 3,350 for the channel breakdown. If the stock sustains below this level, it could trigger further bearish momentum.
The breach of this support level might attract more selling interest, leading to a decline in the stock's price.
Bearish Rangeshift on RSI:
The Relative Strength Index (RSI) is a momentum oscillator that measures the speed and change of price movements.The bearish rangeshift on the RSI indicates a shift in momentum towards the bearish side. It suggests that the selling pressure is increasing, and bears are gaining control of the trend.
Implications of Sustainable Move Below Rs 3,350:
If Asian Paints stock continues to trade below the critical support level of the rising channel at Rs 3,350, it could accelerate the bearish momentum. This might lead to a further decline in the stock's price, potentially challenging additional support levels.Traders should closely monitor the stock's price action around this level as it could offer valuable insights into the future direction of the stock.
-
TTML has just begun the bullish moves, are you considering a purchase?
-
Great Work.
-
Infy - Almost 1,500
-
The bulls have made a strong comeback in the IT sector.
The charts show a breakout for Infosys, indicating a significant upward movement in its stock price.
As the bulls continue to dominate the IT sector, it will be interesting to see how Infosys capitalizes on this momentum.
-
In the dynamic world of stock markets, certain stocks capture the attention of investors with their astonishing price movements.
One such stock is TTML (Tata Teleservices Maharashtra Limited), which witnessed a dramatic rally in 2021, soaring over 10,000% from a mere Rs.2.9 to a remarkable high of Rs.290 within a span of 65 weeks.
However, as the law of gravity dictates, what goes up must come down. The stock subsequently experienced a significant correction, falling over 80% from its peak.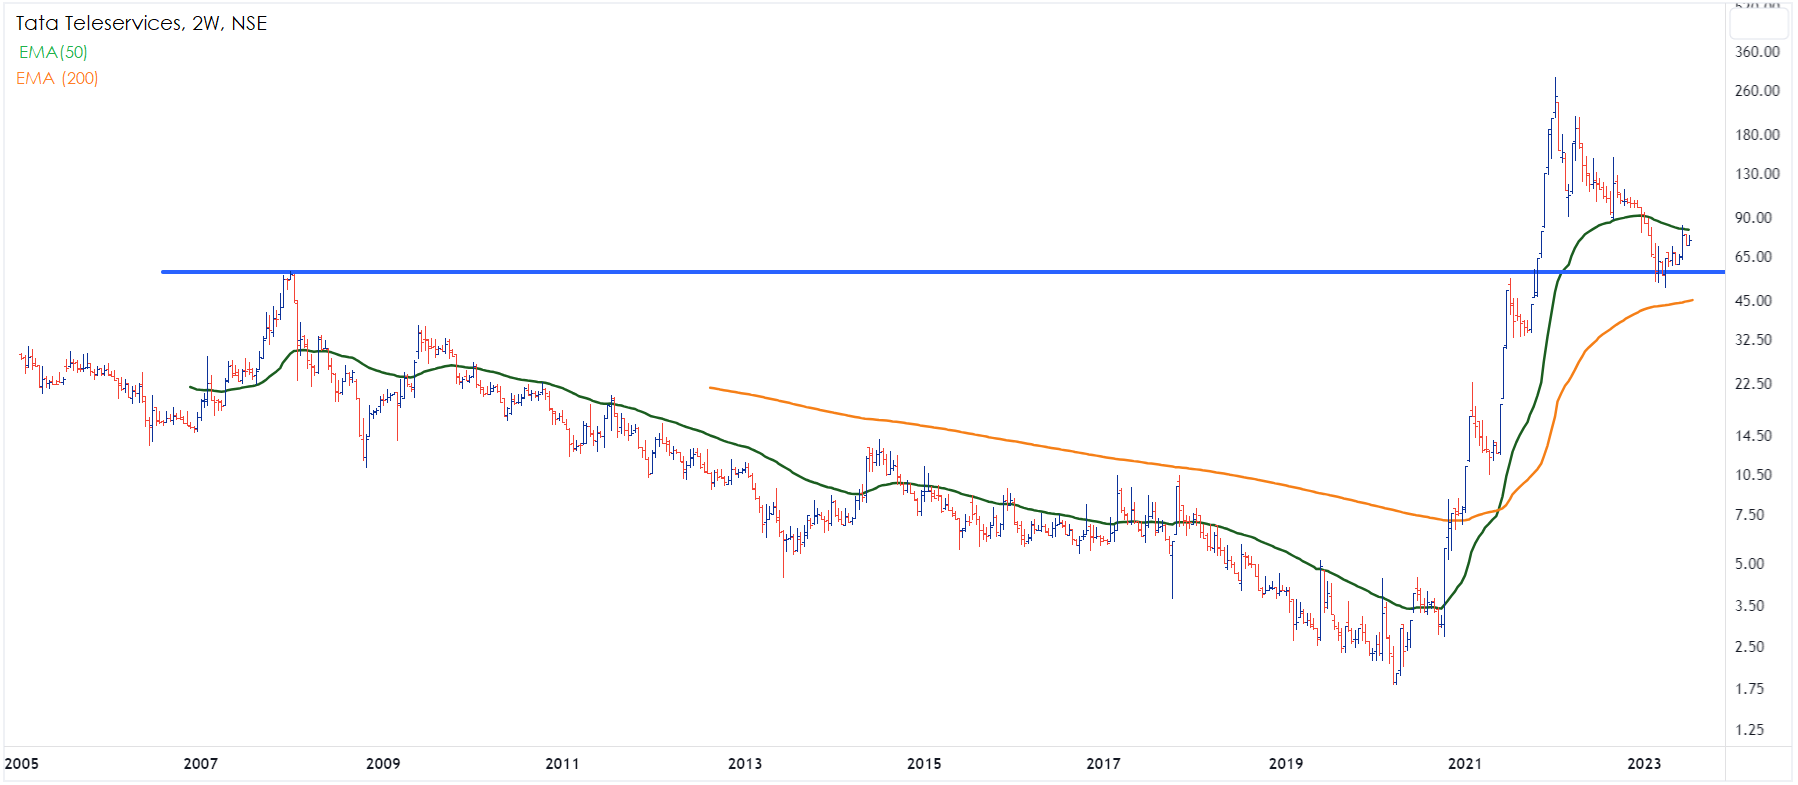
On the 2Week (2W) chart, TTML appears to have found a new base at the 2008 high of Rs.56, potentially the bottom at the resistance turn support.
The ability of the stock price to stabilize at this level suggests that buyers are stepping in, signaling a potential reversal of the downtrend and a resumption of the stock's upward trajectory.
Is it the Beginning of a New Roller Coaster Ride?
The recent price action and the establishment of a new base at Rs.56 for TTML indeed raise the question of whether another roller coaster ride is on the horizon. While it is tempting to anticipate a new rally, it is important to exercise caution. Past performance does not guarantee future results, and stock market investments always carry inherent risks.As investors, it is crucial to approach such situations with a balanced perspective, conducting thorough research and analysis, and employing risk management strategies. Only time will tell if TTML's stock is truly embarking on another roller coaster ride or if it will chart a different course altogether.
-
The stock price of CDSL (Central Depository Services Limited) has shown a significant breakthrough in its chart, signalling a potential shift in market sentiment.
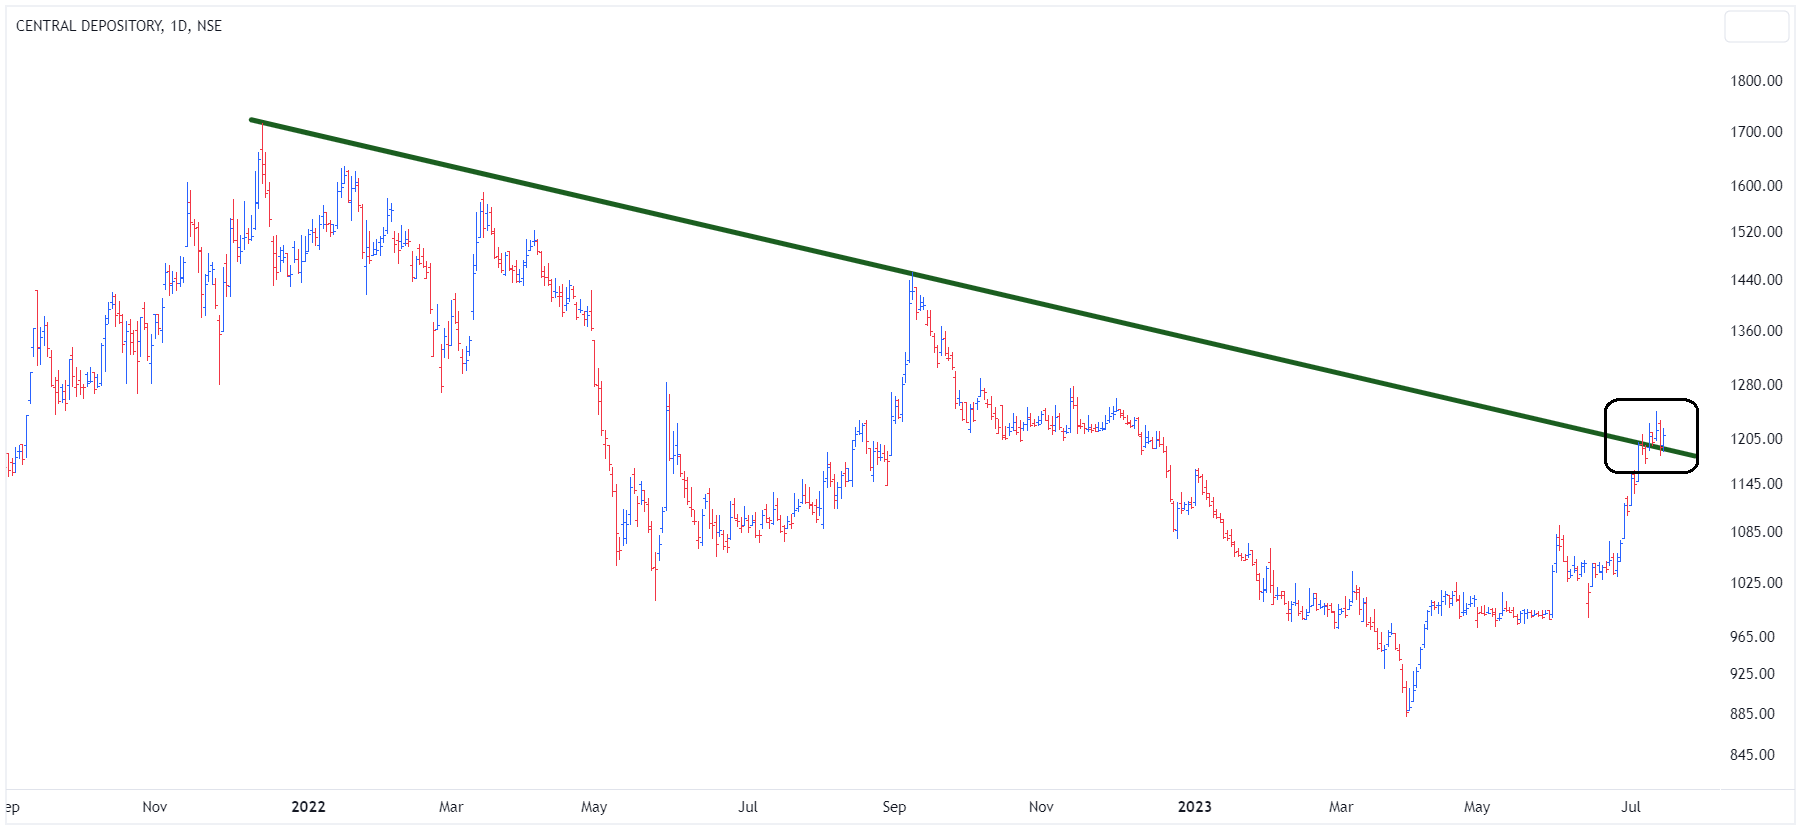
The price action has successfully breached the falling trendline that had been exerting downward pressure on the stock.
Moreover, after the breakout, the price has retraced and retested the trendline, suggesting a possible continuation of the bullish momentum.The breakout of a falling trendline is often regarded as a bullish signal in technical analysis. It suggests that the stock's downtrend may be losing strength and that a reversal or a period of consolidation could be imminent.
A crucial aspect of breakout confirmation is the retesting of the broken trendline. After the initial breakout, it is common for the price to retrace and revisit the trendline to validate the strength of the breakout. In this case, the stock price has successfully retested the trendline, confirming its newfound support level. This retest reinforces the notion that the breakout is not a false signal but rather a genuine shift in market dynamics.
-
Infosys, a market leader, has lagged in the recent rally of Nifty and Sensex.
Once an esteemed blue-chip of the stock market has lost its allure for investors, but the technical chart structure indicates...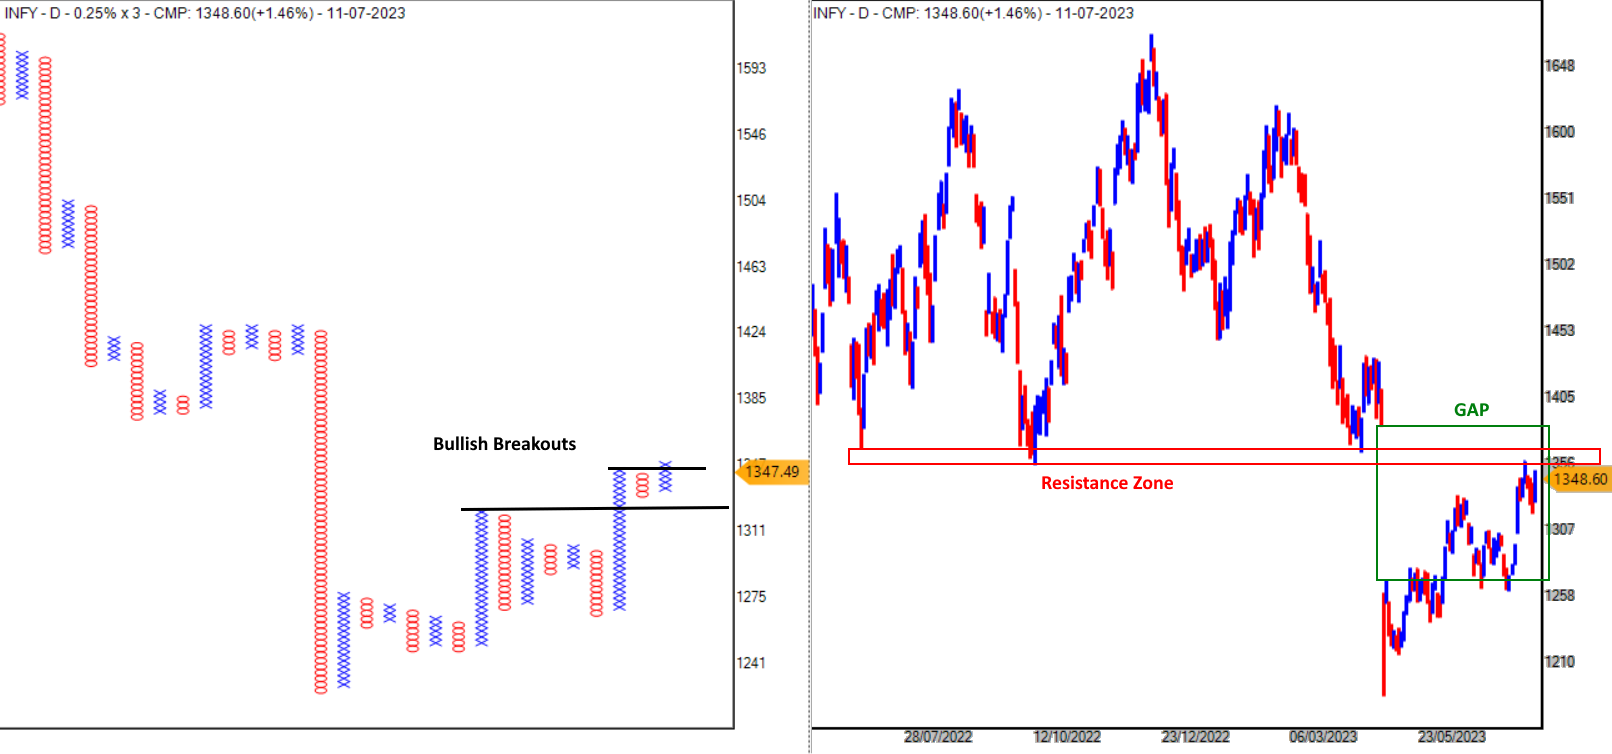
Bullish Breakout Patterns on P&F Chart:
The P&F 0.25% X 3 chart for Infosys reveals the presence of multiple bullish breakout patterns. These patterns indicate a strong upward momentum in the stock price and suggest the potential for further gains. Traders may consider these breakout patterns as positive signals, indicating a bullish trend in the stock.The Bar Chart - Gap and Resistance Zone:
The major hurdle at the gap area of Rs.1,365 and the resistance zone at Rs.1,400 levels may act as significant barriers to the stock's upward movement.
If the stock manages to overcome this hurdle successfully, it could signify a robust breakout and reinforce the bullish sentiment surrounding Infosys.
A weekly close above Rs.1,412 holds considerable significance for the stock confirming a potential bottom formation and suggesting an upward reversal.Can Infosys be the Next Reliance for Nifty50's rally towards 20,000?
-
Jindal Steel & Power Ltd (Jindalstel) has shown a significant breakthrough on the Point & Figure (P&F) 0.25% X 3 chart, surpassing a resistance zone.
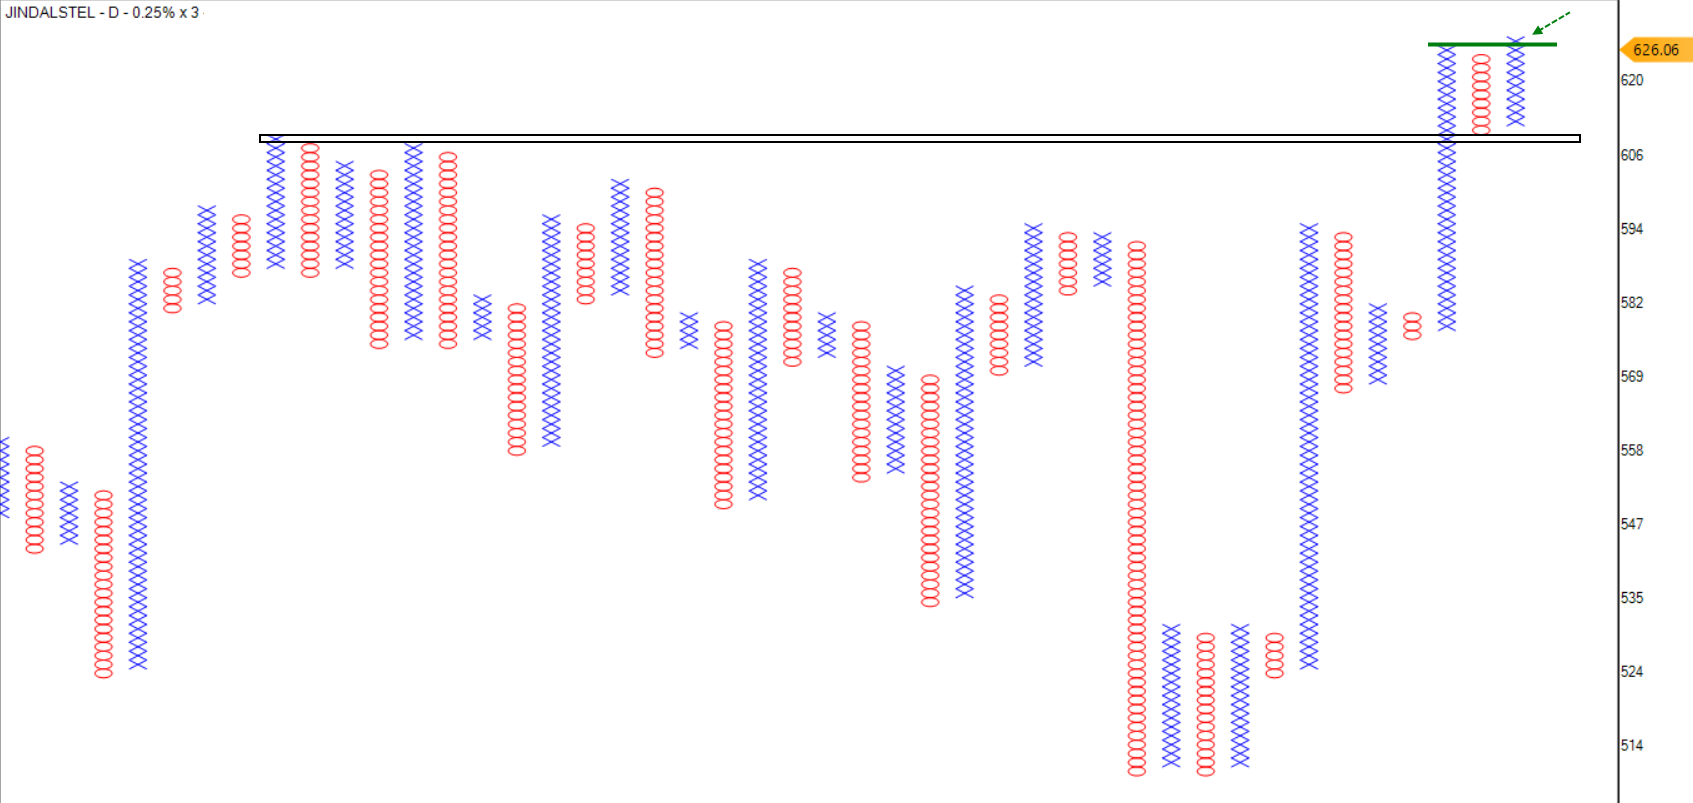
The breakthrough indicates a potential shift in market sentiment.
The resistance level, previously observed at Rs.600, has now turned into a support level for the stock. This shift suggests that buyers are gaining control, and the stock's upward momentum is likely to continue.
The follow-up breakout from the Double Top Breakout (DTB) pattern further reinforces the bullish outlook.
Traders may view this as a potentially positive trend but it comes with the risk. The pattern negates below Rs.600.
-
Reliance Industries has successfully broken out of the channel pattern on the chart. The breakout occurring after the 62-week channel marks a significant development, as it aligns with the Fibonacci time cycle, carrying strong implications for future price movements.
Explaining Fibonacci Time Cycle Theory:
Fibonacci Time Cycle Theory is a technical analysis tool based on the Fibonacci sequence, which suggests that certain time intervals in the market tend to exhibit recurring patterns. According to this theory, the duration between significant price swings or market cycles can often be predicted using the Fibonacci ratios.
The Fibonacci sequence is a series of numbers in which each number is the sum of the two preceding ones: 0, 1, 1, 2, 3, 5, 8, 13, 21, and so on. These numbers have unique mathematical properties and are found throughout nature and financial markets.
In Fibonacci Time Cycle Theory, I apply the Fibonacci ratios (such as 38.20%, 50%, 61.8%, 78.60%, 127% and 161.8&) to measure the duration of market cycles or significant price movements.
I believe that these ratios can help identify potential turning points or periods of increased volatility in the market.
Fibonacci Time Cycle Theory if applied in combination with other technical patterns, the success rate of the setup multiplies.
However, it's important to note that like any technical analysis tool, Fibonacci Time Cycle Theory is not foolproof and should be used in conjunction with other forms of analysis and risk management strategies.
-
Reliance Industries, a giant in the Indian market, has been instrumental in supporting the recent rally in the Nifty index.
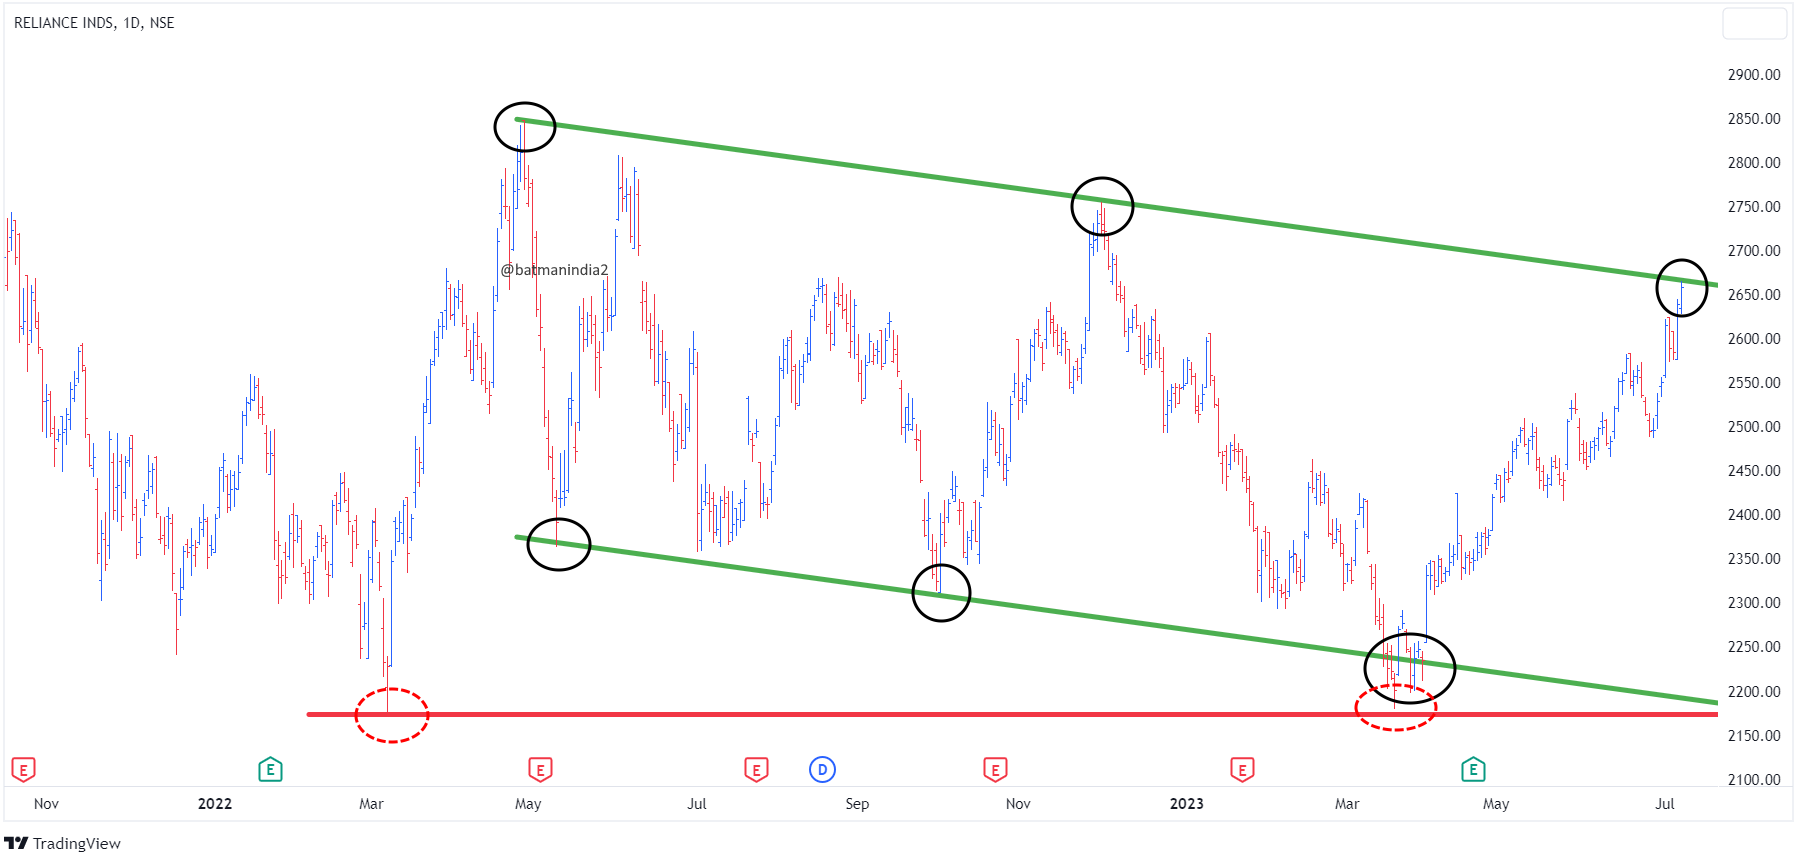
The stock price is currently poised to break out of a 62-week channel, indicating a potential shift in its stock price trajectory. According to the Fibonacci time cycle theory, the 62-week mark is considered a crucial breakout point.
If the stock price successfully closes above the 2,700 level, it is expected to further enhance the bullish sentiment in the market. This impending breakout has garnered significant attention, as it aligns with the key time cycle identified by the Fibonacci theory.
The breakout has the potential to fuel the Nifty rally, propelling it towards the 20,000 mark.
What are you buying in this rally?
-
Rallis India, the stock price witnessed a remarkable reversal, surging from a support level of Rs. 180 to Rs. 210.
There are multiple bullish patterns visible on the chart:
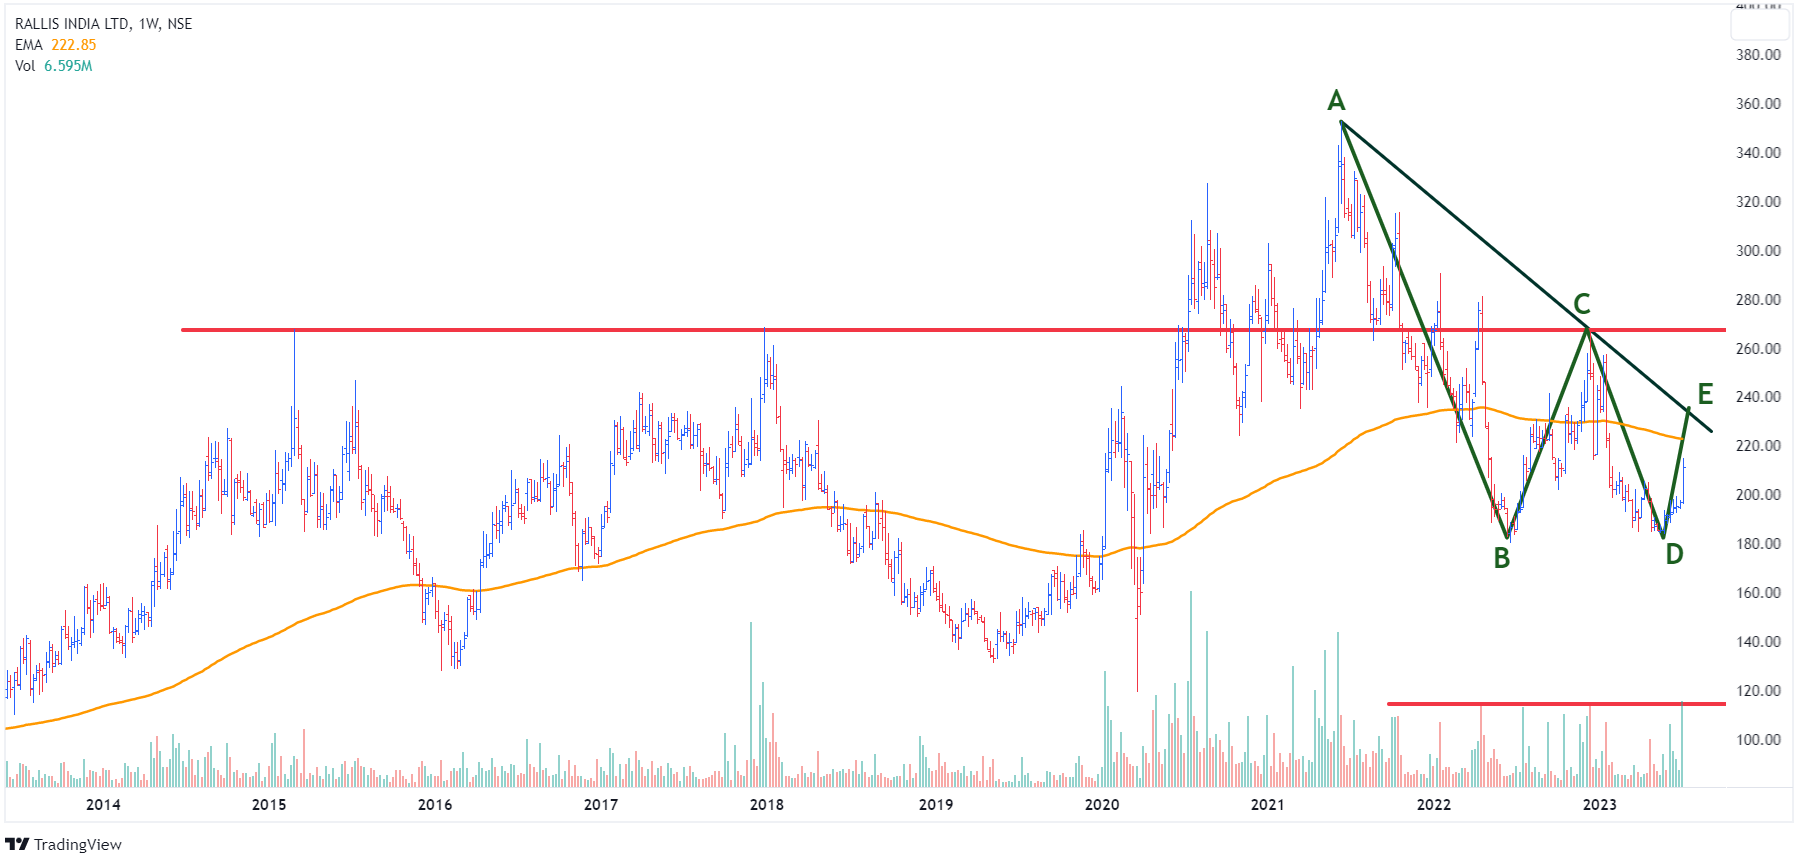
**1. Bullish Dragon Harmonic Pattern: **
The Bullish Dragon harmonic pattern is a significant technical formation that suggests a potential reversal from a bearish to a bullish trend. This pattern consists of a tail, head, and legs. In this case, the tail is placed at Rs. 235, indicating a potential resistance level.A breakout from the harmonic patterns at the tail opens the door for further upward movement for probable levels of Rs. 330.
2. Double Bottom:
A minor hurdle is observed on the chart at Rs. 270, which, when surpassed, would result in the confirmation of a double bottom pattern. The breakout from the neckline will confirm the bottom and strengthen the bullish case for the stock.The presence of a common double-bottom pattern is likely to attract more buyers as this is a well-known and widely recognized bullish reversal formation that can generate increased buying interest from traders and investors.
The influx of buyers could further propel the stock price towards the target of Rs. 330.
At the current price of Rs. 210, it is advisable to exercise patience and wait for a breakout, as it may lead to an effective trade setup. The current volumes are not substantial enough to convince long-term investors at the current levels.
-
Investing in equity markets can be a rewarding endeavour, but it's essential to navigate with caution. Timing the market and identifying the peak, commonly referred to as "calling the top," is an elusive feat for even the most seasoned investors.
While there is no foolproof method to predict market tops consistently, understanding key parameters can provide valuable insights. In this blog, we will explore some essential parameters to consider when attempting to call the top in equity markets.
1. Market Valuation:
One of the critical parameters to monitor is market valuation. Generally, when valuations are high, it indicates that the market might be approaching its peak.Metrics like the price-to-earnings (P/E) ratio, price-to-sales (P/S) ratio, or cyclically adjusted price-to-earnings (CAPE) ratio can offer insights into whether stocks are overvalued. Comparing these ratios to historical averages can help identify potential market tops.
2. Investor Sentiment:
Investor sentiment plays a crucial role in market movements. When investors become overly optimistic, it can be a warning sign of a market top. Indicators like the CBOE Volatility Index (VIX), the put/call ratio, or surveys measuring investor sentiment can help gauge the prevailing market sentiment.Excessive bullishness and complacency may suggest that the market is nearing a top, while extreme fear may indicate an oversold market ripe for a rebound.
3. Technical Analysis:
Technical analysis involves studying price patterns, chart patterns, and various indicators to predict market trends. While not foolproof, technical analysis can provide insights into potential turning points.Key indicators like moving averages, trendlines, relative strength index (RSI), or MACD (moving average convergence divergence) can help identify overbought conditions or bearish divergences, potentially signaling an approaching market top.
4. Economic Indicators:
Monitoring economic indicators can provide valuable clues about the overall health of the economy and its impact on equity markets. Indicators such as GDP growth, employment data, inflation rates, interest rates, and consumer confidence can influence market sentiment and performance.Economic indicators that suggest a slowdown or potential recession may indicate a market top.
5. Corporate Earnings:
Corporate earnings are the backbone of stock valuations. Strong and consistent earnings growth typically drives market rallies. However, when earnings growth starts to slow or miss expectations, it can be an early warning sign of a market top.Paying close attention to company earnings reports, revenue growth, and forward guidance can help identify potential turning points in the equity markets.
6. Geopolitical and Macro Factors:
Geopolitical events and macroeconomic factors can significantly impact equity markets. Events such as trade tensions, political instability, currency fluctuations, or global economic slowdowns can create headwinds for equity markets.Staying informed about geopolitical developments and macroeconomic trends can provide valuable context when assessing the potential for a market top.
Calling the top in equity markets is a challenging task, as it requires a deep understanding of multiple parameters and a comprehensive analysis of various indicators.
While no method can consistently predict market tops, being aware of key parameters can help investors make more informed decisions. By combining fundamental analysis, technical analysis, and a holistic view of the broader economic and geopolitical landscape, investors can enhance their ability to identify potential market tops and adjust their investment strategies accordingly.
Remember, patience and a long-term perspective are vital for successful investing, regardless of market conditions.**Considering the parameters discussed above, "Is this a time to Call-A-Top in the Nifty?"
Mention Yes or No in the comment below. -
After years of range-bound trading, the index has made a remarkable move, signalling a potential shift in the market landscape. This breakout opens up new possibilities and sets the stage for a period of significant growth and opportunity.
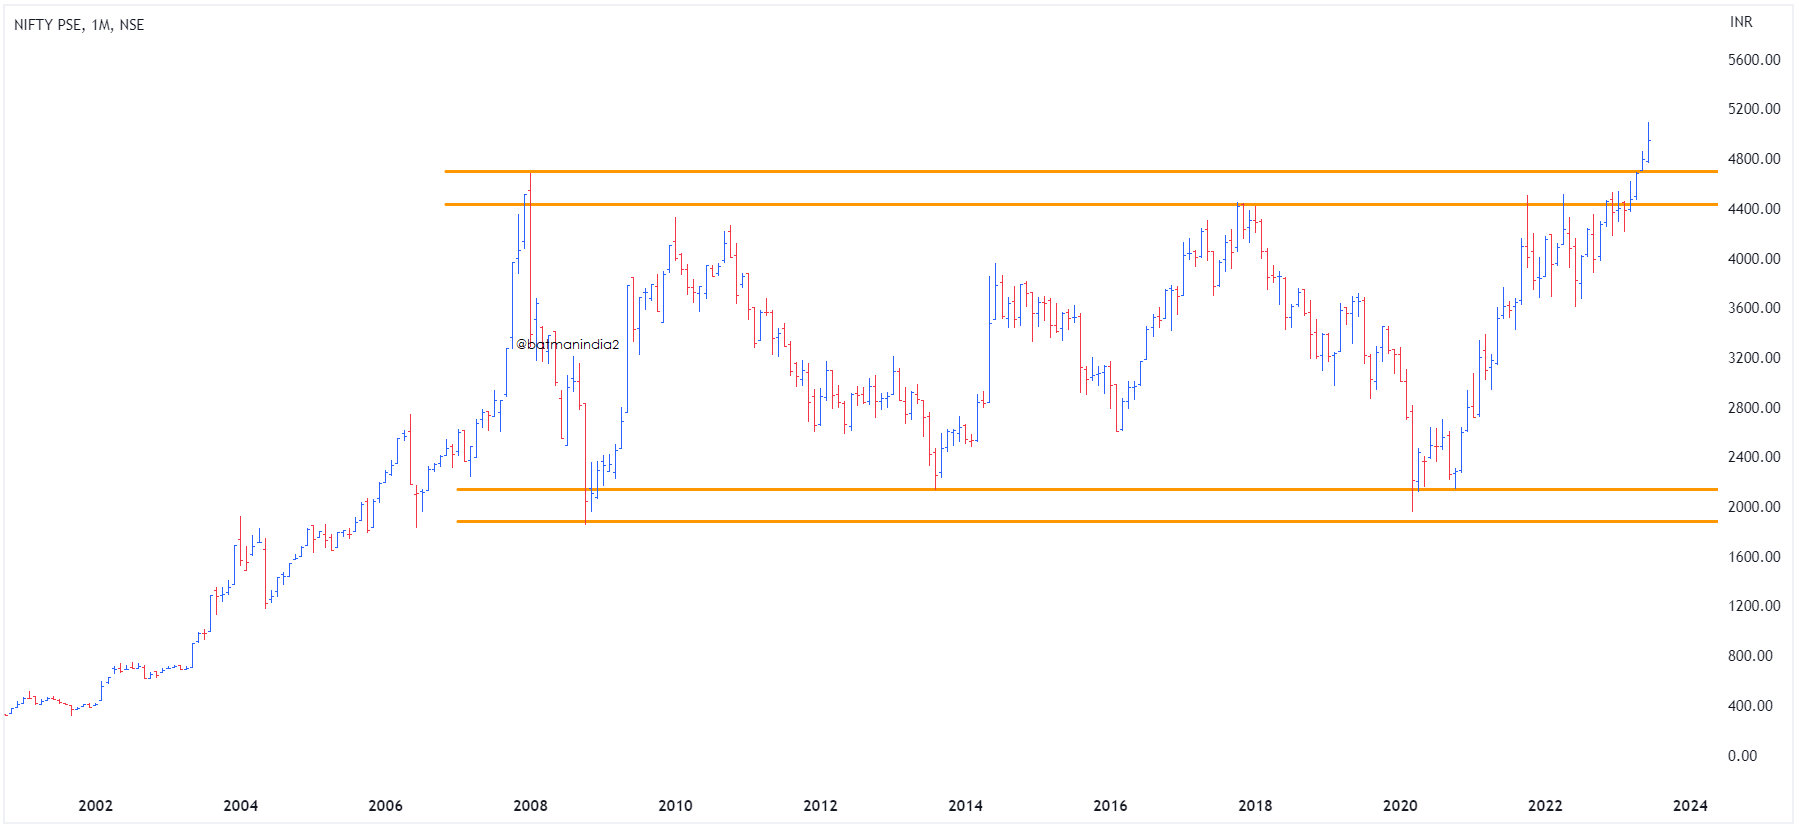
With this breakout, market participants may eye the 6800-8000 levels in the next three years. This projection indicates the potential upside that can be expected in the coming period. It presents an exciting prospect for investors looking to capitalize on emerging trends and capitalize on the upswing.
This breakthrough is not just a random occurrence but is backed by strong market dynamics and fundamental factors.
Opportunities like these come with their fair share of risks and rewards, and a well-informed investment strategy is essential. Conduct thorough research, consult with financial advisors, and evaluate your risk appetite before making any investment decisions.
-
I have highlighted "a breakdown means a shift from Smallcap to Midcap investments."
-
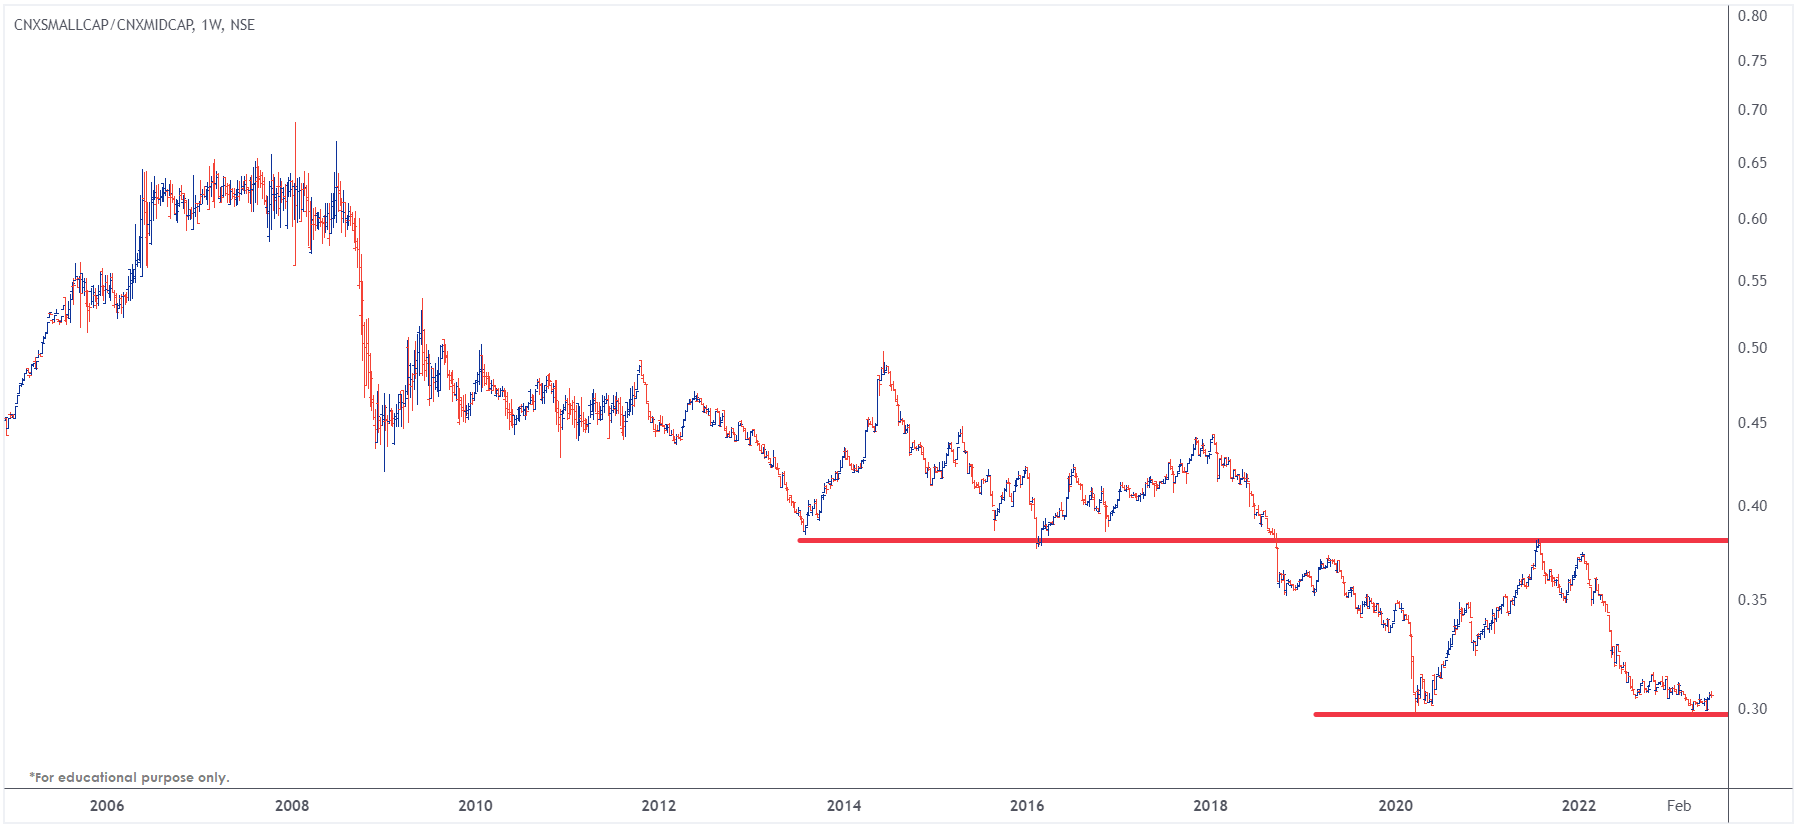
The Nifty SmallCap/Nifty Midcap Ratio Chart is currently trending at the support level of an all-time low. This may indicate a potential opportunity to consider shifting investments from small-cap stocks to mid-cap stocks.
The Nifty SmallCap/Nifty Midcap Ratio Chart tracks the relative performance of small-cap stocks compared to mid-cap stocks. When the ratio is at an all-time low and reaches a support level, it suggests that small-cap stocks may be underperforming compared to their mid-cap counterparts.
The breakdown on the above chart means shifting from small-cap to mid-cap stocks at this juncture could potentially offer advantages to traders and investors.
While stock-specific actions may occur, it is important to note that the overall trend of the ratio chart is often influenced by the direction of the index.
Mid-cap stocks often exhibit a balance between growth potential and stability. Investing in mid-cap companies can provide diversified exposure to sectors and industries while aiming for potential capital appreciation.
Small-cap stocks, on the other hand, may face higher volatility and liquidity risks. Shifting to mid-cap stocks could help mitigate these risks while still offering opportunities for growth.
Stay informed, stay cautious, and make investment decisions that align with your financial goals and risk tolerance.
#RatioChart #MarketAnalysis #SmallCap #MidCap
-
When it comes to investing in stocks, understanding the associated risks is crucial for making informed decisions. Stocks are often categorized based on their market capitalization, which refers to the total value of a company's outstanding shares. In this article, we will explore the risks involved in buying large-cap, mid-cap, and small-cap stocks, helping you navigate the complexities of the market.
Large-Cap Stocks:
Large-cap stocks represent well-established companies with substantial market value. These companies are typically recognized industry leaders and have a proven track record of stability. However, there are still risks associated with investing in large-cap stocks:a) Slower Growth Potential:
Due to their size, large-cap companies may find it challenging to sustain rapid growth rates seen by smaller counterparts. Consequently, the potential for significant capital appreciation may be limited compared to mid-cap and small-cap stocks.b) Economic Downturn Impact:
Large-cap stocks are often more susceptible to macroeconomic factors such as recessions or global financial crises. Their size and market presence may not shield them entirely from adverse economic conditions, leading to potential declines in stock prices.c) Limited Agility:
Large-cap companies may face difficulties adapting to changing market conditions due to their size and bureaucracy. This lack of agility can hinder their ability to innovate and compete effectively.d) Lower Volatility, Lower Returns:
Large-cap stocks tend to exhibit lower volatility compared to mid-cap and small-cap stocks. While this may provide some stability, it can also result in potentially lower returns for investors seeking higher growth opportunities.Mid-Cap Stocks:
Mid-cap stocks represent companies with a market capitalization between that of large-cap and small-cap stocks. These stocks can offer a unique balance of growth potential and stability, but they also come with their own set of risks:a) Market Volatility:
Mid-cap stocks can experience more significant price fluctuations compared to large-cap stocks due to their smaller market presence. This volatility can lead to higher risks, but it also presents opportunities for investors who can tolerate short-term market fluctuations.b) Liquidity Concerns:
Mid-cap stocks may have lower trading volumes compared to large-cap stocks, which can result in reduced liquidity. Investors looking to buy or sell significant quantities of mid-cap stocks may face challenges executing their trades at desired prices.c) Competitive Landscape:
Mid-cap companies often operate in fiercely competitive industries. These companies may face challenges in sustaining market share and profitability, particularly when competing against larger, more established players.Small-Cap Stocks:
Small-cap stocks represent companies with relatively small market capitalization. While they offer the potential for significant growth, investing in small-cap stocks carries higher risks:a) Higher Volatility:
Small-cap stocks are generally more volatile than large-cap and mid-cap stocks. Their limited resources and market presence can make them more susceptible to market swings, economic changes, or company-specific events.b) Limited Financial Resources:
Small-cap companies often have limited financial resources compared to larger counterparts. This could affect their ability to weather financial downturns, invest in research and development, or navigate industry disruptions.c) Lack of Information:
Small-cap companies may not receive the same level of analyst coverage as larger companies. As a result, investors may have limited access to comprehensive research and analysis, making it challenging to assess the company's prospects accurately.Final Thoughts:
Investing in stocks entails varying degrees of risk, and understanding these risks is crucial for investors.Large-cap, mid-cap, and small-cap stocks each present their own unique set of advantages and challenges.
While large-cap stocks offer stability, mid-cap stocks strike a balance between growth potential and stability, and small-cap stocks can provide substantial returns, they also come with higher volatility and associated risks.
As an investor, it is essential to consider your investment goals, risk tolerance, and conduct thorough research before investing in any category of stocks.
Diversifying your portfolio across different market capitalizations can help manage risk and enhance the potential for long-term returns.
This article represents the thoughts and opinions of the author and should not be construed as investment advice or a recommendation for making specific investment decisions.
Nifty IT - On Verge of Breakout
The Strategy's Unbelievable Stats Revealed - Video Coming Soon...
The Strategy's Unbelievable Stats Revealed - Video Coming Soon...
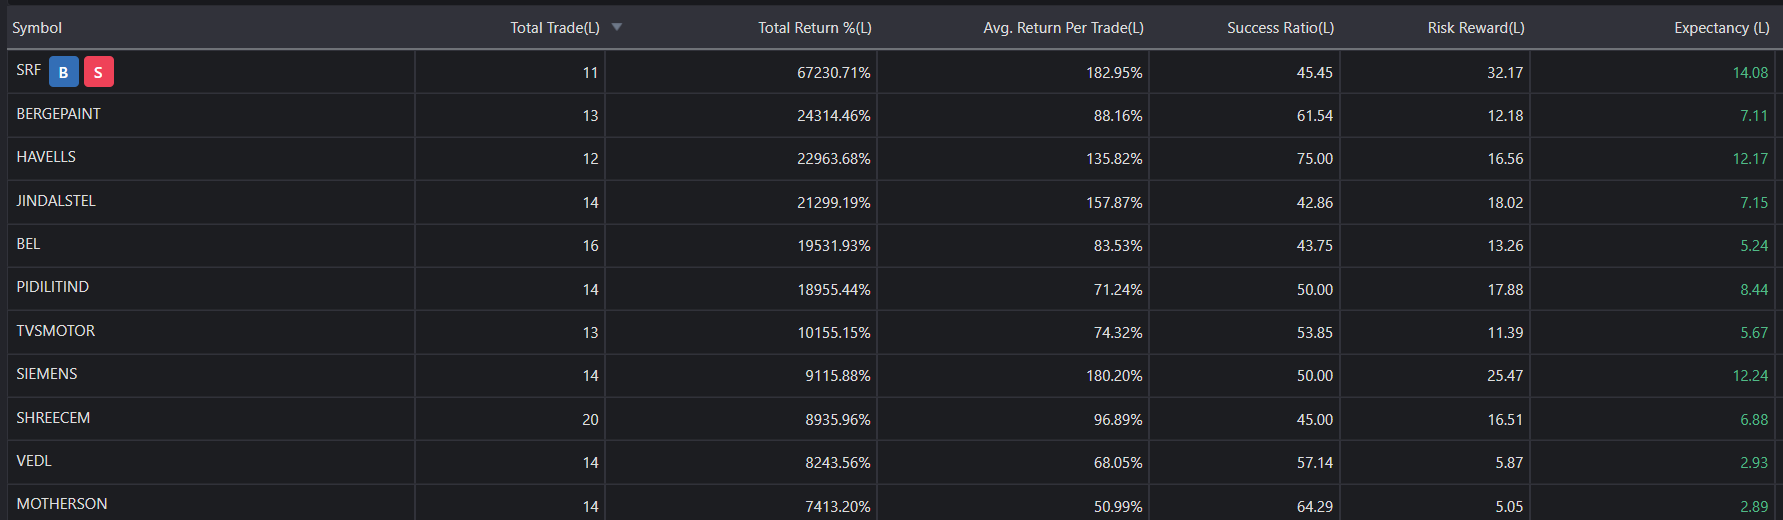
SBIN - Bullish Flag {Breakout Abv 636}
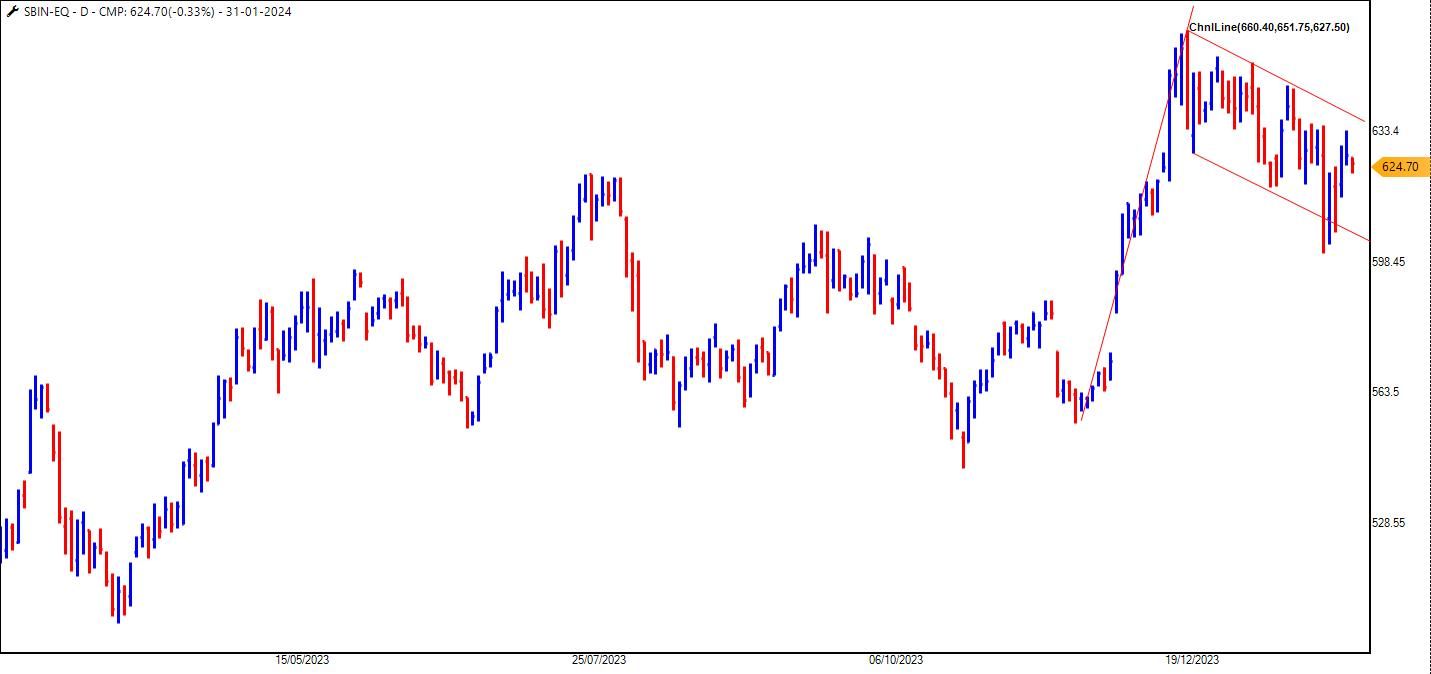
Equal Weighted Index {Video}
HDFC Bank
HDFC Bank
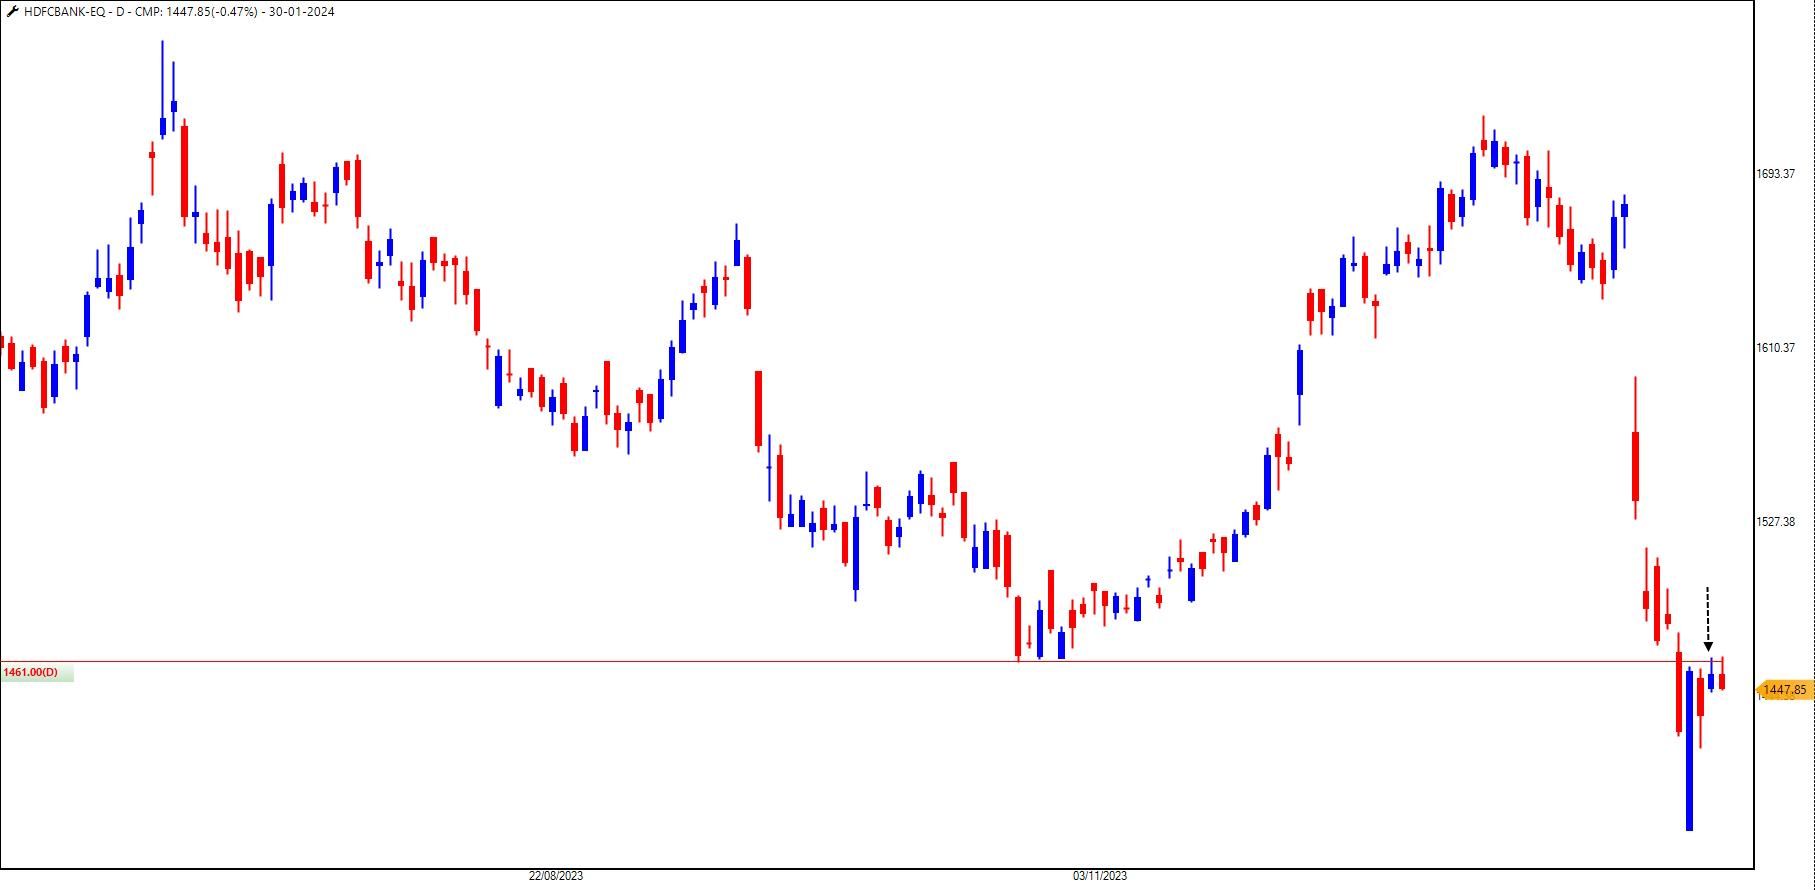
Beyond Labels - The Art of Technical Analysis
Beyond Labels - The Art of Technical Analysis
DMart - Bullish Harmonic
Laidback Strategy - Stock List
Adani Ports - Multiple Harmonics
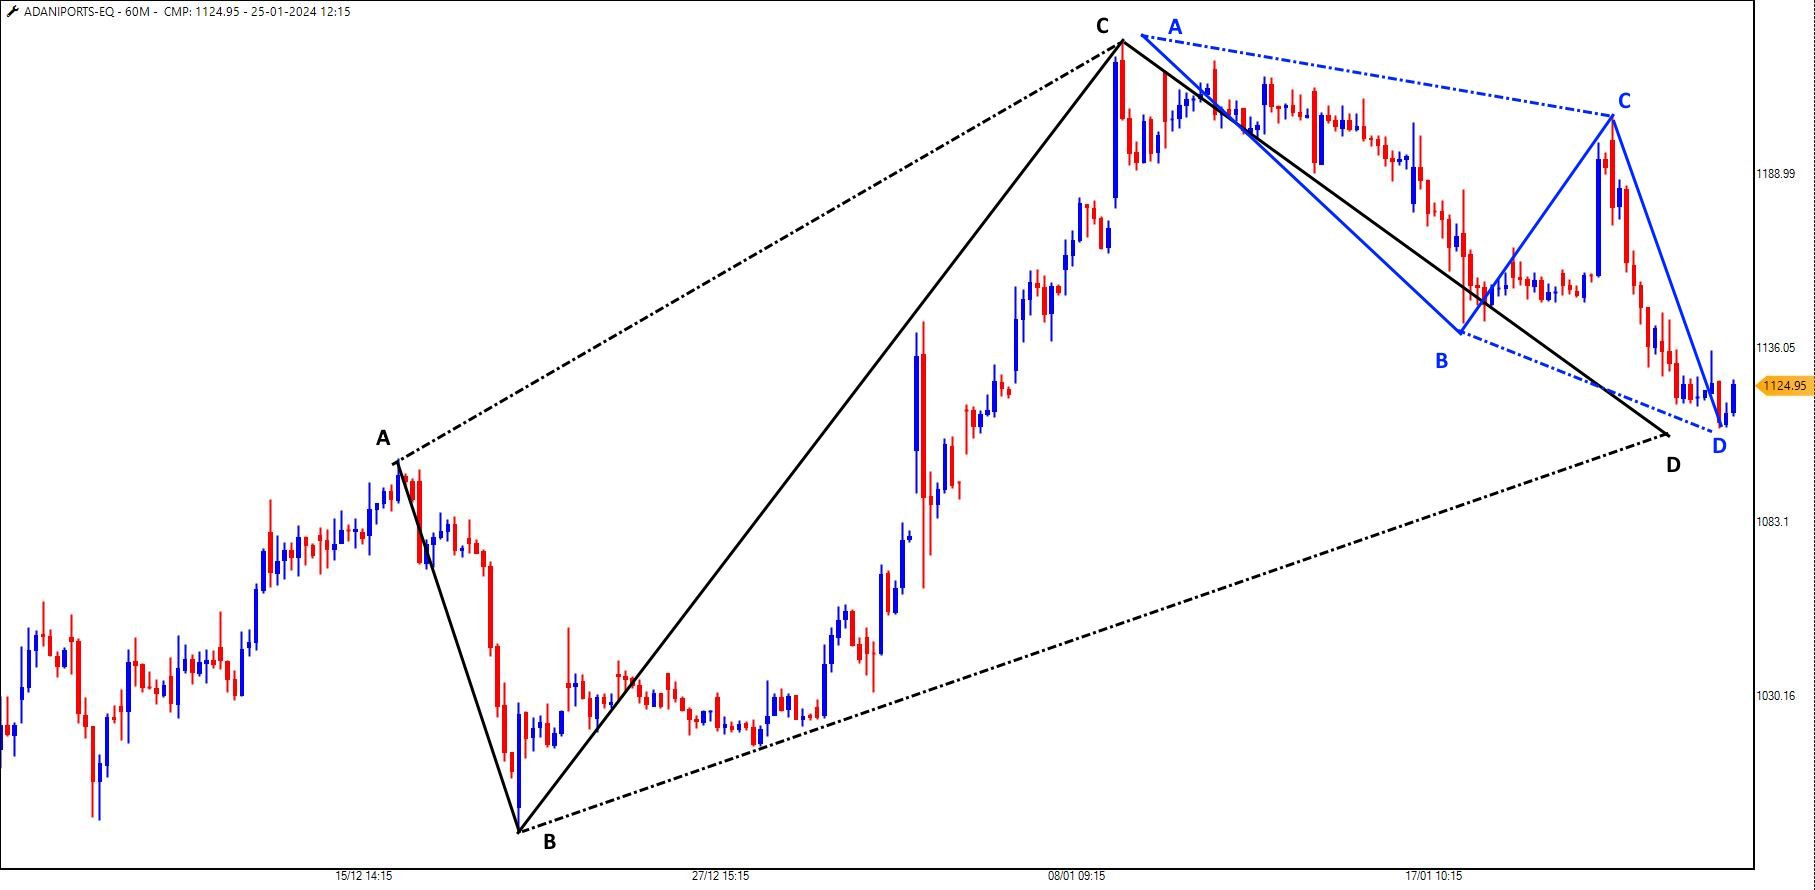
DMart - Bullish Harmonic
Zindagi Na Mile Dobara: Lessons to Learn
DMart - Bullish Harmonic
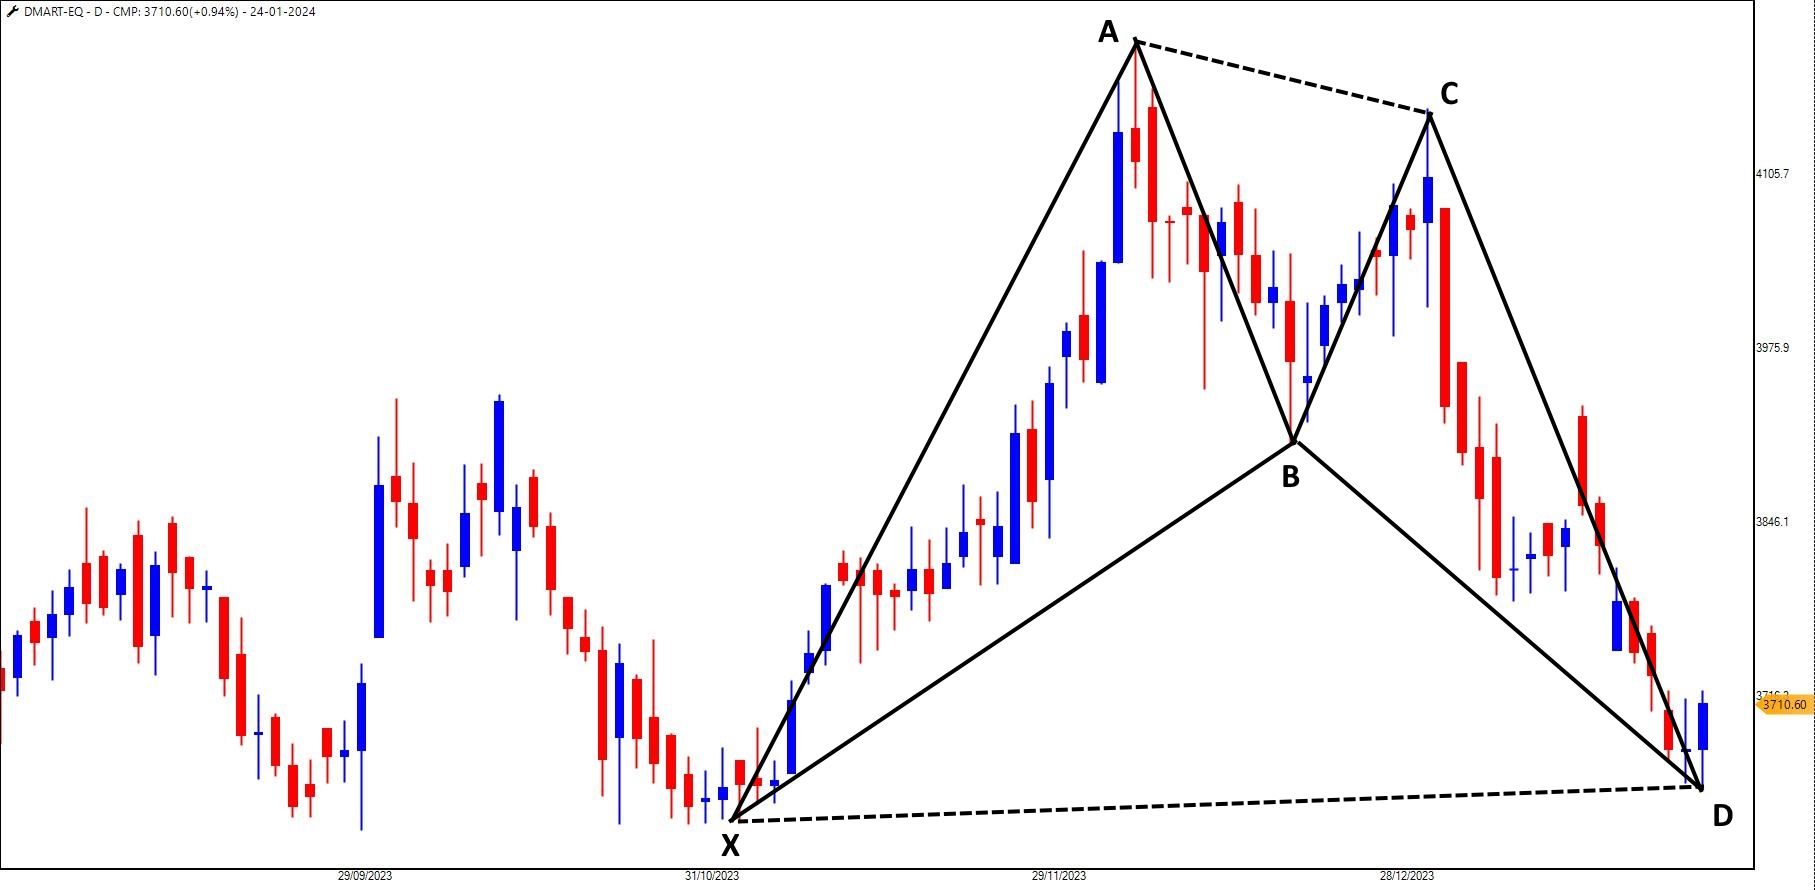
Bank Nifty - Weekly Chart
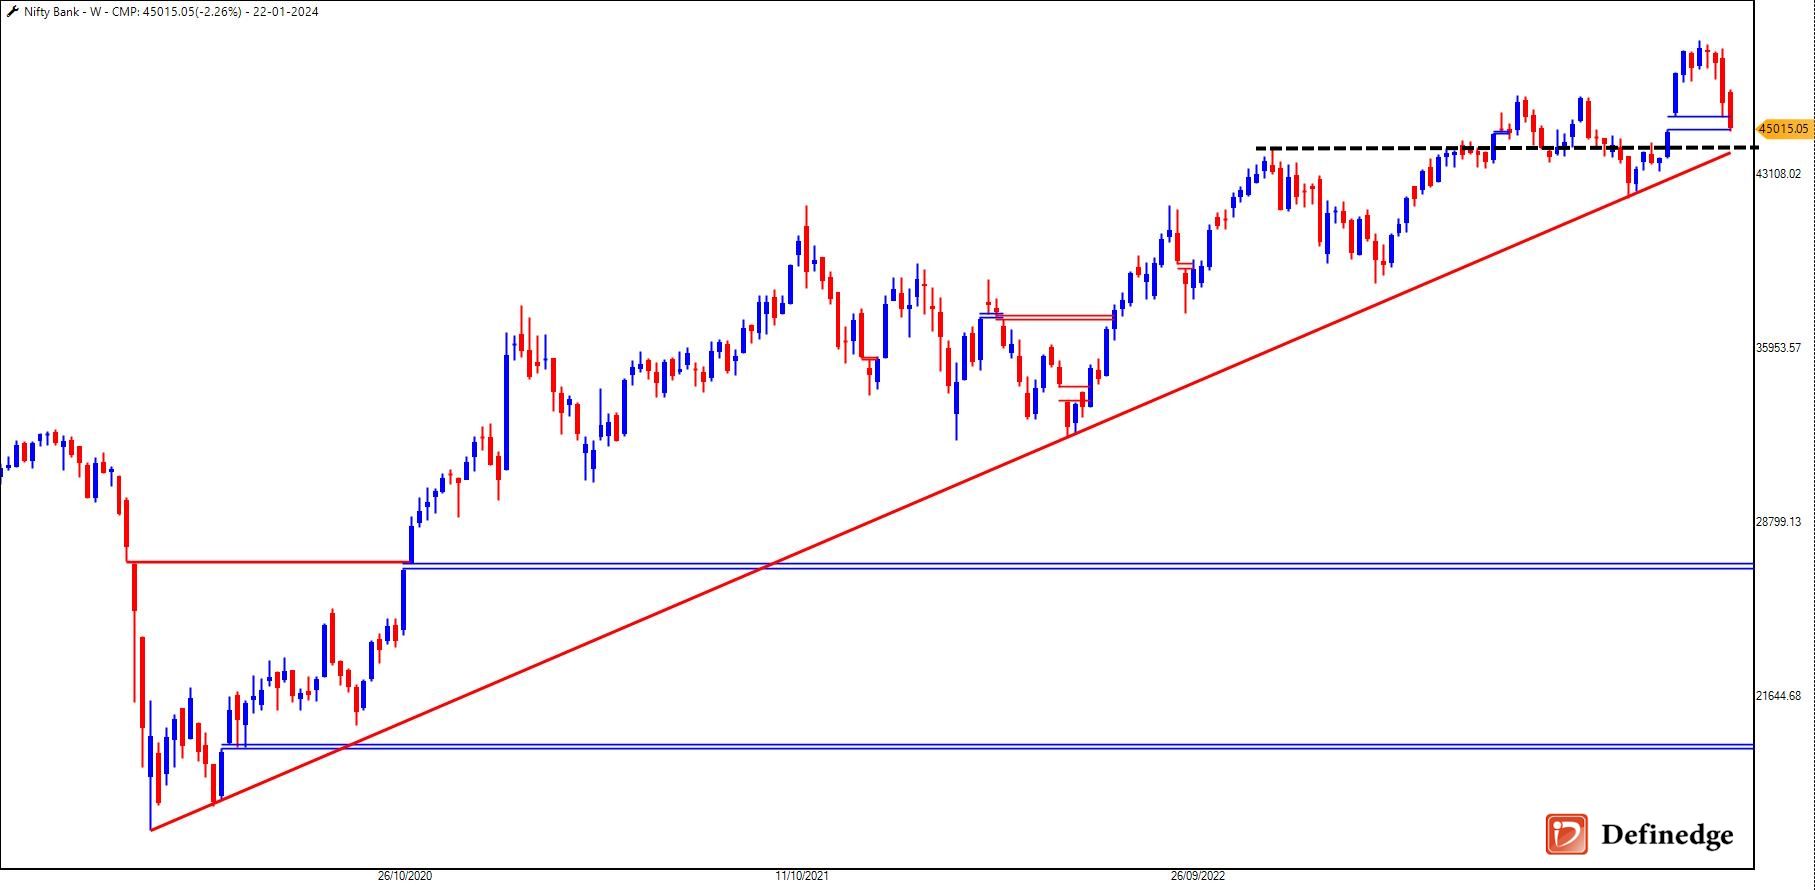
Bank Nifty - Bearish Flag
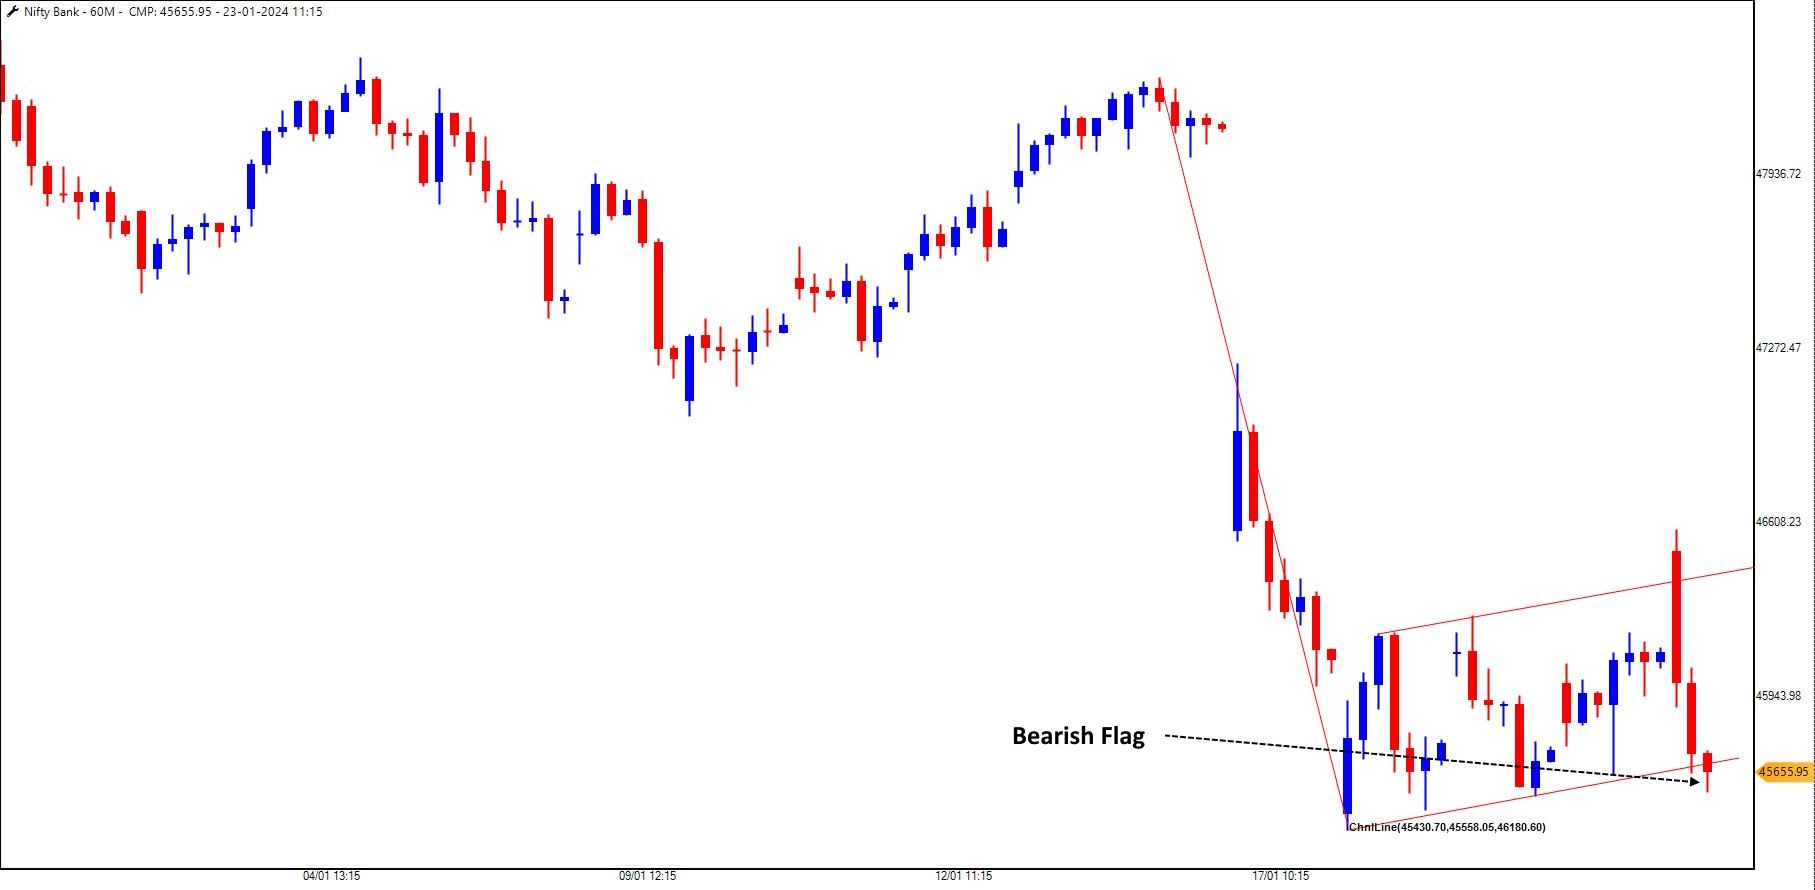
Zindagi Na Mile Dobara: Lessons to Learn
Laidback Strategy - Stock List
RSI - As Market Breadth Indicator {Video}
Bank Nifty - Can it be a Green Day?
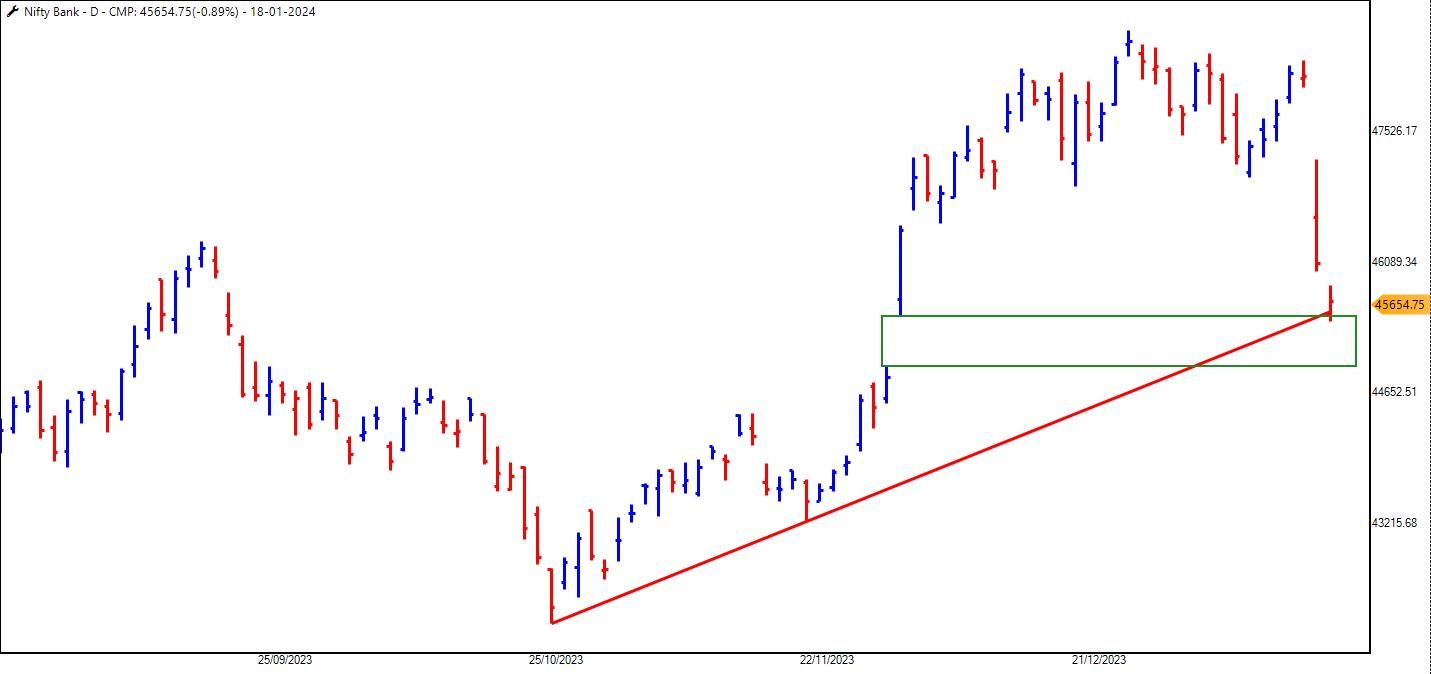
Nifty Stocks – Numbers Don’t Lie!
Time to Sell or Hold Your Horses?
Time to Sell or Hold Your Horses?
Bull Sash & Bear Sash - Heard this Candlestick Pattern for first time?
The Loneliness of the Modern Trader
Zone web not working
HDFC Bank - Bull Sash Candlestick Pattern, But...
Zone web not working
How Simple Can You Get with Your Chart Analysis?
Laidback Strategy - Stock List
HCL Tech - Rising Three Candlestick Pattern on Weekly Chart
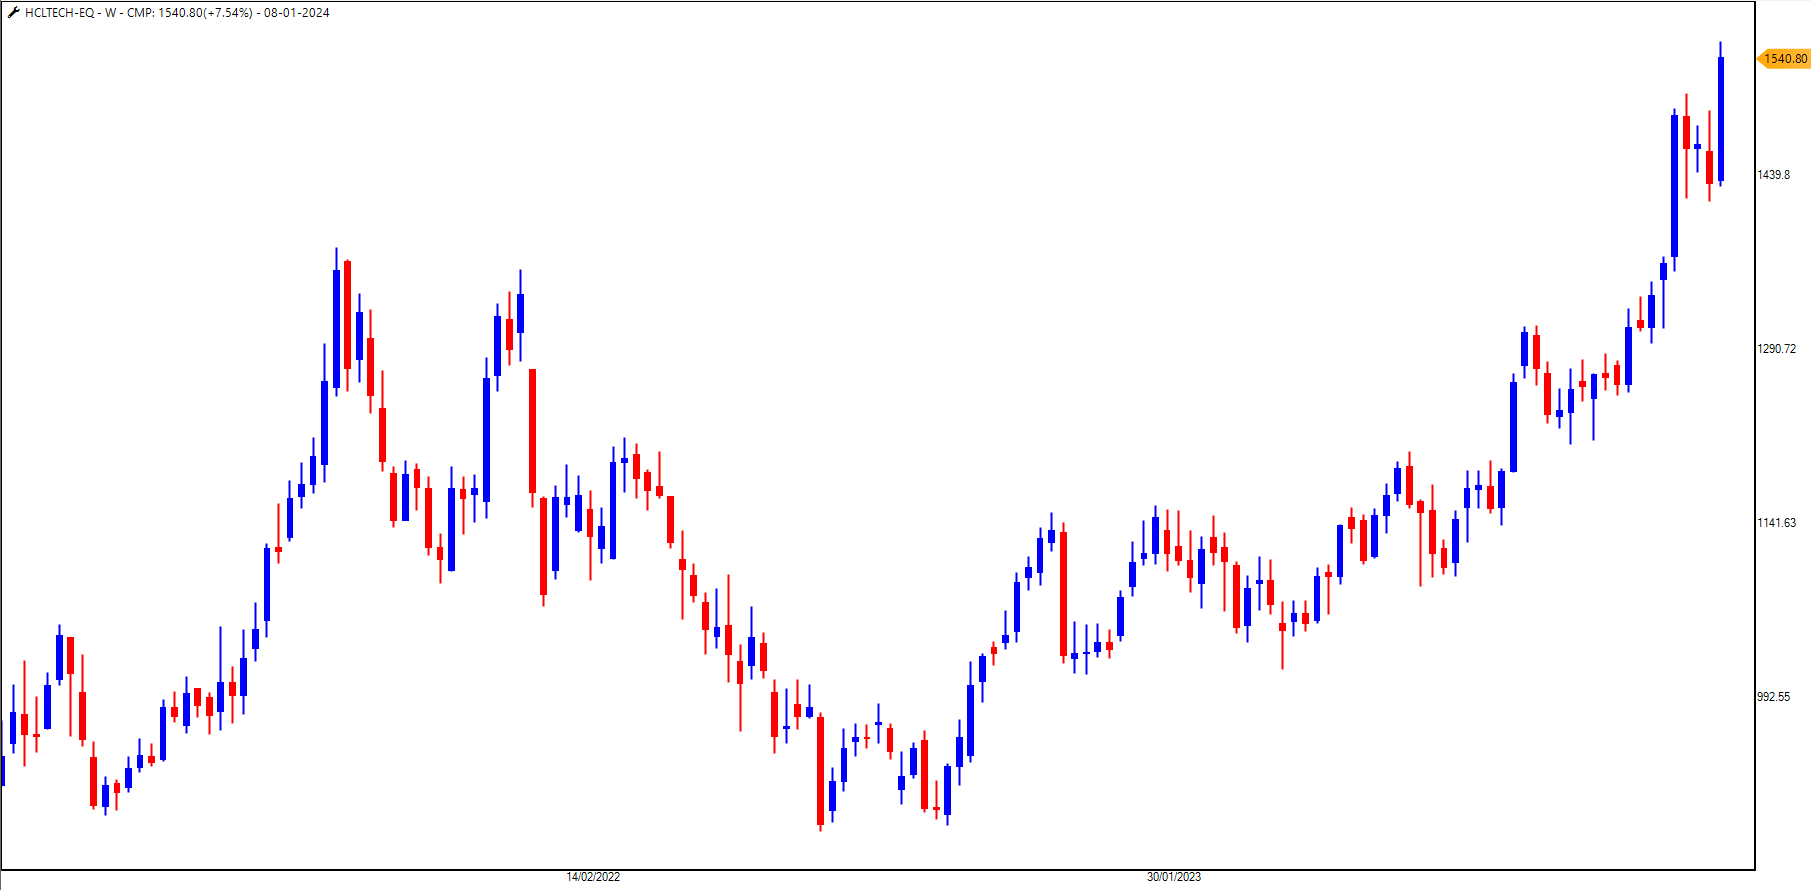
How Simple Can You Get with Your Chart Analysis?
Laidback Strategy - Stock List
Investor Dilemma: Single Stock Leadership vs. Weak Market Breadth
Reliance - Going Stronger {Updated Chart}
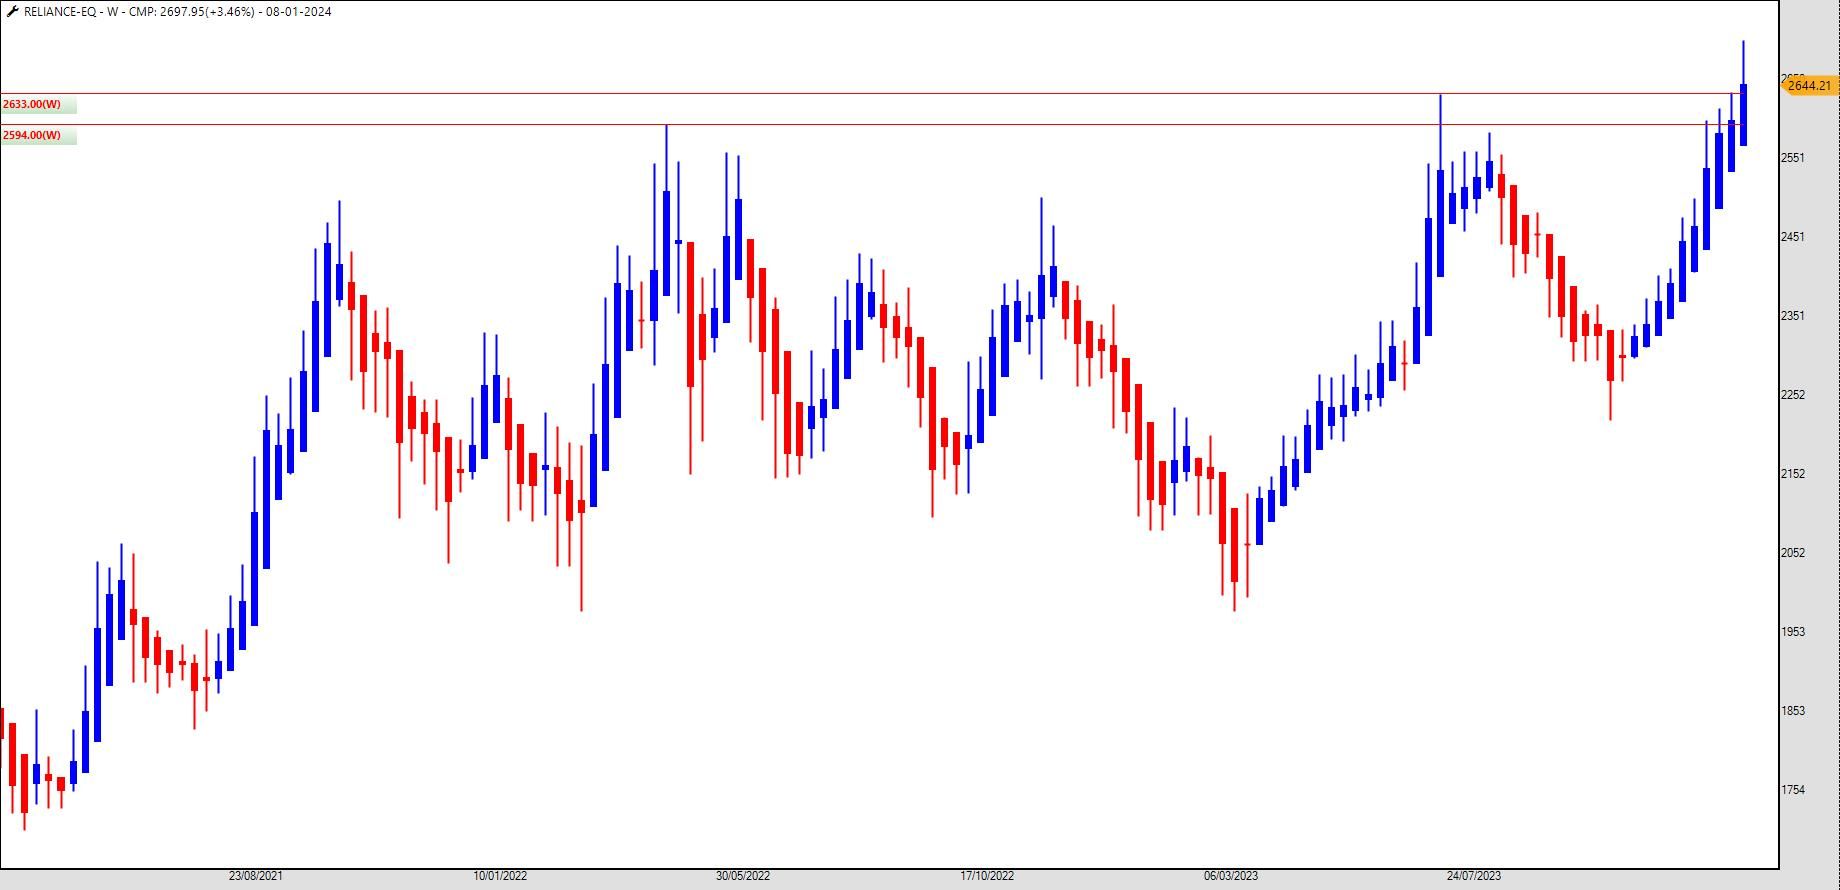
Riding the Rise: Top Stocks Watchlist from Vibrant Gujarat Global Summit 2024
Drowning Optimism for Nifty Bulls
Drowning Optimism for Nifty Bulls
Reliance - Breakout ABOVE 2640
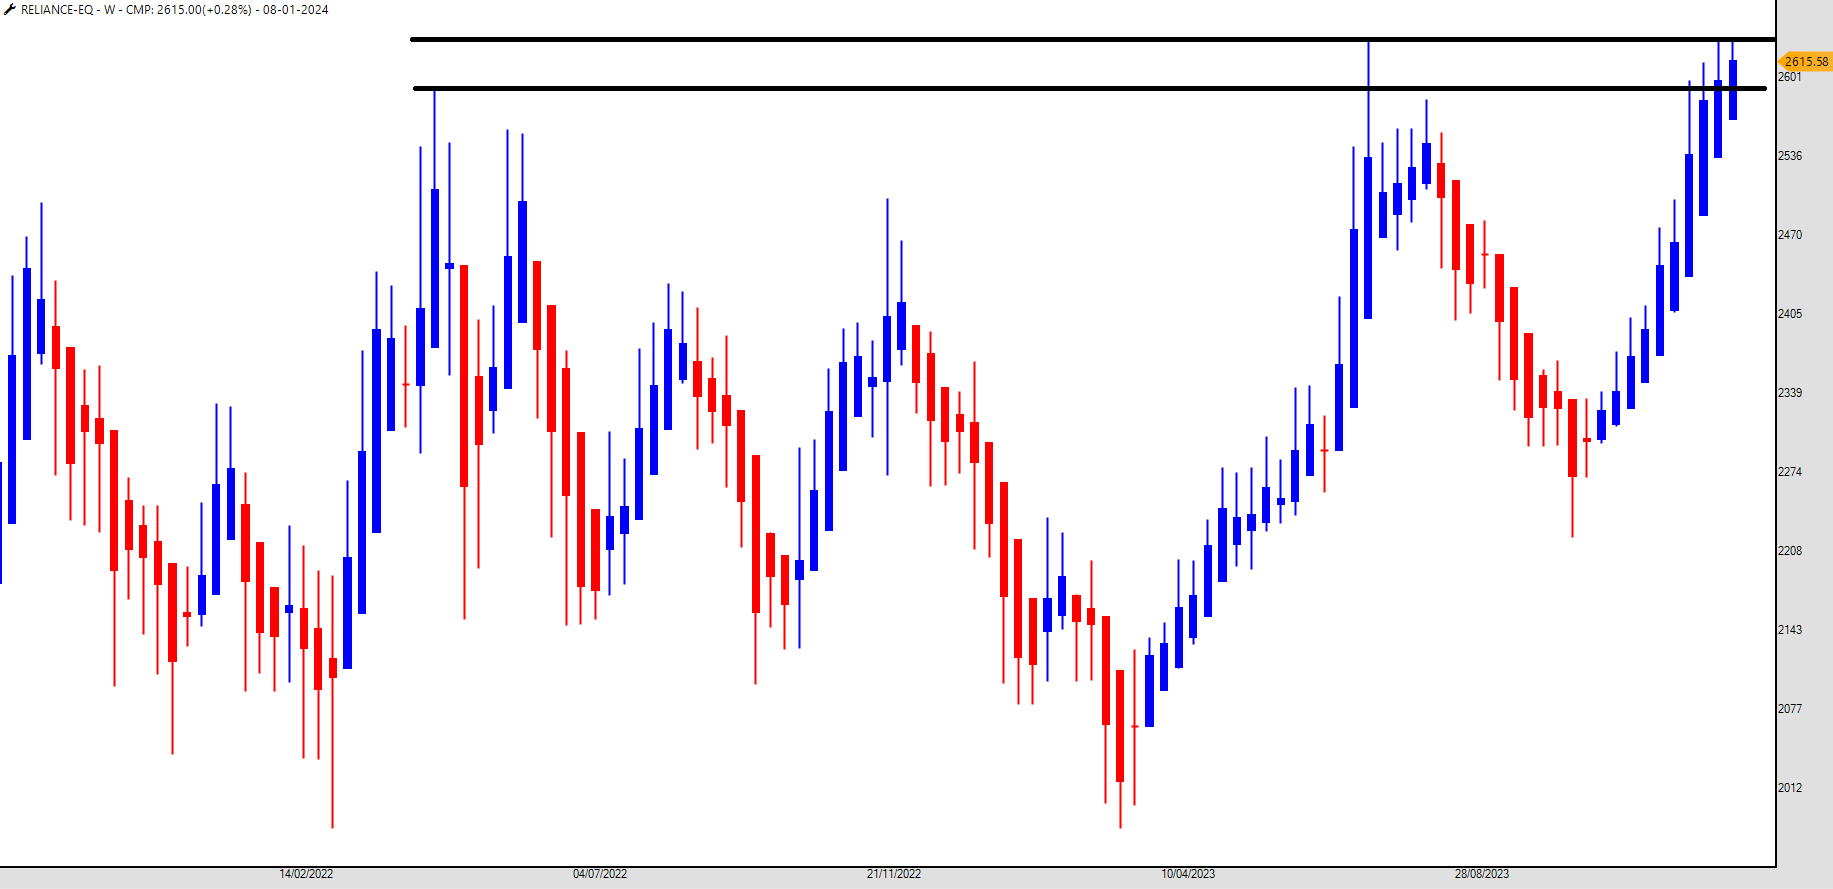
Stocks Rising, Spirits Soaring at Lakshadweep
Laidback Strategy - Stock List
Don't Get Burned!
Laidback Strategy on ETFs | Video |
Investing Simplified using Ratio Charts (Video)
Reliance - Clash of Bulls vs Bears in the Ring
Reliance - Clash of Bulls vs Bears in the Ring
Laidback Strategy - Stock List
Vriddhi Strategy Scanner - Here We Go
ITC - The Vriddhi Strategy Candidate but.....
Vriddhi Strategy Scanner - Here We Go
Ladder Bottom Candlestick Pattern with Scanner
Total Open Interest (ToI)
Ladder Bottom Candlestick Pattern with Scanner
Vriddhi Strategy Scanner - Here We Go
Ladder Bottom Candlestick Pattern with Scanner
Laidback Strategy - Stock List
Isse Jyada Market Kya Jayega? - A Video
Bank Nifty still underperforming Nifty50
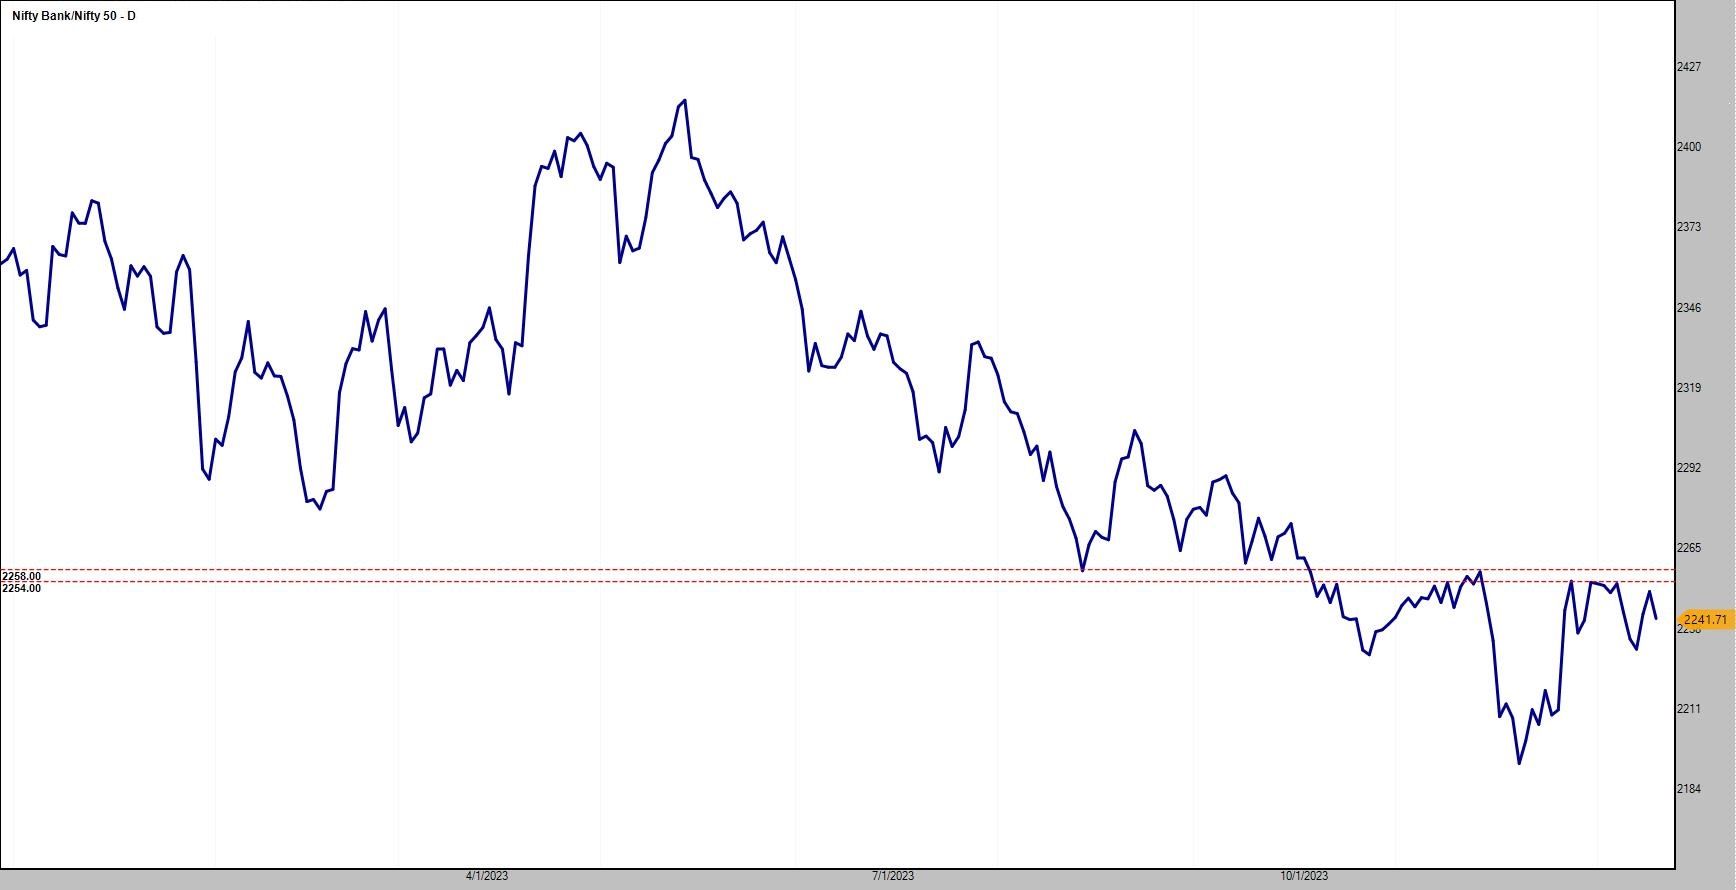
BankNifty - At Cluster of Resistance
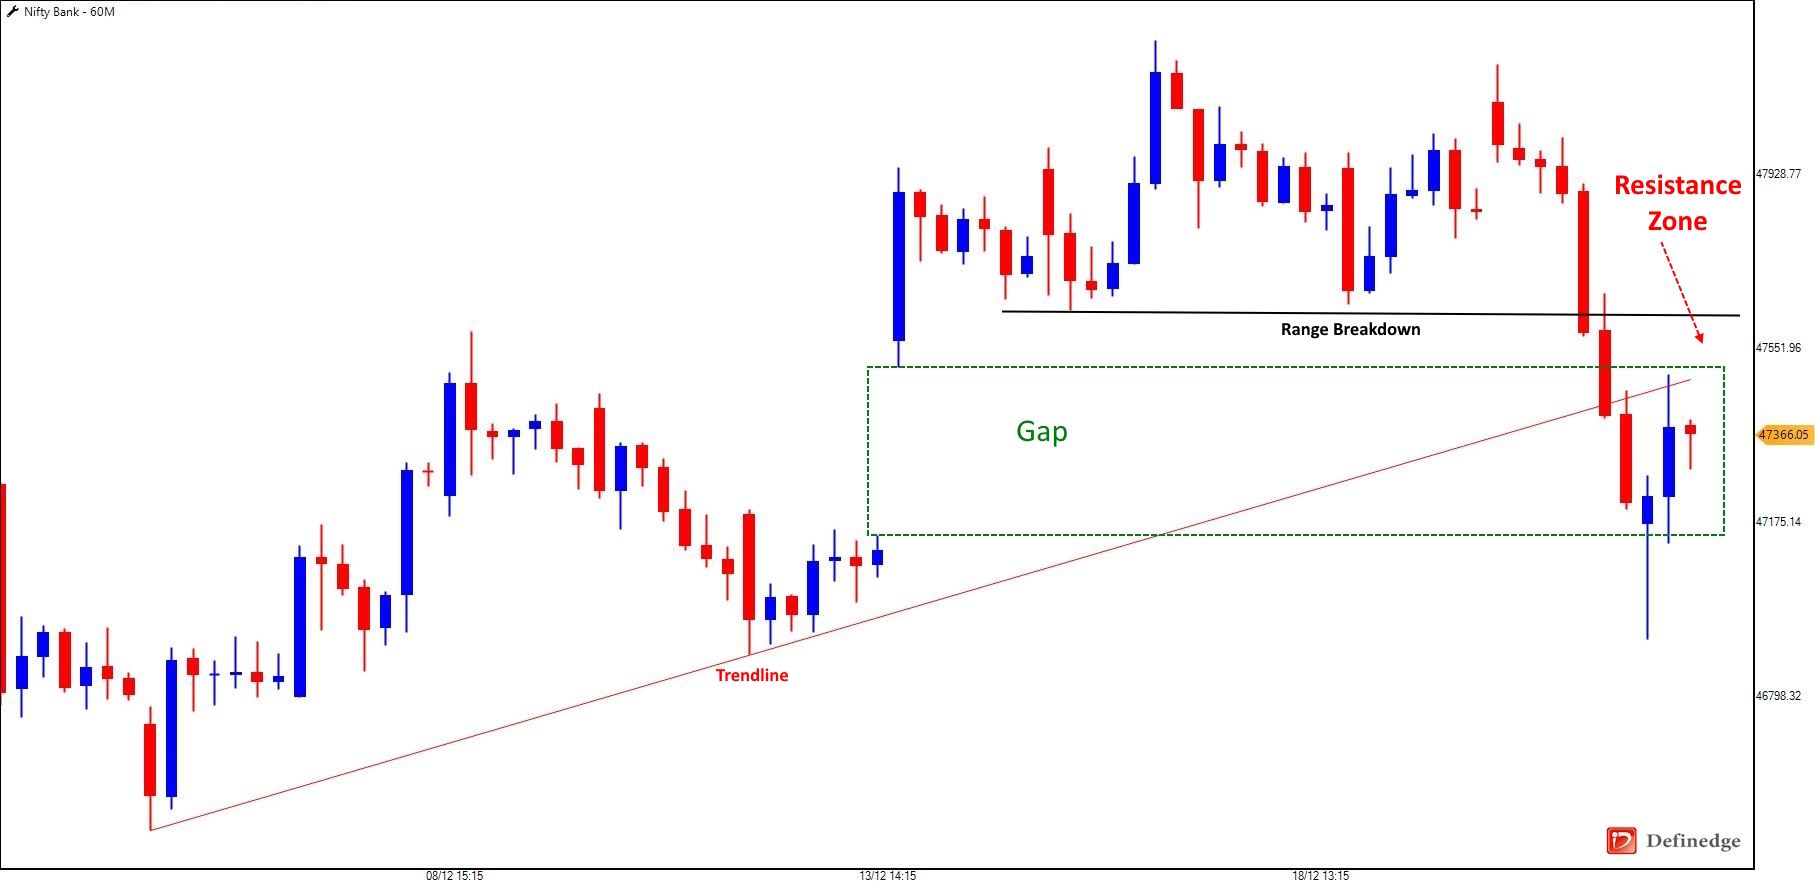
The Bearish Candlestick - A Market Top?
Gaps - A Ray of Hope on Nifty and Bank Nifty
The Bearish Candlestick - A Market Top?
Are You a Trader or a Forensic Expert?
Are You a Trader or a Forensic Expert?
Are You a Trader or a Forensic Expert?
Buying Sovereign Gold Bonds at Rs. 6,149/gm: A Wise Move?
Welcome to the Team Mr. Brijesh Bhatia!

A Grateful Note to Hyderabad for the Success of Manthan
Laidback Strategy - Stock List
Laidback Strategy - New Opportunities Emerge
Will Media stock will Lead further
Are You a Hot Stock Chaser? Don’t Miss the Signals!
Bluechip or Midcap or Smallcap - What are you buying?
Beyond the Crowd: A Closer Look at Nifty Metals Index Chart
Darvas Box Trading Simplified
LLOYDSENGG PRICE IS NOT UPDATING
LLOYDSENGG PRICE IS NOT UPDATING
Vriddhi Strategy {Long Only}
Vriddhi Strategy Scanner - Here We Go
Laidback Strategy - Stock List
Vriddhi Strategy {Long Only}
Vriddhi Strategy Scanner - Here We Go
Darvas Box Trading Simplified
Vriddhi Strategy Scanner - Here We Go
Vriddhi Strategy Scanner - Here We Go
Vriddhi Strategy Scanner - Here We Go
Vriddhi Strategy {Long Only}
Vriddhi Strategy Scanner - Here We Go
Vriddhi Strategy {Long Only}
Vriddhi Strategy {Long Only}
What a Move ABOVE 20,366
Chart Related Suggestions
Emerging Trend on Adani Stocks – Says our Exclusive Indicator
What a Move ABOVE 20,366
Emerging Trend on Adani Stocks – Says our Exclusive Indicator
I asked ChatGPT - How To Trade Options? - Here's What it Replied
Do You Know Eagle Price and RS Scanner?
My Indicator Signals Hurdle at 20,366 on Nifty
Laidback Strategy - New Opportunities Emerge
diierence between trade point pro in desktop & rzone web pro
My Indicator Signals Hurdle at 20,366 on Nifty
Laidback Strategy - Stock List
Laidback Strategy - New Opportunities Emerge
Laidback Strategy - New Opportunities Emerge
All Running IPO not showing in Zone
Laidback Strategy - New Opportunities Emerge
The Trader's Edge: Unusual Volume Activity Explained with Ready Scanner
Profiting with Monthly Charts: A Step-by-Step Guide to Technical Analysis
You Badly Missed this, Right?
Emerging Trend on Adani Stocks – Says our Exclusive Indicator
The Trader's Edge: Unusual Volume Activity Explained with Ready Scanner
Emerging Trend on Adani Stocks – Says our Exclusive Indicator
Charlie Munger's Legacy: 99 Not Out for Investors - His Investing Style and Lessons to Learn from Him
Emerging Trend on Adani Stocks – Says our Exclusive Indicator
PSU Banks Steal the Spotlight in 2023, But End May Be Dramatic...
We are Hearing Your Queries on Laidback Strategy and a Free Gift to Forum Users
Why I Will Avoid Buying Private Banks?
PSU Banks Steal the Spotlight in 2023, But End May Be Dramatic...
Exploring Investment Opportunities in the Healthcare Sector through Kotak Healthcare Fund NFO (Lumpsum/SIP)
Is it a Black Friday Sale on Tata Technologies IPO?
We are Hearing Your Queries on Laidback Strategy and a Free Gift to Forum Users
Nifty Auto
We are Hearing Your Queries on Laidback Strategy and a Free Gift to Forum Users
Tata Technologies IPO: A Lucrative Investment Opportunity?
Welcome to the Team Mr. Brijesh Bhatia!
Buy TCS, Sell HDFC Bank: A Sound Decision?
Buy TCS, Sell HDFC Bank: A Sound Decision?
Why I Will Avoid Buying Private Banks?
Buy TCS, Sell HDFC Bank: A Sound Decision?
The Last Trade on Nifty Shorts - A DECMA2023 Strategy
The Last Trade on Nifty Shorts - A DECMA2023 Strategy
The Last Trade on Nifty Shorts - A DECMA2023 Strategy
The Last Trade on Nifty Shorts - A DECMA2023 Strategy
Is it a Top in Place on the Small Cap Index?
Is it a Top in Place on the Small Cap Index?
Is it a Top in Place on the Small Cap Index?
From the Operating Room to the Trading Floor: The Shared Traits of Traders and Doctors
Why I Trust My Laidback Strategy
Why I Trust My Laidback Strategy
Why I Trust My Laidback Strategy
Why I Trust My Laidback Strategy
How to Spot Rejection in Stock Prices Using Technical Analysis
Emotional Rollercoaster: The Psychology of Stocks Meeting Entry Levels After Years
Emotional Rollercoaster: The Psychology of Stocks Meeting Entry Levels After Years
The Overlooked Trading Asset
Beyond Price and Volume: The Significance of Market Breadth in Equity Markets
Beyond Price and Volume: The Significance of Market Breadth in Equity Markets
Beyond Price and Volume: The Significance of Market Breadth in Equity Markets
Arvind : Breaking Barriers and Ascending New Heights
Venkeys
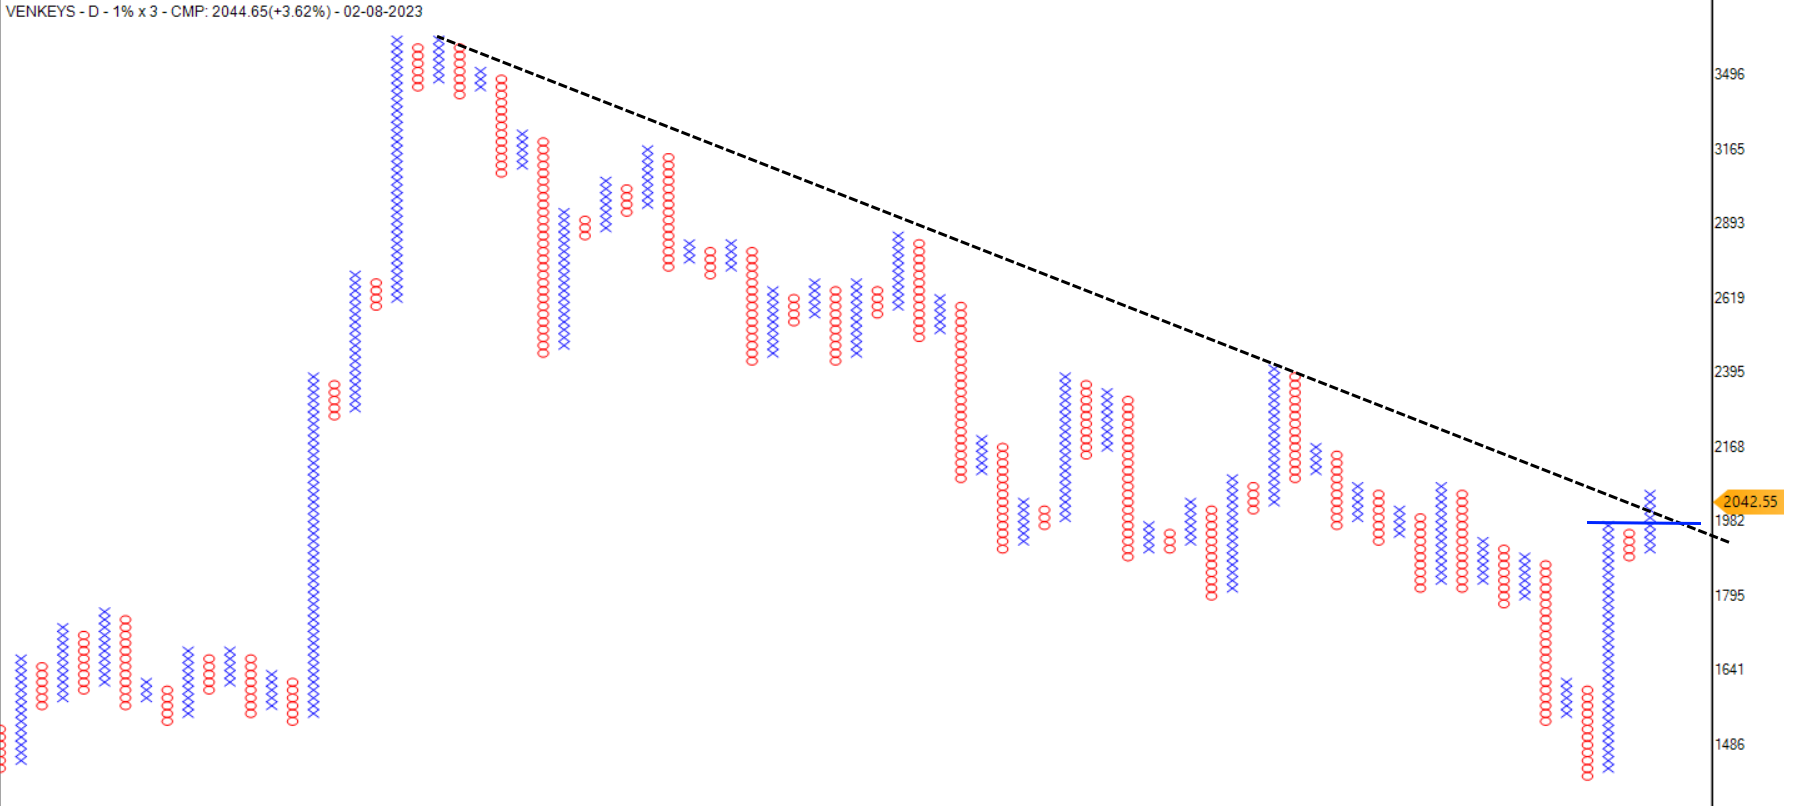
Asian Paints Stock: Is it Time to Sell?
TTML - Ready for Roller-Coaster Again?
All you need to know about the Reliance - Jio Financial Services Demerger
Infosys: A Bottom in Place?
Infosys: A Bottom in Place?
TTML - Ready for Roller-Coaster Again?
CDSL Stock Price Breaks Out of Falling Trendline
Infosys: A Bottom in Place?
JindalStel - Demonstrating Power on the Chart
Reliance Industries - The Awakening of an Elephant
Reliance Industries - The Awakening of an Elephant
Rallis India
Decoding the Parameters for Calling the Top in Equity Markets
The Nifty PSE Index has finally broken out of a 17yrs Range
Important Market Insight!
Important Market Insight!
Assessing the Risks of Investing in Large-Cap, Mid-Cap, and Small-Cap Stocks