Why the Straddle is a Core Weapon in NIFTY Intraday & Swing Trading
✦ Introduction
In the vast universe of derivatives, straddle is a silent warrior — neither biased to bullish nor bearish, but always watching volatility, time decay, and direction with surgical precision. For NIFTY traders, both intraday and swing, the straddle is more than a strategy — it's a market thermometer, a premium absorber, and a sentiment decoder.
✦ What is a Straddle?
A straddle involves buying or selling both Call (CE) and Put (PE) options of the same strike and expiry. The most common is the At-The-Money (ATM) straddle.
Long Straddle = Buy ATM CE + Buy ATM PE → Profits from big moves either side.
Short Straddle = Sell ATM CE + Sell ATM PE → Profits from time decay & price staying near strike.
✦ Why It’s Crucial for NIFTY Traders
NIFTY is a highly oscillating index, known for fakeouts, sharp rejections, and strong intraday reversals. In such a landscape, studying the straddle isn't just about finding a trade — it's about understanding where the market is nervous or confident, and when it's ready to explode in a direction.
The straddle acts as a:
Compass for directional bias
Scanner of volatility traps
Live barometer for institutional behavior
Reason Intraday or Swing Benefit
 Market Sentiment Decoder Rapid premium rise = expected breakout High IV = major trend ahead
🧭 Directionless Income Short straddles earn in rangebound days Helps earn theta during consolidation
 Momentum Detector Premium expansion = trending day Sudden straddle shift = breakout sign
🧠 Institutional Behavior Insight Who’s trapped? Writers or buyers? OI & Premium expansion hint accumulation/distribution
 Volatility Tool Spike in CE/PE premium shows risk buildup IV divergence warns of big swing setups
 NIFTY Oscillation Reader Tracks chop zones vs clean breakouts Helps filter false swing entries
✦ Intraday Edge with Straddle (Live Use Cases)
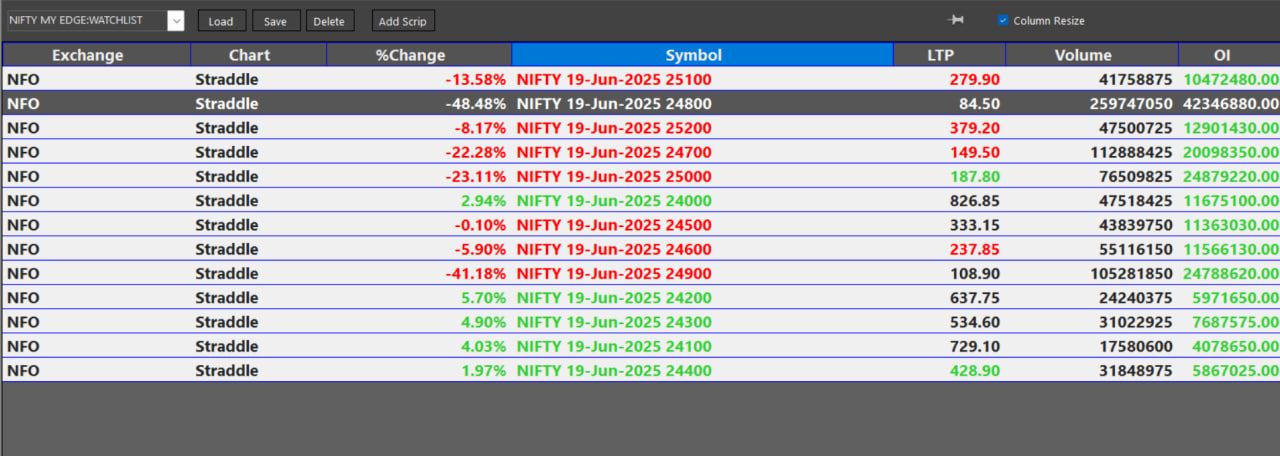
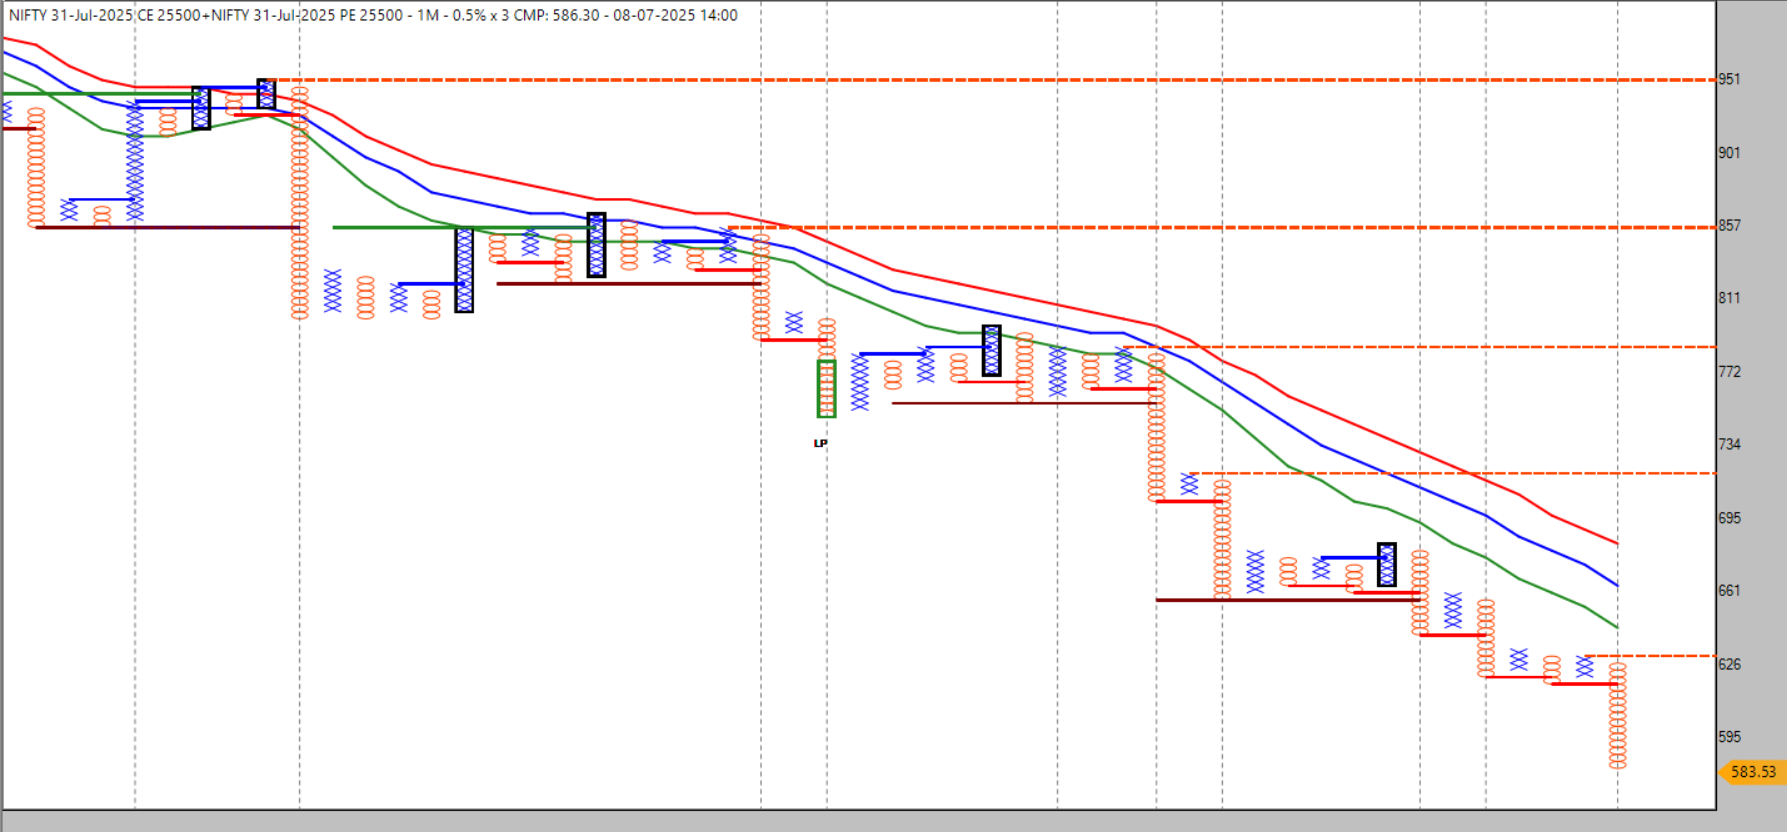
200± Straddle – Placing straddles 200 pts away from spot helps track theta burn zones and breakout traps.
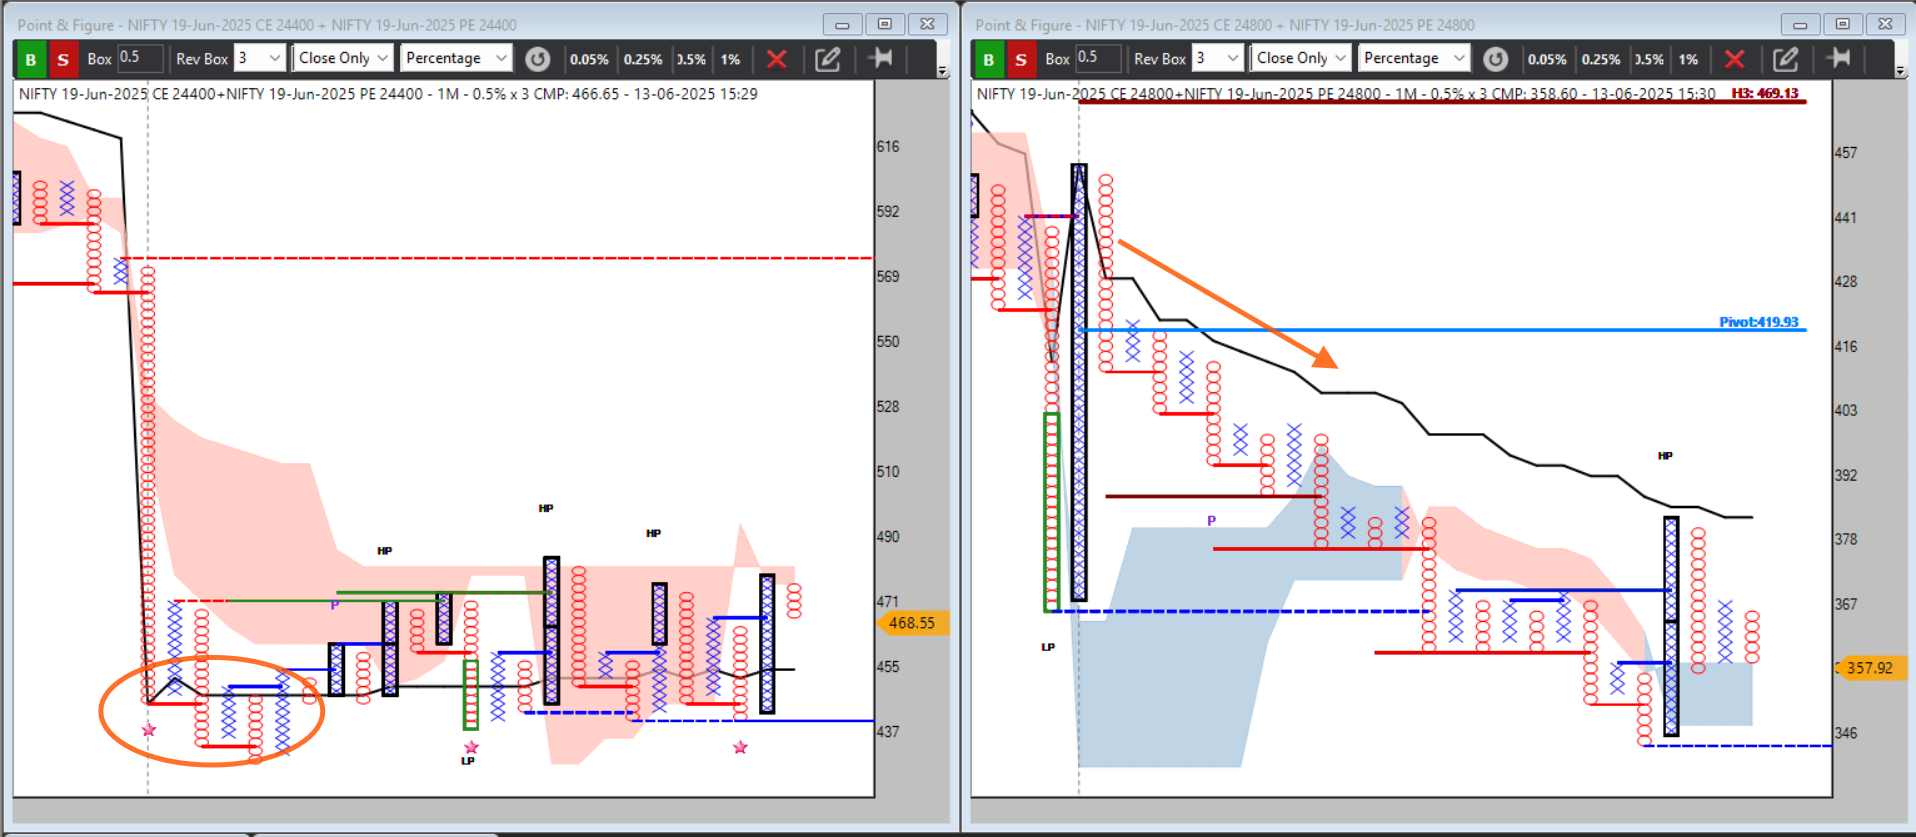
P&F or Renko Analysis on Straddle Premium – Patterns like double bottom sell, VWAP rejection, or box breakout provide raw, noise-free signals.
Open Auction Day – If both legs fall fast, market has clear direction. If both rise, trap or expansion coming.
Theta Dance – Observing which leg decays faster helps catch the directional bias before the move.
✦ Swing Insights Using Straddle
Build Position with IV-HV Analysis: Low IV short straddles during consolidation; high IV long straddle before event.
Premium Expansion over 2–3 days without price movement often precedes big swing breakout.
Protective Hedges: Even directional players use straddles as hedged setups for complex exposure (straddle + call buy/put buy).
✦ The Psychology: Why Straddle Reflects Fear & Greed
Every tick in the premium reflects:
Fear of sudden move (leading to premium buildup)
Complacency (leading to decay)
Institutional hedging or unwinding
Understanding these ticks trains a trader’s mindset to anticipate, not just react.
✦ Final Thoughts: Not Just a Strategy, but a Compass
Whether you are scalping intraday moves, catching swing breakouts, or simply decoding market psychology, the straddle is a mirror of NIFTY's soul.
Because NIFTY oscillates sharply — pushing traders to emotional extremes — a well-read straddle structure keeps you calm, aware, and prepared for what the market is about to do — not what it just did.
"In the dance of CE and PE, the straddle does not just move — it reveals the market's heartbeat."
✦ Straddle Premium Patterns: A Noise-less Proxy to Option Greeks
While most traders rely on IV, Theta, and Gamma data to make sense of the market, straddle premium behavior itself can act as a clean proxy — especially when decoded through Point & Figure (P&F) or Renko charts.
These charts strip out time and focus purely on price behavior, offering raw, unfiltered emotional truth of the market.
 Pattern-Based Interpretation Without Raw Greeks
P&F / Renko Pattern on Straddle Premium Hidden Greek Insight Interpretation
 Flat Box Zone (Stagnant Premium) High Theta decay Writers dominating, price expected to stay rangebound
 Sudden Breakout of Premium IV Spike Market expecting volatility; possible directional move
 One-Leg Collapse (CE or PE) Gamma Exposure Delta hedging in play, direction firming up
 Alternating Columns (X/O) Unstable Vega/IV Market in indecision, breakout imminent
 Double Bottom Sell Pattern (on CE/PE leg) Theta Burn + Bias Weak side collapsing, strong directional bias emerging
 Rising Column or Higher Bricks IV Expansion + possible Long Gamma Buyers expecting violent move, breakouts near
✦ Why This Works Like a Magic Lens
Greeks are derivatives of price and time.
Straddle premiums already reflect this derivative nature — if you can read the "shape" they form, you're essentially reading the emotion behind the greeks.
P&F or Renko acts as an amplifier, cutting out fake noise and showing only true demand-supply shifts.
✦ The Hidden Power in Pattern Study
"Where others hunt for data, the straddle trader hunts for meaning in patterns."
Using P&F or Renko on CE/PE premiums helps you:
Read real-time IV reaction without IV data.
Feel theta pressure by watching decay zones.
Spot gamma traps by observing one-leg explosions.
Sense volatility contractions or expansions just by noting box width and transitions.
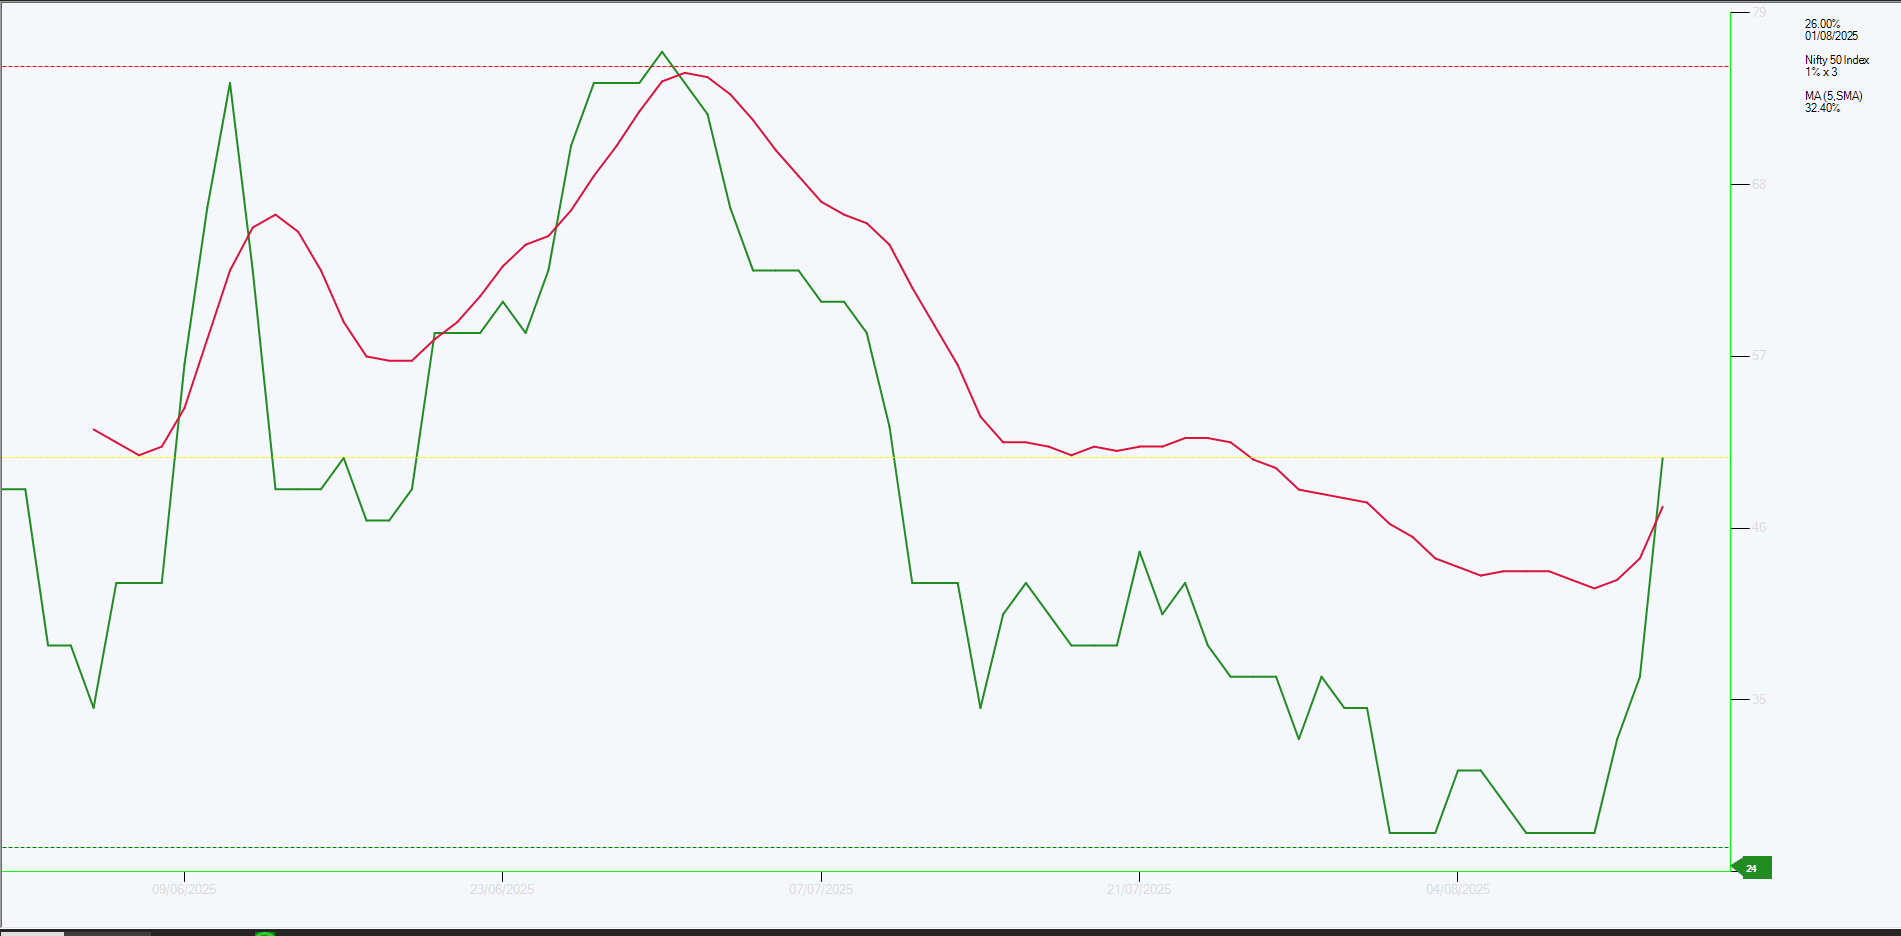
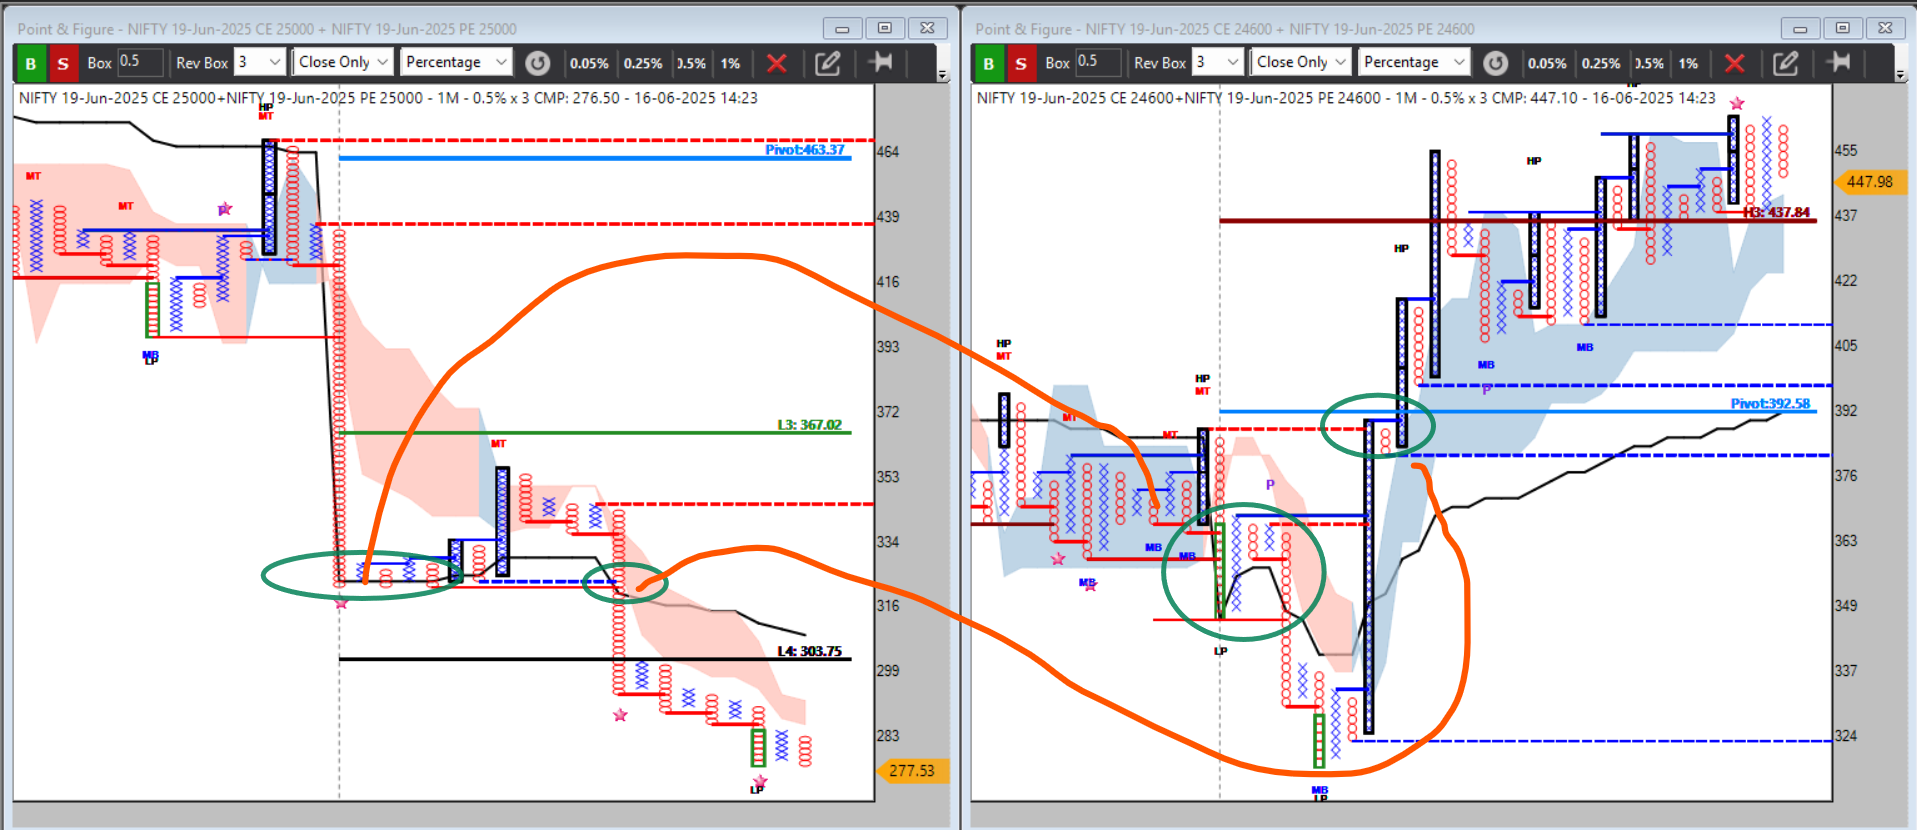
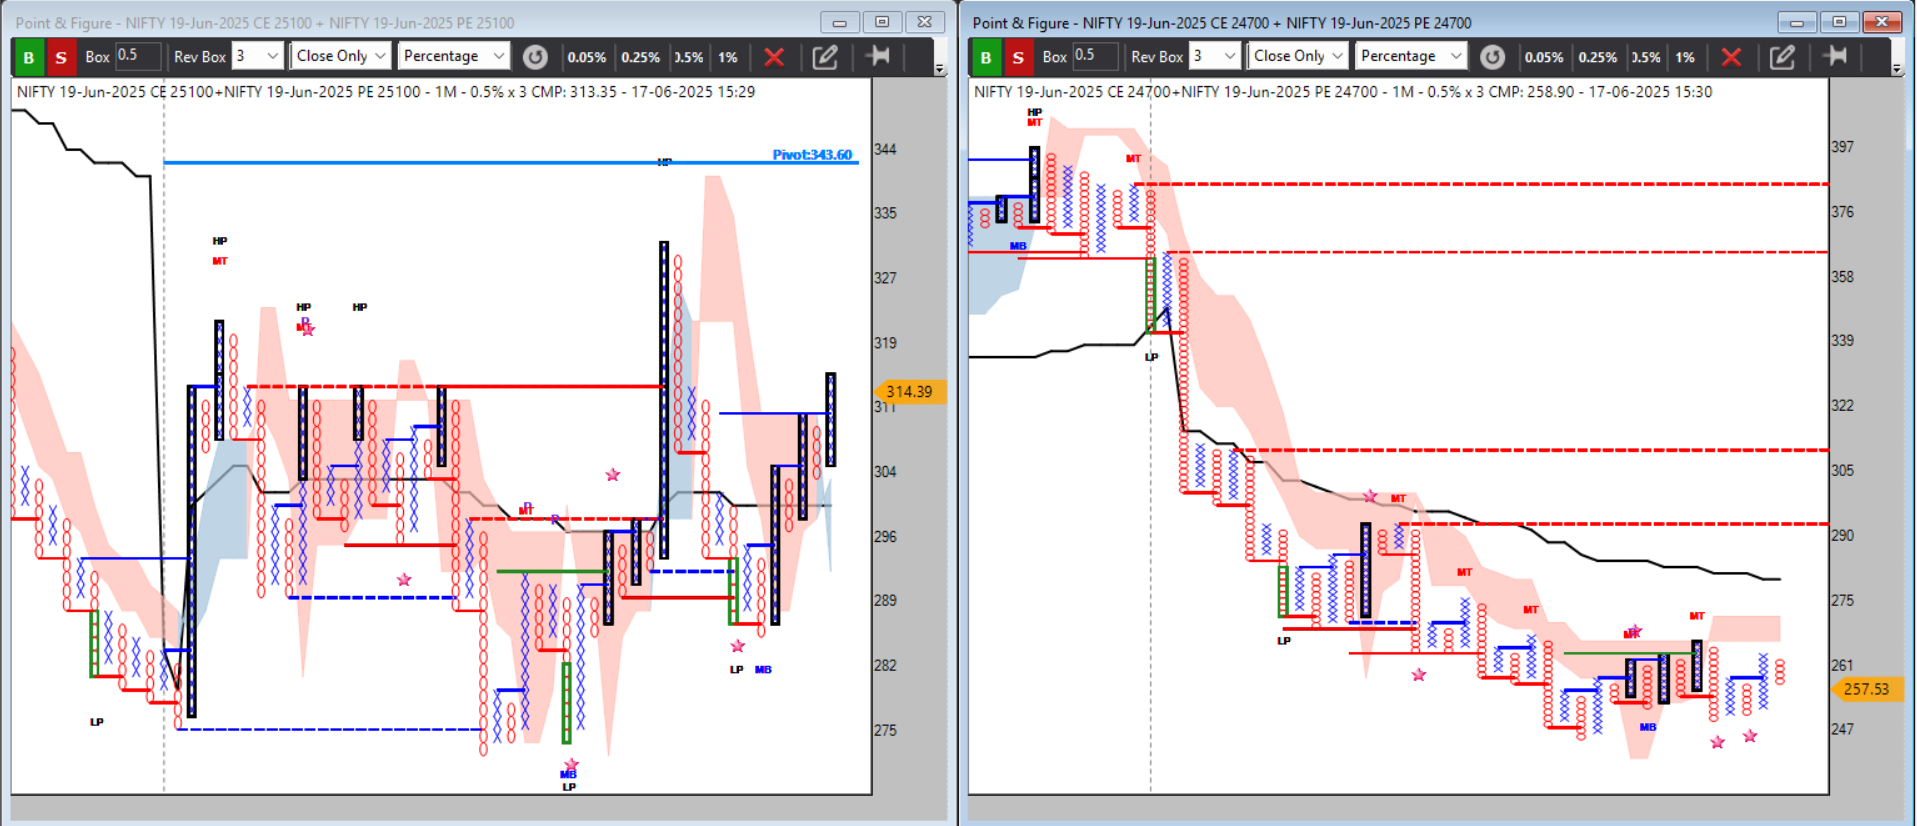
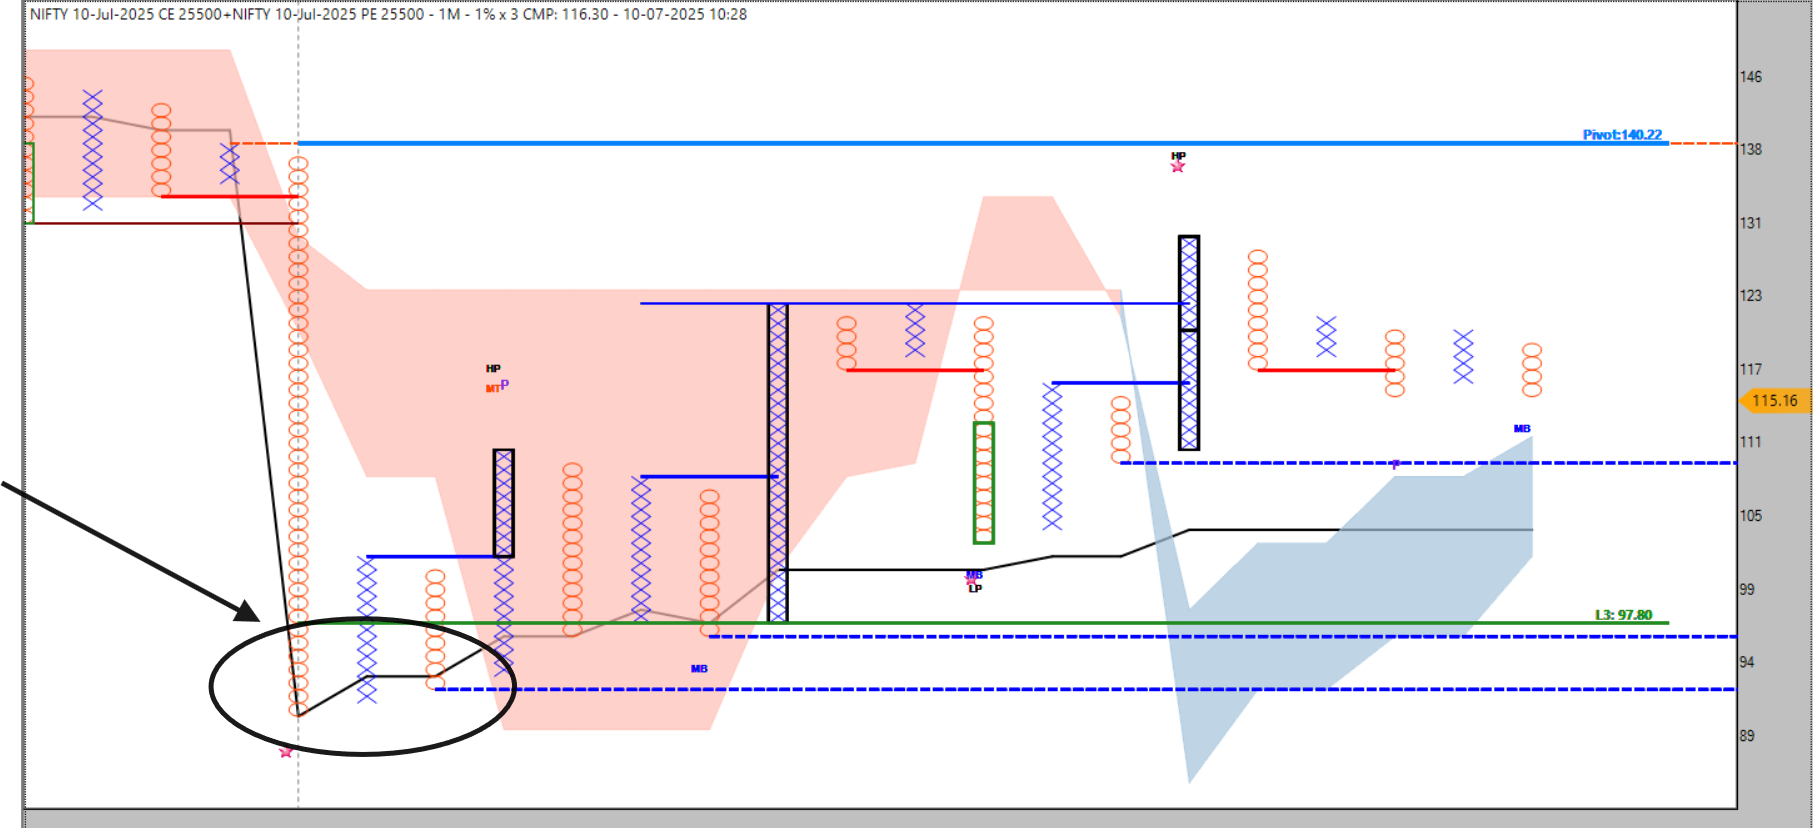
✦ Example: How You Can Read IV Spike Without IV Data
You open a NIFTY ATM straddle at 9:30 AM.
You plot both CE and PE separately in 1-minute P&F (0.5 box size).
Suddenly, both columns start showing long vertical moves.
No price breakout has occurred yet, but premium is expanding fast.
Conclusion: Market is loading volatility. A breakout is imminent. IV has likely spiked — without you ever needing to check IV.
✦ Final Takeaway: Pattern = Pulse
When you learn to see straddle premium not just as price, but as energy, and decode it with charts like P&F, you unlock something rare:
You stop reacting to data.
You start resonating with rhythm.
And that’s the soul of elite option trading — when price, pattern, and psychology merge into silent certainty.
✦ A Tribute to Abhijit Phatak (AP Sir) — The Silent Architect of Straddle Wisdom in India
As we explore the depth and dimensions of straddle premium behavior — through charts, psychology, and patterns — we must pause and bow our heads in respect and gratitude to the one who laid the first stones of this temple of knowledge:
AP Sir — a name whispered with reverence among serious traders,
not for loud fame, but for the clarity of his vision,
the depth of his practice,
and the silent revolution he sparked decades ago.
Long before the mainstream caught on, AP Sir taught us to read straddles not just as strategy, but as a living market language.
He taught us to listen to the premium’s pulse, not just its price.
To see traps in time decay, and to witness structure in randomness.
To use noiseless charts like Renko & P&F not as alternatives, but as instruments of emotional precision.
In every breakout we catch, in every trapped writer we sense, in every box we plot — his spirit echoes.
"True legends don't seek attention, they seek understanding."
AP Sir’s gift was not just in what he taught,
but in how he made traders see what was always there — yet never noticed."
✦ In Gratitude
This article, and the evolving framework around straddle premium decoding, is humbly dedicated to AP Sir,
whose pioneering insight in India lit the first lamp of this path.
We are merely walkers of a trail he carved through decades of disciplined wisdom.
 “The Man Who Traded in Silence”
A tribute to Abhijit Phatak (AP Sir)
*He did not chase the flashing screens,
Nor danced to the market’s screams.
In rooms of noise, he chose the chart,
Where Xs and Os revealed the heart.
Not a preacher, never loud,
Yet in his gaze, the market bowed.
With chalk of calm and board of grace,
He mapped the traps no one could trace.
He showed us time was just a lie,
That truth lives where price patterns lie.
Not in candles burnt with fear,
But in patterns cold and clear.
He spoke of straddles not as trades,
But mirrors where the market fades.
Where gamma breathes and theta dies,
Where volatility quietly lies.
The premium’s pulse, the theta's sigh,
He heard it all, with a P&F eye.
While others screamed for entry lines,
He taught us how to read the signs.
In Renko bricks or double tops,
In fading legs where momentum stops —
He taught us not to rush or race,
But let the market show its face.
His legacy is not a class or course,
It’s every calm before a force.
It’s every trade we skip with poise,
And every silence that defeats the noise.
So here we bow, to P&F's priest,
To the quiet mind, to the inner beast.
To the man who walked the charts alone,
And left us paths carved into stone.
Thank you, AP Sir.
You did not teach us what to trade —
You taught us how to see.
-
 ️ Disclaimer
 -
This article, including all technical interpretations, charting insights, and poetic tributes, is intended solely for personal experience sharing and educational purposes.
-
The strategies and observations presented are a result of years of individual study, practice, and emotional learning by the author.
-
References to Abhijit Phatak (AP Sir) are made with utmost respect and admiration, recognizing his pioneering influence on the Indian trading community — especially in the realm of straddle pattern decoding and noiseless charting methods.
-
The P&F chart references, pattern readings, and psychological interpretations are meant to foster awareness and curiosity, not to be interpreted as financial or trading advice.
-
Readers are encouraged to do their own research, consult professionals, and treat this article as a framework of understanding, not a signal for investment or trading.
-
This work stands as a humble personal reflection and tribute —
-
a step in honoring the silent giants and shaping one’s own disciplined path.
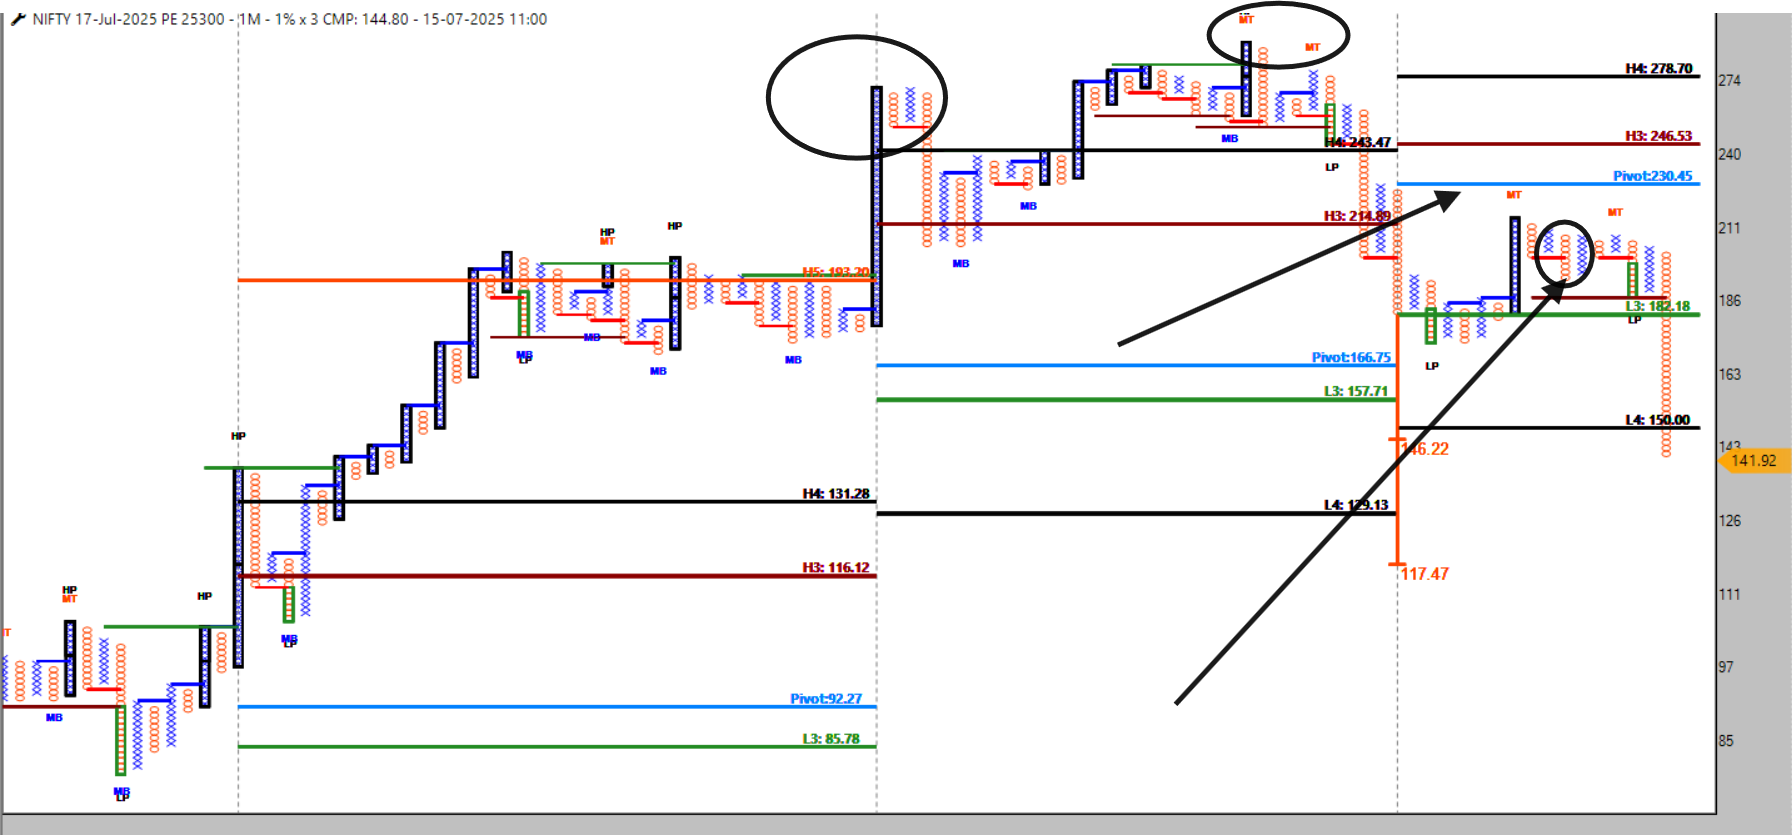
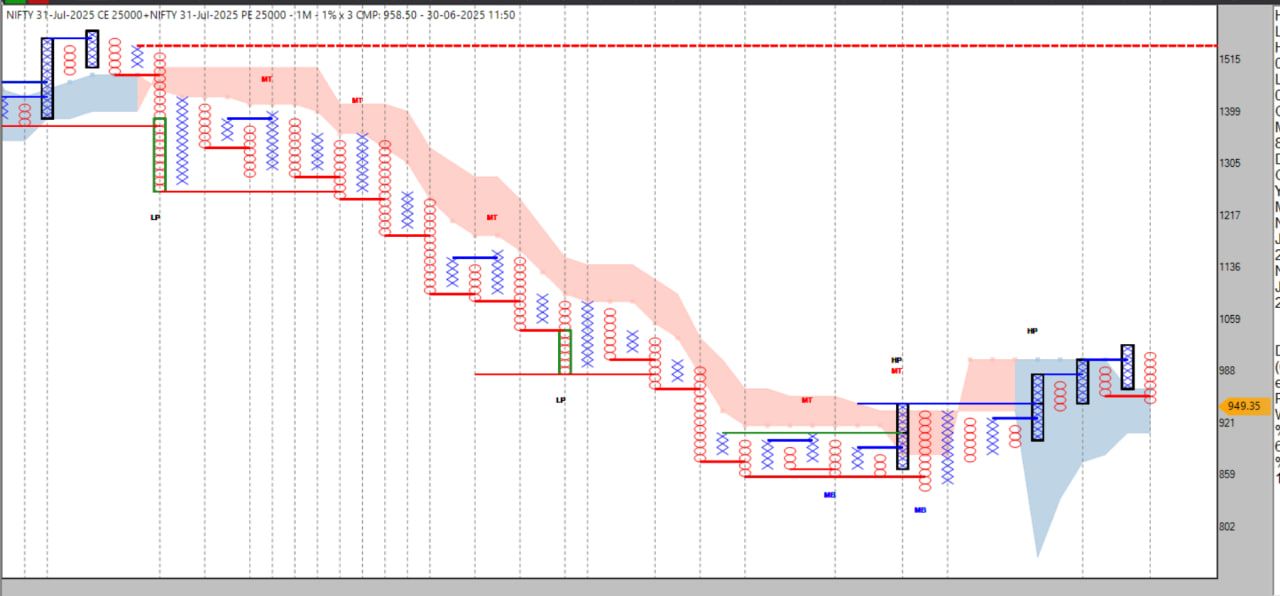
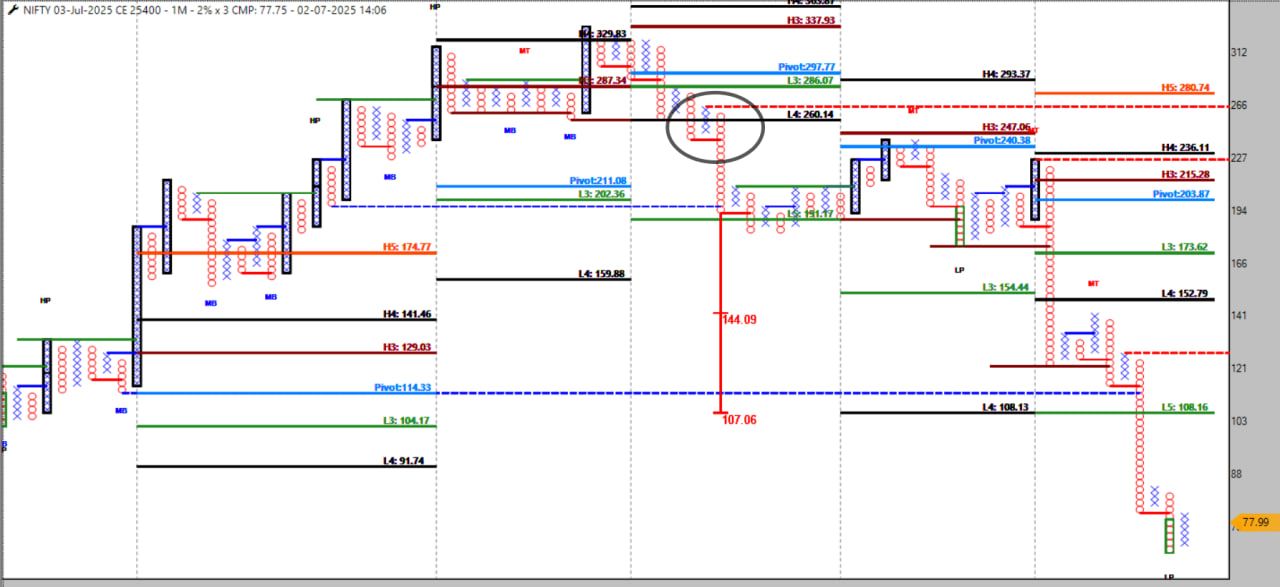
 The market may be getting ready to break upwards.
 Higher Straddle (above price): ITM Put + OTM Call → Premium rising = potential bearish bias.
 Introduction
 What Are 200± Straddles?
 Understanding D-SMART
 Why Does This Work?
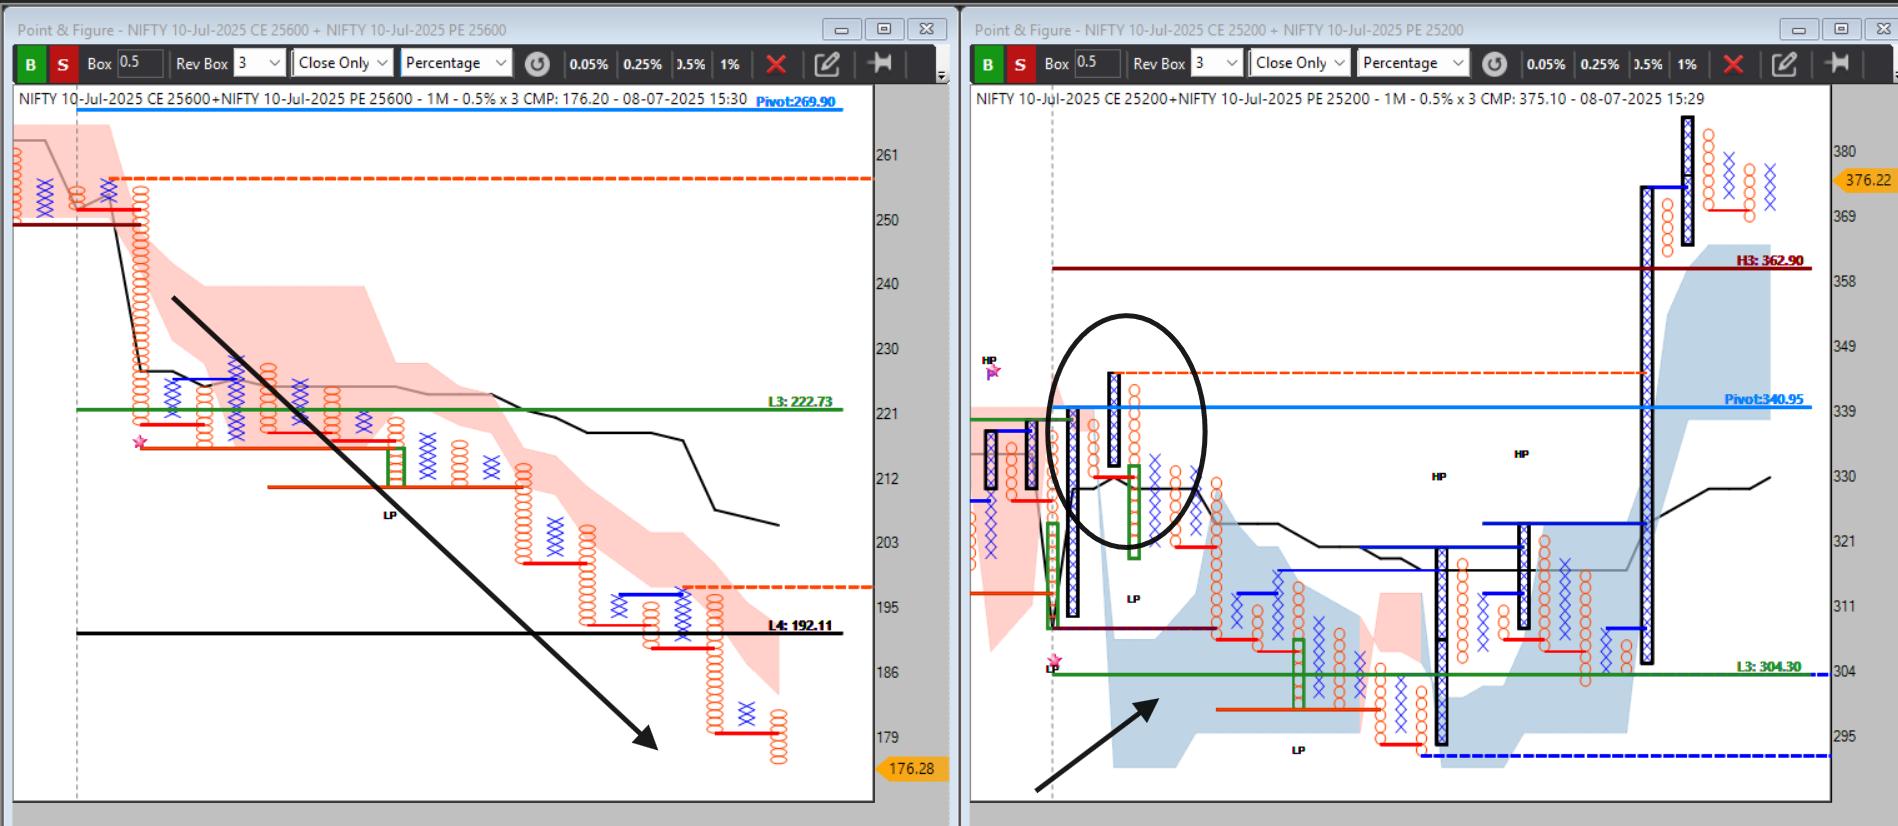
 ️ Key Learnings from This Live Example:
 ️ This article reflects my personal experience and structural learning while refining the 200± NIFTY straddle system using D-SMART. Trading outcomes may differ from person to person depending on capital, psychology, discipline, and market conditions. Please treat this as an educational note, not as financial advice. Always practice with proper risk management suited to your financial situation and trading experience.
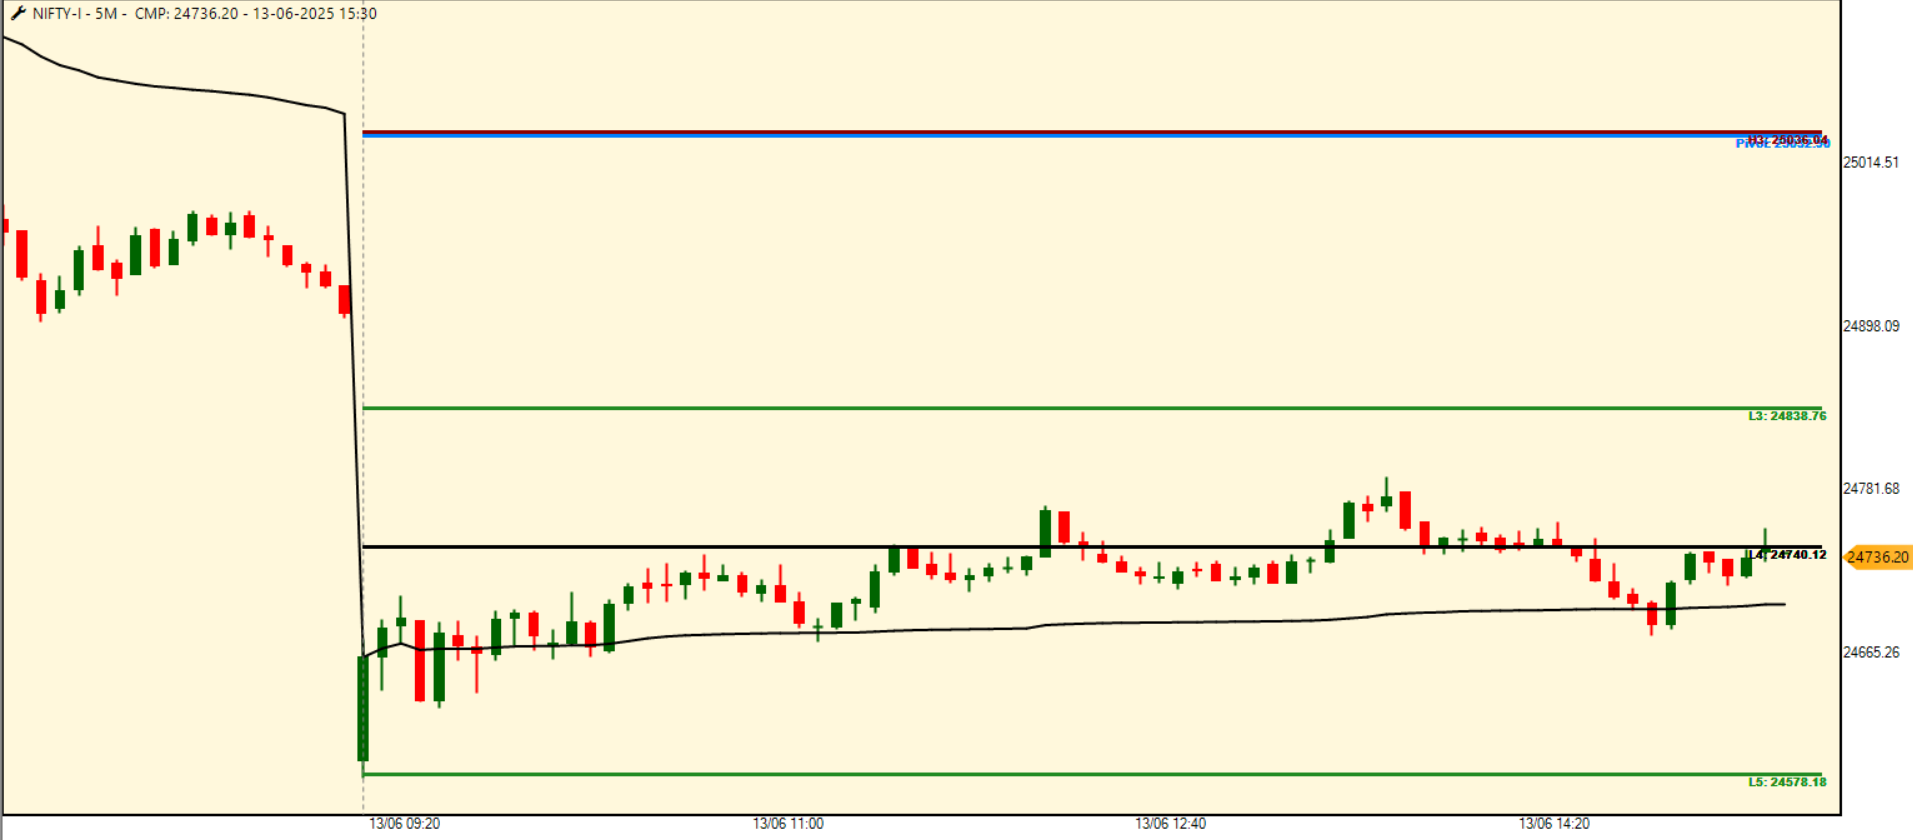
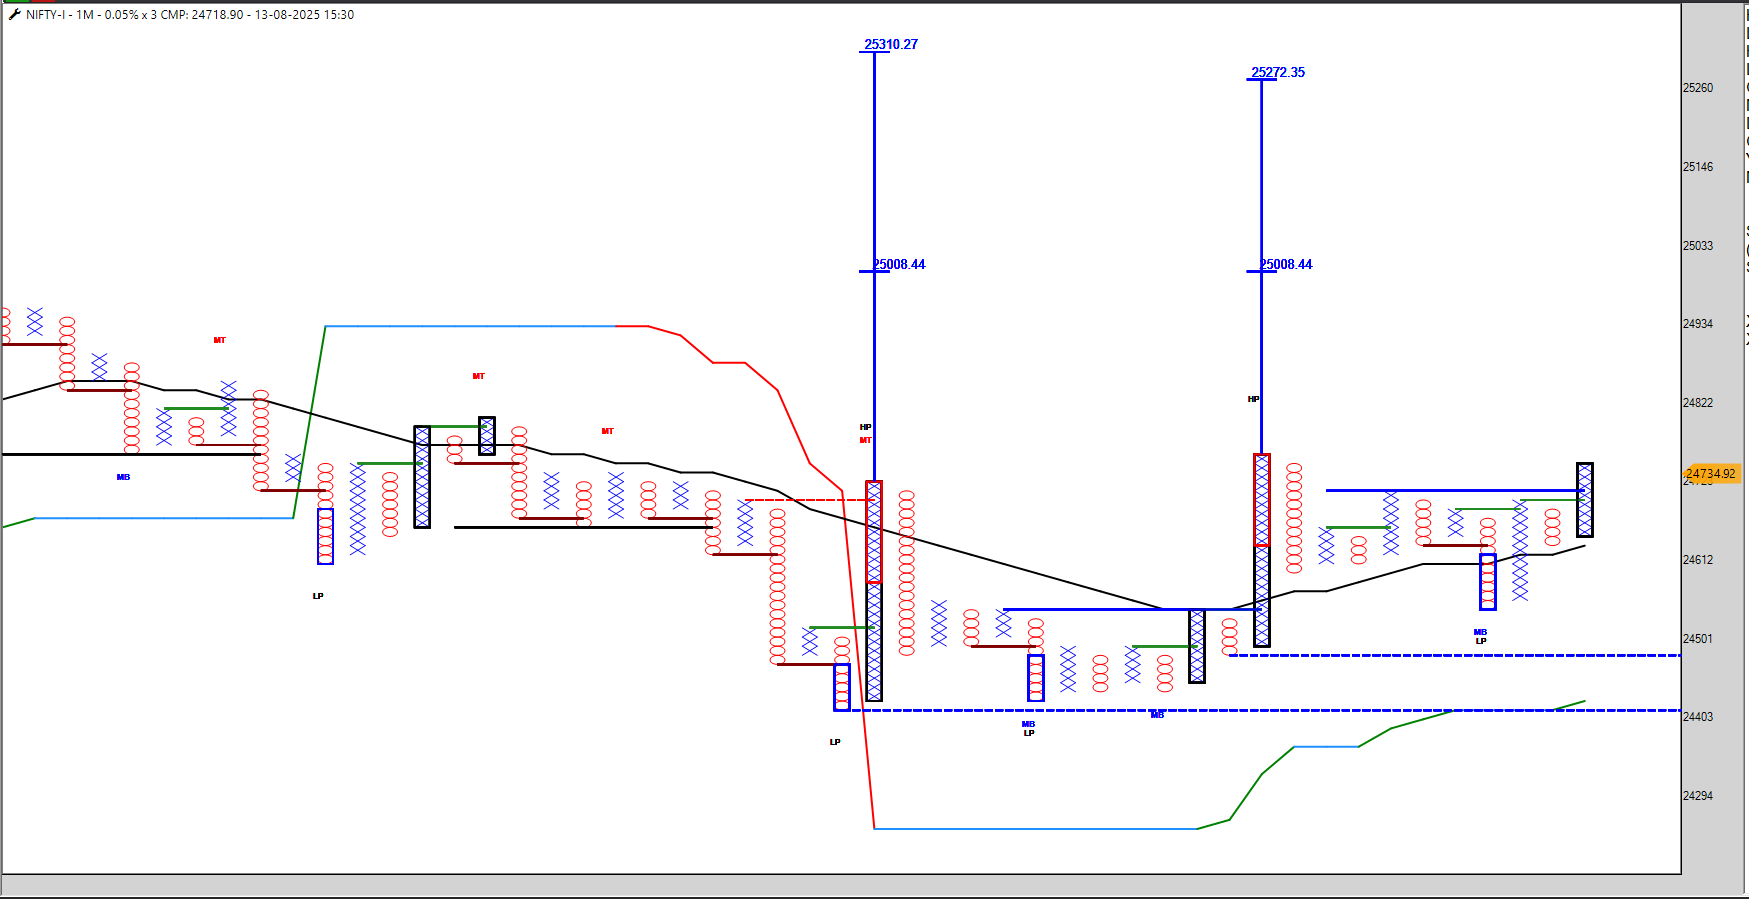
 later part when 24400 straddle gets some vwap above good pattern ( after morning session ) i can be plan ce buy with near wvap entry as it's not so bullish to enter any breakout pattern rather plan for pullback pattern ( 24400 straddle stracure will say about momentum ce buy or pullback ce buy with small point target ) though i am not trade any ce long today . it's just education addition .
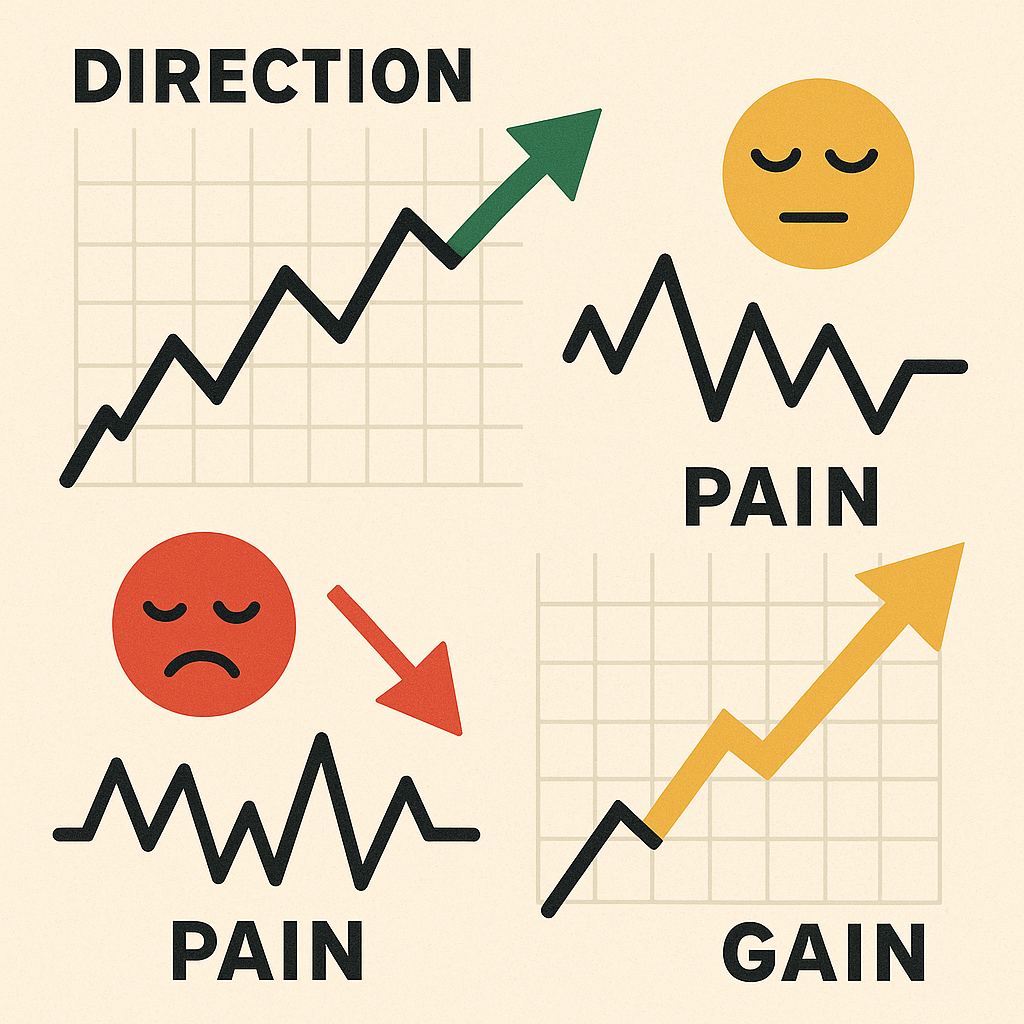

 Tribute & Inspiration
 3. GAIN — Clean Decay with Confirmed Trend = Alpha Zone
 Trading Mahabharata: “Haath Kaap Raha Hai Madhav…”
 1️⃣ Introduction: The Battlefield of Markets
 What if it goes wrong?
 ️ 3️⃣ Krishna’s Guidance: Fear vs. Dharma
 5️⃣ Why Does the Hand Tremble?
 Fear of past losses: “Will I fail again?”
 6️⃣ Hindi Song Resonance
 “Ruk jaana nahin, tu kahin haar ke…”
 7️⃣ The Practical Way Forward
 8️⃣ A Message to the Hesitant Trader
 ️ 9️⃣ Disclaimer & Humble Note
 ️ 10️⃣ Conclusion: The Warrior Trader’s Mantra
 Boring System:
 Boring systems allow you to:

 Final Note:
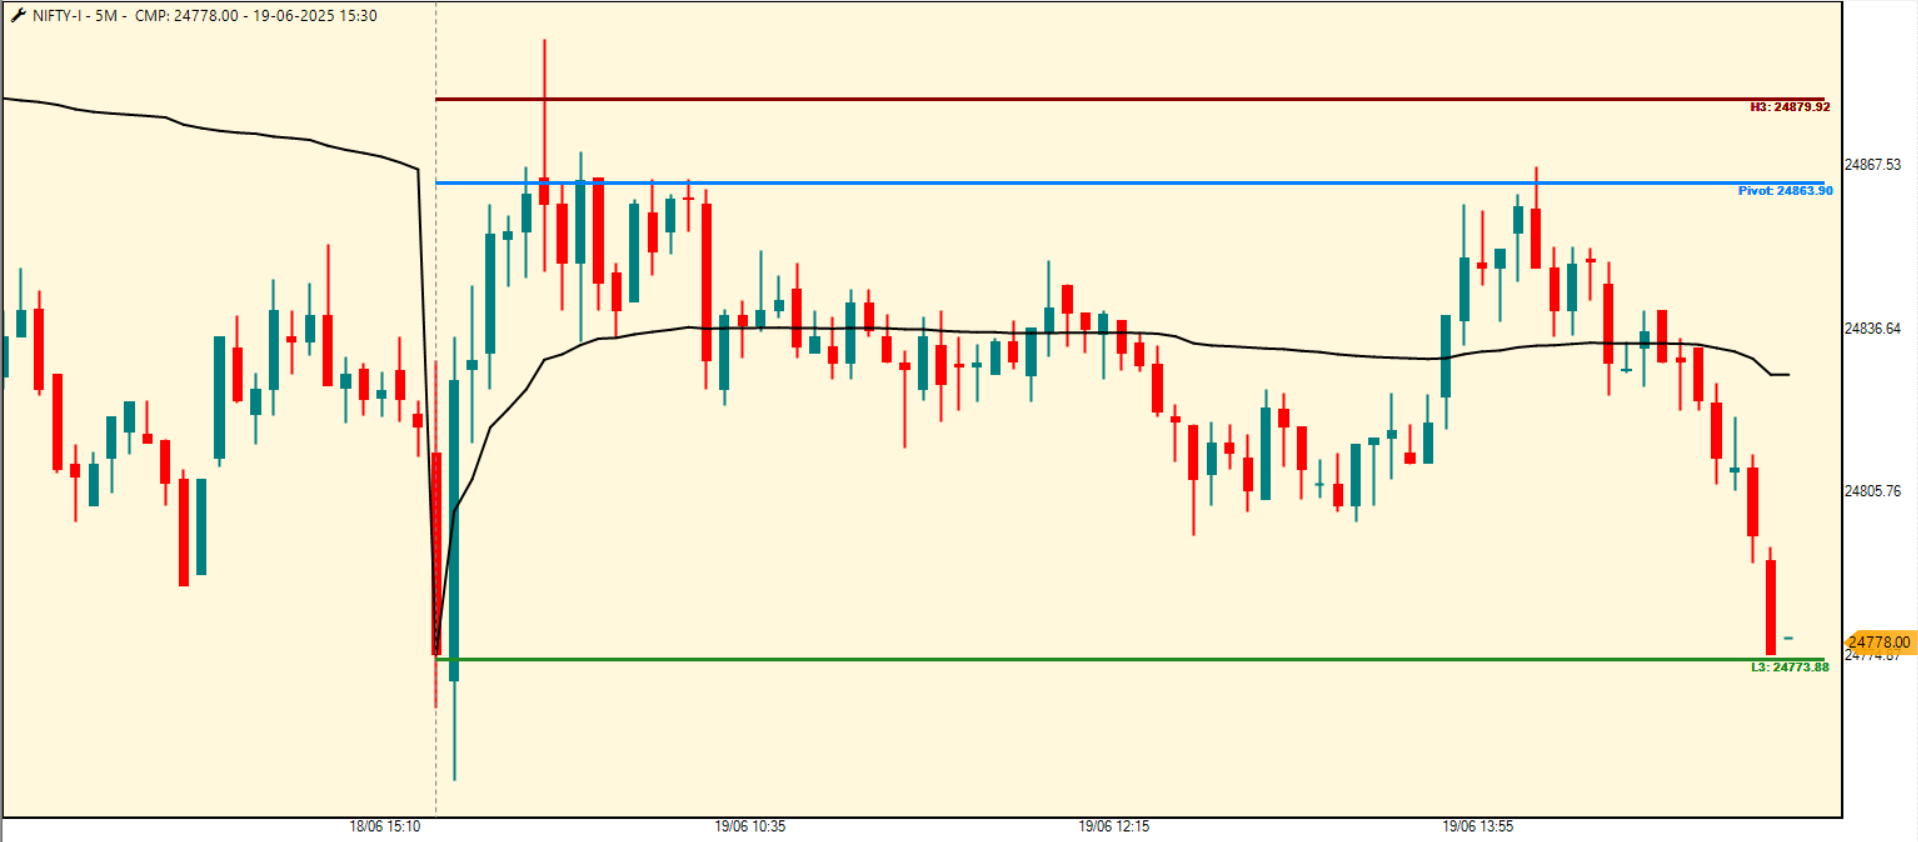
 Opening Scene:
 ️ Expiry Day Context:
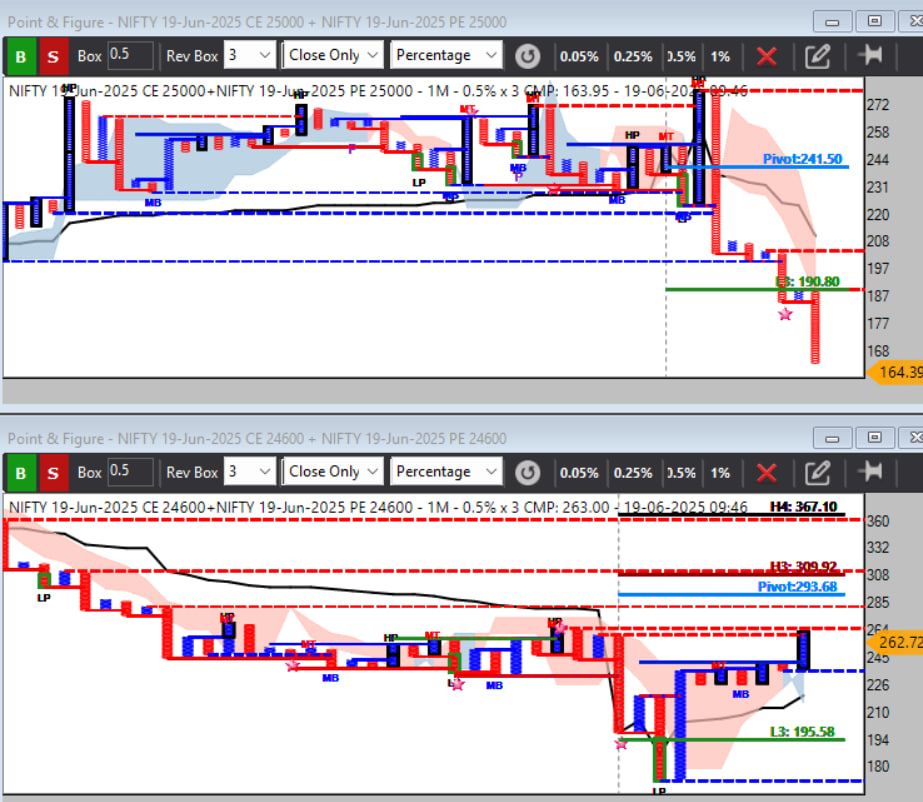
 These opposite reactions in premium = perfect divergence signal
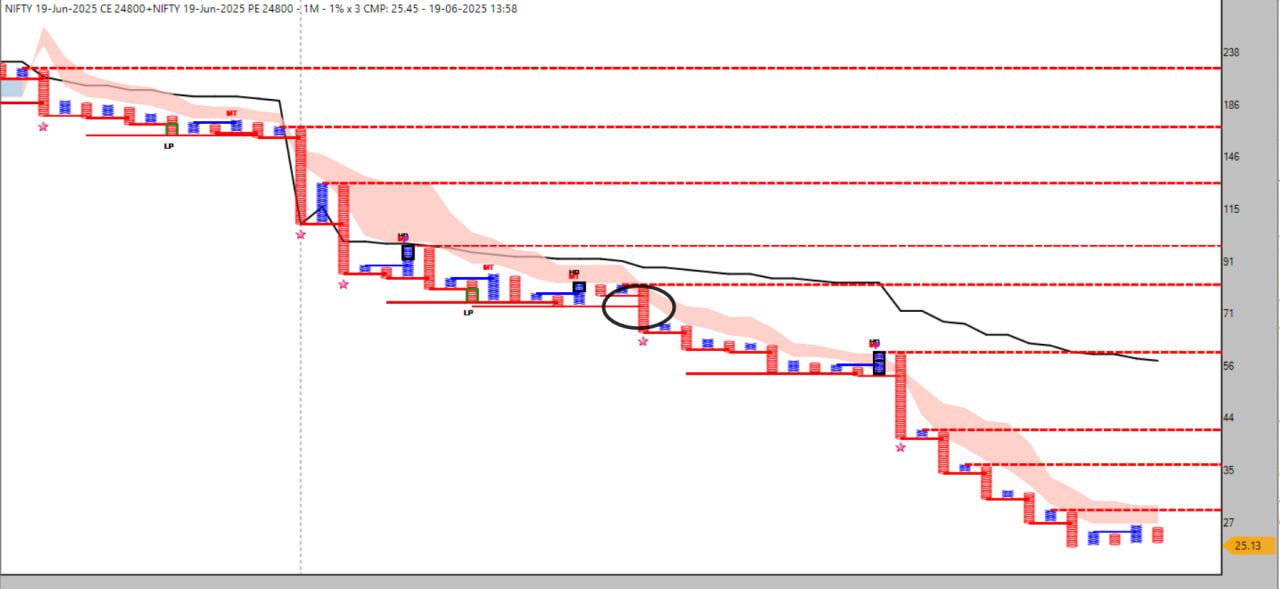
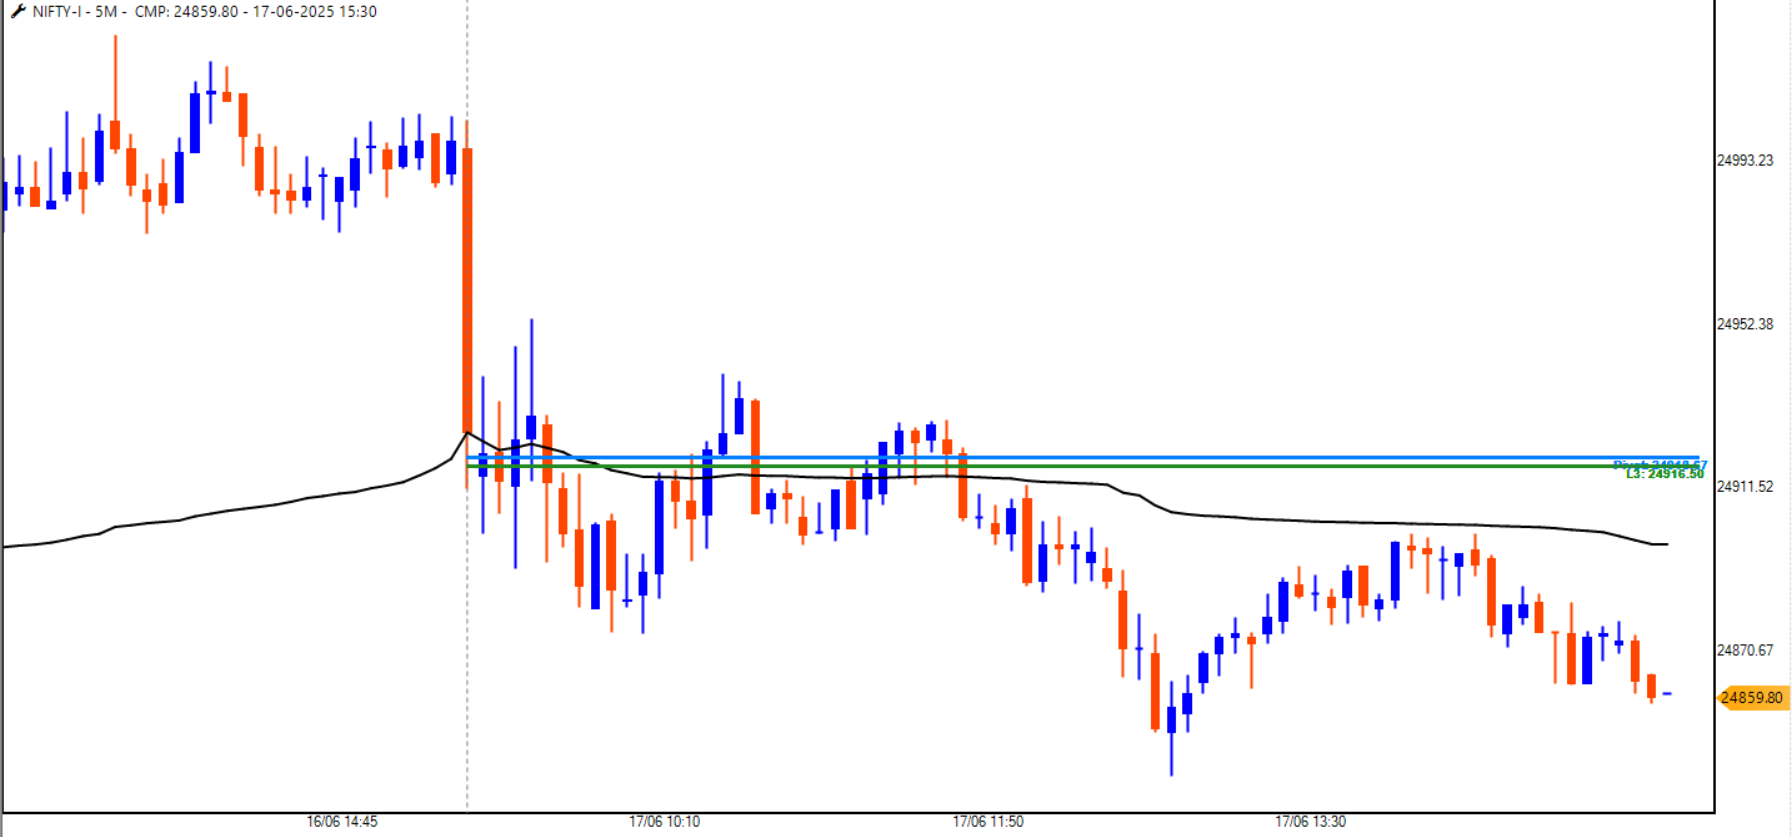
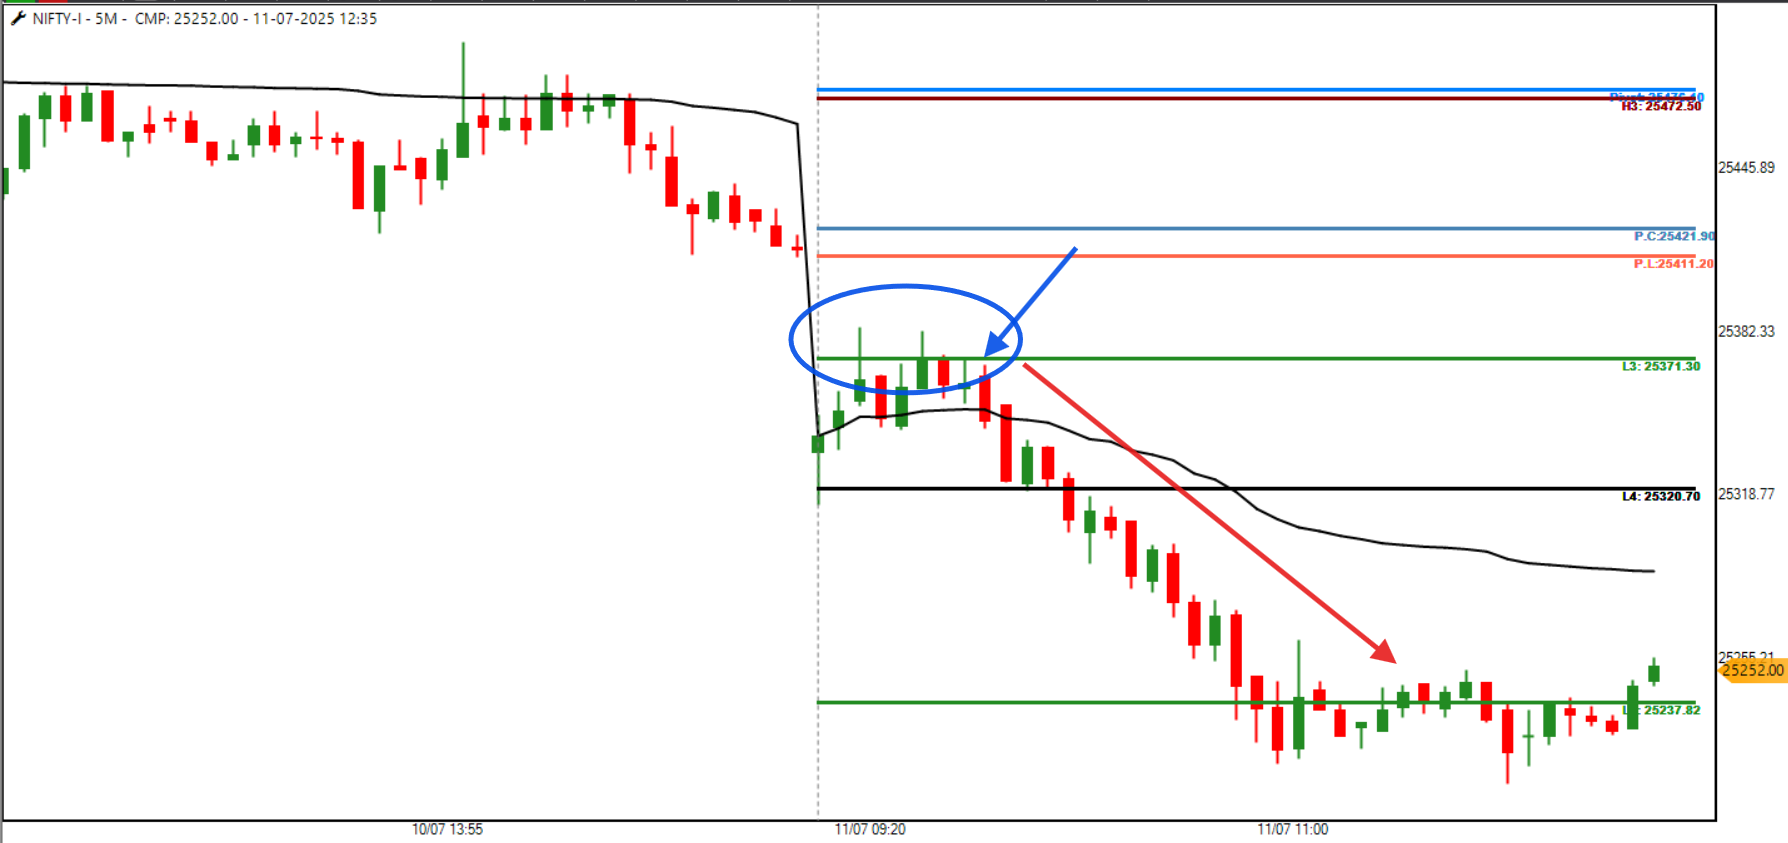
 1 Hour Post-Open – Patience Paid Off
 After the initial bounce and VWAP drift:
 Note:
Note: All charts and premium snapshots were posted live on Telegram during market hours.
 , getting trapped in volatility, emotions, and chaos.
 Fear prevents accepting loss.
 Greed resists booking profits.
 Ego says, “I cannot be wrong.”
 Time decay eroding potential profits.
 ️ The Abhimanyu Exit Solution Framework

 ️
️ Conclusion
 ️ by mastering planned, disciplined exits so your trading journey remains a story of return, learning, and growth—not of a heroic but unfinished battle.

 Real-time


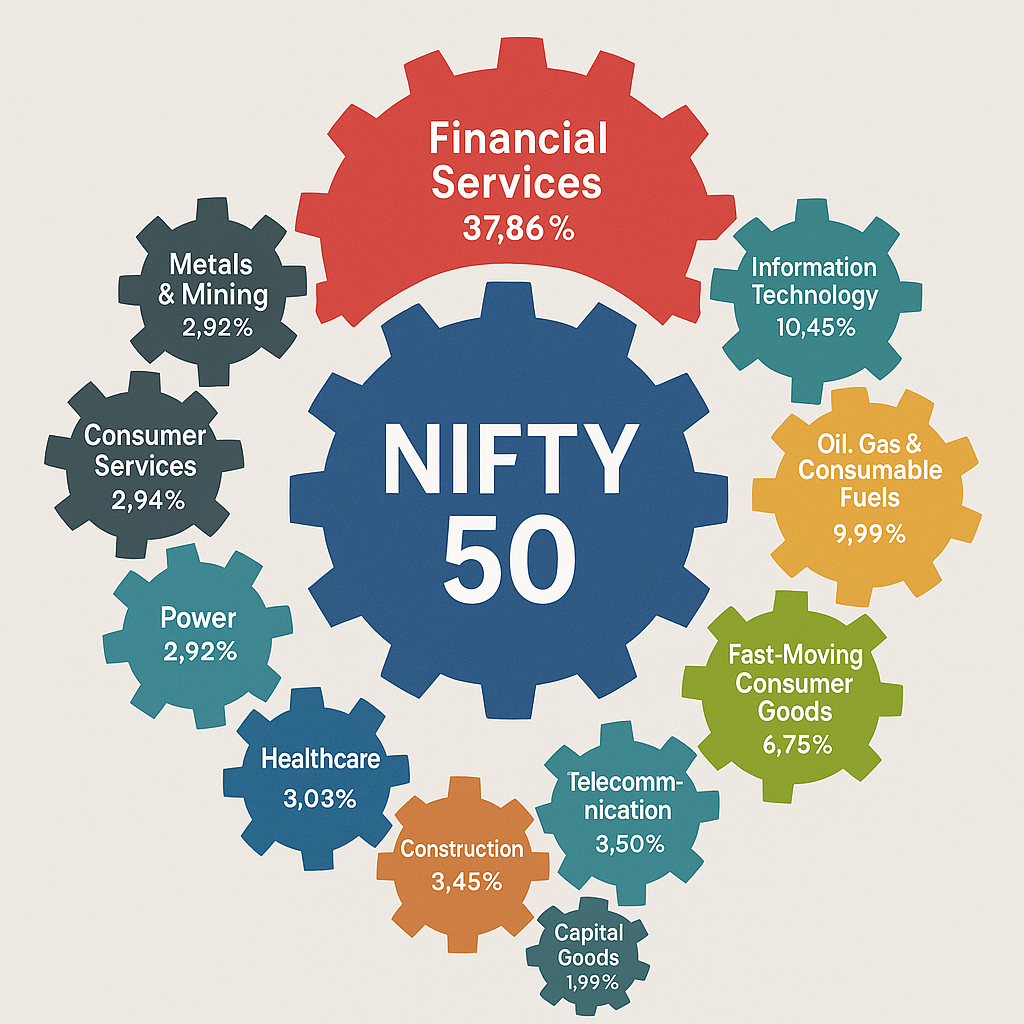
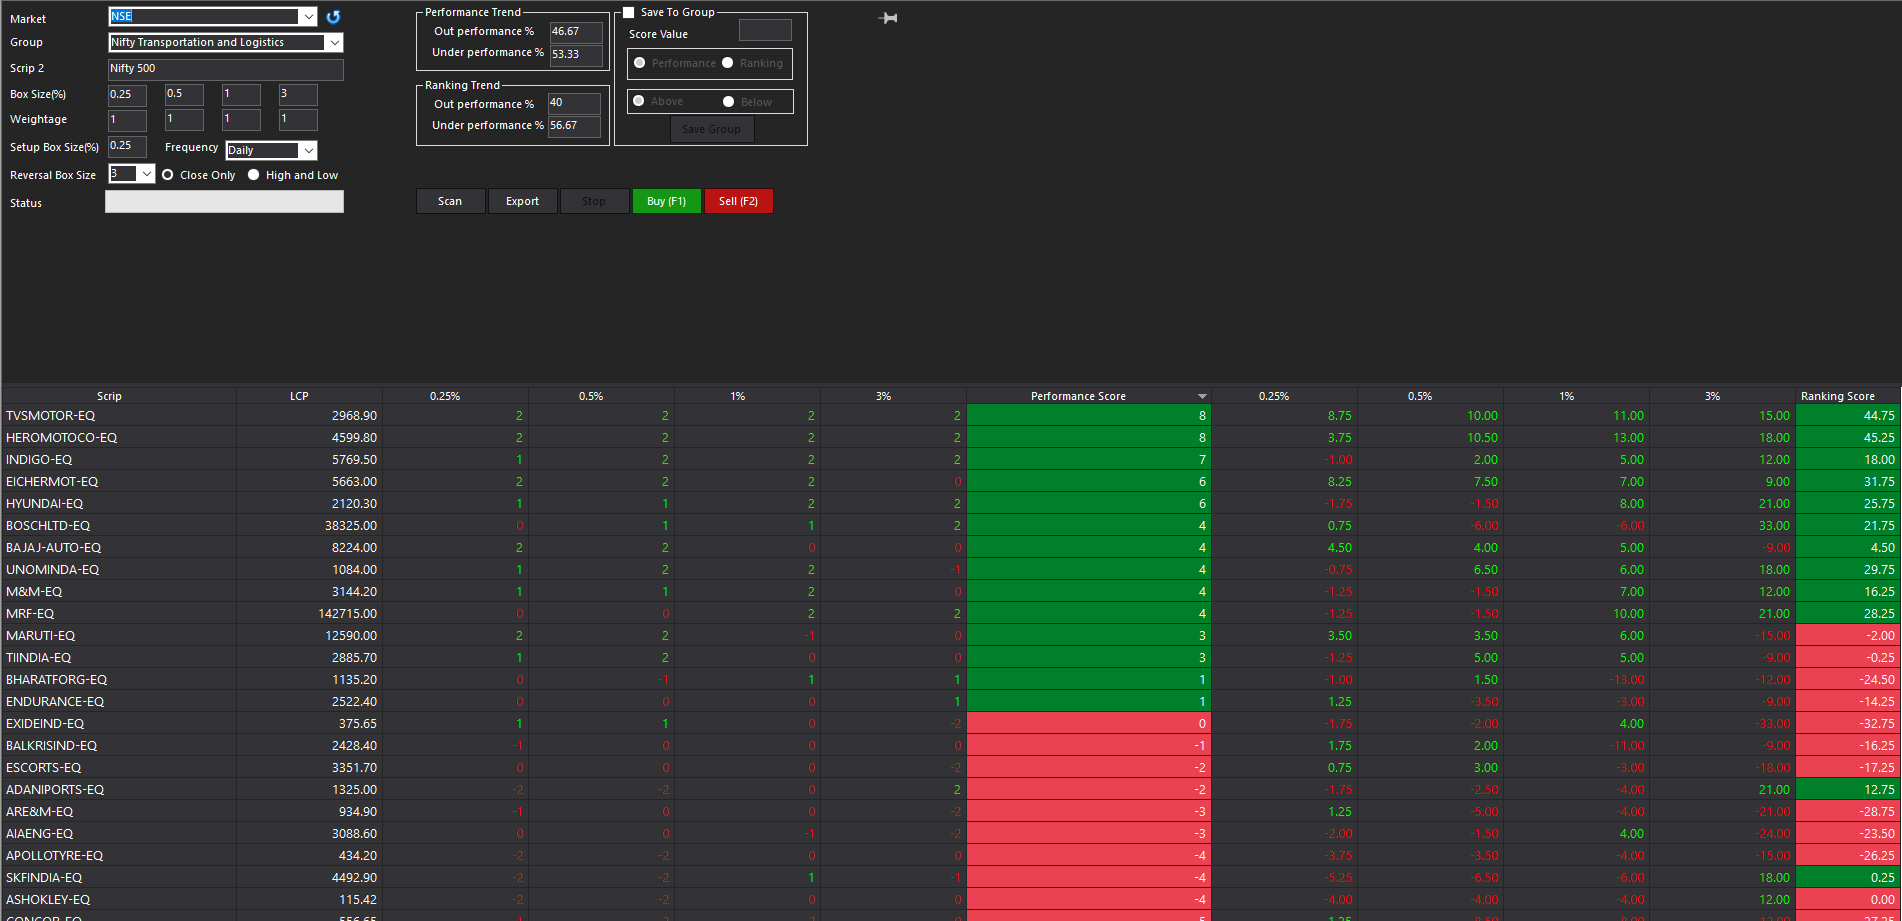
 Automobiles & Auto Components
 Fast-Moving Consumer Goods (FMCG)
 Others (Telecom, Metals, Power, etc.)

 :
: ️ → expect bullish bias.
 ️ Mixed, mild up
 ️ Sideways to mild down
 or bears
  — you can align your trades with market reality instead of trading on guesswork.
 Why You Don’t Need Separate VIX/IV Tracking
 ️ Closing Thought
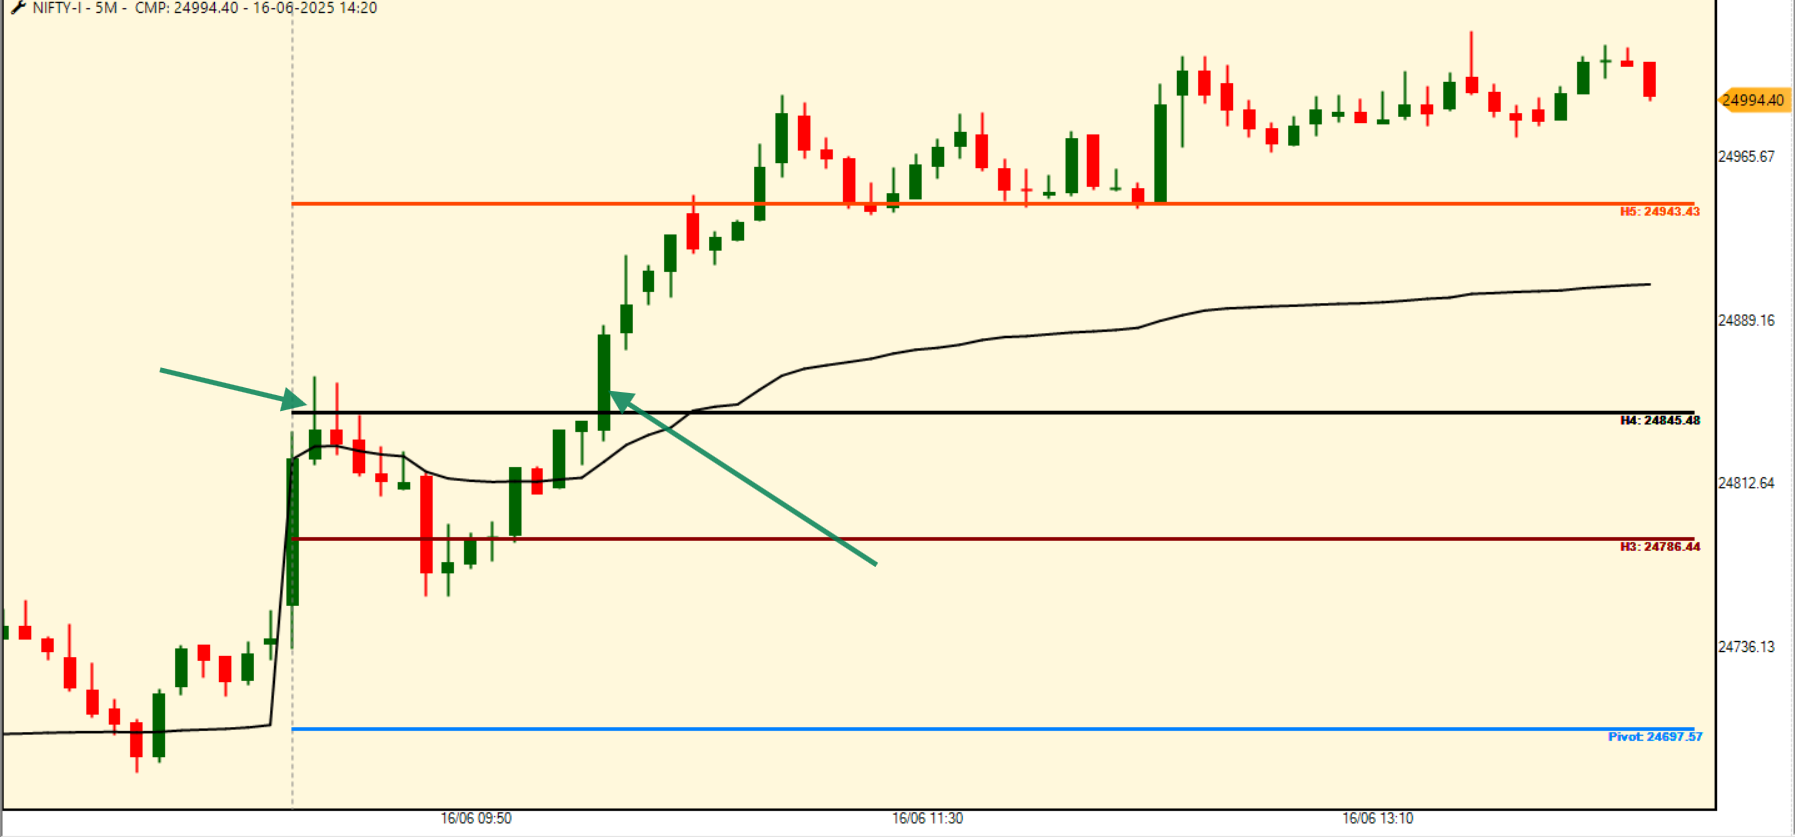
 let's see
 Beyond Premium: 21 Questions Every Short Straddle Trader Must Ask
 From the Upanishads, this line reminds us: true mastery starts within — and trading is no different.
 The Turtle’s Way in Straddle Trading: Ethics, Endurance & Why We Never Chase Jackpots


 — Never risk what you cannot replace.

 — Never exceeding set limits.
 — Journaling results and refining process.
 Introduction – When Numbers Find Their Soul
 ️
️ ️
️

 Table 2 – The Moral Greeks Compass for Straddle Traders
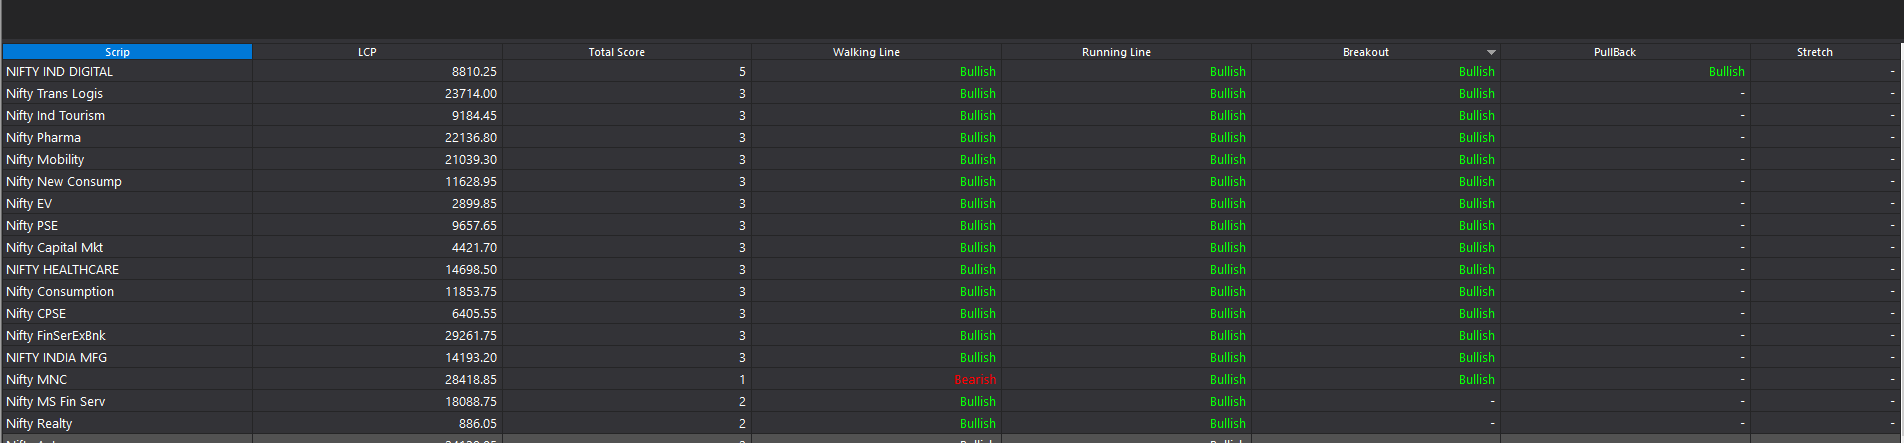
 Why Every Intraday Trader Needs Breadth
 Use: Confirm if index moves have broad support.
 Intraday Breadth Quick Reference (Table)
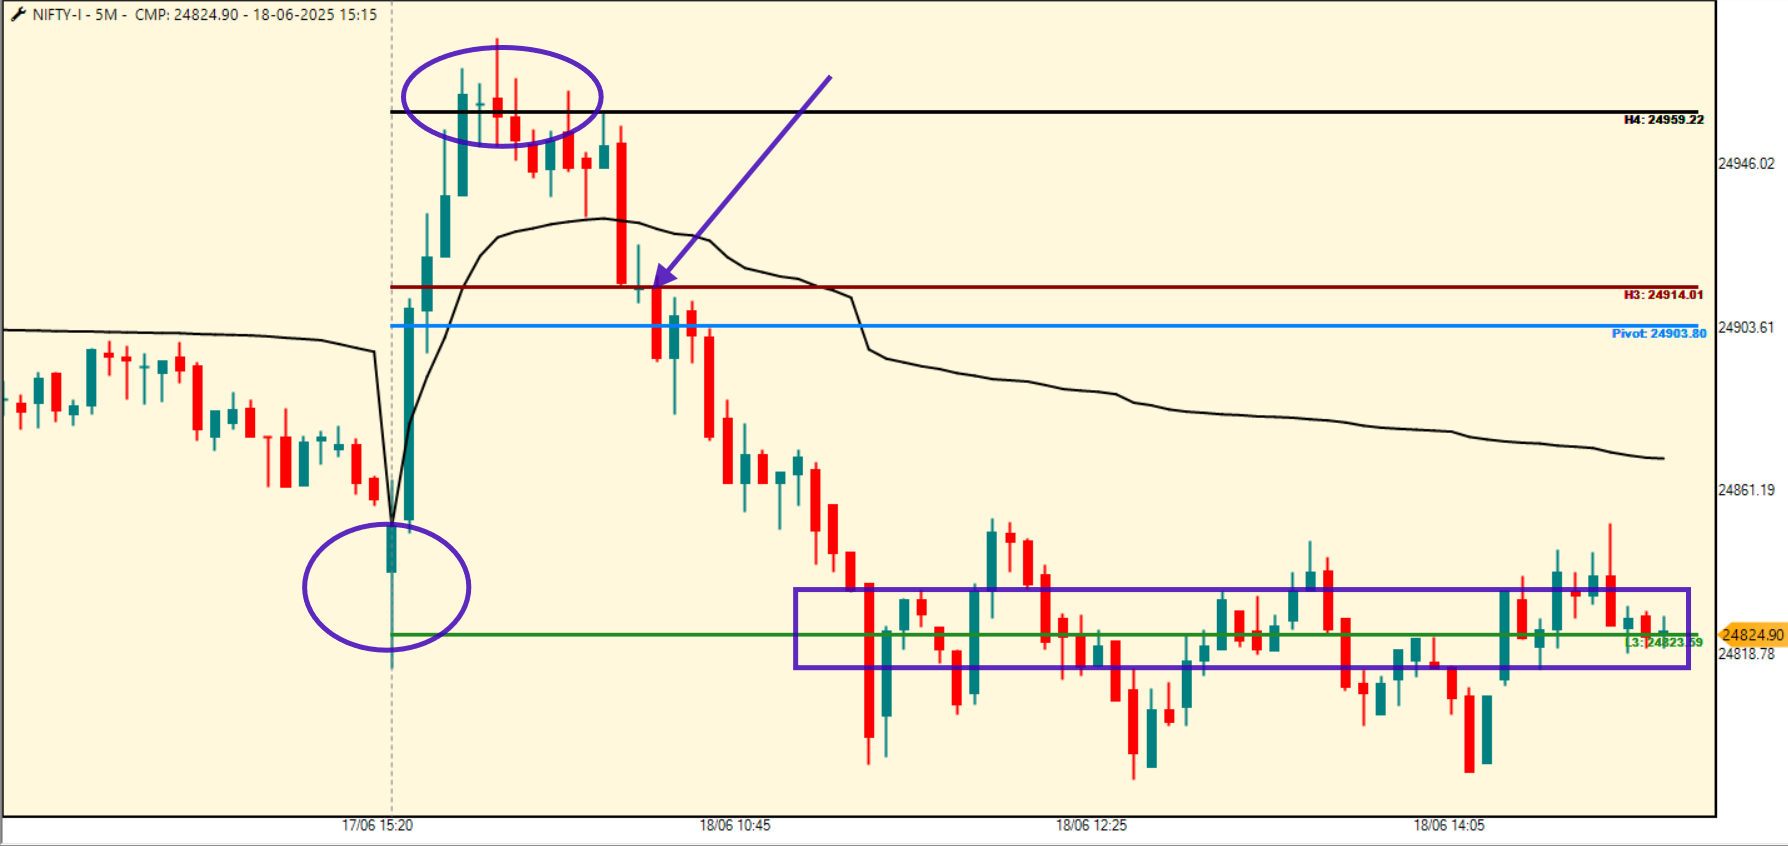
 Divergent Structure = Dual Trade Opportunity
 Conclusion:
 “Exit: A War Between Structure and Surrender”

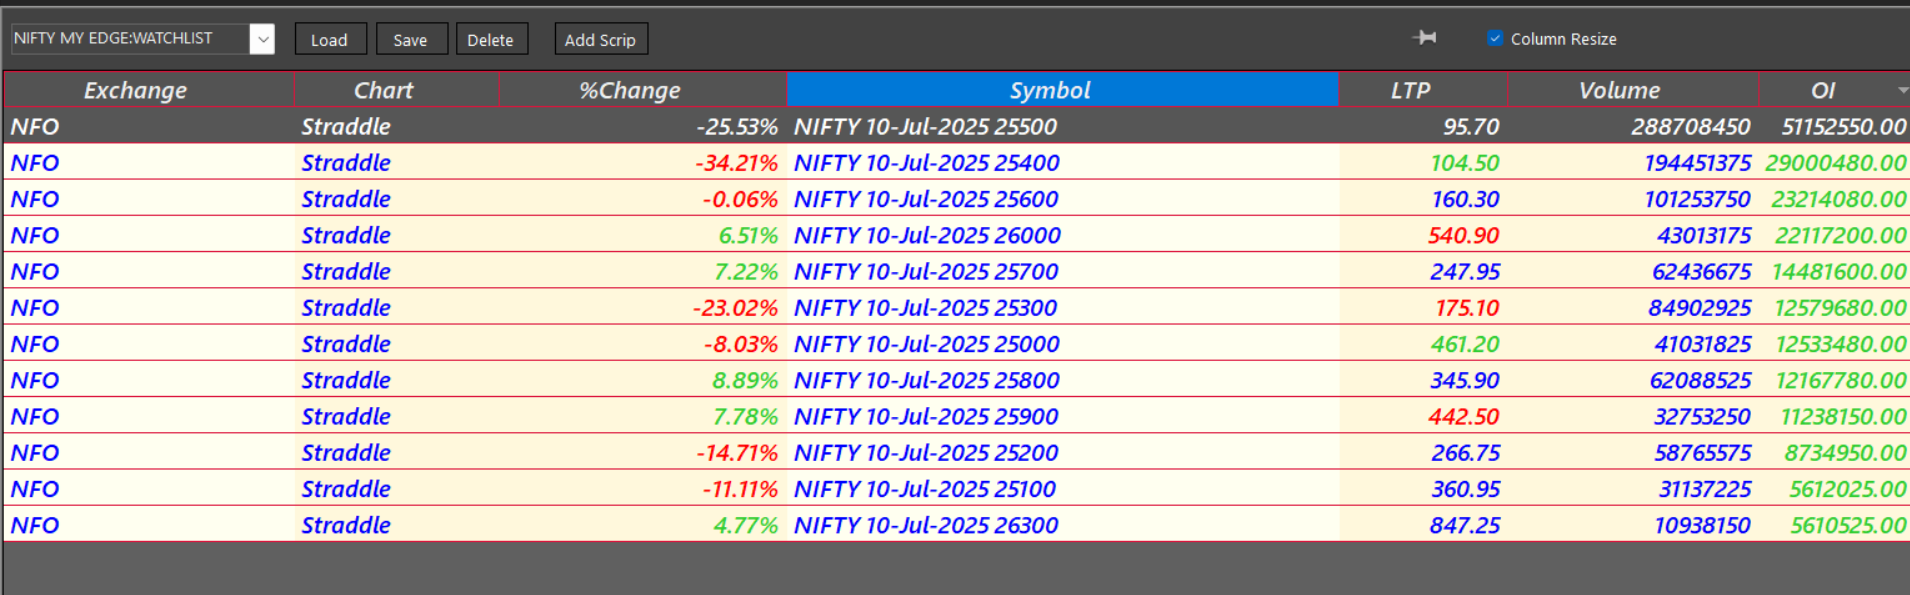
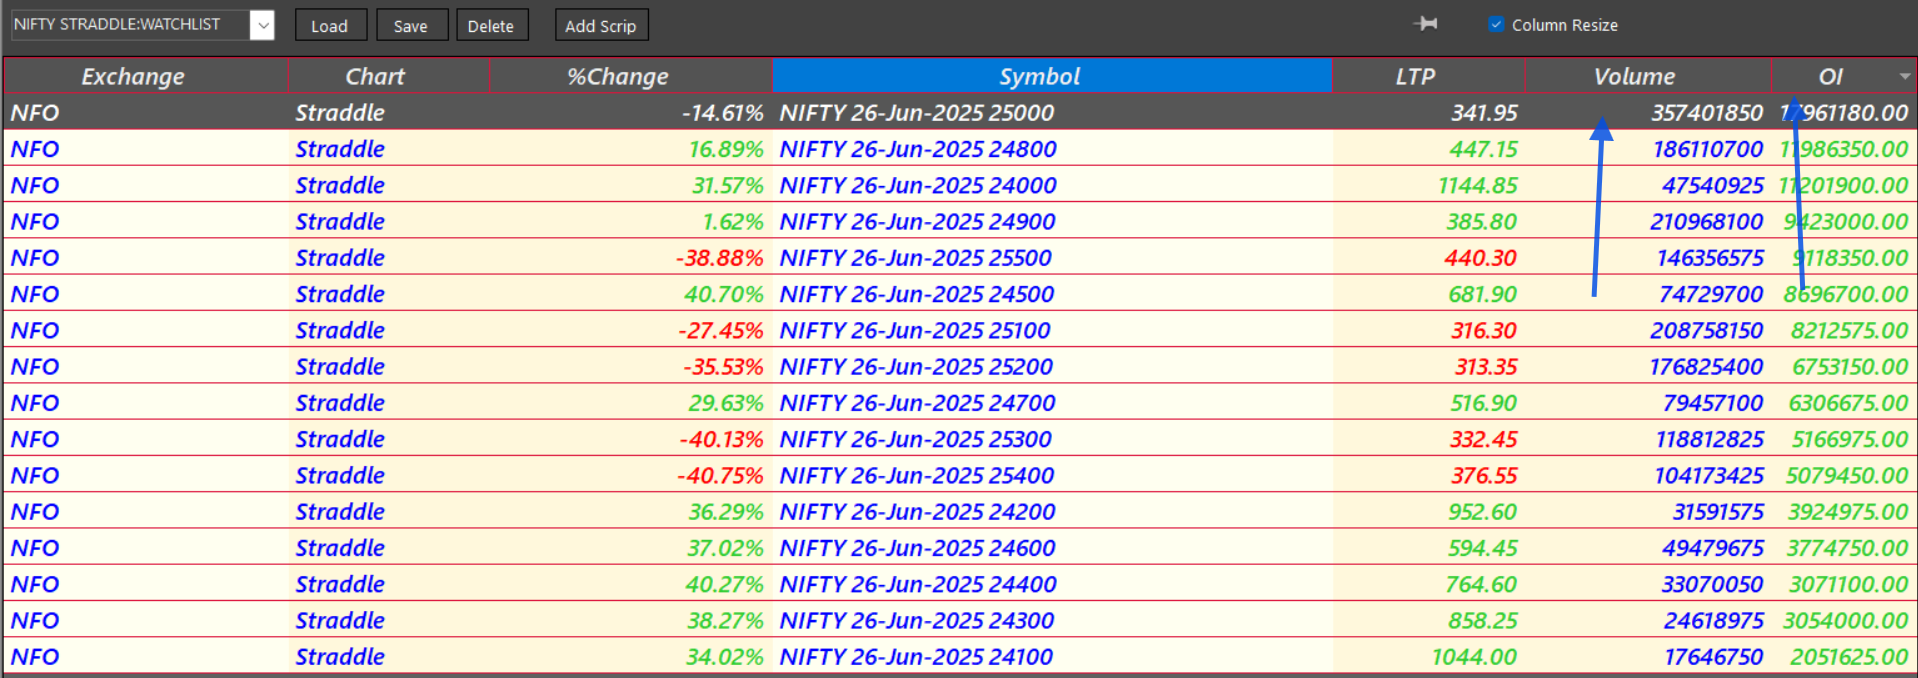
 whenever preivious day highest oi straddle no ft and holding vwap mostly market remain dynamic any side ..i cover a article also on it
 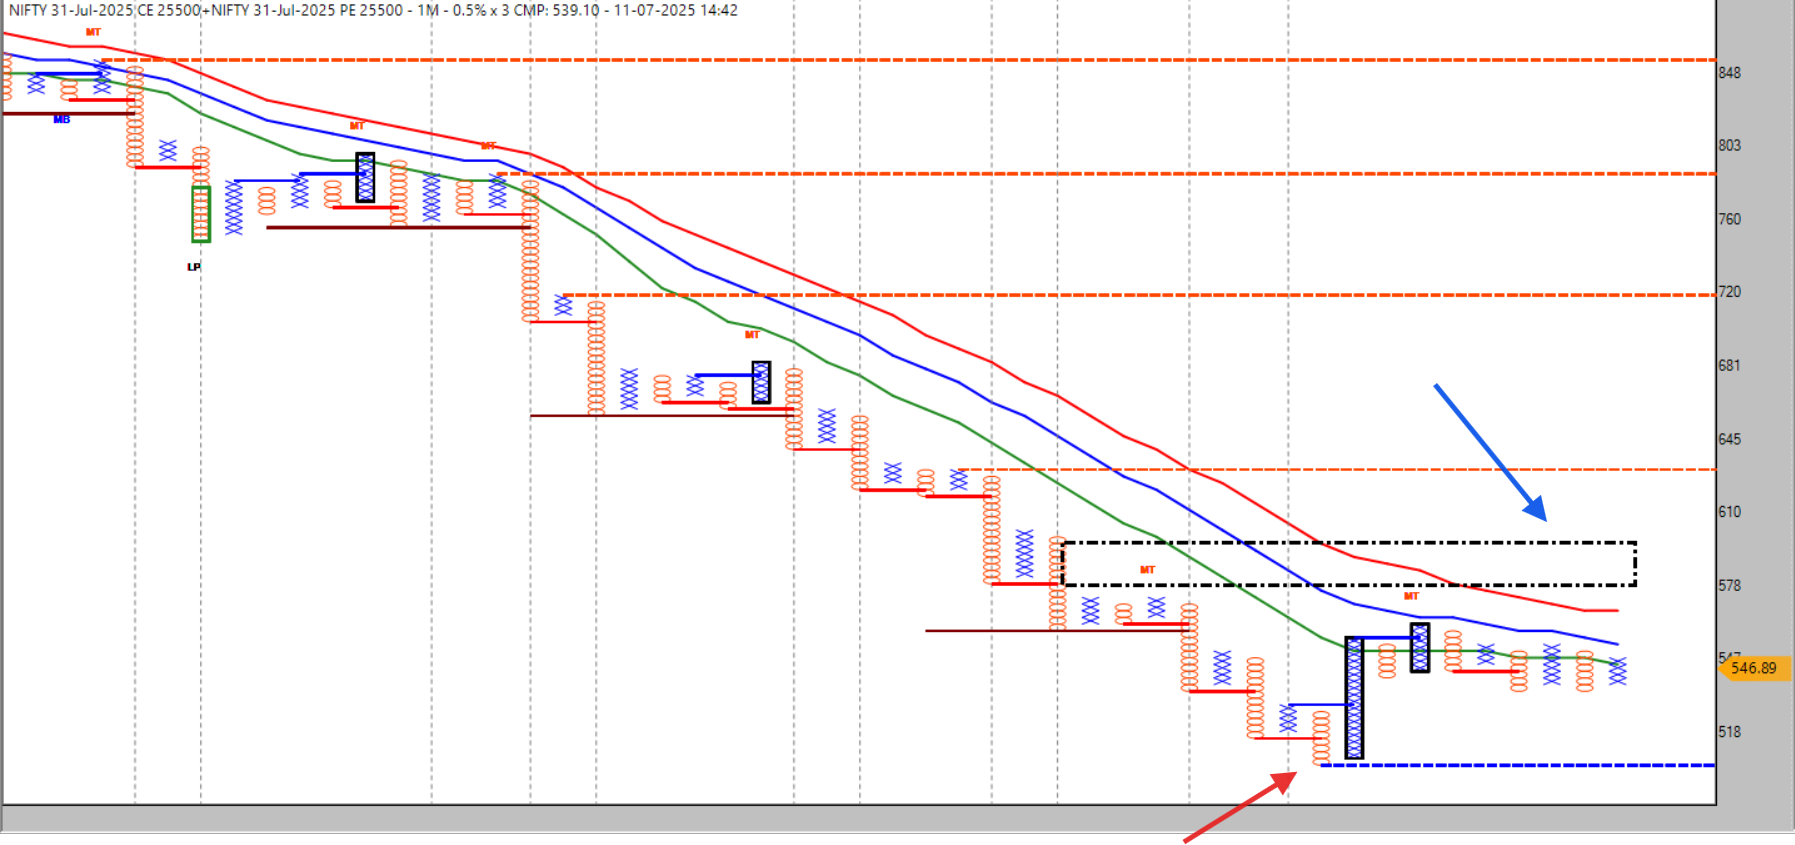 above 600 with folow through , nifty can be good directional smile
 & below 500 again directional pain
 ( enjoy theta eating )
 What is Discretionary Trading?
 ️ What is System Trading?
 ️ Dependent on your mental state
 Inflexible during regime shifts
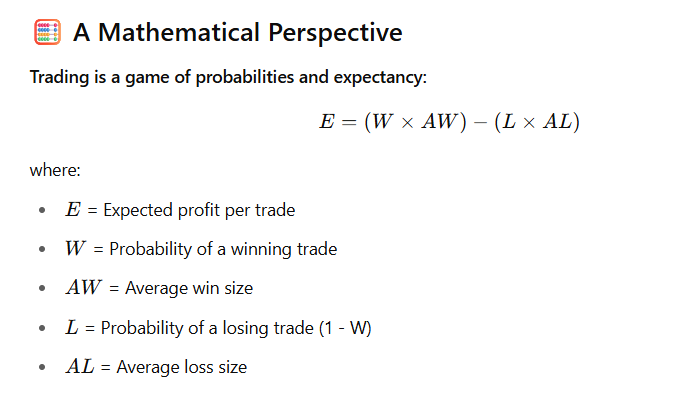
 Conclusion: Align Your Method with Your Mindset
 By Santanu Bez
 Plus both the Call and Put at the strike price nearest to the current market price for the weekly expiry.
 ️ Practical Ethical Trading Application
 Zero to Hero? Wait! Read This Before Expiry Gamble.
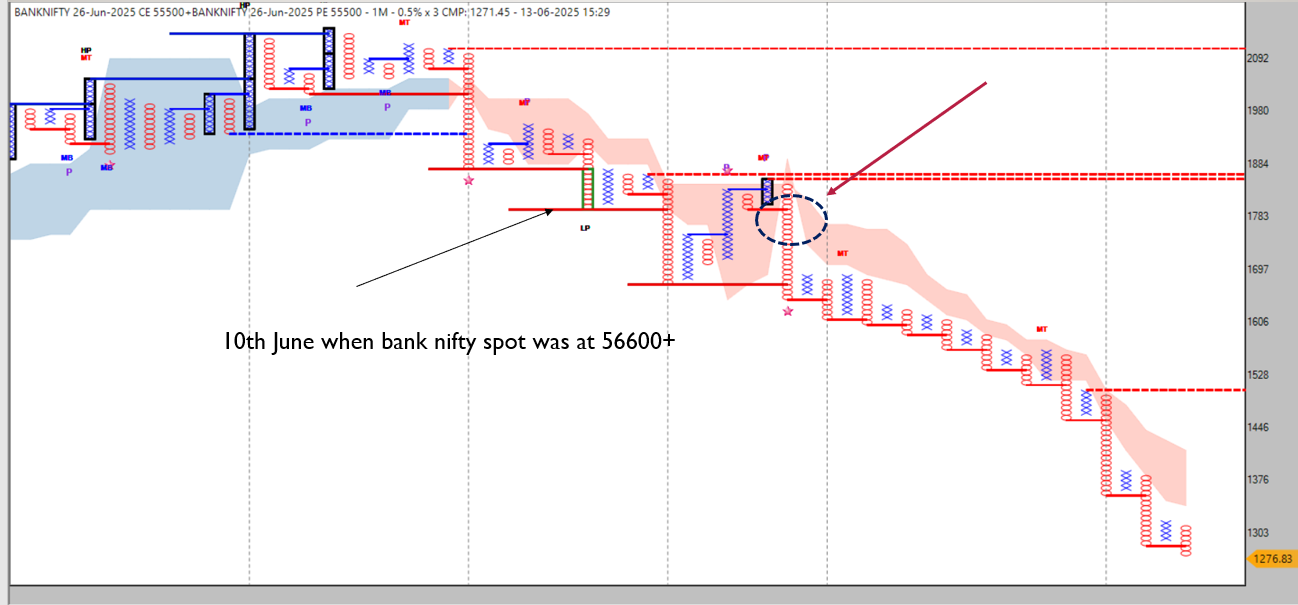
 ️ Disclaimer:
 Learn Directly from AP Sir
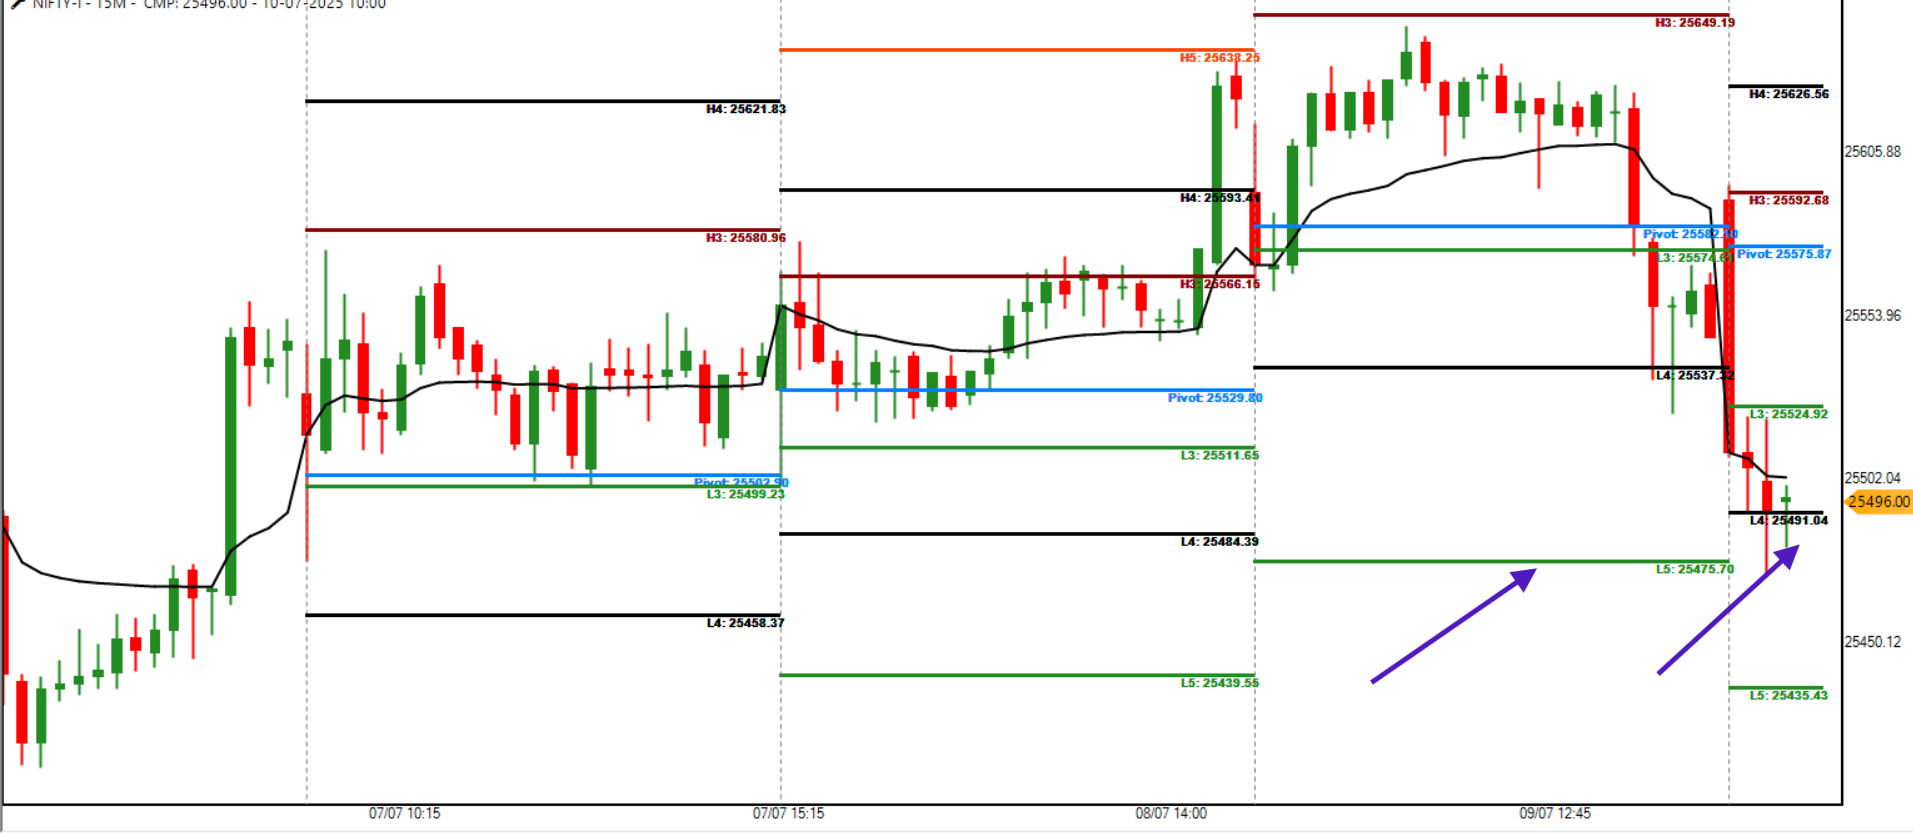
 Master Camarilla Pivot Points for Intraday Trading Success – AP Sir
 Conclusion: Turning Exhaustion Into Opportunity
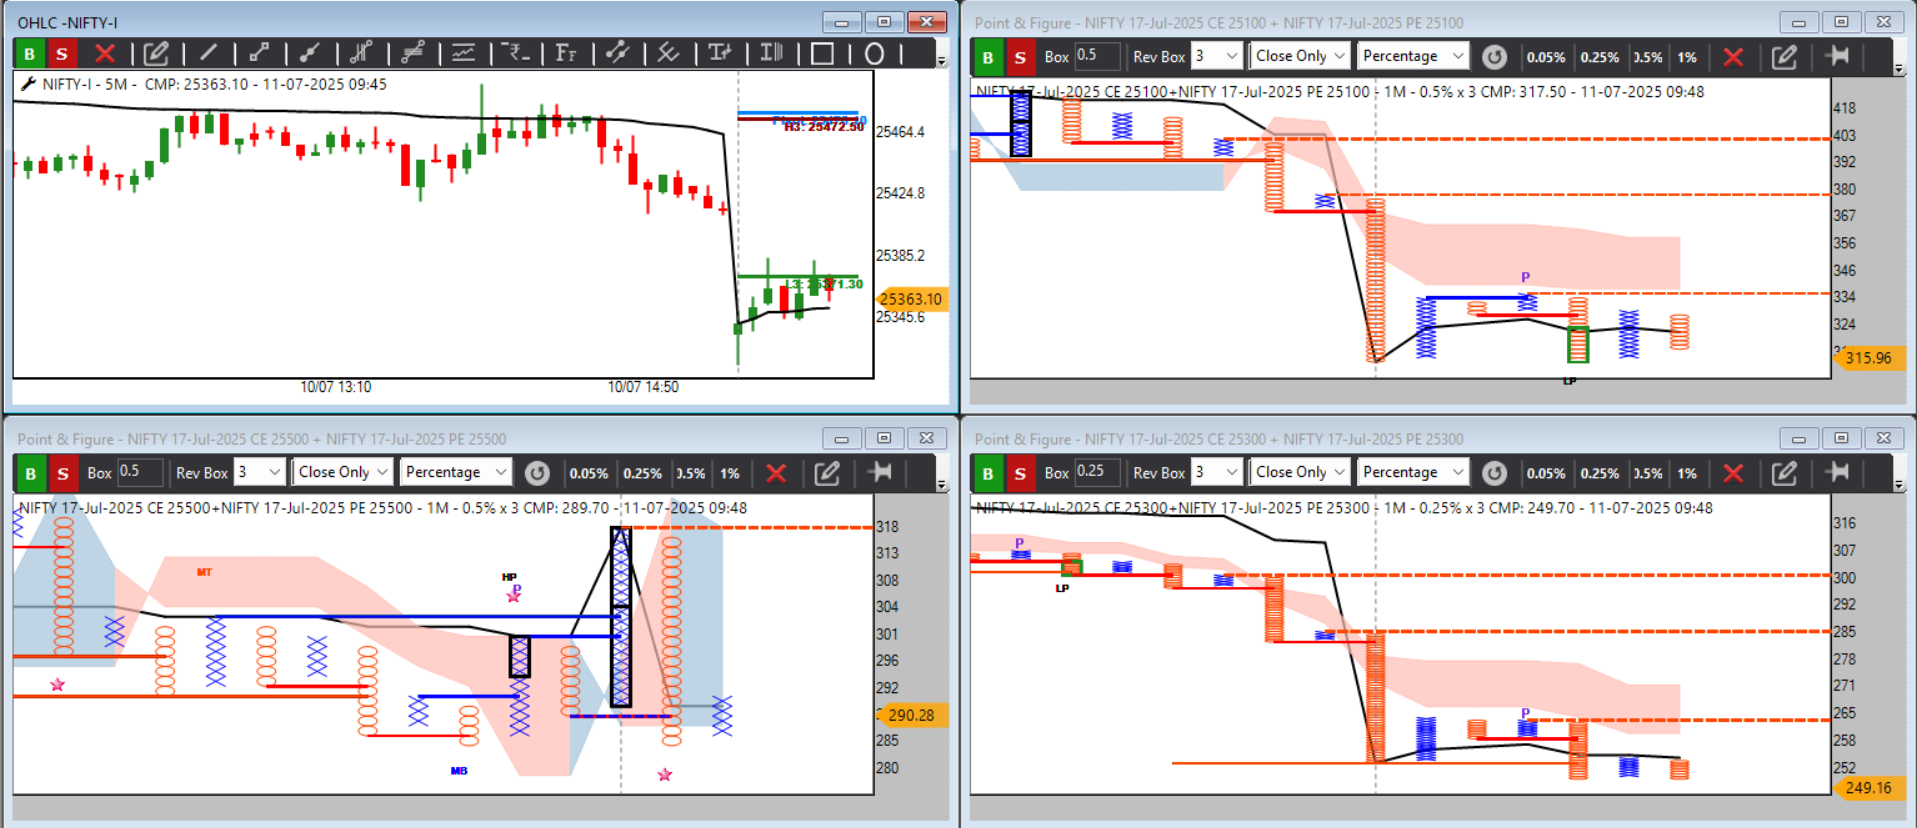 bettter wait , more 15-20 min
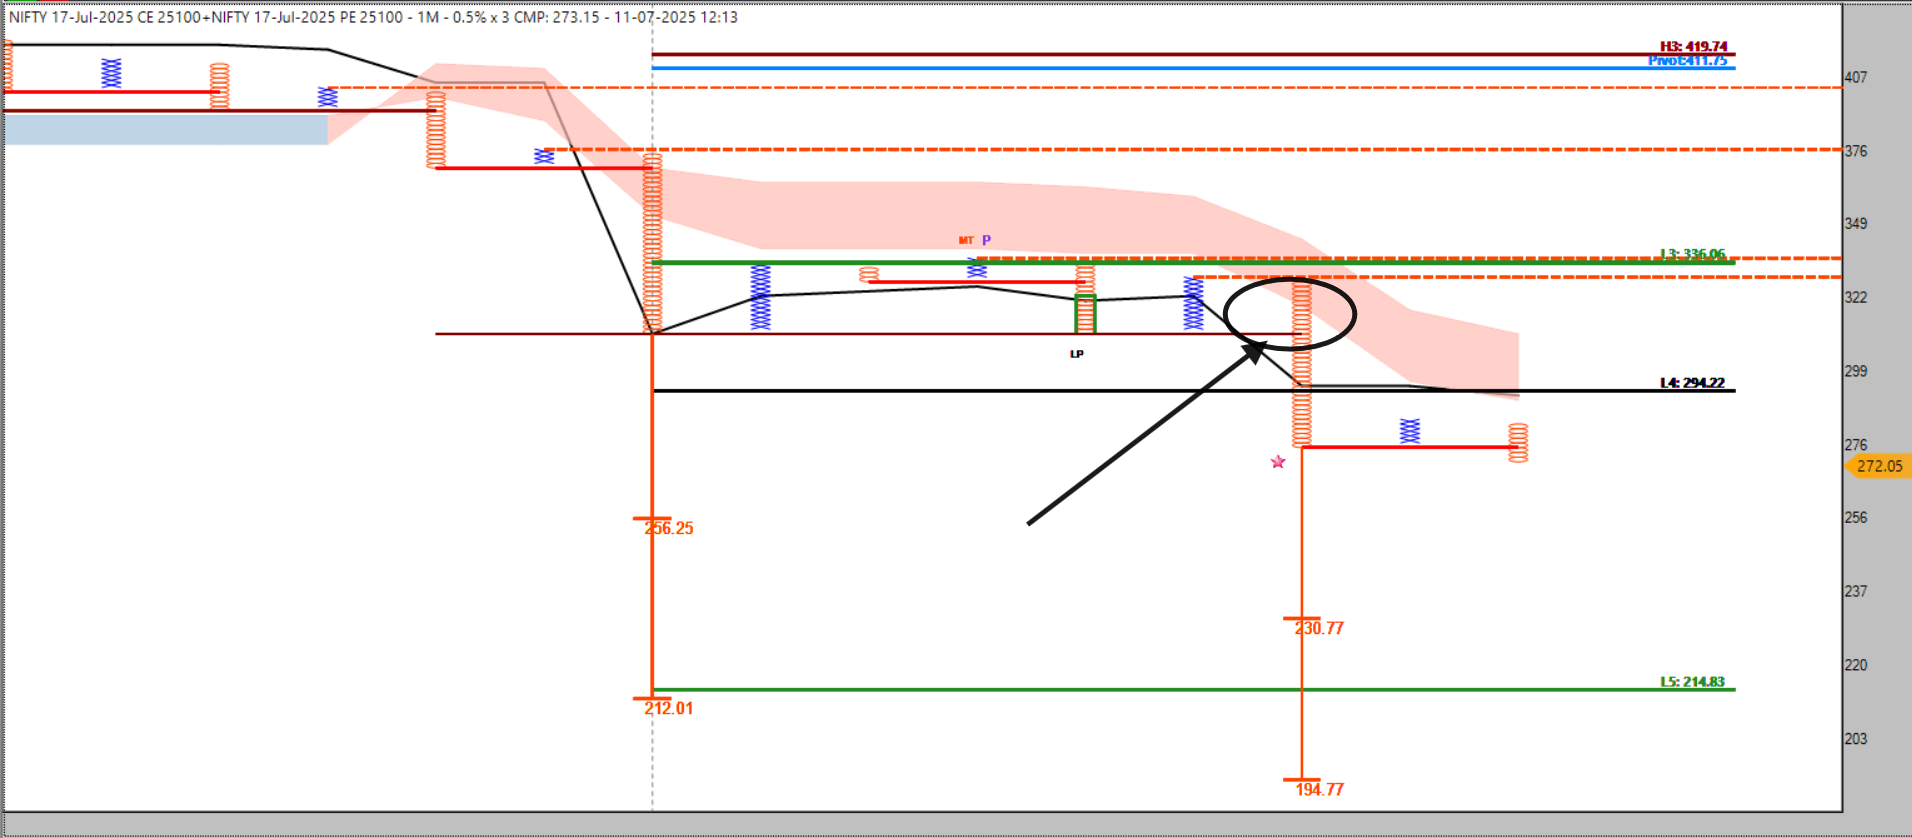


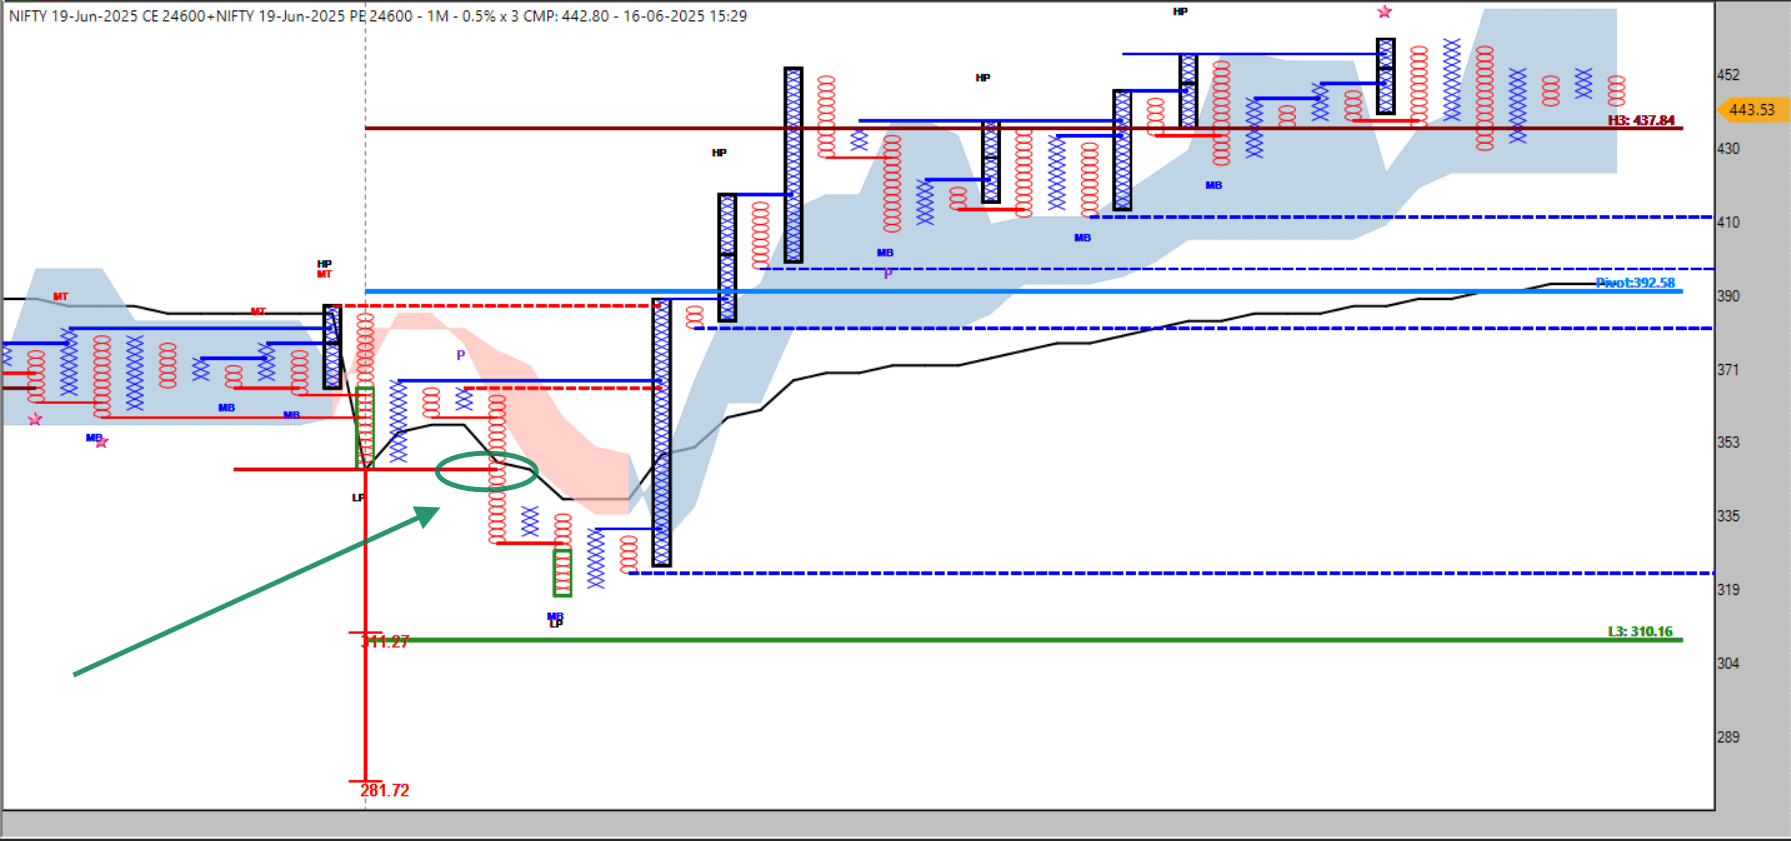
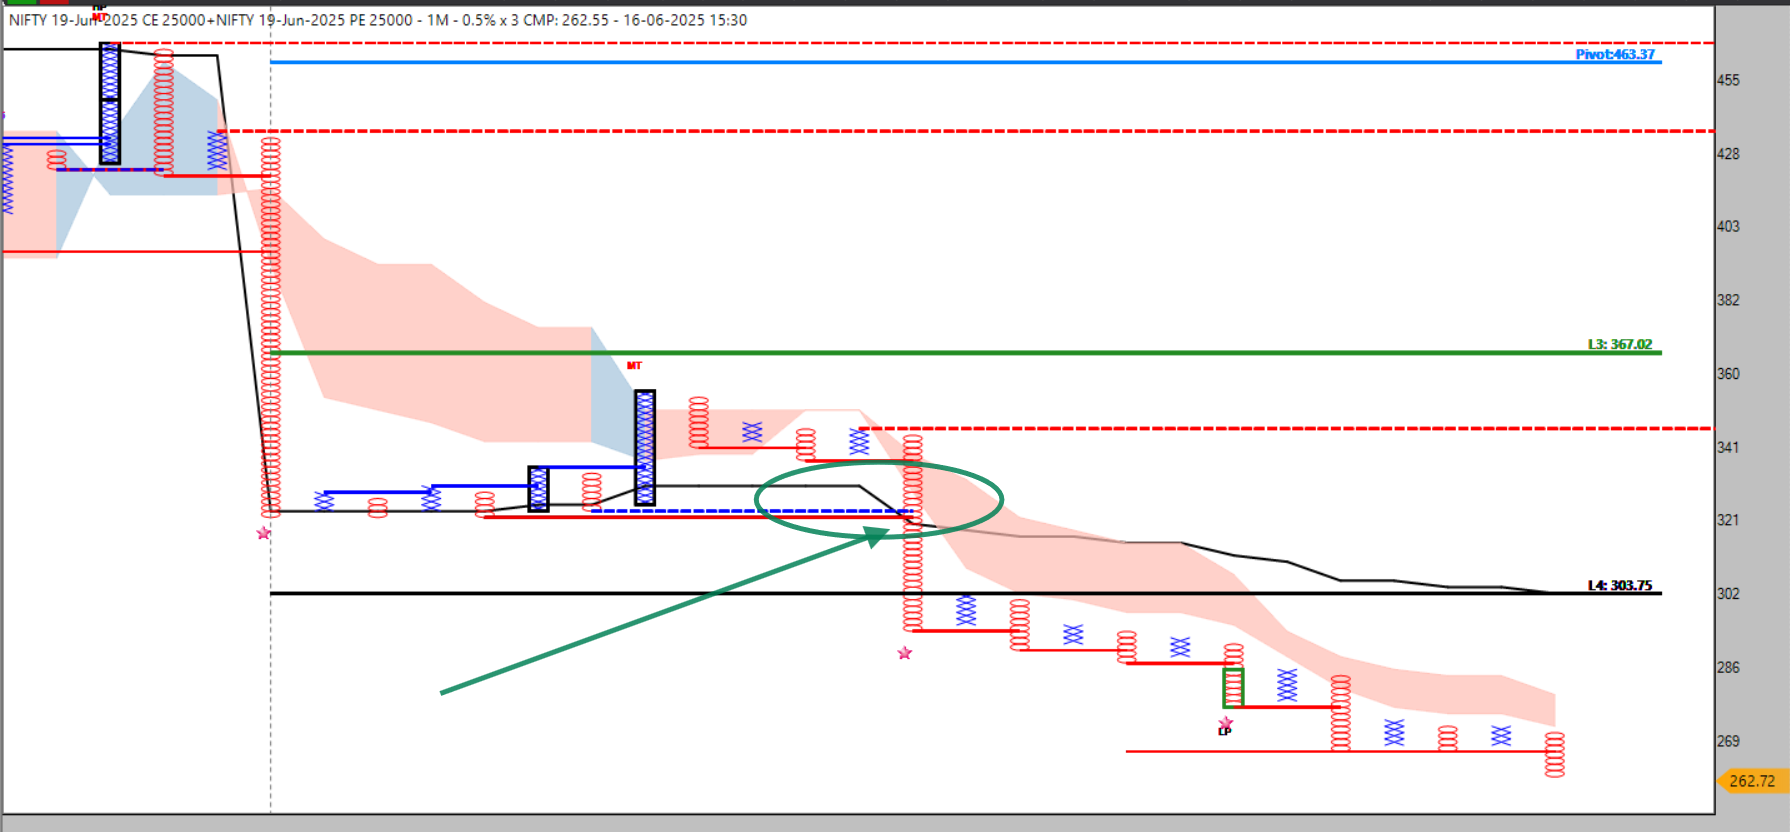
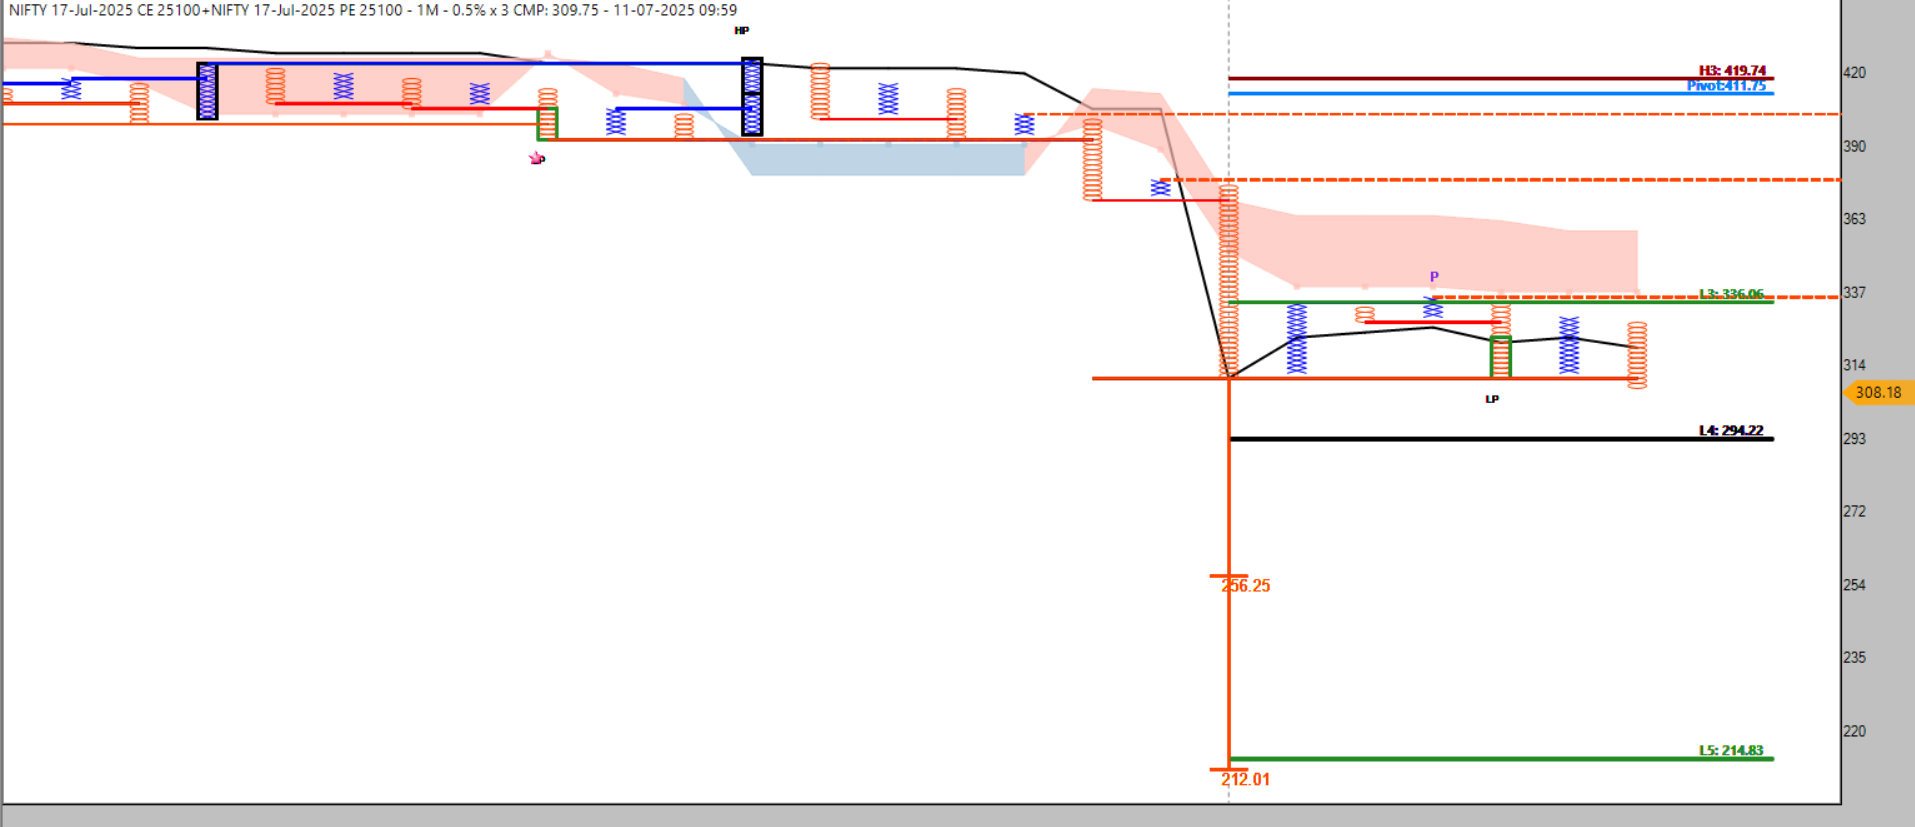
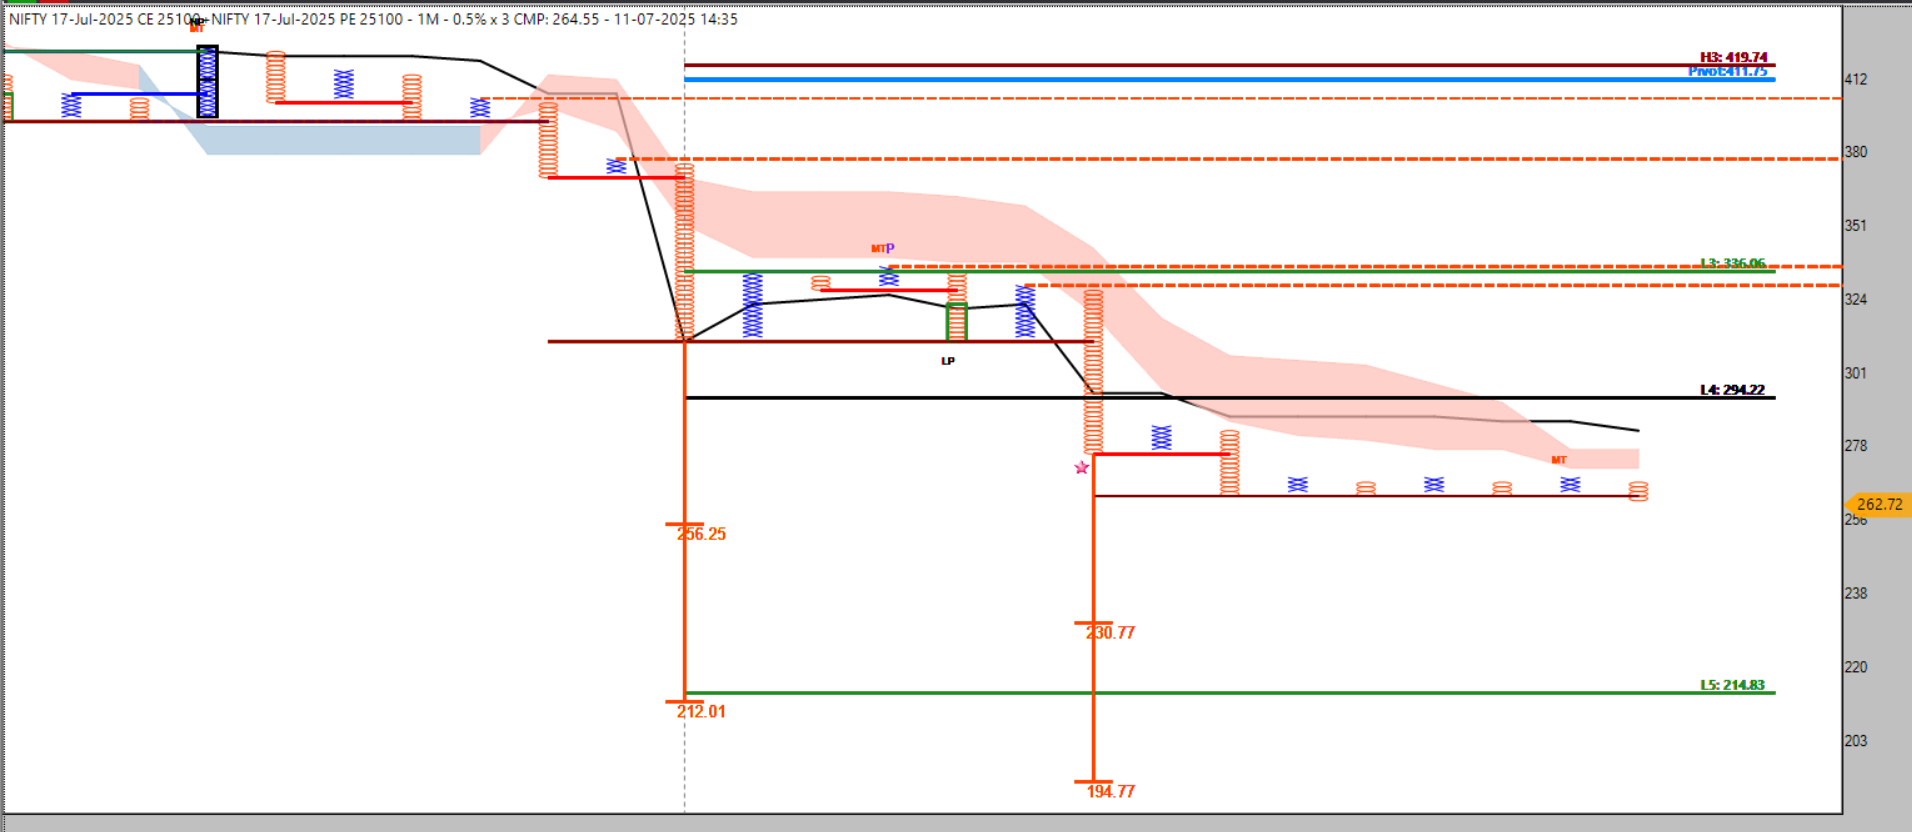 day end closed rest 20% at 265 . 309 to first book at 277 (80%) & rest now ( 20%) .
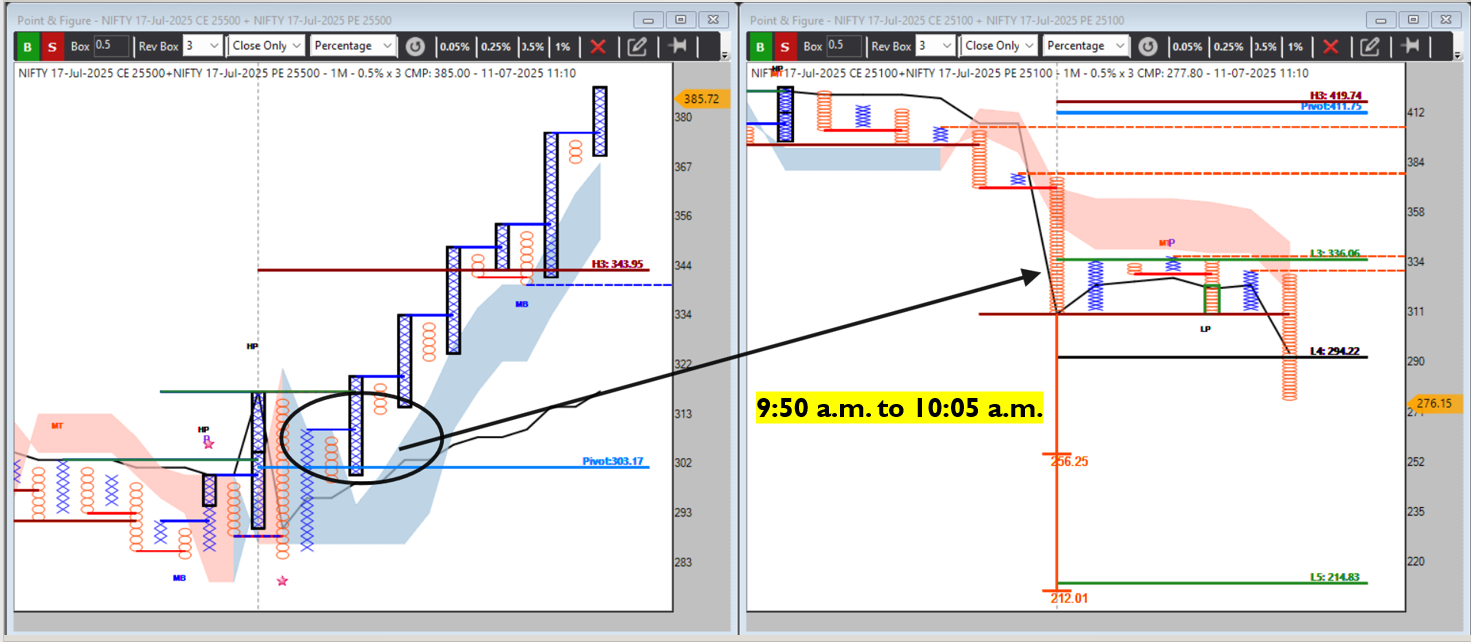
 done 30 point book 80% position , rest c2c if 256 comes good then
 still 20 point
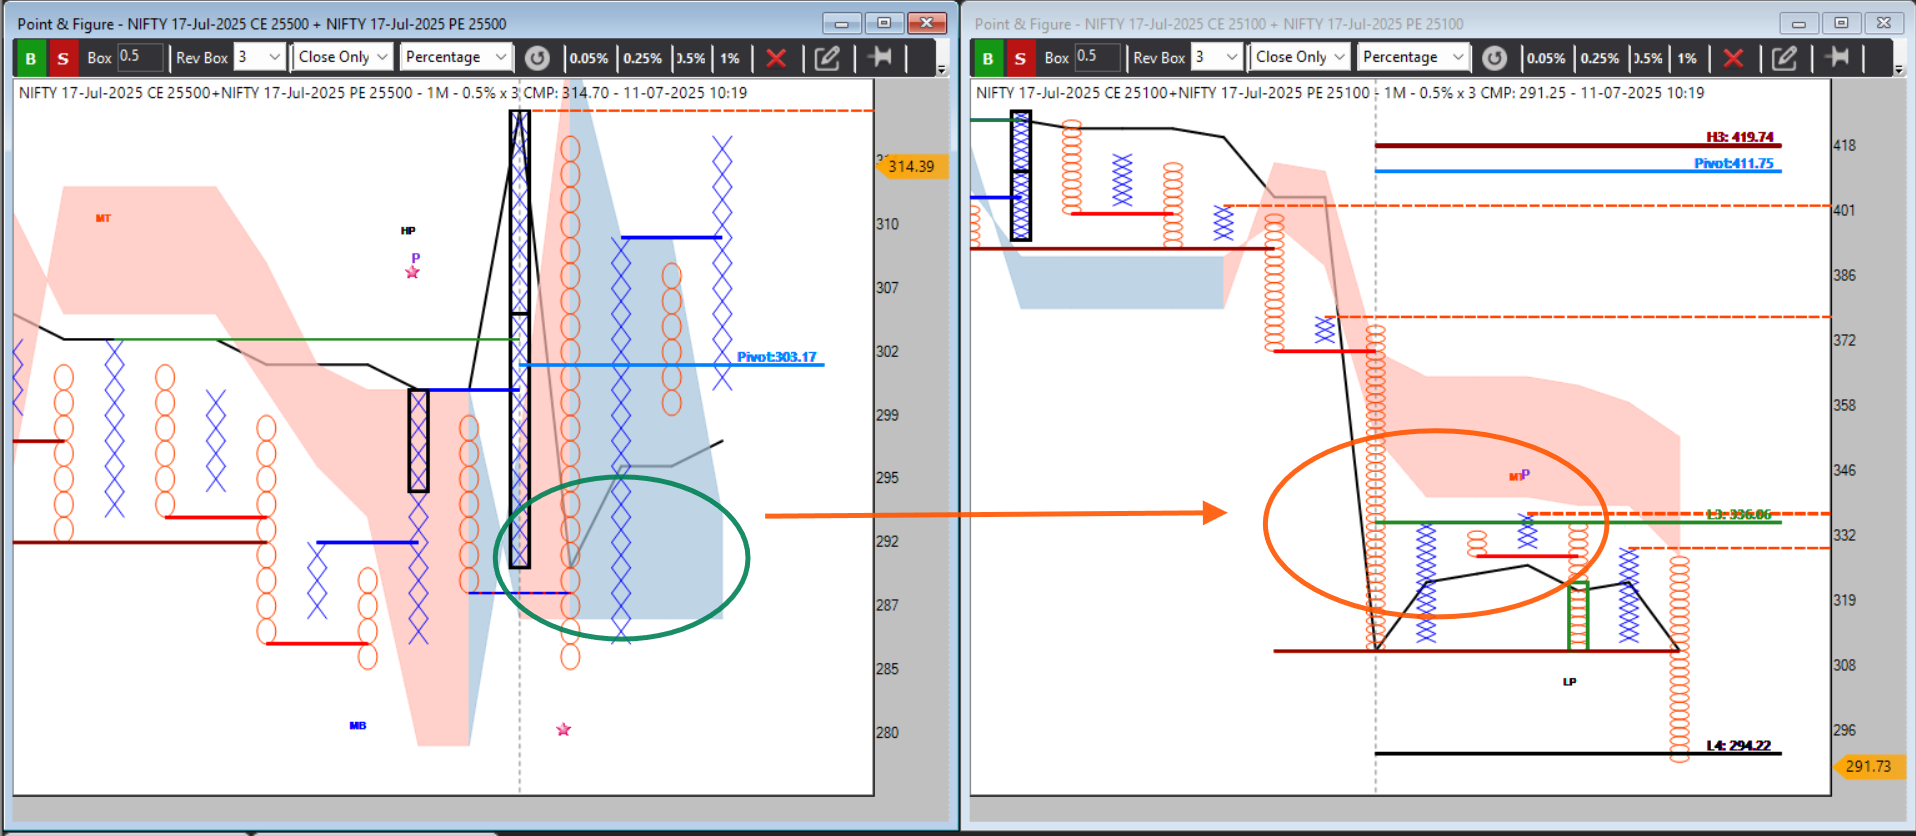 selection logic d-smart back up, here is link in details on it
 The Spartan Dilemma in Trading