SANTANU BEZ
Pro User
All Replies
-
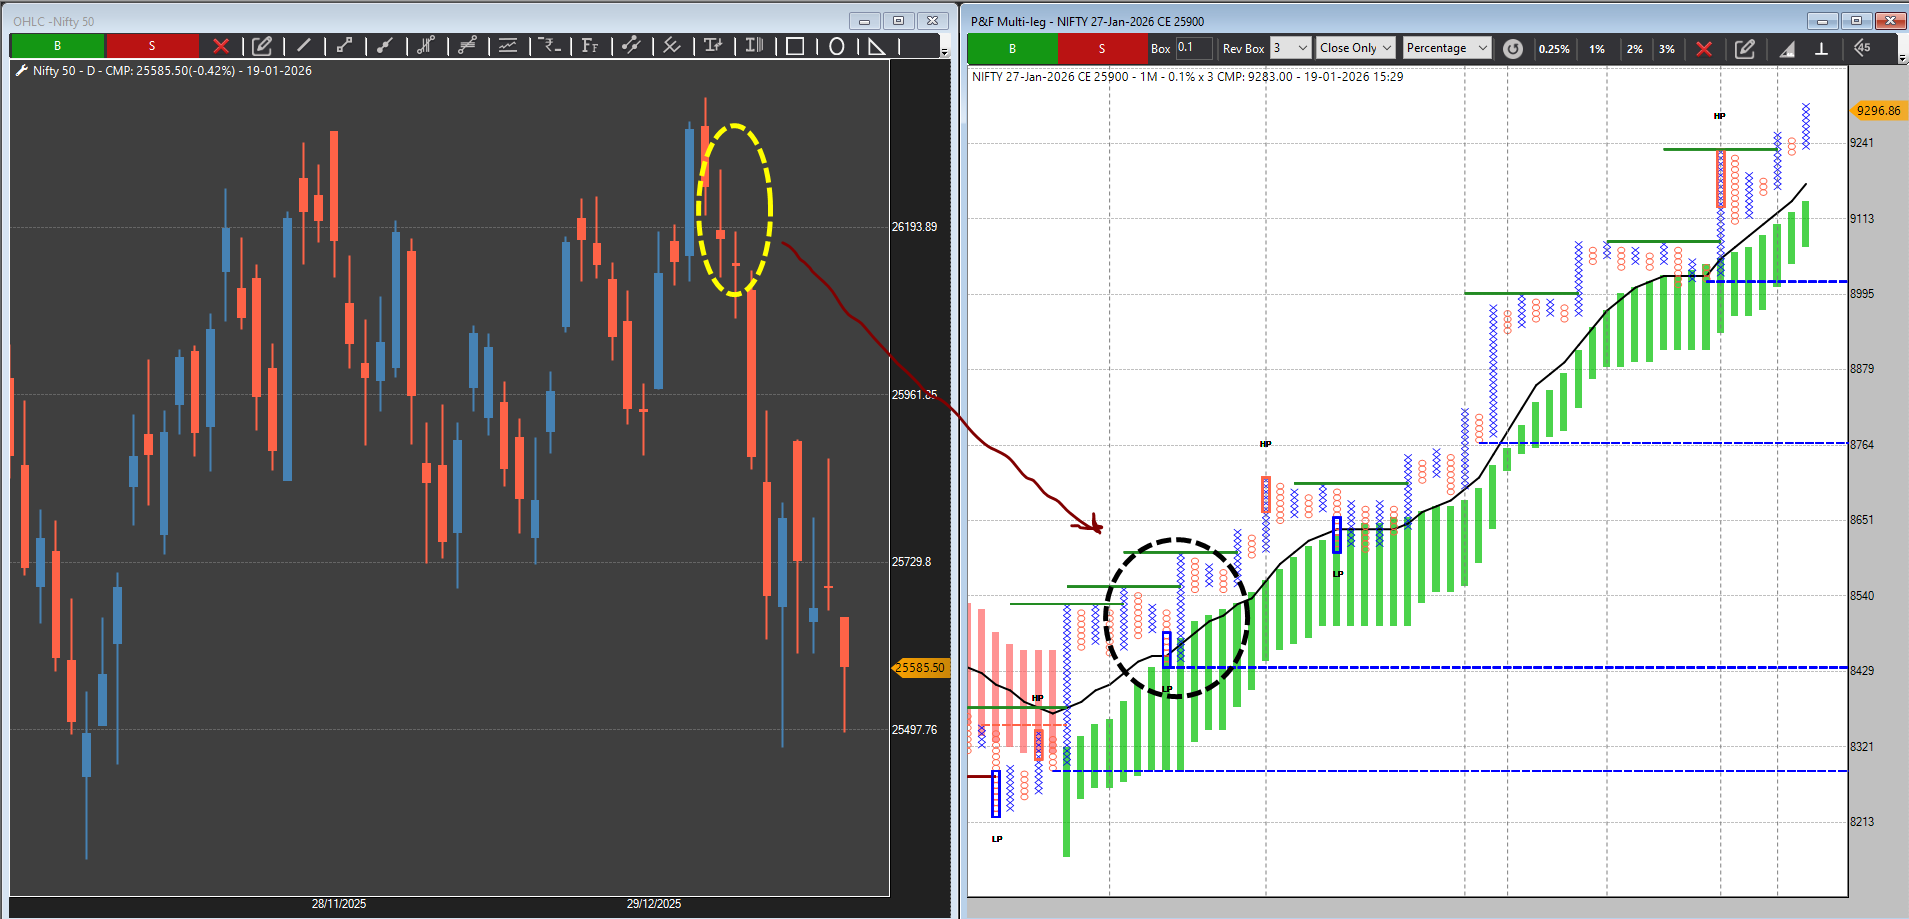
🧱 All-Short, Multi-Leg Engineering at the Top
How the 25500–25900 Zone Was Sold, Not Defended
🧾 Abstract
This analysis documents a market phase where NIFTY hovered near its highs, while the entire option structure between 25500 and 25900 was constructed as an all-short, multi-leg inventory. What appeared on the index as stability was, in reality, a professionally engineered premium-selling zone, designed to suppress expansion, monetize time, and quietly prepare for repricing.
This was not selective hedging.
This was deliberate, layered short positioning across strikes.
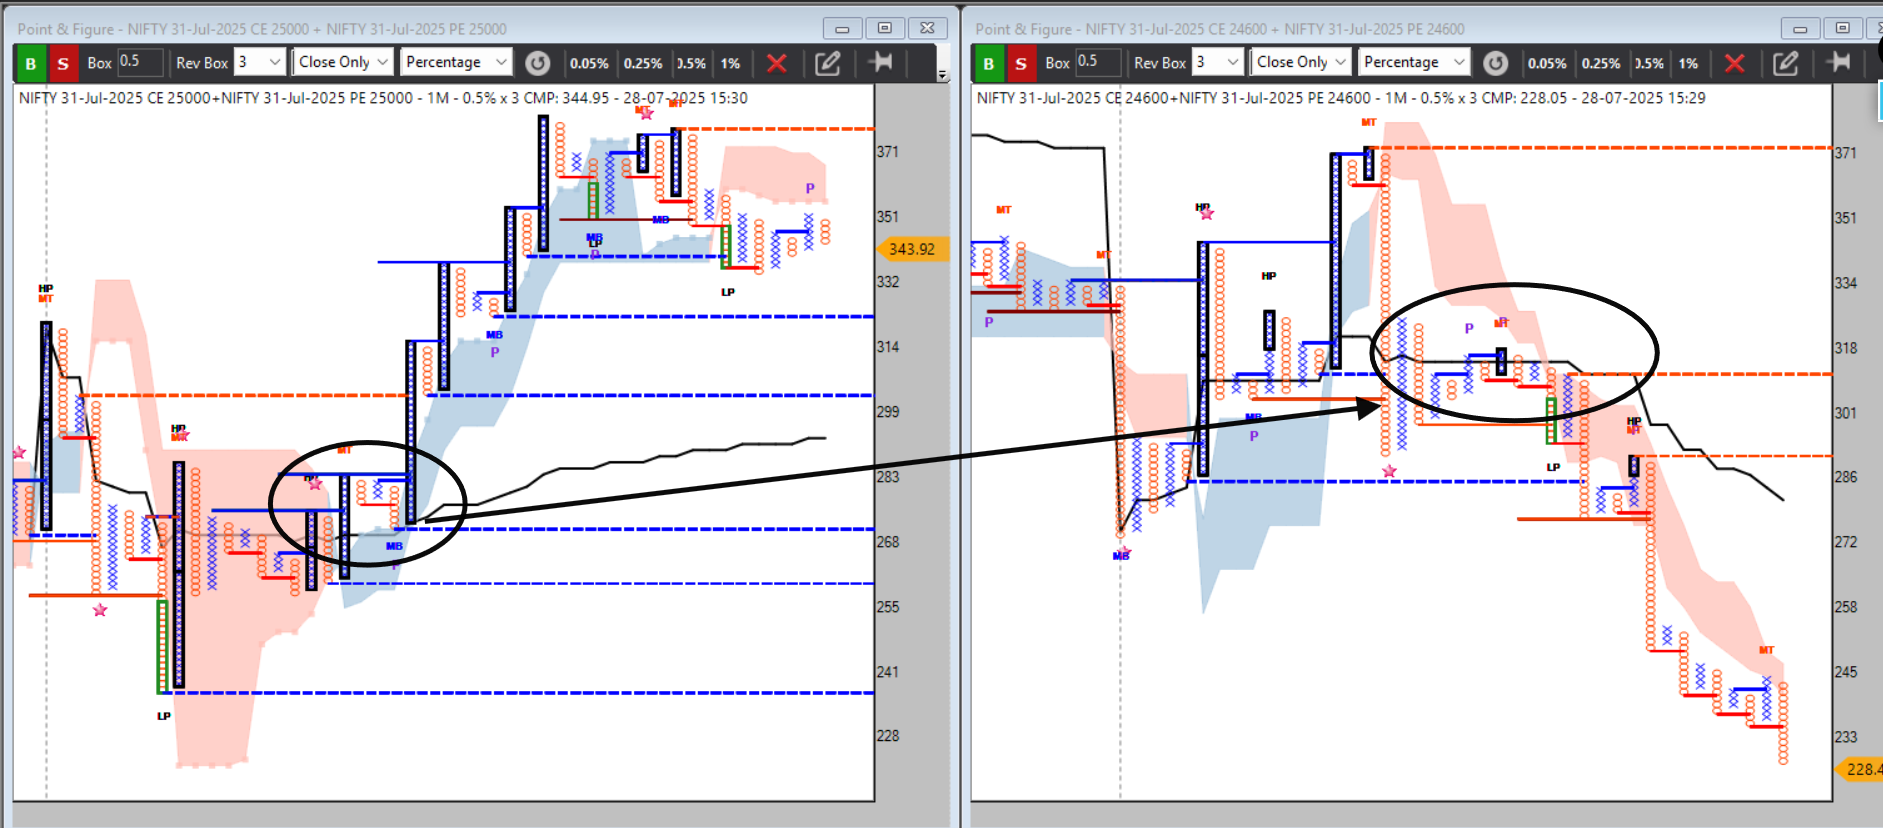
1️⃣ The First Critical Truth: This Was an ALL-Short Structure
Let us remove ambiguity at the outset:
 Every visible leg in the 25500–25900 band was short.
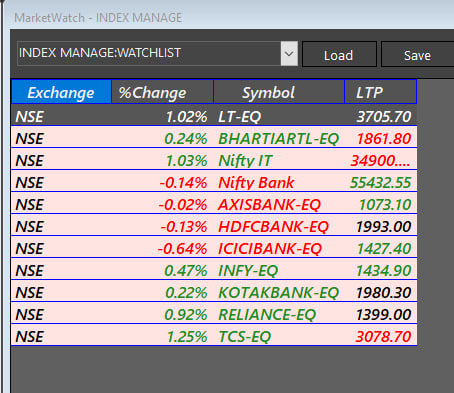
The right-hand inventory panel confirms:
- Multiple Call strikes shorted simultaneously
- No dominant long call exposure
- No aggressive upside hedge
- Inventory spread intentionally, not reactively
This immediately invalidates any bullish interpretation.
This was not “resistance forming.”
This was resistance being sold. 🧾
2️⃣ Why a Single-Strike View Completely Misses the Point
Looking at only one strike (e.g., 25500 CE) creates a false narrative:
- “This call failed”
- “That strike rejected price”
In reality:
- The entire range was pre-sold
- Each strike acted as a layer, not a bet
- Risk was distributed horizontally, not vertically
 Professionals do not guess direction.
They define boundaries.
3️⃣ The 25500–25900 Band: A Monetization Corridor
This zone was not random. It was a designed operating corridor.
Evidence:
- Repeated price rotation inside the band

- Horizontal option resistance holding over time

- Premium continuously harvested across legs

- Zero urgency to push price higher

In an all-short structure:
- Price must not expand
- Volatility must stay contained
- Time must do the work
Key insight:
🧠 When an entire range is shorted, the goal is not accuracy — it is inevitability.
4️⃣ Why the Index Still Looked “Strong” (and That Was the Trap)
On the NIFTY daily chart:
- Overlapping candles
 ️
️ - No immediate breakdown
- Minor higher highs still printing
This visual calm is intentional.
Meanwhile, the option structure was doing the opposite:
- Every rally sold into 🪜
- Every pause monetized
- Every hour benefiting sellers

Buyers paid for hope.
Sellers were paid for time.Key insight:
 ️ When price looks calm at the top, it is often because professionals have already neutralized upside risk.
5️⃣ Multi-Leg Shorting = Control, Not Opinion
Single-leg shorts can be trades.
Multi-leg shorts are policy.Your chart shows:
- Confidence (no panic hedging)

- Layered resistance at multiple strikes 🧱
- Smooth inventory management
 ️
️
This tells us:
- Institutions were not reacting
- They were executing a plan
- Direction was postponed, not uncertain
Key insight:
 When many strikes are short, price is being managed, not discovered.
6️⃣ The Most Lethal Market Condition: Range at the Top
An all-short range near highs is the most damaging environment for traders:
- Bulls feel safe because price isn’t falling

- Bears stay inactive waiting for breakdown

- Vol sellers collect steadily
- Directional traders bleed slowly 🩸
This phase exists to:
- Drain late enthusiasm

- Transfer risk invisibly 🤫
- Normalize the idea that “nothing is happening”
Key insight:
🧊 Tops are not violent. They are boring — by design.
7️⃣ Why the Breakdown Always Feels “Out of Nowhere”
When price finally leaves such a zone:
- Traders say “sudden move”

- But structure decided long before
The option market had already:
- Sold the ceiling 🧱
- Neutralized upside
- Earned time decay
- Positioned for asymmetry
 ️
️
Price simply followed authorization.
Key insight:
🧬 Structure decides. Price executes.
8️⃣ Non-Negotiable Lessons from This Episode
- If all legs are short, direction is capped

- Zones matter more than strikes
 ️
️ - Time decay is an active weapon
- Sideways near highs = distribution
- Calm price does not mean neutral intent ️
🧠 Final Thought
This was not a failed call,
not a confused market,
and not indecision.This was a professionally sold range, executed through all-short, multi-leg option inventory, while the index maintained the illusion of strength
 .
.The real shift in thinking is this:
 The market is most dangerous when it looks controlled, quiet, and reasonable.
Those who understand this stop asking
“Will it break?”
and start asking
“Who is being paid while it doesn’t?”That question marks the line between retail interpretation and structural understanding.
-
 Building Your Own Intraday Breadth Analysis System
Introduction
In the fast-paced world of intraday trading, decisions are often taken within seconds. Many traders rely only on price action or setups, but forget to ask a deeper question: Is the market move truly supported by broad participation, or is it just a handful of stocks dragging the index?
This is where breadth analysis comes in. Breadth measures the internal strength and participation of the market. For an intraday trader, building a personalized breadth system acts like a health monitor—it tells whether the market move is trustworthy, weak, or simply noise.
A trader who has his own breadth dashboard is like a pilot with instruments: less dependent on blind judgment and more aligned with market structure.
Why Every Intraday Trader Needs Breadth- Avoid Traps: Many index rallies/falls are led by just 2–3 heavyweights. Breadth exposes whether the trend is real.
- Find Market Phases: Breadth helps you know if the day is trending, sideways, or reversal-prone.
- Sector Clues: Breadth shows rotation—money shifting from one sector to another.
- Options Edge: OI breadth + price breadth gives a combined view of direction and volatility absorption.
- Risk Control: Breadth provides advance warning of exhaustion before you commit to heavy trades.
In short: setups give you entry/exit points, but breadth gives you context.
🧭 The Nine Pillars of Intraday Breadth Analysis
Below are the 9 key breadth studies intraday traders can use. Each gives a unique lens into market health:
1. Advance–Decline Ratio (ADR)
-
Formula: Advancing ÷ Declining stocks
-
Signal:
-
1.5 → strong bullish bias
- <0.7 → strong bearish bias
- Around 1 → sideways
-
 Use: Confirm if index moves have broad support.
2. Sectoral Breadth Heatmap
-
Measure: % of stocks above VWAP in each sector
-
Signal:
-
70% above VWAP → sector leadership
- <30% above VWAP → sector weakness
-
Use: Rotate trades toward strong sectors, avoid weak ones.
3. Volume Breadth
-
Formula: Up Volume ÷ Down Volume
-
Signal:
-
2 → strong bullish participation
- <0.5 → bearish dominance
-
Use: Check if money flow confirms price breadth.
4. Intraday Breadth Oscillator
-
Formula: (Advances – Declines) rolling on 5-min data
-
Signal:
- Rising with index → healthy move
- Divergence → possible reversal
Use: Spot early warnings of fading momentum.
5. New High–Low Count
-
Measure: Number of stocks making new intraday highs vs lows
-
Signal:
- Shrinking highs near index highs → upside exhaustion
- Shrinking lows near index lows → downside exhaustion
Use: Excellent for contrarian scalps.
6. Leader–Follower Breadth
-
Measure: Heavyweights vs broader market
-
Signal:
- If only 2–3 stocks push the index → weak move
- If midcaps also participate → sustainable trend
Use: Judge whether index moves are artificial or genuine.
7. Moving Average Breadth
-
Measure: % of stocks above 5-min 20EMA
-
Signal:
-
70% → strong uptrend
- <30% → strong downtrend
- 40–60% → sideways chop
-
Use: Confirm whether to trade directionally or with straddles.
8. ORB Breadth (Opening Range Breakout Breadth)
-
Measure: % of stocks breaking above vs below 15-min opening range
-
Signal:
-
+30% net up → bullish day tone
- <–30% net down → bearish day tone
- Near 0 → sideways
-
Use: Sets morning directional bias; avoid fading strong ORB days.
9. OI Breadth (Options Open Interest Breadth)
-
Measure: % of stocks with Put OI build-up vs Call OI build-up
-
Signal:
- Positive → bullish undertone
- Negative → bearish undertone
- Neutral → range-bound
Use: Combine with price breadth for stronger conviction in option selling/buying.
 Intraday Breadth Quick Reference (Table)
Breadth Type Key Measure Bullish Bias Bearish Bias Range/Neutral ADR Advancing ÷ Declining stocks >1.5 <0.7 ~1 Sector Heatmap % above VWAP >70% <30% 40–60% Volume Breadth Up ÷ Down Volume >2 <0.5 0.8–1.2 Breadth Oscillator Advances – Declines (5m) Rising with index Divergence Flat High–Low Count New highs vs lows Expanding highs Expanding lows Shrinking both Leader–Follower Heavyweights vs broad Both participate Only leaders move Mixed MA Breadth % above 20EMA (5m) >70% <30% 40–60% ORB Breadth 15-min breakout Net >+30% Net <–30% ~0 OI Breadth Put vs Call OI build-up Put OI ↑ Call OI ↑ Neutral
 Practical Trading Applications
-
Trend Confirmation
- Strong ADR + Sector Heatmap + Volume Breadth + ORB Breadth = high-probability trending day.
- Ride trend, avoid contra setups.
-
Sideways/Range Day
- ADR ~1 + ORB near 0 + OI neutral = best for straddles/strangles.
-
Reversal Alerts
- If Breadth Oscillator diverges, or High–Low count shrinks against price, prepare for contra trades.
-
Options Edge
- OI Breadth adds a second layer: price + positioning of big players.
️ DisclaimerThis article is for educational purposes only. Breadth studies are not trade signals on their own—they are context tools. Trading involves risk of capital loss. Always combine breadth analysis with proper risk management, stop-loss discipline, and personal judgment before executing trades.
-
@Asfak Ahmed in straddle what i did after entry i place both sl & target price in buzzer which help me to be less emotional during on going trade . and even entry if u have any custom pattern can do entry
-
@Harjjap Singh Ssaini
 another exaple of today
 -
@Harjjap Singh Ssaini Got it

You basically want the comparison of Dynamic SL vs Entry After SL, but also showing that when the market is too noisy, it’s better to switch your SL method to Supertrend-based instead of VWAP-based, since VWAP can whipsaw you in choppy moves.Here’s the refined explanation:
Dynamic SL vs Entry After SL (with Supertrend Twist)
1. Dynamic SL

-
SL changes with market movement (trailing).
-
Normally, you might trail using VWAP, ATR, or pivots.
-
But in noisy markets (lots of wicks, sideways chop):
- Switch to Supertrend-based SL → It filters out small whipsaws better than VWAP.
- Supertrend smooths price action using ATR + trend direction.
- This keeps you in the trade longer while avoiding fake VWAP breaks.
Example:
- Short NIFTY 23,000 CE at ₹100.
- SL trails below Supertrend line (e.g., ₹112).
- Price spikes but stays under Supertrend → no exit.
- Big decay captured despite multiple VWAP whipsaws.
2. Entry After SL
-
You take a planned re-entry after your SL is hit, if the setup returns.
-
Supertrend can also help here:
- Wait until price comes back inside Supertrend trend direction before re-entering.
- Avoids immediate revenge trades after a false breakout.
Example:
- Short at ₹100, VWAP SL hit at ₹115.
- Price jumps, then falls below Supertrend again.
- Re-enter short at ₹112 with fresh SL at Supertrend level.
Comparison Table (VWAP vs Supertrend in Noisy Conditions)
Feature VWAP SL 
Supertrend SL Best For Trend + institutional bias days Noisy / choppy days Weakness Frequent whipsaws in sideways May delay exits in fast reversals SL Movement Follows intraday mean price Follows ATR-adjusted trend line Psychology Impact Can frustrate with false exits Keeps confidence by avoiding noise Re-entry Filter Needs extra confirmation Supertrend change acts as filter
 Pro Seller’s Formula:
- Trend Day → VWAP trailing SL (catches strong moves early).
- Noisy Day → Supertrend trailing SL (filters false moves).
- Always define pre-planned re-entry conditions—never improvise after a stop-out.
-
-
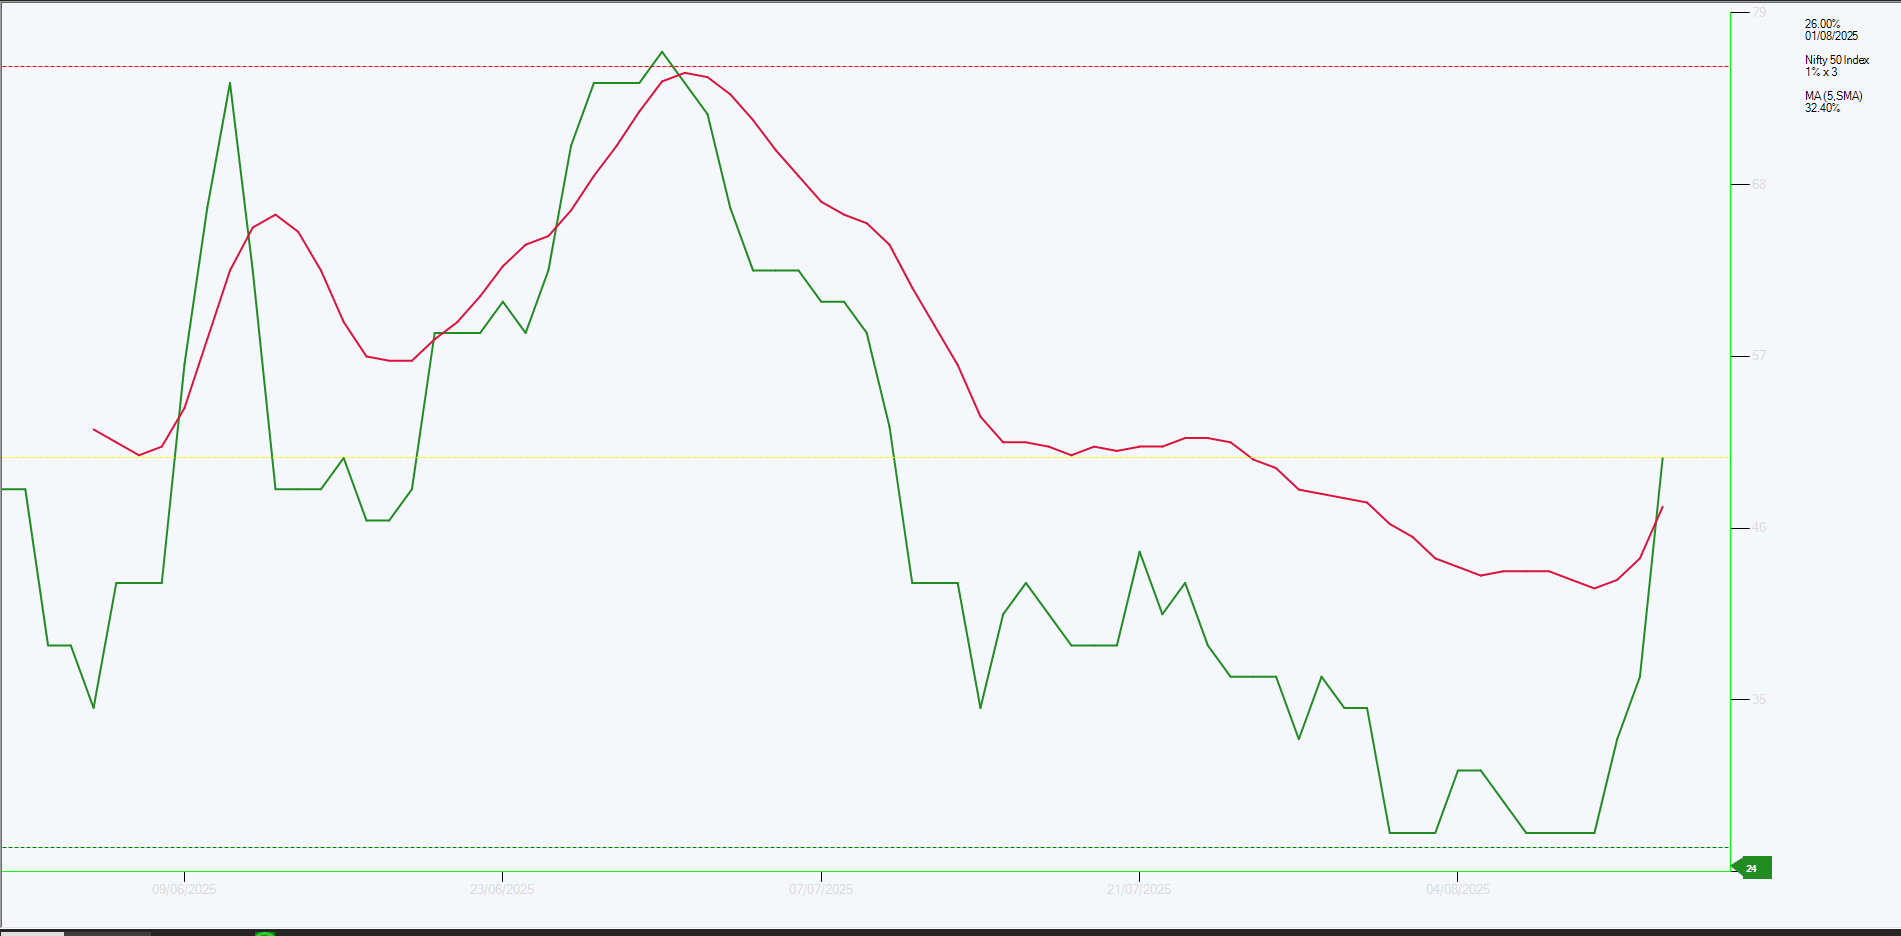
Nifty 50 Market Pulse: Breadth Bullish Crossover Nearing Confirmation & P&F Price Action Supports Upside1️⃣ Introduction
In trading, price action tells you what is happening, but market breadth reveals how strong the underlying move really is.
Right now, our Nifty 50 breadth analysis (1% P&F daily) and intraday P&F price chart (0.05% × 3) are aligned — showing a strong bounce from oversold and a bullish breadth crossover that is now pushing toward the confirmation zone.
2️⃣ Breadth Overview (Market Internals)
- Current Breadth: 40+ — sharply up from the extreme oversold zone (~24%).
- Bullish Crossover: Breadth line (green) has crossed above its 5-period SMA (red).
- Slope Strength: The rise is steep, showing strong buying participation across the index.
- Proximity to Pivot: The move is now approaching the 46% mid-level — crossing and sustaining above this historically confirms an uptrend in participation.
Interpretation:
This is no longer just a rebound — it’s a momentum shift. Multiple Nifty 50 stocks are flipping to P&F buy signals simultaneously.
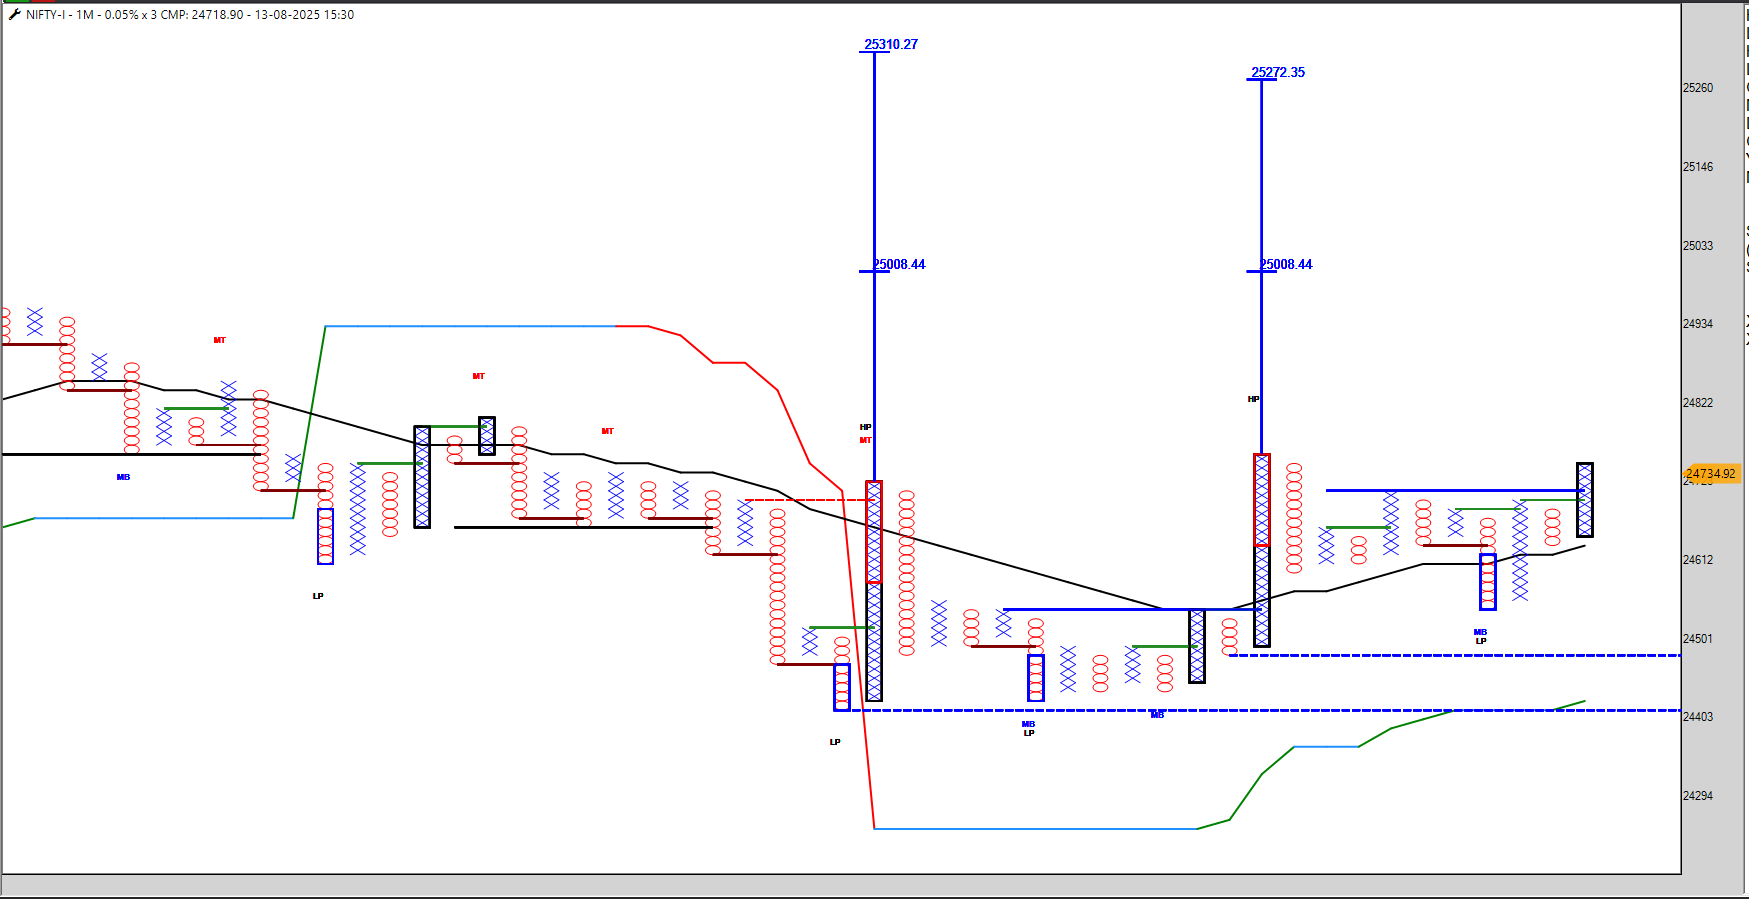
3️⃣ Price Action Overview (P&F 0.05% × 3)
-
Recent Pattern: Multiple Low Pole (LP) reversals — signalling failed breakdowns.
-
Support Levels: MB and LP zones (~24,403–24,501) are holding firmly.
-
Upside Price Targets:
- Primary: 25,008 – 25,272
- Extended: 25,310
Interpretation:
Price is holding its ground, with structural P&F patterns pointing toward bullish continuation.
4️⃣ Combined Market View
With breadth at 40+ and rising (internals) and bullish P&F structure (price action), the market is in a pre-breakout phase — one step away from full confirmation.
Factor Current Signal Implication Breadth Level 40+ (rising from oversold) Strong participation SMA of Breadth Bullish crossover with steep slope Momentum building P&F Price LP reversals, above support Buyers dominant Targets 25,008 → 25,272 → 25,310 Upside bias
5️⃣ Trading Approach
- Aggressive traders: Can hold/build long positions from the oversold bounce, trail stops under key P&F supports.
- Conservative traders: Watch for breadth >46% for final confirmation.
- Option sellers: Shift toward bullish-biased range strategies as downside risk reduces.
6️⃣ Risk Factors
- If breadth fails to cross/sustain above 46%, rally may stall.
- Sudden global or macro shocks could reverse sentiment quickly.
7️⃣ Conclusion
The Nifty 50 market pulse shows a textbook setup:
- Oversold breadth bounce
- Bullish crossover with strong slope
- Price holding bullish P&F structure
This alignment often precedes a short-to-medium term rally — and with breadth now at 40+, the market is close to flipping into confirmed bullish territory.
Disclaimer: For educational purposes only. Not financial advice. Manage risk at all times.
-
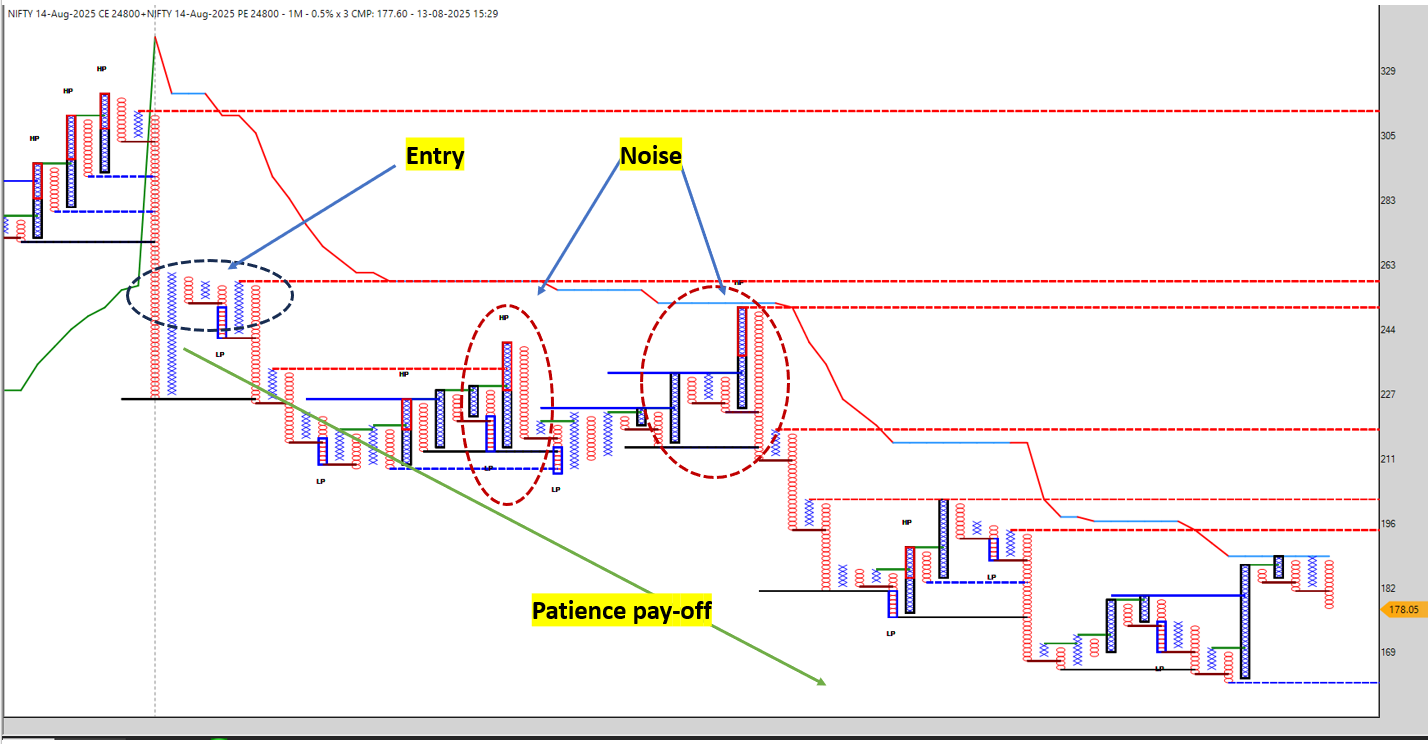
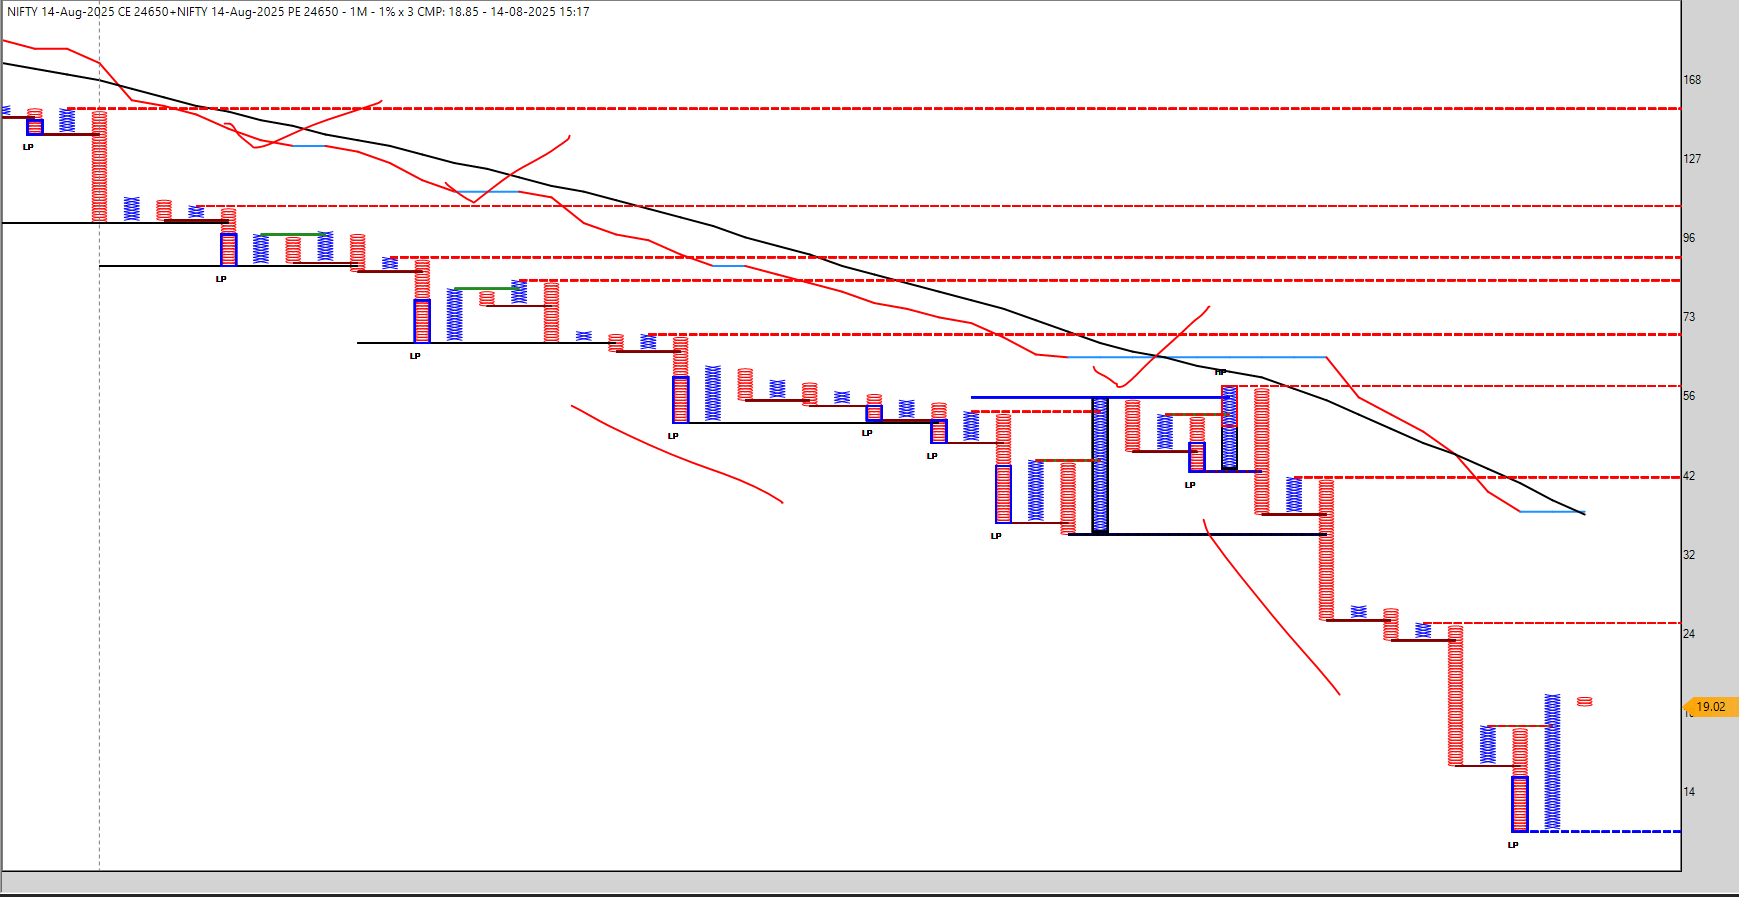
(A Case Study from a Live Chart)
Option selling is not just about numbers — it’s about holding your ground when the market tries to shake you out.
In this study, we’ll dissect a real chart with marked Fear Traps and Patience Pays zones to understand how conviction and structure create long-standing winners.
 The Chart at a Glance
- Red Shaded Areas = Fear Trap
Short-lived spikes designed to create emotional panic. - Green Shaded Areas = Patience Pays
Zones where holding the position led to significant option premium decay.
1️⃣ Understanding the Market’s “Fear Script”
a. Fear Trap #1
 Location: Red-circled spike after entry.
- What Happened: The market made a sudden upward push, breaking short-term highs.
- Psychological Attack: It tempts sellers to believe a breakout is coming, making them close early.
- Reality: Spike failed to sustain, and prices reverted back into decay zone.
b. Fear Trap #2
Location: Red-circled spike.- What Happened: After a minor downtrend, market faked a recovery.
- Psychological Attack: Traders who survived the first trap think, “This is the real reversal.”
- Reality: It was a liquidity grab before another leg down.
2️⃣ The Power of Patience & Conviction
a. Patience Pays Zone #1
- Setup: After initial noise, market settled below key pivot lines.
- Why Hold: Price was below invalidation level, and time decay was accelerating.
- Result: Options lost value steadily even without huge directional moves.
b. Patience Pays Zone #2
- Setup: Post second fear trap, price structure aligned with your bias and VWAP acted as a ceiling.
- Why Hold: Consistent rejection at resistance confirmed sellers in control.
- Result: Massive premium collapse into the close.
3️⃣ The Technical Logic Behind the Hold
Element Role in Decision VWAP Served as dynamic SL. Price staying below confirmed no reversal. Pivot Levels Helped identify where fake breakouts might fail. Option Premium Behavior Time decay was visibly accelerating, signaling reward for holding. Market Structure Lower highs and lower lows showed sellers still active despite spikes.
4️⃣ Lessons for Freshers
Mistake to Avoid Better Approach Exiting at first spike Wait for SL/invalidation to hit before acting Chasing reversal after noise Let price confirm before switching bias Over-analyzing after entry Trust pre-trade analysis; monitor only key levels Ignoring decay factor Remember — in selling, sideways-to-down is your friend
 Final Takeaway
Option selling rewards the trader who can see beyond the noise.
If your entry is based on sound structure, and you have a clear invalidation level, then patience becomes your profit engine.
Noise is inevitable — but decay is inevitable in your favor if the structure holds.
- Red Shaded Areas = Fear Trap
-
 “When the Option Seller Sells His Last Shirt” — A Trading Joke With a Serious Lesson
1️⃣ The Joke That Never Gets Old
In every trading circle, there’s that one timeless jab:
“One day, the seller will have to sell his last shirt!”


It’s often aimed at option sellers — the ones who stand on the other side of the gamblers, quietly collecting premium while everyone else chases big lottery-style wins.
The joke paints this picture: you’re selling options for small profits, but one day the market will take it all away in one massive move… and you’ll end up selling your shirt to cover the losses.Funny? Absolutely.
True? Only if you ignore risk management.
2️⃣ Why People Love This Joke
This shirt-selling line survives because:
- It has a hint of truth — naked selling without a stop-loss is financial suicide.
- It’s relatable — everyone has seen someone blow up after thinking “this will never happen.”
- It’s visual — nothing says “blown account” like imagining a trader half-naked holding a sell ticket.

Fun quote: “An unhedged seller is like a man at a wedding in just a vest — everyone can see something’s missing.”
3️⃣ The Real Option Seller’s Edge
A professional option seller:
- Knows the math — Options decay faster than they expand most of the time.
- Controls position size ️ — Never betting the farm (or the wardrobe).
- Hedges properly ️ — Using futures, opposite strikes, or protective options.
- Accepts drawdowns as business expenses
 — Treating losses like inventory cost, not personal failure.
Fun quote: “I don’t sell my last shirt… I sell the ones I don’t plan to wear this season.”
4️⃣ The Psychology Behind the Joke
Here’s the hidden layer — jokes like these are often emotional projection.
- From buyers — they’ve faced option expiry decay and want to believe sellers will “get it back.”
- From ex-sellers — they traded without risk rules and now preach fear.
- From spectators — they enjoy poking at the calmness of a seller holding steady through volatility.
A wise trader hears the joke and smiles — not because it’s wrong, but because they know they’ve built an eco-system to survive.
Fun quote: “My wardrobe is diversified — cotton shirts, silk shirts, and risk-managed shirts.”
5️⃣ How to React Like a Pro
Style Reaction Quote Emoji Light Humor 
“My shirt is hedged… even if the market rips it off, I’ve got a backup in the closet.” ️Educator Mode 
“True… if you don’t manage risk. But I sell premium with defined risk and controlled exposure — that’s the difference between losing your shirt and buying more shirts.”  ️
️Mic-Drop 
“Maybe… but even if I lose my shirt, I’ve already collected rent for letting you wear it first.” 

Savage Banter 
“Last shirt? Bro, I’m running an outlet store.” 
Calm Zen 🧘 “I keep my shirts folded in patience and stitched with discipline.” 🪡 
6️⃣ The Takeaway
The “last shirt” joke is funny — but it’s only a reality for:
- Those who go all-in.
- Those who trade naked without a hedge.
- Those who ignore stop-losses and position sizing.
For disciplined option sellers, the game isn’t about avoiding risk entirely — it’s about pricing it, controlling it, and getting paid for taking it.
You don’t just sell your shirt; you rent it daily and buy new ones with the rent.
Final Thought:
In trading, the market will test you. Some days it will tug at your collar, some days it’ll rip a sleeve. But if you run your option selling like a real business, you’ll never have to auction off your last shirt. You’ll be too busy folding the fresh ones you bought with premium income. Final Fun Quote: “The day I sell my last shirt, it’ll be because I opened a fashion brand — not because of a bad trade.” 
Disclaimer

This article is not a personal response to any individual comment or directed at anyone in particular.
It’s a blend of crowd-market humor and refined trading insight — taking a common joke from the trading floor and reshaping it into an educational perspective.
Any resemblance to actual conversations is purely coincidental, as this is about ideas, not people.
-
 it's now
 -
 it's morning
 -
Price First, OI Second — The Two Roads of Intraday Trading IntroductionIn the high-speed arena of intraday trading, every second counts — and every extra decision point drains mental energy. Traders often face a tactical choice: Do I track both price and open interest (OI) in real time, or do I strip the setup down to price alone?
While market educators may recommend watching both for confirmation, there is another path — the Spartan approach — where you watch only price but carry a deep internal understanding of OI’s behavior. This article explores both philosophies, their strengths and weaknesses, and why some traders, like disciplined warriors, choose to simplify their battlefield.
 The Spartan Dilemma in Trading
Every intraday trader eventually faces the same question:
- Do I track both Price & OI in real time?
- Or do I strip away all noise and focus only on Price, trusting my own trained instincts?
The decision isn’t about laziness — it’s about energy economy. In intraday trading, mental energy is a limited currency. Spend it wisely.
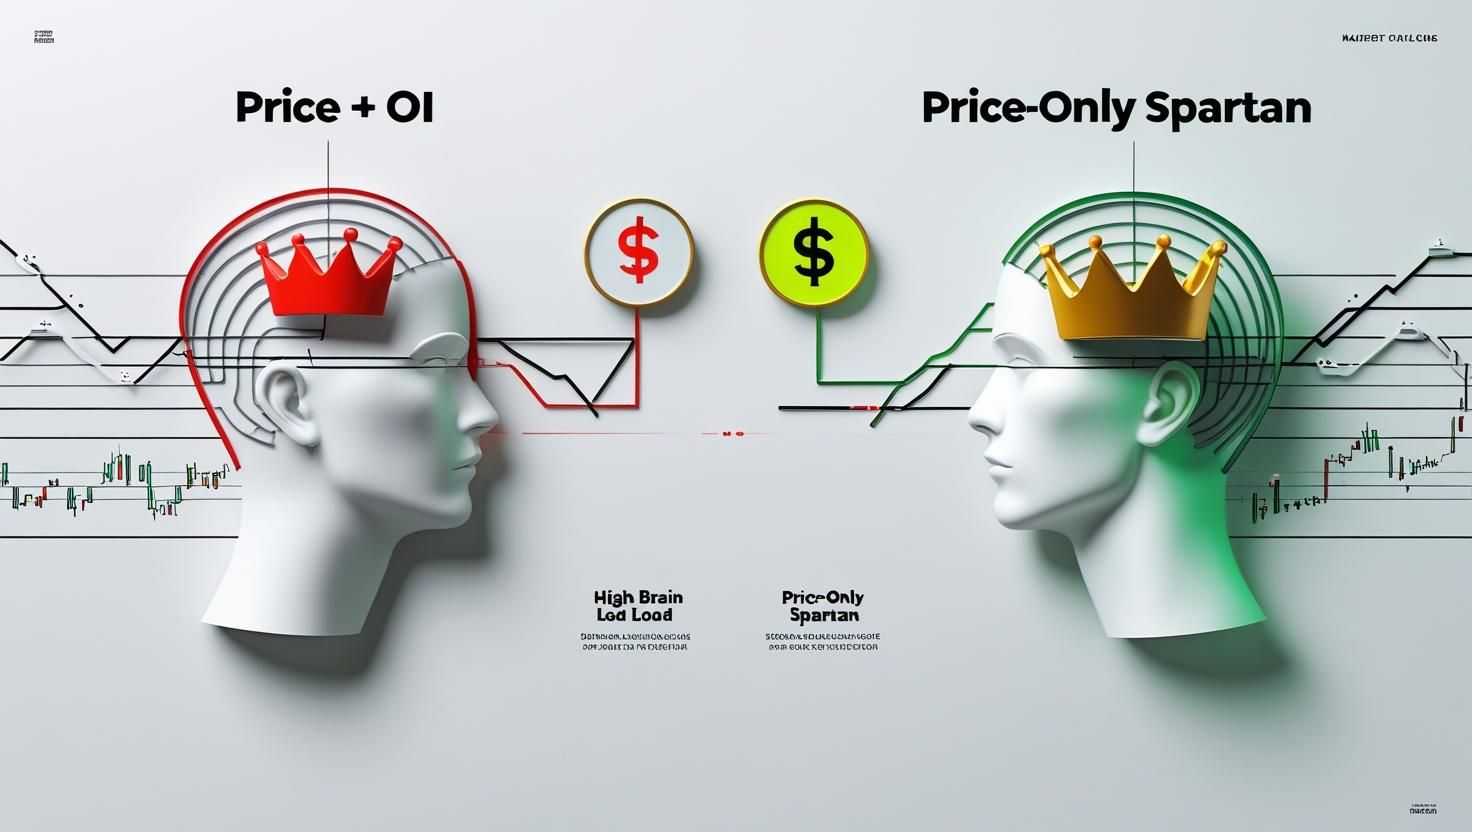
1️⃣ The “Both Eyes Open” Approach — Price + OI
Some traders keep both price and OI side by side, believing in a two-layer confirmation.
Flow:
- Price speaks first — instant tick-by-tick updates.
- OI follows — a few seconds later, confirming whether positions are building or liquidating.
Pros:
- Strong confirmation for trend trades.
- Helps identify fake moves early.
- Good for analytical personality types.
Cons:
- Higher brain load — constantly processing two live data feeds.
- Risk of “analysis paralysis” in fast markets.
- OI can be manipulated — large players can open and close positions to create false OI signals, so it’s never fully reliable as a primary indicator.
2️⃣ The “Price-Only Spartan” Approach — Your Path
This is where discipline meets simplicity.
You understand OI deeply, but choose not to watch it live. Instead, you let price action tell the story.Philosophy:
“Price is the voice, OI is the echo. If you know the echo’s nature, you don’t need to hear it every time.”
Why it works:
- Price reacts first, so your reaction is immediate.
- You already know what OI confirmation would look like — no need to watch it tick.
- You avoid mental fatigue, keeping decision-making sharp throughout the day.
- You remove dependency on data that can be manipulated or delayed, focusing instead on the primary truth — price action.
Pros:
- Lean screen setup = less clutter, faster reaction.
- More focus on trade execution.
- Lower emotional exhaustion.
Cons:
- Requires prior mastery of OI logic.
- No live confirmation — more reliance on skill & intuition.
🧠 Why the Analyst Feels Less Pressure in the Spartan Approach
One of the hidden benefits of the price-only strategy is the psychological relief it brings:
- Fewer inputs = Fewer doubts — you don’t waste mental energy reconciling price and OI when they conflict.
- Less decision fatigue — no constant switching between two data feeds.
- More flow state trading — your focus is fully on market rhythm, not data cross-checking.
- Confidence-driven execution — you trust your groundwork in OI analysis without getting caught in second-by-second noise.
This creates a lighter mental workload, which can directly improve trade discipline and reduce emotional mistakes — especially in volatile intraday sessions.
Quick Comparison TableFeature Price + OI Live Price-Only Spartan Confirmation Speed Slower Instant Brain Load High Low Fake Move Filter Strong Based on skill Setup Clarity High Ultra-focused Energy Use Higher Lower Analyst Pressure Higher Lower Data Manipulation Risk Medium Minimal impact
 The Spartan Mindset Edge
In your trading journey, you’ve chosen the minimalist warrior’s path — fewer inputs, stronger focus, sharper execution.
This is not ignorance — it’s deliberate simplicity.
By mastering the fundamentals of OI and embedding them into your subconscious, you’ve freed yourself from live OI dependency.
 Final Word
Whether you choose the dual-monitor Price+OI style or the price-only Spartan style, the truth remains:
- Price moves first.
- OI tells the story later.
The edge comes not from how much data you watch, but from how clearly you act when the market speaks.
In battle, the Spartan carried only what he trusted. In trading, carry only the tools you have mastered.
DisclaimerThis article is for educational purposes only and does not constitute investment or trading advice. Markets involve risk, and past performance is not a guarantee of future results. Always use proper risk management, and make trading decisions based on your own analysis or consultation with a licensed financial advisor.
-

🧠 Two Souls of a Trader: How to Separate the Analyst from the Executor & Trade with Clarity Using Definedge’s Buzzer Ecosystem
Every trader has two forces working inside them — one that thinks and one that acts.
One is calm, logical, and deliberate. The other is fast, decisive, and relentless.These two forces — the Analyst Self and the Executor Self — are the “two souls” of trading.
If they blend into each other during live markets, stress and indecision follow.
If they work in separation but harmony, trading becomes sharper, calmer, and more consistent.With tools like Definedge’s Buzzer platform, this separation can move from philosophy into daily practice.
The Two Souls of Trading — Defined1. The Analyst Self – The Thinker
The Analyst Self is your strategic brain.
- It thrives in structured thinking, whether during pre-market preparation or in the middle of the session.
- Its job is to observe, identify, and decide without the pressure of manually executing trades.
- For a straddle trader, this means reading custom patterns on a P&F chart, sensing when conditions align with your trading framework, and defining the exact entry and exit parameters in real time.
- This self is methodical — it doesn’t guess, it confirms.
2. The Executor Self – The Doer
The Executor Self is your mechanical arm.
- It’s responsible for pulling the trigger instantly and accurately, exactly as instructed by the Analyst.
- It does not ask “why” — it acts.
- It ensures that the order is placed without hesitation, slippage, or emotional interference.
- In a modern workflow, this can be completely outsourced to an algo, letting your human energy remain focused on decision-making rather than button-pressing.
Role Nature Primary Function Core Strength Risk if Misused 🧠 Analyst Self The Thinker Observes, identifies, decides Strategic clarity Paralysis by over-analysis  Executor Self
The Doer Executes instantly, precisely Speed & discipline Emotional interference ️ The Conflict When They MixIf both souls try to handle decision and execution simultaneously in the heat of live trading:
- The Analyst hesitates because the Executor’s urgency creates pressure.
- The Executor makes poor entries or exits because the Analyst is still “thinking” instead of giving clear commands.
- Mental fatigue sets in early, making mistakes more likely in the best market moments.
For an intraday straddle trader — where every second in execution can affect premium pricing — this overlap can destroy your edge.
️ The Philosophy of SeparationThe solution is a discipline philosophy:
- The Analyst: Focuses purely on market observation and decision-making — no execution distractions.
- The Executor: Follows instructions exactly, without rethinking.
This mirrors the battlefield principle:
“The General commands, the Soldier acts. Neither tries to do the other’s job.”
For a straddle trader:
- General (Analyst) – Monitors custom P&F patterns, watches volatility changes, sets SL/Target.
- Soldier (Executor) – Executes instantly without hesitation.
How the Definedge Buzzer Brings It to LifeDefinedge’s Buzzer platform isn’t just a scanner — it’s an execution assistant that bridges the gap between the Analyst and Executor.
Here’s how the process works in your ecosystem:
- Pattern Identification – The Analyst spots a valid custom pattern that fits the pre-defined framework.
- Decision Lock – Analyst finalizes the trade idea, including entry, SL, and target — all based on live market conditions.
- Buzzer Execution – The trade is sent to Buzzer, which places the entry, SL, and target instantly, without manual typing.
- Auto-Management – OCO orders handle risk and profit booking without further human input.
- Analyst Continues Analysis – With execution offloaded, the Analyst Self stays in observation mode, ready for the next opportunity.
This workflow removes the clicking, typing, and order entry stress, so you’re never “late” to your own trade idea.
 Ethics & Trading Philosophy in the Two Souls Method
Separating your two souls is more than efficiency — it’s about trading ethics:
1. Respect Pre-Defined Boundaries
Set daily max loss, trade count limits, and no-trade conditions — and never break them.
Philosophy: Discipline is your insurance policy.2. Keep Execution Emotion-Free
Execution should be an obedient servant to analysis, not a co-pilot with opinions.
Philosophy: The market rewards consistency over excitement.3. Adapt with Rules, Not Impulses
Your Analyst Self can adjust SL/Target in live markets — but only for volatility or structure shifts that are rule-based.
Philosophy: Be flexible like water, but stay within the riverbanks.4. Let the Analyst Lead, Always
Your trade idea must always be born in the Analyst Self — the Executor must never “decide” trades on its own.
Philosophy: A soldier without a general fights without direction.
 ️ Daily Workflow for a P&F Straddle Trader Using Buzzer
Pre-Market – The Discipline Layer
- Define risk rules (max daily loss, max trade count).
- Prepare your P&F chart and custom pattern alerts.
- Avoid building directional bias — focus only on readiness.
Live Market – The Analyst’s Real-Time Role
- Monitor P&F charts and pattern alerts.
- When a custom pattern aligns with your plan, define SL, entry, and target instantly.
- Adapt parameters only if volatility or structure changes unexpectedly — per your adaptation rules.
Execution – The Algo Soldier
- Push trade details to Buzzer for instant entry & risk management.
- Let OCO manage exits — no manual interference unless Analyst calls for it.
Post-Market – The Judge’s Review
- Compare actual trades to your planned rules.
- Record moments where Analyst-Executor separation worked perfectly — or failed.
- Refine process for next session.
The Mindset EdgeBy separating the Analyst and Executor roles:
- You protect your energy — no execution stress.
- You sharpen your focus — the Analyst stays fully aware of market changes.
- You preserve discipline — emotions don’t leak into execution.
- You build repeatability — a process that works on good days and bad days alike.
️ DisclaimerThis article is for educational purposes only and does not constitute investment advice. Trading in derivatives involves significant risk and is not suitable for all investors. Always trade with capital you can afford to lose and maintain a robust risk management plan.
-
https://www.niftyindices.com/indices/equity/broad-based-indices/NIFTY--50
 Mastering Nifty 50 Intraday Moves – A Weighted Approach to Reading Market Dynamics
Introduction
The Nifty 50 is not just a number flashing on your trading screen — it’s a living, breathing reflection of India’s top 50 companies and their combined market behavior.
If you’re an intraday trader or a market fresher, understanding how Nifty moves, who moves it, and who drags it can make the difference between random trades and informed decisions.In this article, we’ll break down Nifty’s sector structure, top constituents, beta behavior, movers vs. draggers, and intraday reading methods using real July 31, 2025 data.
1. What is the Nifty 50?
The Nifty 50 represents 50 large, liquid, and financially sound companies across key sectors of the Indian economy.
It is free-float market capitalization weighted, meaning the influence of a company on Nifty depends on:- Its market capitalization (share price × number of shares in the market)
- The number of shares available for trading (free float)
2. Key Portfolio Characteristics

Attribute Detail No. of Constituents 50 Launch Date April 22, 1996 Base Value 1000 (Base Date: Nov 3, 1995) Calculation Frequency  Real-time
Rebalancing Semi-Annually
3. Sector Representation (July 31, 2025)


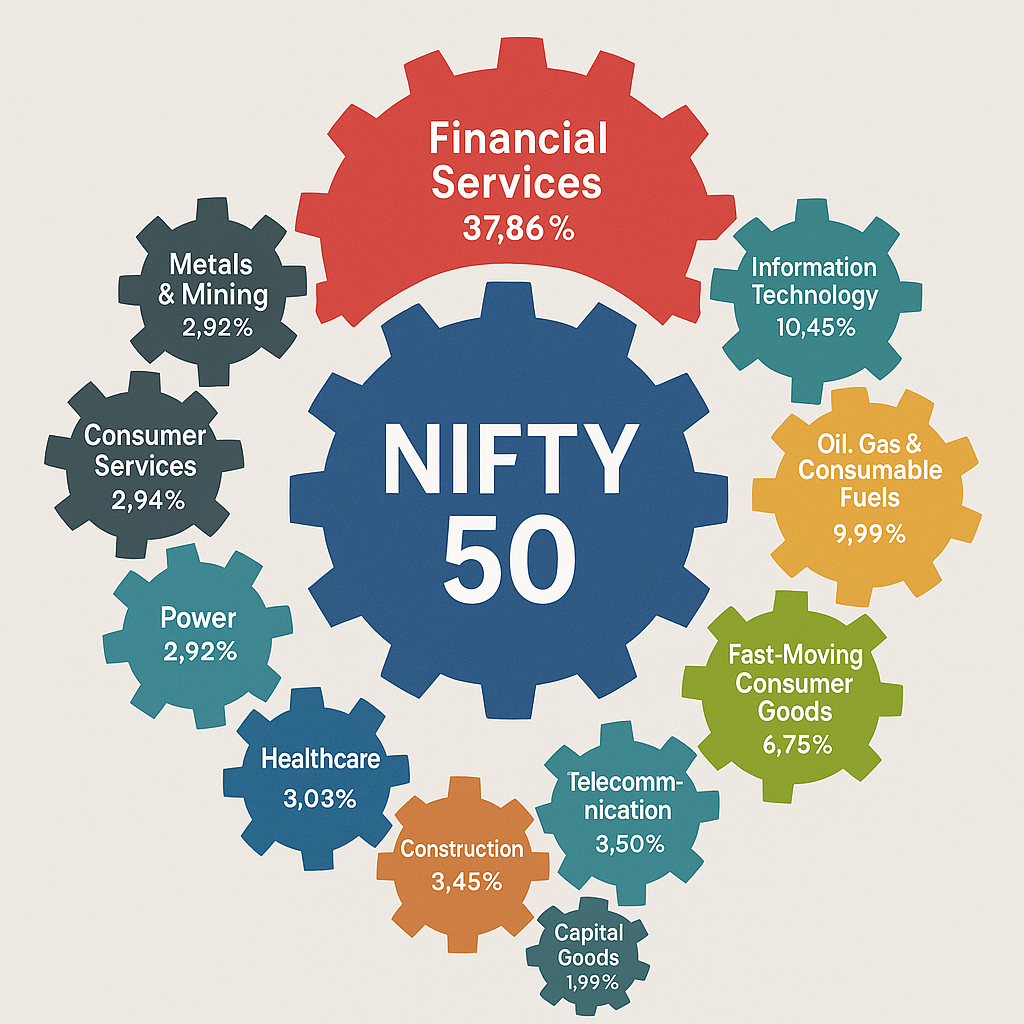
Nifty’s movement is heavily skewed towards certain sectors.
Sector Weight (%) Intraday Influence Financial Services37.86 Main driver of Nifty; banks dominate Information Technology10.45 Global sentiment-sensitive Oil, Gas & Consumable Fuels9.99 Reliance-led sector  Automobiles & Auto Components
7.19 Cyclical, demand-driven  Fast-Moving Consumer Goods (FMCG)
6.75 Defensive, stable  Others (Telecom, Metals, Power, etc.)
<5% each Low index impact unless big news Key takeaway:
If Financial Services + IT + Reliance move together, they can dictate Nifty’s intraday direction.
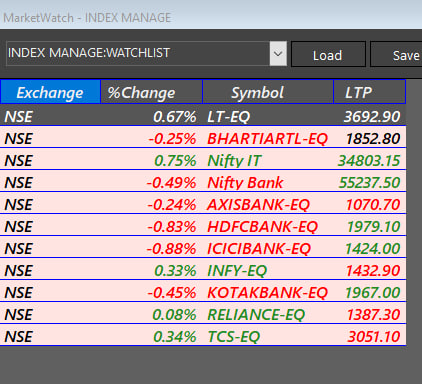
4. Top Weighted Constituents

Company Weight (%) HDFC Bank Ltd. 13.71 ICICI Bank Ltd. 9.41 Reliance Industries Ltd. 8.39 Infosys Ltd. 4.84 Bharti Airtel Ltd. 4.65 Larsen & Toubro Ltd. 3.80 ITC Ltd. 3.42 Tata Consultancy Services Ltd. 2.76 State Bank of India 2.73 Axis Bank Ltd. 2.72 ---
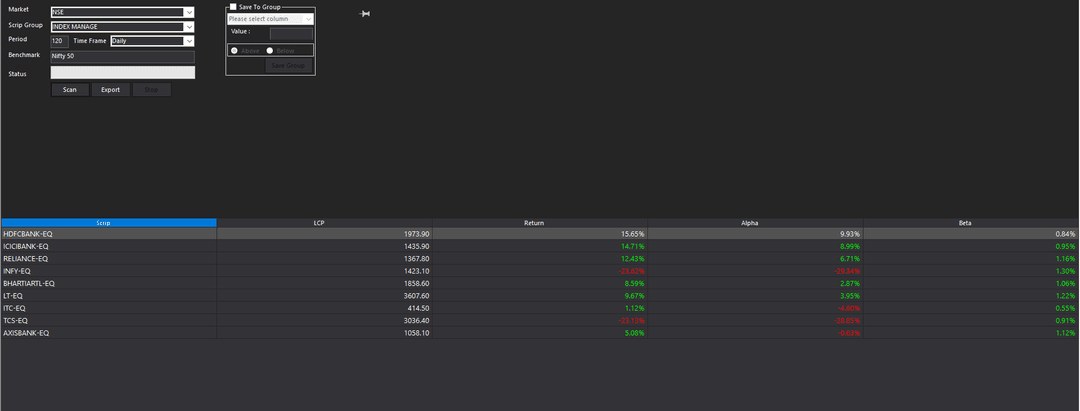
5. Adding Beta & Return to the Picture

From 120-day (Daily) data vs. Nifty benchmark, we get deeper intraday behavior:
Stock Weight (%) Beta Return (120D) Alpha Role HDFC Bank 13.71 0.84 +15.65% +9.93% Low beta, stable driver ICICI Bank 9.41 0.95 +14.71% +8.99% Moves in sync with Nifty Reliance 8.39 1.16 +12.43% +6.71% High beta, volatile driver Infosys 4.84 1.30 -23.62% -29.34% High beta dragger Bharti Airtel 4.65 1.06 +8.59% +2.87% Telecom stabilizer L&T 3.80 1.22 +9.67% +3.95% Infra momentum stock ITC 3.42 0.55 +1.12% -4.60% Defensive cushion TCS 2.76 0.91 -28.18% -28.83% IT drag Axis Bank 2.72 1.12 +5.08% -0.63% Volatile bank
6. Movers vs. Draggers
- Movers : Banking giants (HDFC Bank, ICICI Bank), Reliance, L&T — these have been powering Nifty upward.
- Draggers : IT sector (Infosys, TCS) has been a major weight on Nifty in recent months.
7. How to Read Nifty Intraday
Step 1 – Watch Heavyweights
 :
:
Even if 40 stocks are flat, the top 8–10 decide most of the intraday move.Step 2 – Check Sector Trends
:
If Financial Services are green and Reliance is flat/up  ️ → expect bullish bias.
If both Financials & Reliance are red → high chance of intraday weakness.
Step 3 – Consider Beta
:
High beta stocks amplify moves; low beta stocks act like shock absorbers.Step 4 – Identify Leadership Battle
️:- If movers outweigh draggers in points contribution → Nifty trends up
- If draggers dominate → Nifty trends down
8. All Possible Weighted Permutations & Combinations 🧮
Here’s how different heavyweight moves can influence intraday Nifty:
Financials (37.86%) Reliance (8.39%) IT Sector (10.45%)Likely Intraday Outcome ↑ ↑ ↑ Strong uptrend↑ ↑ ↓ ️ Uptrend with IT drag↑ ↓ ↑  ️ Mixed, mild up
↑ ↓ ↓  ️ Sideways to mild down
↓ ↑ ↑ ️ Mixed, mild up↓ ↑ ↓ ️ Sideways to mild down↓ ↓ ↑ Downtrend with IT cushion↓ ↓ ↓  Strong downtrend Quick rule:
If Financials + Reliance are in sync, Nifty will usually follow their direction regardless of IT’s move.
9. Sector Weight & Volatility – Quick Reference
Sector Weight (%) Typical Intraday Behavior Financial Services37.86 Reacts to RBI news, results IT10.45 Sensitive to Nasdaq, USD/INR Oil & Gas9.99 Driven by crude prices, Reliance news FMCG6.75 Defensive in volatility Automobiles7.19 Sensitive to demand cycles Others<5% Reacts to sector-specific triggers
Conclusion
Intraday Nifty dynamics are not random — they are a weighted battle between big movers and big draggers.
A fresher who learns to track the top stocks, sector behavior, and beta sensitivity will start reading the market like a pro.By understanding who is pulling the rope harder — bulls
or bears — you can align your trades with market reality instead of trading on guesswork.
Trading Insight
The weighted analysis of Nifty 50 constituents can also be applied to options strategies—particularly short straddles on the 200-+ point range. If top heavyweights ( HDFC Bank, ICICI Bank, Reliance, Infosys) are showing clear directional momentum, traders may bias towards one side of the straddle (higher or lower strike). Conversely, when movers and draggers are balanced with mixed sector performance, implied volatility crush can make short straddles more favorable.️ Note: This requires close intraday monitoring of sector weights, beta values, and live index positioning, as large-cap movement can quickly tilt the trade’s risk profile.
Disclaimer
️This article is for educational purposes only and does not constitute investment advice. Stock market trading involves risk, and past performance is not indicative of future results. Always do your own research or consult a financial advisor before making trading decisions. Data used is as per July 31, 2025, and may have changed since publication.
-
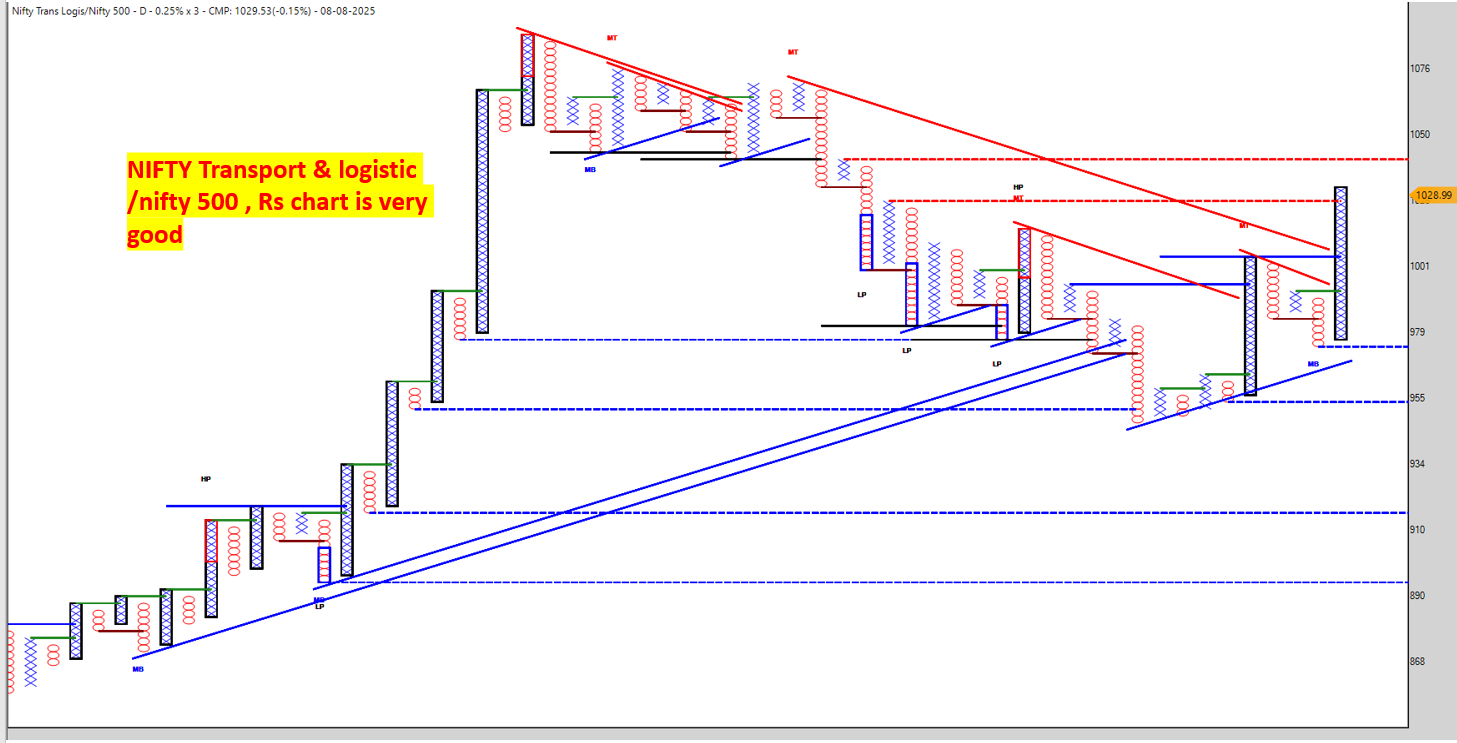
1. Chart Type & Parameters
- Type: Point & Figure (P&F) Relative Strength chart
- Box Size: 0.25% x 3 reversal
- Comparison: NIFTY Transport & Logistic index vs. NIFTY 500 index
- Interpretation Goal: Identify whether Transport & Logistic is outperforming or underperforming the broader market.
2. Key Observations
Trend Structure
- Long-term uptrend intact: The lower part of the chart (left to middle) shows a series of higher bottoms and higher tops, confirming strong RS momentum in past months.
- Recent correction phase: Multiple red bearish trendlines (MT) show that the RS strength faced consolidation/decline recently.
- Current breakout attempt: The latest X-column has broken the immediate bearish resistance (red trendline), showing signs of fresh outperformance.
Support & Resistance
-
Support zones:
- 955–960: Strong horizontal & upward trendline confluence (blue lines) – key RS support.
- 978–980: Minor support zone where last pullback held.
-
Resistance zones:
- 1050: Major RS resistance from multiple previous tops.
- 1075–1080: Strongest RS resistance (past highs).
Pattern
- Multiple Low Pole (LP) and High Pole (HP) formations indicating RS volatility.
- Recent MB (Multiple Bottom) and trendline breakout suggests early phase of relative strength recovery.
3. Strength Reading
- The RS chart being above key blue bullish trendlines means Transport & Logistic is still in structural RS uptrend vs. NIFTY 500.
- Breaking past NT (near-term resistance) would confirm a continuation phase toward 1050.
- If RS holds above 979 after breakout, it’s a healthy sign for sustained outperformance.
4. Tactical Interpretation
- Bullish bias as long as RS stays above 955.
- Watch for decisive breakout above 1050 → signals strong sector outperformance ahead.
- If RS falls below 955, expect relative underperformance.
Trader’s Note:
When RS chart is strong like this, it means money flow is favoring this sector over the broader market. Any bullish setup in individual Transport & Logistic stocks will have higher odds of success when RS is trending up.
5. Theoretical View
In a Relative Strength (RS) chart, the numerator (NIFTY Transport & Logistic) shows its performance relative to the denominator (NIFTY 500).
-
Current RS Trend: The Transport & Logistic sector is already in a structural RS uptrend, showing that it has been outperforming the broader market.
-
Impact of Denominator Recovery: If the denominator (NIFTY 500) begins to recover strongly, it can have two possible effects:
- Positive Amplification – If the Transport & Logistic sector rallies faster than the NIFTY 500, RS will accelerate upward, leading to a sharper outperformance signal.
- Neutralization – If both rise at the same pace, RS may move sideways, but sector momentum remains intact.
-
Why This Matters: A recovering NIFTY 500 often attracts broader market buying interest. In such an environment, already strong RS sectors like Transport & Logistic tend to attract disproportionate capital flow, which could push RS above the critical 1050 breakout level and potentially toward 1075+.
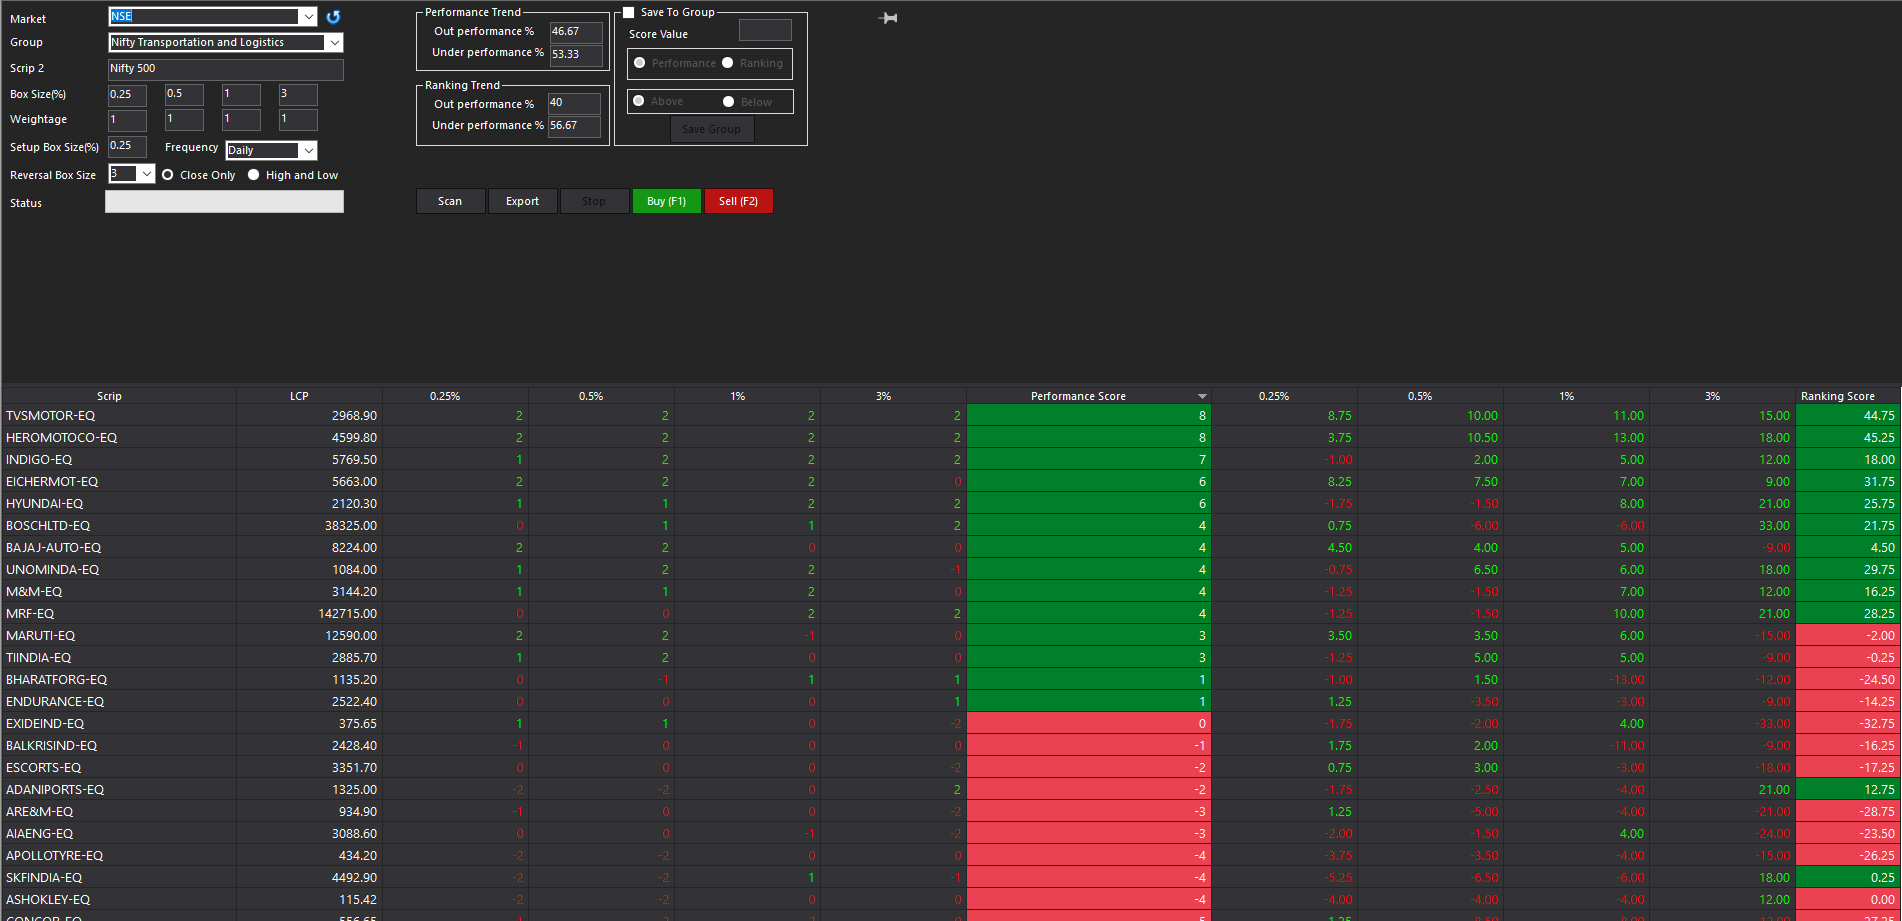
Nifty Transportation & Logistics vs Nifty 500 – RS Stock-Level Analysis
1. Sector Snapshot
- Outperformance (Performance Trend): 46.67%
- Underperformance: 53.33%
- Ranking Trend: 40% outperforming, 56.67% underperforming.
- Insight: Sector RS is positive but leadership is concentrated in a few strong stocks.
2. Top RS Leaders (Likely to Benefit Most if Nifty 500 Recovers)
Rank Stock Performance Score Ranking Score Comment 1 TVSMOTOR-EQ 8 44.75 Sector RS leader, strong across all timeframes. 2 HEROMOTOCO-EQ 8 45.25 Strong momentum and ranking stability. 3 INDIGO-EQ 7 18.00 Good RS even in a choppy market. 4 EICHERMOT-EQ 6 31.75 Steady RS trend; watch for breakout. 5 HYUNDAI-EQ 6 25.75 Healthy RS, could accelerate on sector strength. 6 BOSCHLTD-EQ 6 21.75 Consistent outperformer, defensive in corrections.
3. Neutral RS Stocks
Stock Performance Score Ranking Score Comment BAJAJ-AUTO-EQ 4 4.50 Needs ranking improvement. UNOMINDA-EQ 4 29.75 Solid RS, close to leadership zone. M&M-EQ 4 16.25 Holding up, watch for momentum shift. MRF-EQ 4 28.25 Positive RS but slower pace. MARUTI-EQ 3 -2.00 Needs sector tailwind.
4. RS Weak Laggards (Avoid Until Clear Turnaround)
Stock Performance Score Ranking Score ESCORTS-EQ -1 -17.25 APOLLOTYRE-EQ -4 -26.25 ASHOKLEY-EQ -4 -24.00 SKFNINDIA-EQ -4 -26.00 AIAENG-EQ -3 -23.50
5. Theoretical Note
In an RS setup:
- Numerator = Nifty Transportation & Logistics
- Denominator = Nifty 500
If Nifty 500 recovers and the Transport & Logistics index rises faster than it, RS will accelerate upward.
Current leaders are already outperforming in a weak market, so they could gain disproportionately in a broad market recovery.
DisclaimerThis analysis is for educational and informational purposes only. It is not investment advice or a recommendation to buy/sell any security. Market conditions can change quickly, and past performance is not a guarantee of future results. Please consult a registered financial advisor before making any trading or investment decisions. You are solely responsible for your own risk management and capital protection.
-
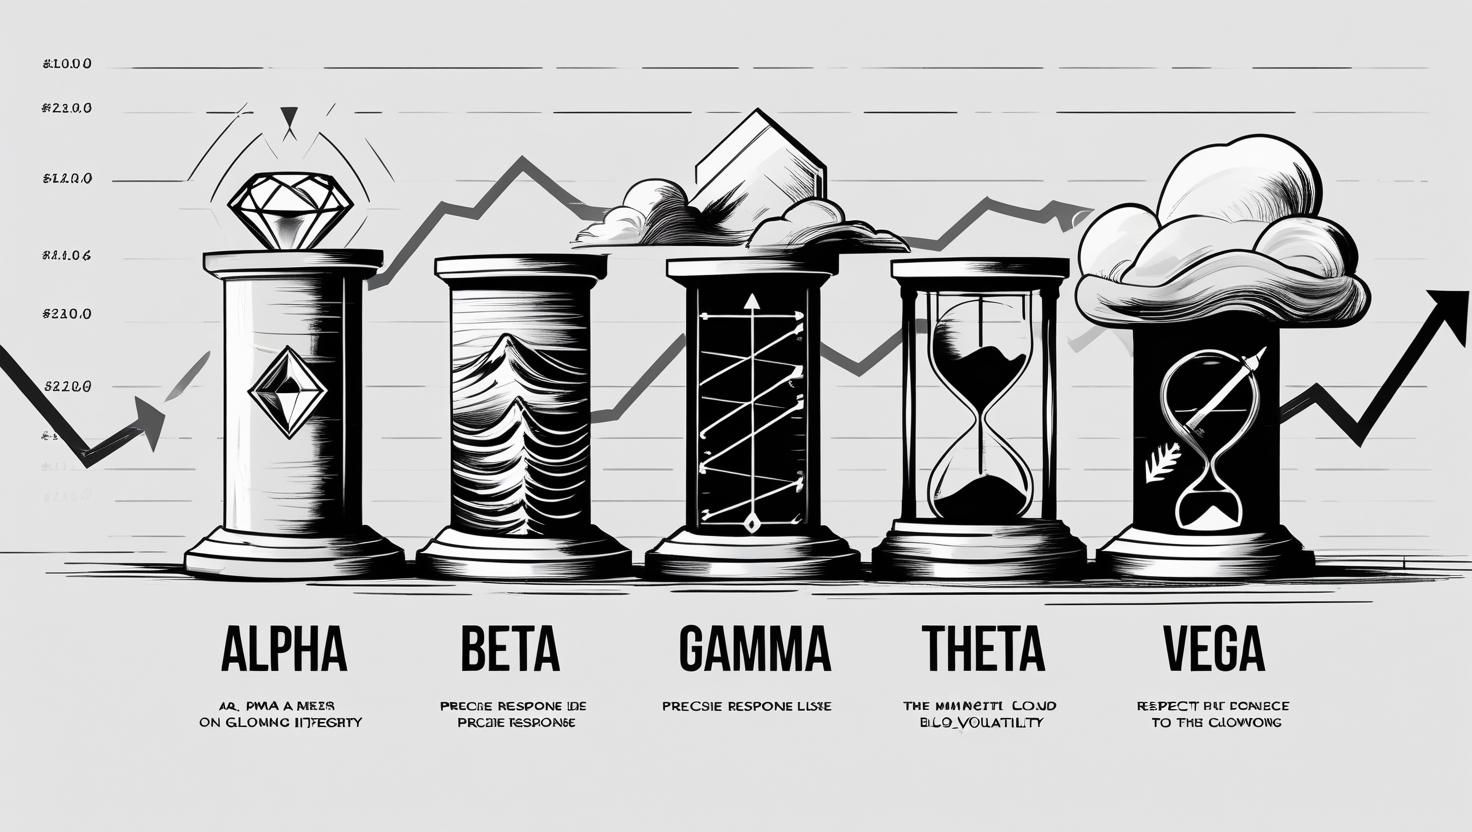
The Moral Greeks – A Complete Ethical & Psychological Compass for the Short Straddle Intraday Trader(When Market Math Meets Moral Mindset)
 Introduction – When Numbers Find Their Soul
In options trading, we live and breathe the Greeks — Alpha, Beta, Gamma, Theta, Vega.
They measure returns, sensitivity, time decay, and volatility risk. But the market is not just a place of numbers — it is a stage where discipline, emotions, and ethics play out every second.For a short straddle intraday trader, the game is not about chasing jackpots — it’s about controlled premium decay, precise execution, and risk survival.
That’s where the Moral Greeks come in — a way to see the technical Greeks through an ethical and psychological lens.Think of them as your inner compass:
Technical Precision + 🧭 Moral Discipline + 🧠 Psychological Control
️ The Moral Greeks – Core Meanings & Expanded Wisdom
1️⃣ Alpha – The Edge of Integrity

- Technical: Alpha is the excess return you generate over a benchmark.
- Ethical: In trading morality, Alpha is your moral surplus — the decision to take only the trades that fit your setup, even when greed tempts you to break the rules.
- Psychological: Alpha is your truth advantage — the courage to admit you’re wrong and exit quickly without ego.
Straddle Example: You have a rule to sell strikes 200± points from spot. Market feels slow. Your mind whispers, “Come closer for more premium.” Alpha says — No.Mantra: “My Alpha is born from my clarity and my honesty.”
2️⃣ Beta – The Edge of Alignment

- Technical: Beta measures sensitivity to market movement.
- Ethical: In moral terms, Beta is moral adaptability — the wisdom to align with changing conditions without losing your identity as a trader.
- Psychological: Beta is your emotional correlation — knowing the market’s mood without becoming its puppet.
Straddle Example: A quiet market with low IV? You sit tight, let decay work. Suddenly IV spikes on news? You trim your lot size — not because of panic, but because you’re aligned with new reality.Mantra: “I align with the market’s rhythm, but I am not its puppet.”
3️⃣ Gamma – The Edge of Response
- Technical: Gamma is the rate of change of Delta — how quickly your position’s sensitivity changes.
- Ethical: Gamma is responsible adaptability — you adjust only when the truth changes, not because fear screams in your ear.
- Psychological: Gamma is mental agility — the ability to respond with clarity, not react in chaos.
Straddle Example: NIFTY breaks VWAP with strong volume — your plan says exit one leg. You act instantly. But a single 5-point flicker? You stay calm. That’s moral Gamma.Mantra: “I respond, I don’t react.”
4️⃣ Theta – The Edge of Patience
- Technical: Theta measures time decay in options.
- Ethical: Theta is patience dividend — the faith in your edge to let small, consistent decay work in your favor.
- Psychological: Theta is composure in waiting — resisting the urge to close early just because “nothing is happening.”
Straddle Example: Market is calm, IV stable, and your MTM is +₹3000. Your plan says hold for ₹5000. Theta reminds you — time is your ally, not your enemy.Mantra: “I let time work for me, not against me.”
 ️
️
5️⃣ Vega – The Edge of Volatility Respect
 ️
️- Technical: Vega is sensitivity to implied volatility changes.
- Ethical: Vega is respect for uncertainty — knowing when volatility is too unpredictable for your style.
- Psychological: Vega is calm in chaos — staying centered when market noise rises.
Straddle Example: Budget day. IV is wild. You know this is not your arena. Moral Vega says — Capital saved is capital earned.Mantra: “I respect the storm, but I do not fear it.”
 ️
️
Table 1 – Moral Greeks in Ethical & Psychological LanguageGreek Technical Definition Ethical Edge Psychological Edge Pitfall if Unbalanced Alpha Outperformance vs. benchmark Integrity in decision-making Self-honesty in execution Chasing alpha → greed & overtrade Beta Sensitivity to market movements Moral adaptability Emotional stability High beta → market mood puppet Gamma Change rate of Delta (responsiveness) Responsible adaptability Mental agility High gamma → knee-jerk reactions Theta Time decay effect on options Patience dividend Composure in waiting Impatience → premature exits Vega Sensitivity to volatility changes Respect for uncertainty Calm in chaos Ignoring vega → blind to danger
Applying the Moral Greeks to Short Straddle Intraday TradingA short straddle intraday trader survives by balancing Theta’s reward and Vega’s risk while keeping Alpha, Beta, and Gamma in harmony.
Here’s how to use them in real market conditions:
Alpha – Integrity in Premium Selling
- Take only planned strike distances & IV setups.
- No “revenge trades” after a stop-loss hit.
Beta – Market Mood Awareness
- Hold strong in a calm, range-bound market.
- Reduce position size when volatility wakes up.
Gamma – Smart Adjustments
- Adjust on predefined triggers (VWAP break, IV spike, volume surge).
- Avoid over-hedging on small random moves.
Theta – Patience for Profitable Decay
- Trust your time advantage — don’t panic close early.
- Understand that flat periods are your income engine.
Vega – Volatility Respect

- Avoid trading in chaotic, news-heavy sessions.
- Remember: survival > action on high-risk days.
 Table 2 – The Moral Greeks Compass for Straddle Traders
Greek Ethical Rule in Straddle Psychological Rule in Straddle Alpha No trade outside plan; steady decay harvesting No jackpot chasing; SL respected Beta Align with market’s tone Avoid over-adjusting on noise Gamma Adjust only on structural change Respond, don’t react Theta Let time work for you Resist impatience Vega Respect high volatility Stay calm in chaos
🧭 One-Line Moral Compass
“My Alpha is my honesty
, my Beta is my balance , my Gamma is my graceful adjustment , my Theta is my patience , and my Vega is my respect for the storm ️.”
 Conclusion – A Trader’s Silent Code
Markets will tempt you to abandon your rules. They will bait you with “quick money” and scare you with sudden storms. The Moral Greeks are your shield — guiding you to:
- Trade with integrity (Alpha)
- Adapt with wisdom (Beta)
- Adjust with precision (Gamma)
- Wait with patience (Theta)
- Respect with humility (Vega)
A short straddle intraday trader doesn’t win by predicting every move.
He wins by surviving with discipline, letting time and structure pay him while protecting his capital like a warrior’s life force.
-

 The Turtle’s Way in Straddle Trading: Ethics, Endurance & Why We Never Chase Jackpots
Preface: The Quiet Victory
In a world obsessed with speed and spectacle, the slow, quiet, consistent trader is almost invisible. The crowd cheers for the trader who doubled his account overnight, but nobody notices the one who’s been compounding quietly for ten years without a single blow-up.
That’s fine — the turtle doesn’t need applause.
The turtle needs only one thing: to keep moving forward, steadily, day after day.This is the philosophy of the true straddle trader — a trader who treats jackpots as dangerous temptations, who believes in long-term survival over short-term thrills, and who wears patience like armor.
1. The Seduction of the Jackpot Trade

There’s something primal about the jackpot mindset. It’s adrenaline wrapped in greed:
- “This trade could change everything.”
- “One shot and I’m set for life.”
- “If I go big now, I can skip the grind.”
It’s intoxicating — and fatal.
Jackpots in trading are like sugar in dieting: they feel great for a moment, but destroy the foundation of your health over time.
2. The Harsh Truth About Jackpots
For every jackpot winner you see, there are dozens you don’t — traders who:
- Went all in and got margin-called.
- Turned small losses into catastrophic ones.
- Won big once, then chased that high until the account was gone.
Case Study: Victor Niederhoffer
A famous hedge fund manager who was brilliant, disciplined… until he wasn’t. After years of strong returns, he over-leveraged on what looked like a “can’t lose” trade. When it went wrong, it wiped out decades of success — a reminder that no trader is immune to jackpot temptation.
3. The Turtle vs. the Rabbit
 — A Trading Parable
- Rabbit Traders: Fast, emotional, thrilled by volatility. They love big wins, hate small ones, and take risks that end careers.
- Turtle Traders: Slow, deliberate, emotionally balanced. They accept small wins, avoid big losses, and think in years, not days.
In the short race, the rabbit wins.
In the long race, the turtle survives — and survival is victory in trading.
4. Ethics of the Turtle Path 🧭
Trading is not just math — it’s behavior, and behavior is shaped by values.
A turtle trader’s ethics are clear:Core Ethical Pillars
- Capital Respect — Never risk what you cannot replace.
- Process Over Outcome — Judge yourself by discipline, not luck.
- Emotional Balance ️ — No greed in wins, no despair in losses.
- Market Humility
 — Accept that you are not bigger than the market.
 - Long-Term Thinking
 — Every trade is part of a lifetime portfolio, not a lottery ticket.
5. Psychological Edge: Endurance > Speed
The market is a war of attrition. The impatient burn out; the patient compound.
Why the Turtle Wins Psychologically
- Rabbits seek excitement. Turtles seek consistency.
- Rabbits measure by today’s P&L. Turtles measure by the equity curve over years.
- Rabbits panic when wrong. Turtles adjust calmly.
6. Famous Turtles in History
- Jesse Livermore (late career lesson) — Made and lost fortunes multiple times. His greatest regret? Not respecting slow growth.
- Ed Seykota — “The elements of good trading are: (1) cutting losses, (2) cutting losses, and (3) cutting losses.”
- The Original Turtle Traders — A group trained by Richard Dennis in the 1980s who proved that method + discipline beats speed.
7. Historical Blowups from Jackpot Chasing

- Long-Term Capital Management (1998) — Brilliant PhDs, huge leverage, one wrong bet → $4.6 billion loss.
- Archegos Capital (2021) — Aggressive leveraged positions, collapse wiped out $20 billion in days.
Lesson: No matter how smart you are, jackpot chasing makes you fragile.
8. The Straddle Trader’s Daily Path

- Pre-Market Prep — Volatility check, key levels, premium analysis.
- Risk Sizing — Never exceeding set limits.
- Entry Discipline — Only trading defined setups.
- Calm Management 🧘 — Avoiding overreaction to intraday swings.
- Post-Market Review
 — Journaling results and refining process.
9. Turtle Trader Checklist
Before You Trade:
- Is my position size within plan?
- Have I defined my max loss?
- Am I taking this trade for process, not thrill?
- Does this trade align with my long-term edge?
During Trade:
- Am I calm?
- Am I reacting to price or to fear/greed?
After Trade:
- Did I follow my rules?
- What did I learn?
10. The Straddle Trader’s Oath
“I do not chase jackpots.
I walk the turtle’s path — slow, steady, and unshakable.
My goal is not one lucky day, but a lifetime of discipline.
I serve patience, I reject greed, and I finish what I start.”
Conclusion: The Turtle Owns the Track
The rabbit gets the headlines.
The turtle gets the retirement account.Trading is not about one trade — it’s about thousands.
The jackpot may look glamorous, but the slow compounding of discipline is the real wealth generator.So the next time the market whispers, “This could be the big one…” smile and remember:
A turtle may be slow, but it always gets there — with its capital, confidence, and career intact. Slow. Steady. Profitable. Always.
-
sometimes buying option may be tricky as for many factors but whatch core straddle falling so good & also 24500 ce selling too.
-
 Beyond Premium: 21 Questions Every Short Straddle Trader Must Ask
 ️ Vedic Invocation
"विज्ञानेन आत्मानं वेद यः स सर्वं विजानाति।"
Vijñānena ātmānaṁ veda yaḥ sa sarvaṁ vijānāti
— He who understands the Self through deep insight understands all that is worth knowing. From the Upanishads, this line reminds us: true mastery starts within — and trading is no different.
 ️ Introduction – “Why Questions Matter More Than Premium”
The short straddle appears simple — sell a call, sell a put — but underneath lies a battlefield of uncertainty.
It’s a setup where time, volatility, and price all converge to test the trader's mindset more than the method.Each candle tests your patience.
Each spike questions your risk boundary.
Each pause in the market becomes a mirror to your own stillness — or the lack of it.This is why strategy alone isn’t enough.
To evolve in this arena, you must ask deeper questions — not about price levels, but about self-awareness, ethics, and emotional posture.The 21 questions below are crafted to do exactly that.
Not to prove how much you know, but to reveal how honestly you trade.
21 Ethical & Resonance-Based Questions for Short Straddle TradersEach question is followed by a brief reflection on why it matters.
1. What was your emotional response during high volatility?
🧭 To measure your nervous system under chaos, not your strategy.
2. When the market moved sharply, did you stick to your stop-loss or adjust impulsively?
🧭 Tests whether you're anchored or reactive.
3. Have you ever traded because you were bored, not because your setup aligned?
🧭 Reveals emotional leakage into trading logic.
4. On winning days, were you centered — or did greed start whispering?
🧭 Victory can trigger carelessness. This reveals your post-win posture.
5. What internal dialogue saved you from panic on bad days?
🧭 Your inner voice is your first risk manager.
6. Did you feel peace after following your system, even in loss?
🧭 System-alignment > outcome. That’s mastery.
7. How often did you check your MTM? What does that frequency say about your mindset?
🧭 MTM anxiety is often a sign of attachment, not control.
8. When a trade went wrong, did you blame the market, or review your decision honestly?
🧭 Accountability defines your ethical foundation.
9. What part of the market’s movement started to feel intuitive to you?
🧭 Sensation of rhythm means you’re syncing with price behavior.
10. What market conditions made you feel most exposed? How did you respond?
🧭 Identifies where your edges blur and fear creeps in.
11. Was there any day you violated your position sizing rule? Why?
🧭 Temptation is the true test of principle.
12. Did you feel guilt in any trade decision — even if it was profitable?
🧭 Profit earned unethically corrodes discipline slowly.
13. Do you view short straddles as neutral or biased setups? Why?
🧭 Understanding your philosophical lens matters more than textbook logic.
14. Have you romanticized theta decay, or truly understood its limitations?
🧭 Traders often fall in love with decay — but forget decay doesn’t forgive.
15. What moment in the market forced you to grow emotionally?
🧭 Growth is rarely visible in charts — it's felt in how you absorb shocks.
16. Would you take the same trade if no one could see your P&L?
🧭 Purity is when ego no longer needs applause.
17. What ethical line do you refuse to cross in your trading?
🧭 Every trader must have a personal 'Lakshman Rekha' — or risk chaos.
18. What mistake did you repeat? What belief fed that repetition?
🧭 Behind every repeated error is a hidden belief system.
19. Do you trade volatility, direction, or behavior? What’s your internal answer?
🧭 Clarifies what you’re really responding to.
20. If your trading journal were alive, what would it say about your mindset?
🧭 Let your process speak. Let your notes become your therapist.
21. What kind of trader are you becoming — not in skill, but in spirit?
🧭 The only final question that truly matters.
🧘
 ️ Conclusion – “Beyond the Position Lies the Person”
Short straddles test you on both sides — not just of the strike price, but of your soul.
These 21 questions are your self-audit.
Ask them after every phase. Revisit them after every evolution. Let them be your compass when strategies fail.
Because eventually, the trader who wins is not the one with the best entry — but the one who never lies to himself.
️ Disclaimer
This article is intended as a self-reflective and philosophical guide for traders, especially those engaged in short straddle strategies.
It does not constitute financial advice, trade recommendations, or investment instructions. The questions posed are meant to deepen your awareness, ethics, and emotional discipline in the markets.All trading involves risk, and past experiences — whether profitable or challenging — do not guarantee future outcomes.
Always consult a registered financial advisor before taking any financial action.The use of references to Vedic or spiritual ideas is metaphorical and intended to enrich the philosophical dimension of trading psychology, not to promote any religious doctrine.
-
 around 10:45 a.m. after that a trending phase comes
 -

🧭 Zones of Memory: Where the Past Holds the Present
By Santanu Bez – A Theoretical Trading Reflection on Life, Memory, and Holding On
Introduction: More Than Just a ChartBehind every candlestick, there is a heartbeat.
Behind every price zone, there’s a memory.In trading, we speak of support and resistance—but in life, these are the moments that supported us when we were ready to collapse, or resisted us when we tried to escape unhealed.
This article is not about trading. It’s about you.
It’s about how charts mirror consciousness, how price zones are memory zones, and how markets remember—just like hearts do.Let’s journey into that sacred space between price action and self-reflection.
 Section 1: Price Always Returns to Memory In markets, price always revisits zones.
🧠 In life, we always revisit memories.Think of how price returns again and again to a previous zone. Not out of randomness—but out of familiarity. A chart doesn’t forget. Neither do we.
We, too, return to:
- The feeling of past failures
- The comfort of past strengths
- The confusion of unresolved moments
Just like candles approaching support, we hover around our psychological thresholds. We pause, react, doubt, and sometimes—bounce.
Table: Market Terms vs. Life Symbols🧮 Market Term  Life Metaphor
🪶 Meaning in Life Support Zone Emotional Resilience Zone Where we didn’t fall when life hit hard Resistance Emotional Limitation What prevents us from breaking through our old identity Breakdown Psychological Collapse When the pain overwhelms and transformation begins Retest Recurrence of Challenges Life rechecking if we’ve really healed or just moved on superficially Candle with Long Wick Micro Battle of Doubt A close-call between holding on or giving in Consolidation Inner Reflection Period Time when we pause, observe, heal
 Section 2: Retests Are Lessons, Not Punishments
The market doesn’t punish. It confirms.
When price revisits a zone, it’s not a punishment—it’s a test of memory.
Similarly, life retests us with:- Another failed attempt
- Another betrayal
- Another fear
But if you held once, you can hold again.
Memory is not weakness—it’s evidence of resilience. “Don’t fear the retest. Respect what it’s asking you to remember.”
🧠 Section 3: Insights from the Invisible
Support zones exist only when history exists. You don’t randomly become strong; your strength is always built on some previous refusal to break.🧱 The more times you held, the stronger your zone.
Even the market says this—when support holds repeatedly, it gains credibility. But sometimes, holding on is not growth—it’s resistance to change.
Not every bounce is a blessing. Sometimes, the breakdown sets you free.
🧘
️ Section 4: You Are the Chart Every candle is a version of you
Every level is a memory of something you’ve emotionally priced in
Every structure is built on emotion, belief, reaction, and recoveryYour life, like a chart, is not random.
It's a plotted map of your decisions, breakdowns, and recoveries.
 Conclusion: Trade Your Life with Memory and Mindfulness
Let us step back for a final reflection:
- There will always be zones you revisit
- There will always be moments you hesitate
- But you are not the candle. You are the entire chart.
Whether you bounce or break, what matters is:
Did you learn where your zones are?
Did you honor the parts of you that once held steady under pressure?Because support doesn’t lie.
Neither does your memory.So next time life brings you back to an old pain, an old test, an old edge—
Don’t panic. Pause. Reflect. Align.You are stronger than the candle.
You are the zone.
-
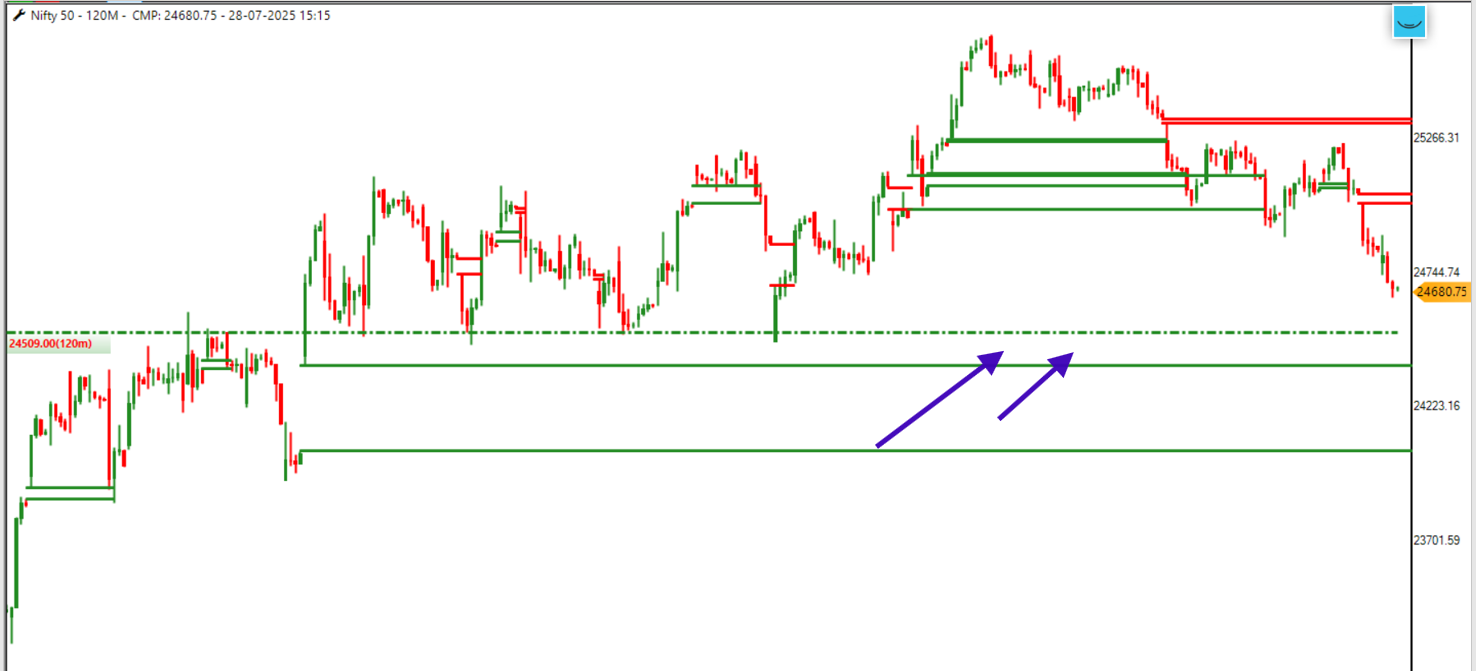
NIFTY 50 Technical Outlook – Short-Term Support Testing Zone
Date: 28 July 2025
 Time Frame: 120 Minutes
Current Market Price (CMP): 24,680.75
Recent Price Action: A Quick RecapAfter attempting a rally toward 25,266, the index failed to break higher and faced a clear rejection from that resistance band. What followed was a steady descent, now taking prices below key minor demand zones (marked in green), with the index nearing a critical short-term support cluster between 24,390–24,500.
Support Cluster Zone: 24,390–24,500 The area marked with purple arrows on your chart highlights an important demand belt formed through:
- Multiple prior swing lows
- A base of accumulation zone
- Breakout retest area
This price band has historically acted as a springboard, rejecting bearish attempts and inviting fresh buyers in the past. The more recent bounce from this zone adds credibility to its structural strength.
Key Technical Observations-
Volume-Weighted Behavior: Though not visible in this image, if volume increases near 24,500 with a long lower wick or consolidation, that would affirm institutional defense.
-
Structure Breakdown Alert: A clean breakdown below 24,390 may invalidate the support. Below that, eyes shift toward the next major base near 23,900, indicating ~2% downside risk.
-
Resistance Above: Any upside relief rallies may face a ceiling at 24,744, followed by the supply wall at 25,266 (marked in red). This area needs a high-momentum breakout to flip trend.
Bulls vs. Bears: Short-Term BattlezoneThis 24,390–24,500 pocket is now a make-or-break support zone for bulls. If held:
Expect quick 150–200 point mean reversion
 If broken, sellers could aggressively aim for 23,700 support
Strategy PointersFor Positional Traders:
- Watch price behavior on 15m–1H timeframes at 24,400 zone
- Look for bullish candle confirmation before considering long entries
For Option Sellers:
- A straddle/strangle can be considered only after market confirms base
- Implied volatility analysis needed before trade sizing
🧠 Final Take: “Respect Structure Until Broken”
The 24,390–24,500 zone is the last short-term fortress for bulls. If broken, the tone may turn risk-off. Hold it – and it’s a possible launchpad for short-covering rallies. Let price action and market tempo guide your next move.
-
Just it would be ce and by same logic, pe trade was in 2nd half innings
-
8617733783
-
Not sl meaning you're wrong. Structure is two poles where ur invitation of joystick & invalidate of view just keep on practice.
-
yes , if possible i will share some logic chart
-
@Saju Raj LEARN WEEKLY BUTTERFLY WITH BIAS , GOOD RR & RISK WELL CAPPED BY FIXED . FOR GETTING BIAS U CAN HELP STRADDLE PRICE BEHAVIOUR OF 400-+ STADDLE STRUCTURE
-
@Saju Raj SWING OR INTRDAY ??
-
Boring vs Exciting Trading Systems: ROI, Pros, Cons, Mental Health, and Long-Term Truth
🧭 Introduction
It starts the same for most traders.
You enter the markets with dreams of freedom, scrolling social media feeds filled with screenshots of ₹3 lakh days and overnight riches. Your heart races when you see a 5-minute breakout, and you tell yourself, “This is it. This is how I will change my life.”
You place trades with trembling hands, watch the P&L flicker, and either celebrate a sudden win or spiral into regret with a sudden loss.
You think you need excitement to get rich, but deep down, you yearn for peace while you grow wealthy.As months pass, some traders leave, drained by losses and stress. Others discover a secret:
“The path to long-term trading freedom is often boring, but it is steady.”
Yet, excitement in trading is not evil—it teaches you the market’s pulse, your emotional limits, and the power of risk and reward.
In this post, we break down what “boring” and “exciting” truly mean in ROI, risk, and mental health, helping you find a balance that aligns with your purpose, family, and long-term financial freedom.
1️⃣ What is a “Boring Trading System”?
Definition:- Rule-based, low-frequency, systematic trades.
- High-probability setups only.
- Uses stop-loss, position sizing, and risk management.
- Focuses on consistency and capital preservation.
ROI (in INR):- 2–5% per month (24–60% annualized).
- On ₹10 lakh capital, ₹20,000–₹50,000 per month.
- 5–10% drawdown (~₹50,000–₹1 lakh risk at max).
- Smooth, slow compounding.
Mental Health Impact:- Low anxiety due to clear plans.
- Reduces overtrading urges.
- Easier to maintain family and personal life alongside trading.
- Builds emotional resilience and patience.
2️⃣ What is an “Exciting Trading System”?
Definition:- Aggressive, high-frequency or discretionary trades.
- Trades on breakouts, news events, volatility spikes.
- Designed for fast ROI but with higher risk.
- Emotionally stimulating.
ROI (in INR):- 5–20%+ per month (highly variable).
- On ₹10 lakh capital, ₹50,000–₹2 lakh per month potential.
- 15–40% drawdowns (~₹1.5 lakh–₹4 lakh loss possible).
- Spiky equity curve.
Mental Health Impact:- Can create emotional highs (euphoria) during wins.
- Can cause stress, anxiety, and overthinking during losses.
- Sleep cycles and family time may get disturbed.
- Addictive tendencies may develop if not handled carefully.
3️⃣ Pros and Cons Table
Aspect Boring Trading System (₹) Exciting Trading System (₹) Pros Consistent ROI Low stress Easier to scale Predictable process < Lower drawdowns Fast ROI potential Engaging High learning curve Good for volatility capture Quick flips possibleCons Feels slow Needs patience FOMO during volatile moves High drawdowns Emotionally draining Risk of account wipeout Hard to sustain Can trigger overtradingROI Potential 2–5%/month (₹20K–₹50K on ₹10L) 5–20%+/month (₹50K–₹2L on ₹10L) Risk Profile Low to moderate High Longevity Sustainable for decades Often short-term unless highly disciplined Stress Level Low High Mental Health Stable, low anxiety Emotional swings, stress Drawdown Control Easier (₹50K–₹1L) Difficult (₹1.5L–₹4L)
4️⃣ Long-Term Compounding: The Wealth Builder
Boring System:-
3%/month → 42.5% annual.
-
Doubles capital in ~1.8 years.
-
Stays manageable for your health, family, and focus.
-
Example:
- Start: ₹10 lakh
- Year 1: ₹14.25 lakh
- Year 2: ₹20.3 lakh
- Year 3: ₹29 lakh
Exciting System:-
10%/month → 214% annual, if capital survives drawdowns.
-
Can double or triple capital within months in favorable conditions.
-
High mental cost; poor handling may lead to burnout or total capital loss.
-
Example:
- Start: ₹10 lakh
- Year 1: ₹32 lakh
- Year 2: ₹1.03 crore
- Year 3: ₹3.3 crore
 Reality Check: Most traders fail to maintain high ROI systems due to mental stress, lack of discipline, and large drawdowns.
5️⃣ Mental Health: The Overlooked Truth
 Boring systems allow you to:
- Sleep peacefully without position anxiety.
- Avoid screen addiction.
- Trade with a calm mind, leading to better decision-making.
- Enjoy family, hobbies, and health alongside trading.
Exciting systems may:- Create emotional highs and lows.
- Cause overconfidence during wins and depression during losses.
- Increase health issues (stress eating, poor sleep).
- Impact family relationships if trading dominates your mood and time.
️ Which Should You Choose? If you want peace, sustainable growth, and family-life balance, start with boring systems. If you want fast growth with high risk, allocate only a small portion of your capital to exciting systems while protecting your core wealth with boring systems. Best model for many:
80% capital in boring systems, 20% in exciting systems under strict discipline.
Disclaimer:This post is for educational purposes only and does not constitute financial advice. Trading carries risks, and past performance is not indicative of future results. Consult your financial advisor before making trading decisions, and trade only with money you can afford to lose.
🪄 Final Words
“A boring system pays your bills and protects your mental health. An exciting system teaches you markets and risk but demands emotional mastery. True trading freedom is the art of balancing both.”
-
“I believe that entry must align logically with structure and context, reflecting the story the market tells. Exit, however, must be surrendered objectively to the plan, without hesitation or emotional interference. I have found this truth deeply in the practice of the short straddle, where entry is crafted by logic, but survival and success come only through disciplined, objective exits.”
-
@Tushar T yes usefull to understand market dyamic
-
please add indicator section in straddle/rs/spread watchlist like market watch has it @Definedge
-
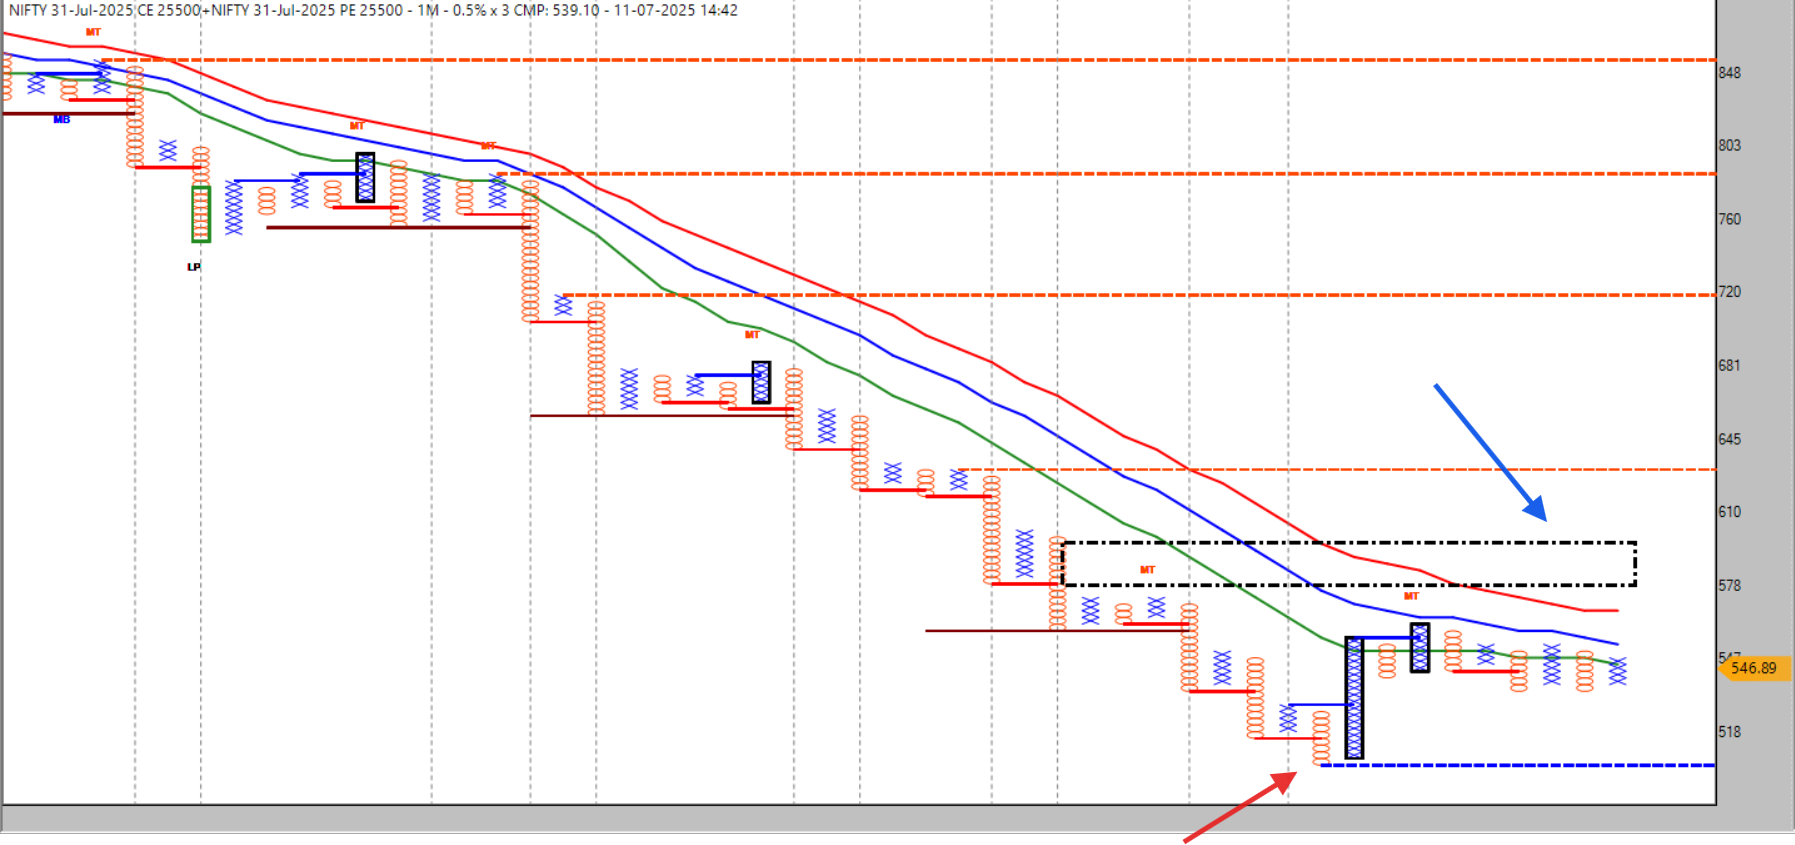 above 600 with folow through , nifty can be good directional smile
 & below 500 again directional pain
 ( enjoy theta eating )
 -
@SANTANU BEZ
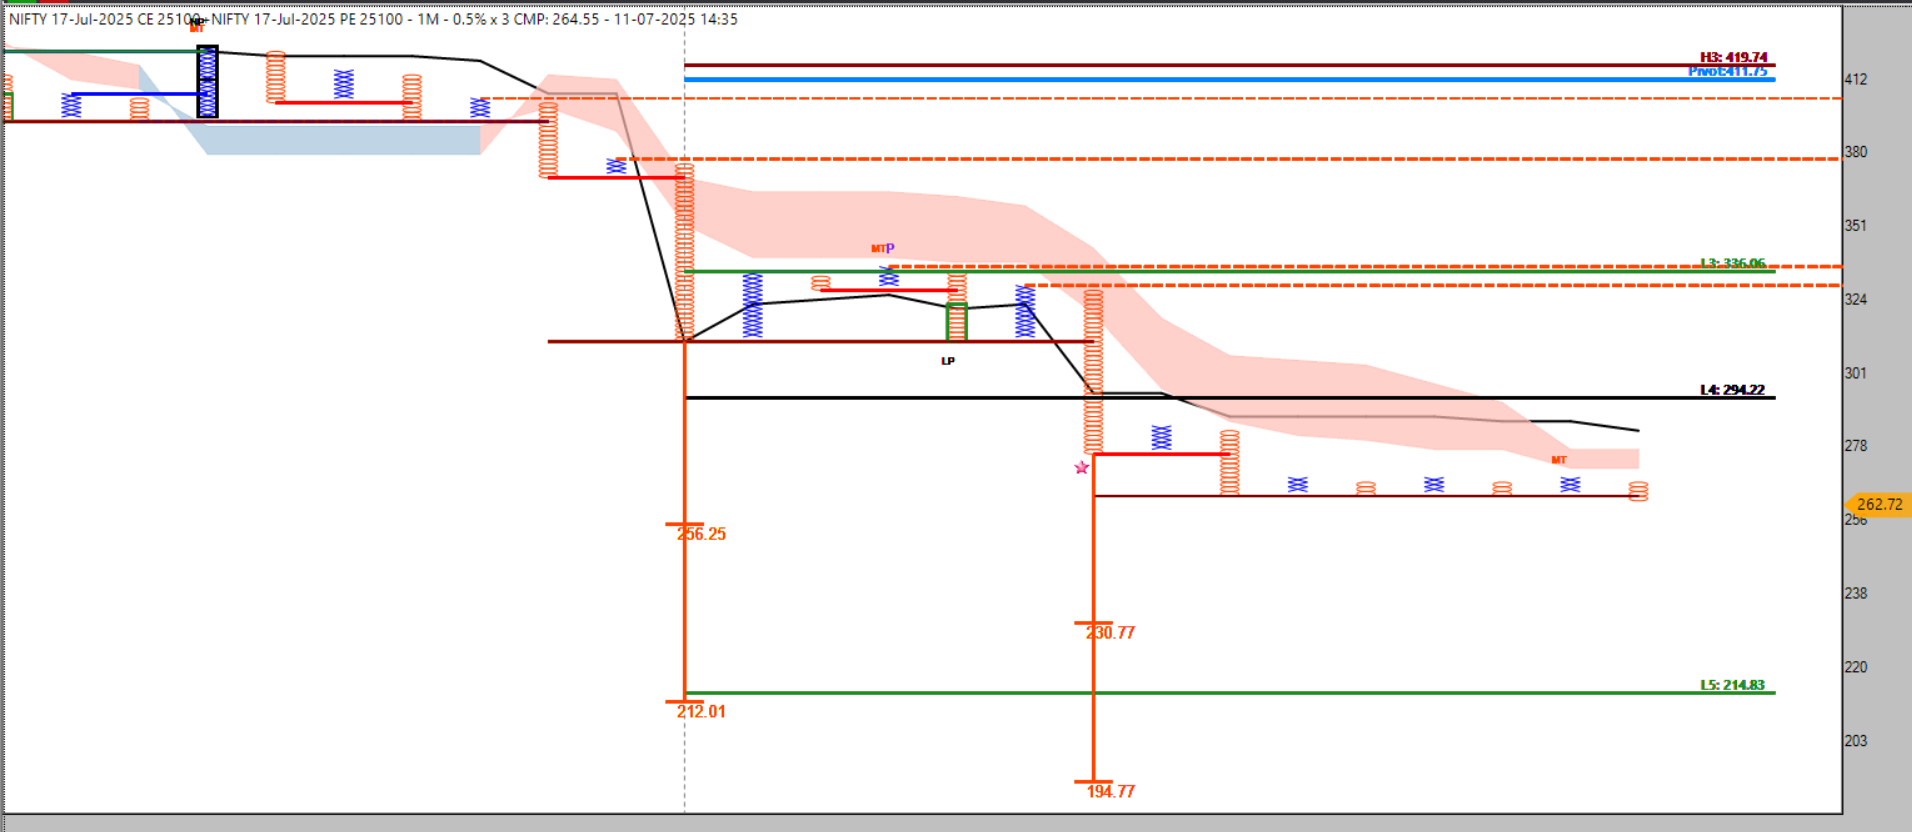 day end closed rest 20% at 265 . 309 to first book at 277 (80%) & rest now ( 20%) .
 -
@Nishant Paul which process say sir , execution i do algo way by buzzer help and even trade management all .... but algo not high knowledge sir
-
 ️ “The Abhimanyu Context and Exit Problem in Modern Trading”
🪐 Introduction
️ “A warrior who knows only to enter a battlefield but not to return, leaves behind victory.”In the Mahabharata, Abhimanyu knew how to enter the Chakravyuh but not how to exit, leading to his heroic yet tragic end.
Modern traders often become Abhimanyu in the markets:
They know how to enter a trade but do not know how to exit safely , getting trapped in volatility, emotions, and chaos.
The Abhimanyu Context in Trading-
Abhimanyu learned half the complex strategy (entry), but not the pathways out.
-
Traders learn half the skill 🪙 (when to enter) but:
- Do not define clear exit conditions.
- Do not prepare for adverse situations.
- Do not know when to book profits or accept a small loss gracefully.
️ “Yuddh mein pravesh ka gyaan rakhna yatharth hai, par nishkaashan ka gyaan rakhein bina veerta bhi vyarth ho jaati hai.”
(“Knowing how to enter battle is necessary, but without knowing how to exit, even bravery is futile.”)
Why the Exit Problem is Severe in Trading1️⃣ Emotional Traps:
 Fear prevents accepting loss.
Greed resists booking profits.
Hope keeps you stuck.
 Ego says, “I cannot be wrong.”
2️⃣ Battlefield Complexity:
Rapid price swings.
️ Gaps against your position.
Time decay eroding potential profits.3️⃣ Half Knowledge:
Entry plans are detailed.
Exit plans are vague or missing.️ “Arjun ne Krishna se poocha, yeh yuddh kab samaapth hoga? Krishna muskuraye aur bole, jab tumhe samay par viram lena aa jaaye.”
(“Arjuna asked Krishna, when will this battle end? Krishna smiled and replied, when you learn to pause at the right time.”)
️ The Abhimanyu Exit Solution Framework1️⃣ Decide Exit Before Entry
Clarify:
When will you take profit?
When will you accept a loss?
When will you exit if neither occurs within time?🧘 “The mind remains calm when the plan is clear.”
2️⃣ Layered Exit Strategy 🪜
Take partial exit at initial profit.
Trail remaining position for extended move.
Use time-based exit if the move stalls.
3️⃣ Embrace Small Losses
 ️ “A soldier retreats not from fear, but to return stronger.”
Exiting with a small loss preserves capital and your mindset for the next opportunity.
4️⃣ Track and Refine
Record exit effectiveness.
Note drawdown before profit.
Adjust rules to sharpen exit discipline.
5️⃣ Emotional Discipline 🧘
️Your mind will whisper:
“Just hold a bit longer...”
“What if it recovers now?”Learn to silence the internal battle
️ by executing your exit plan without hesitation.️ “Dhairya se bada hathiyaar yuddh mein koi nahi hota.”
(“No weapon is greater in battle than patience.”)
Entry vs Exit Checklist Aspect Entry ExitFocus Opportunity Risk & Protection Plan Clear, structured Often missing Emotion Excitement Fear, hesitation Objective Enter battlefield Return safely Power Skill to act Wisdom to withdraw
 Conclusion️ “Abhimanyu was a brave warrior, but the battlefield demands not just courage, but the wisdom to return.”
Trading is the same:
Entry is only half the victory.
Exit defines your survival, growth, and peace.
Learn to step back with grace.Avoid the Abhimanyu trap
 ️ by mastering planned, disciplined exits so your trading journey remains a story of return, learning, and growth—not of a heroic but unfinished battle.
️ DisclaimerThis article is for educational purposes only and is not investment advice. Trading involves risk. Please backtest and paper trade any exit framework before applying it with real capital.
---
Metaphor Usage Disclaimer:
Mahabharata references are used only as metaphors for clarity in trading psychology. No religious or Dharmic intentions are implied. -
-
yes my 25100 still also drifting , menas still it's not over
-
awesome trade with soild logic
-
keep it contiue sir , it will show with time how it's good for self retrospection
-
 ️ Beyond Signals: What Makes an Indicator Truly Useful in Trading?
“Indicators do not trade the market. You do. But the right indicator can teach you how the market breathes, how to enter without fear, and how to ride a wave with discipline.”
Many traders spend years searching for that “one perfect indicator” to make them profitable. They collect setups, signals, and colorful overlays on charts—yet remain stuck, frustrated, and inconsistent.
The reason?
They never asked the deeper question:
What makes an indicator truly useful in the first place?
A serious trader understands that for an indicator to earn its place on your chart, it must align with three essential dimensions:
Execution – Does it help you act decisively?
Comprehensive Price Study – Does it help you understand what the market is doing?
Trade Management – Does it aid in protecting and optimizing your trades once taken?Without fulfilling these three conditions, an indicator is just another distraction. When aligned with them, it transforms into a partner that empowers your strategy, sharpens your discipline, and reduces emotional noise.
In this article, we explore these three dimensions deeply, illustrating how to evaluate any indicator you use to determine whether it deserves your trust and screen space.
1️⃣ Execution: An Indicator’s First Test
What is execution in indicator context?
Execution means the indicator provides clear, objective signals that reduce hesitation and emotional noise. It should help you:- Identify when to act (entry and exit triggers).
- Define your risk immediately by indicating when your trade idea is invalidated.
- Filter noise so you are not second-guessing with every tick.
Key reflection questions:
Does your indicator have a clear actionable state (on/off, above/below, color change) that triggers your action?
Does it minimize ambiguity, or does it create more questions before entry?
Does it support timeliness so you don’t miss high-probability moments?An indicator failing this test becomes a chart decoration rather than a tool for execution.
2️⃣ Comprehensive Price Study: From Fragmented Signals to Market Understanding
What is comprehensive price study in indicator context?
It means the indicator should allow you to understand the market environment, not just print signals. The best indicators:- Integrate structure, momentum, and volatility.
- Provide insight into whether the market is trending or ranging.
- Help you interpret the strength or weakness behind moves.
- Adapt to changing conditions rather than rigidly giving the same signals everywhere.
Key reflection questions:
Does the indicator help you see the structure of the market?
Does it adjust in varying volatility environments, or does it give false signals when the market slows down?
Does it add layers of market context, or is it just a binary on/off switch?Indicators that pass this test become educators rather than just tools, helping you see markets with greater clarity.
3️⃣ Trade Management: Does Your Indicator Help You After Entry?
What is trade management in indicator context?
Trade management is the art of navigating an open position until its logical closure. A good indicator should:- Provide trailing stop logic or dynamic levels that adapt with price.
- Help identify partial exit zones or warning signals if momentum weakens.
- Adjust to volatility so you can lock profits while giving the trade room to breathe.
Key reflection questions:
Can you use your indicator’s levels for trailing stops?
Does it help you decide when to scale out partially?
Can it guide you in holding your trade confidently during adverse small retracements?Indicators that fail this test often lead to panic exits, inconsistent profit capture, or allowing small winners to become losses.
Why Most Indicators Fail These Tests1️⃣ They signal entries without helping manage risk or trade lifecycle.
2️⃣ They provide signals disconnected from broader market context, leading to whipsaws.
3️⃣ They do not adapt to volatility or trend conditions, giving the same signals in a 100-point range and a 10-point chop.
Quick Comparison Table: Indicator Evaluation GuideDimension What It Should Provide Ask Yourself Execution Clear, objective signals that reduce hesitation Is the signal actionable without confusion? Comprehensive Price Study Context, trend/structure, momentum, volatility integration Does it help you understand the market’s current environment? Trade Management Trailing stop logic, adaptive exit support Does it help manage and optimize your position post-entry? Use this table to audit any indicator you currently use before letting it consume your attention during live markets.
How to Evaluate an Indicator PracticallyHere’s a practical, professional workflow you can use to test any indicator:
Step 1: Test for Execution
- Backtest 50–100 signals. Was the entry condition clear in real-time?
- Check emotional comfort: Does the indicator reduce hesitation during execution?
Step 2: Test for Price Study
- Observe how the indicator behaves during trends, ranges, and news spikes.
- Note if it helps you understand what the market is doing before triggering a trade.
Step 3: Test for Trade Management
- Track how the indicator’s signals or levels could be used to trail stops or take partial exits.
- Test whether it adapts during volatile conditions or gives premature exit signals.
If your indicator aligns with these three pillars, it can become a true partner in your trading workflow, supporting systematic, stress-reduced trading.
🩶 Final Reflection: Indicators Are Assistants, Not Masters
An indicator, no matter how advanced, is not a replacement for your thinking, discipline, and adaptability.
It should:
Help you execute confidently.
Help you understand the market’s context.
Help you manage the lifecycle of a trade.If your indicator cannot support all three, consider it as a supplementary filter, not your system’s core.
 ️ Conclusion: A Call to the Serious Trader
Indicators are tools. Your mind is the craftsman.
A powerful indicator system should be tested, studied, and internalized within these three dimensions. Only then will it help you become a disciplined executor, a patient market reader, and a wise trade manager.
Whether you are building an intraday structure-based system, a directional swing framework, or an option premium study approach, applying these three lenses will ensure every indicator you use truly earns its place on your screen.
️ DisclaimerThis article is for educational purposes only and reflects personal learning and systematic frameworks developed through trading experience. It is not financial advice or a recommendation to trade any security or instrument. Trading in the financial markets involves risk, and you should consult your financial advisor before making investment decisions based on any methods or frameworks discussed here. Past performance does not guarantee future results.
-
@SANTANU BEZ
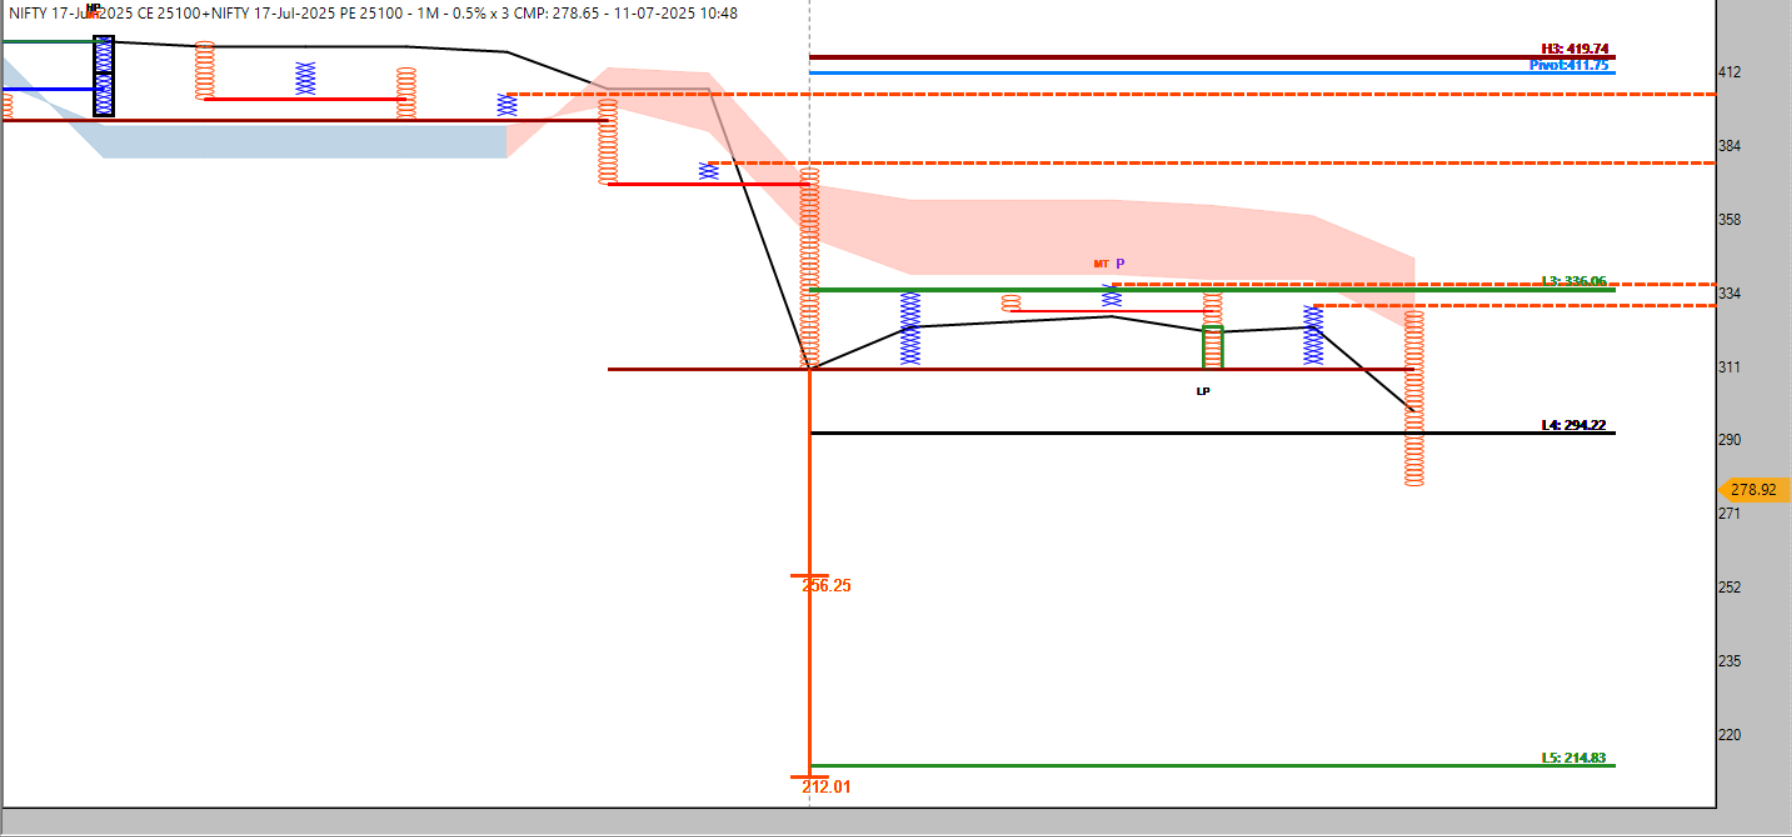 done 30 point book 80% position , rest c2c if 256 comes good then
 -
@Prashanth Rao for a good trade it's best practice sir as i am 200-+ straddle trading , one need weak & another strong for ur good trade outcome
-
@SANTANU BEZ
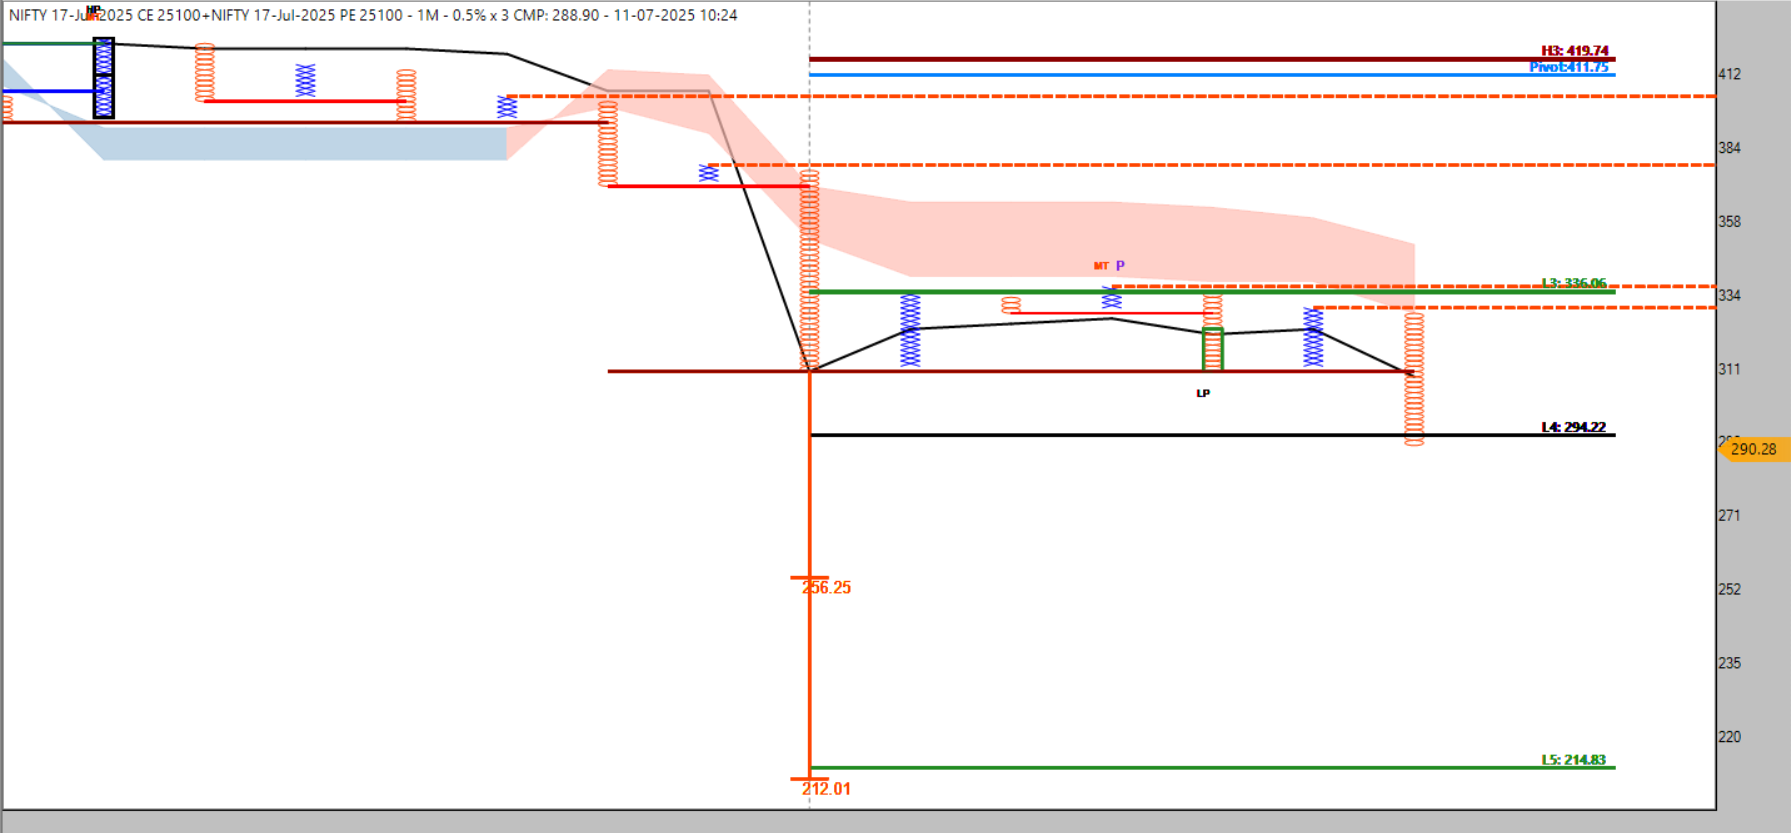 still 20 point
 -
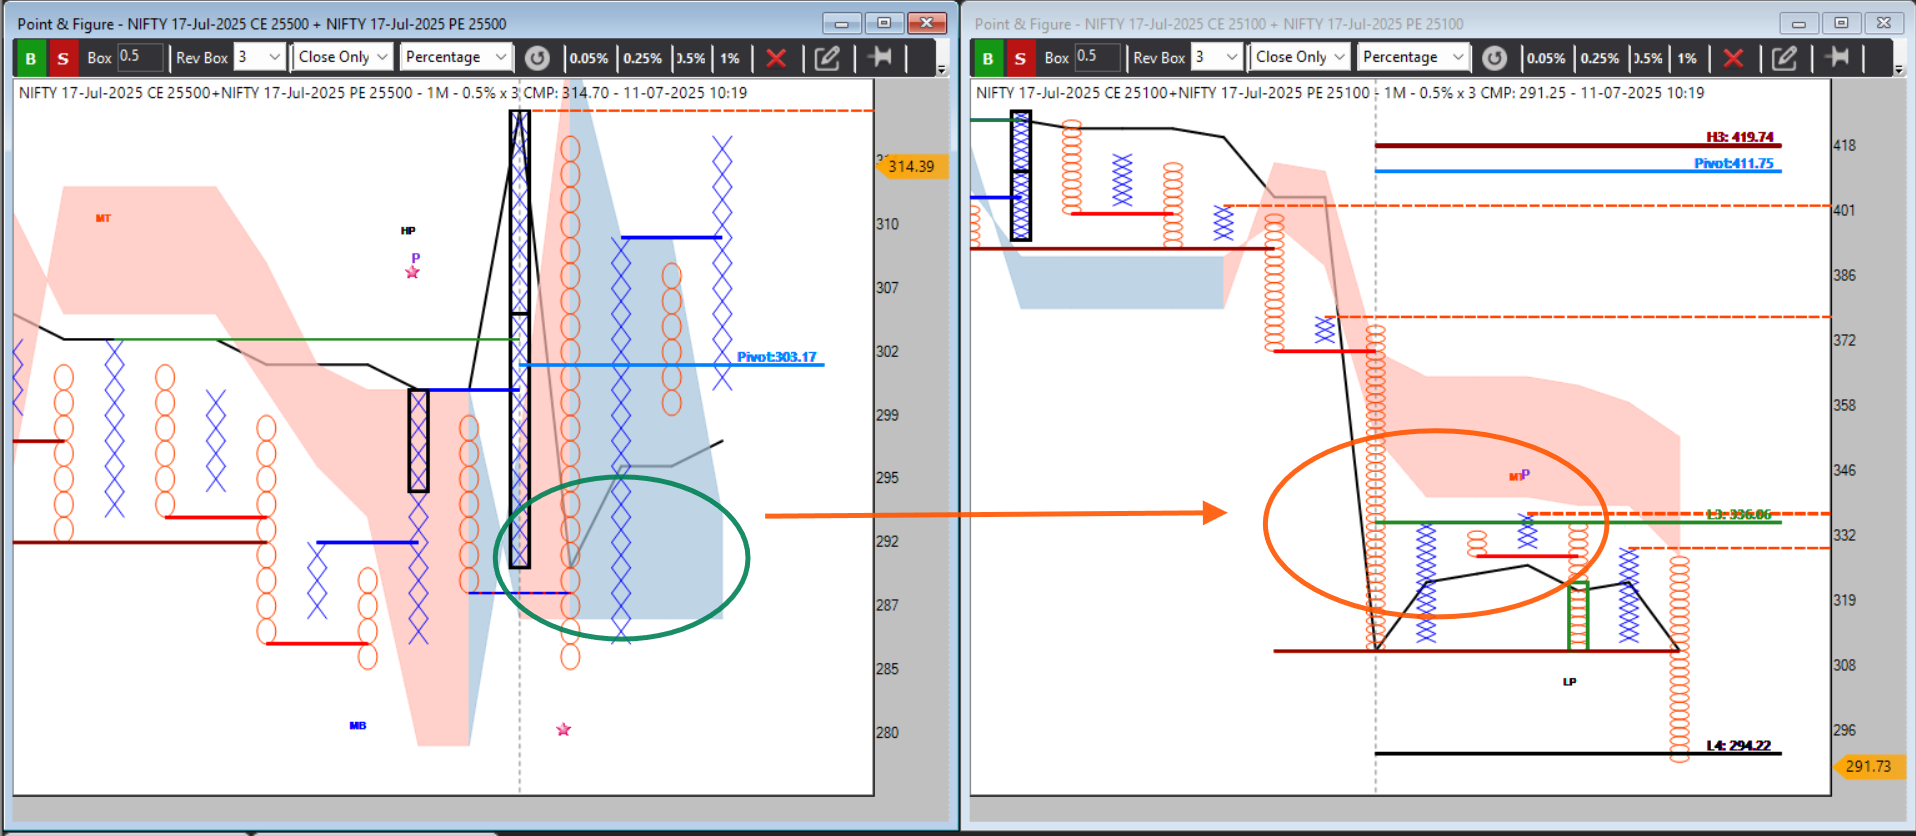 selection logic d-smart back up, here is link in details on it
 -
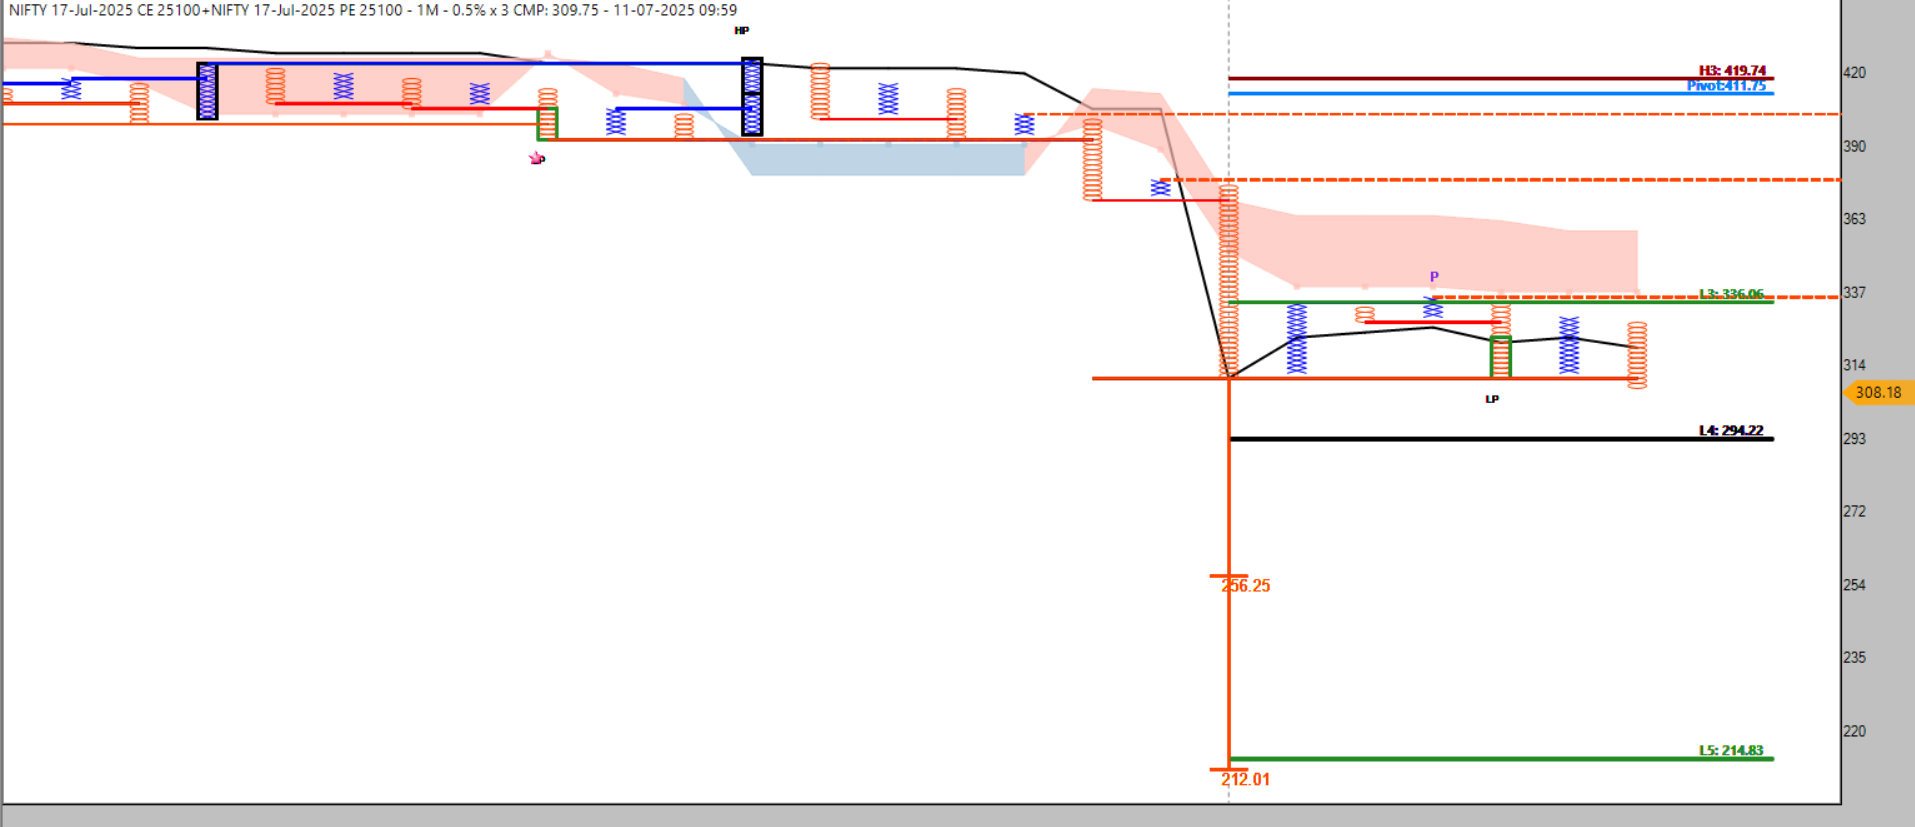 let's see
 -
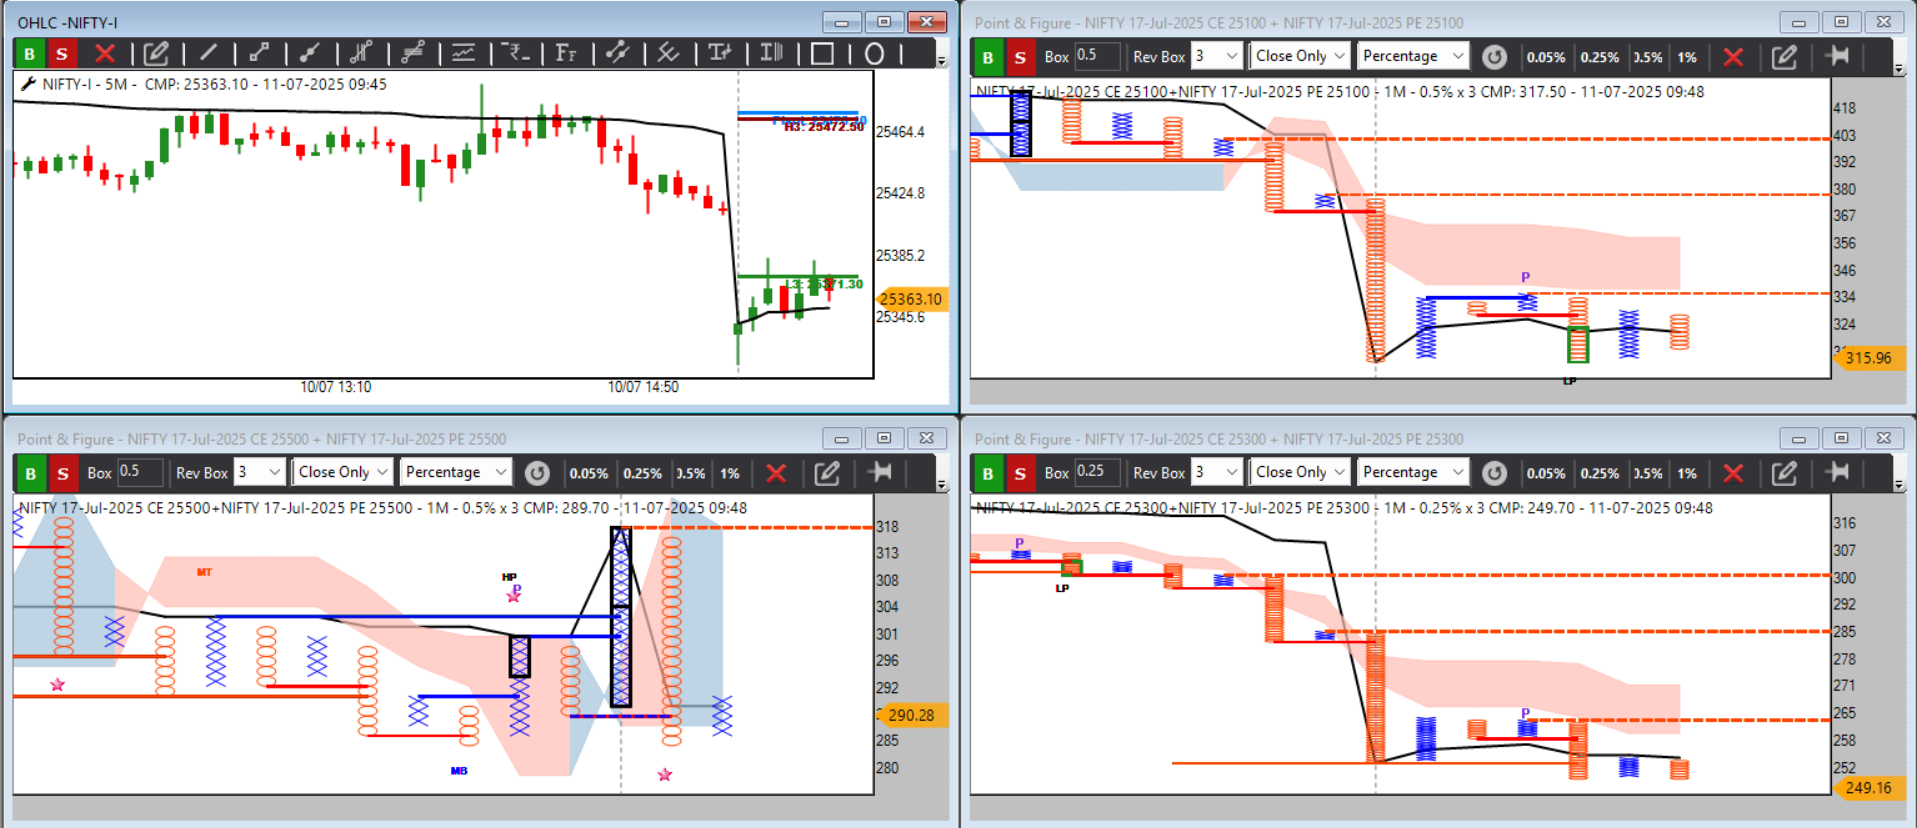 bettter wait , more 15-20 min
 -
https://forum.definedgesecurities.com/topic/3955/using-200-straddles-with-d-smart-to-decode-market-pressure-a-structural-approach by this we can see clearlt upper straddle 25700 become bullish & 25300 become weak as below d-smart , so 25300 short good with some personal stop-loss level with cam based or custom target
-
@Ankur Verma 25300 or lower straddle morning give good money almost 45-55 points on 200-+ straddle study framwork
-
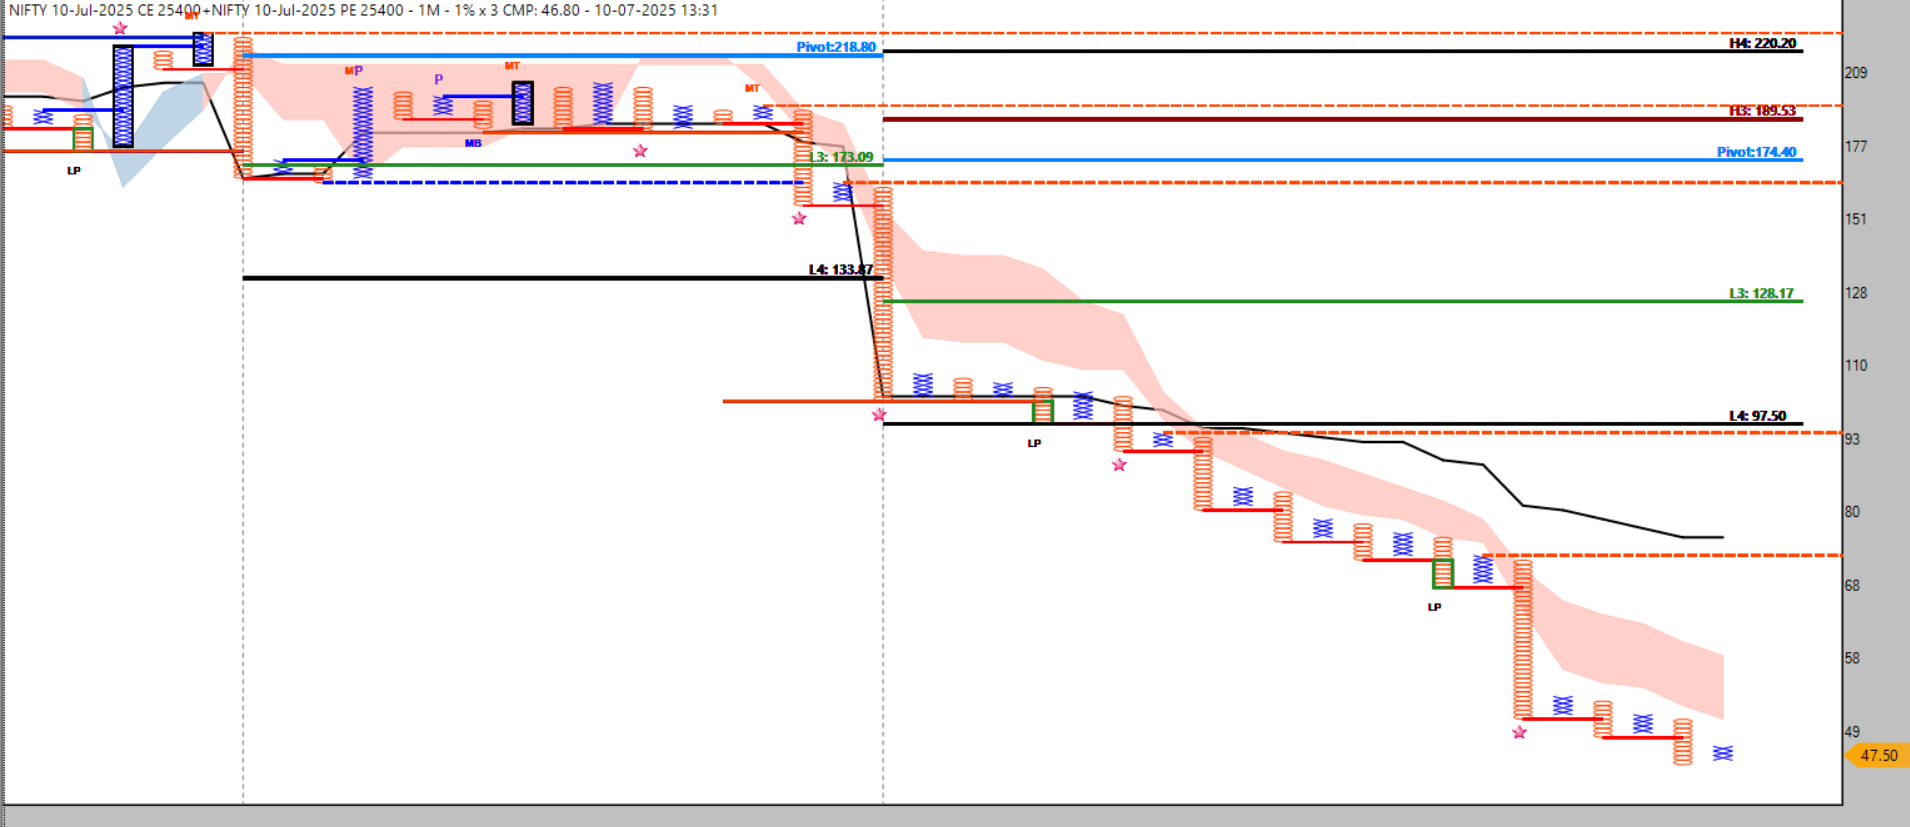 Zero to Hero? Wait! Read This Before Expiry Gamble.
Everyone is rushing into “zero to hero” trades near expiry hoping for overnight riches.
But until today, NIFTY 25400 remains structurally bullish, making a big expiry spike highly unlikely unless the structure breaks.
-
Why I Trade 200± NIFTY Straddles (And When to Flex with ATR/ADR) By Santanu Bez
Have you ever wondered why I consistently trade 200± NIFTY straddles instead of ATM straddles?
Many traders ask me, curious why I use this structured approach when the market changes daily.
Here is a logic-driven, practical explanation that may transform your straddle trading perspective, especially if you seek systematic, low-stress, scalable intraday income using the D-SMART Contra method.
️ The Beauty of 200± Straddles Fixed strike distances (Spot+200 and Spot–200) give clear structure.
No emotional confusion on where to position each day.
Clean Renko/PnF and premium ratio charts for analysis.
Manageable premium decay without ATM’s rapid stress.
Backtested and real trades confirm high hit rates for small, consistent targets.In a market of infinite uncertainty, fixed structure anchors your emotional and operational stability.
But What About Volatility?Markets do not remain static.
Daily ATR (Average True Range) and ADR (Average Daily Range) fluctuate, shifting premium behavior.
On low volatility days:
- 200± may feel too wide, with lower premiums.
On high volatility days:
- 200± may feel too tight, risking quick stop-outs.
Should you adjust daily with ATR/ADR flex?
 Theoretically, yes.
Practically, frequent changes create:- Analysis overload.
- Inconsistent learning cycles.
- Emotional fatigue from constant recalibration.
 The Best of Both Worlds: Anchored Flexibility My refined approach:
“Fixed 200± as the default, ATR/ADR-based adjustment only when volatility regime & value of underlaying shifts.”
🪄 How It Works:
Use 200± straddles daily by default under normal ATR/ADR conditions. If ATR/ADR changes ≥30% from your baseline (around 180–200 on NIFTY), adjust strikes:- ATR = 250 → 0.8 × 250 = 200 → Use 200–250±.
- ATR = 300 → 0.8 × 300 = 240 → Use 250±.
- ATR = 150 → 0.8 × 150 = 120 → Use 100–150± if premiums remain viable.
This aligns your strike distance with the market’s real movement potential while maintaining structured discipline.
Premium Sufficiency as a FilterBefore executing any straddle:
Check combined premium:- If too low (₹30–₹50): Theta benefit isn’t worth it; consider ATM with tight SL or skip.
- If high due to events: Ensure strike adjustments align with acceptable risk.
Always trade only when premium justifies the trade.
ATR Bands: A Silent GuideRather than recalculating daily, plot:
- 1 ATR above and below spot on your NIFTY chart.
If 200± strikes fall within the ATR band: alignment confirmed.
If ATR bands significantly exceed 200±: consider strike adjustment.This keeps volatility awareness while avoiding daily complexity.
 Why This Approach Works Simplicity: Consistent, emotion-free execution.
Volatility Awareness: Adjust only when truly necessary.
Emotional Stability: Prevents over-analysis and stress.
Risk Consistency: Exposure aligns with volatility.
Scalability: Easy to replicate while scaling up.
️ Practical Comparison TableAspect Fixed 200± ATR/ADR Flex Simplicity Easy ComplexVolatility Matching Limited StrongEmotional Load Low HigherPremium Consistency Stable VariablePractical Returns Reliable Potentially higher in high ATR
️ Final Takeaway“Fixed 200± straddles as your core execution plan, with ATR/ADR flex only during meaningful volatility shifts, is the best of both worlds for systematic, low-stress, scalable straddle trading under the D-SMART Contra framework.”
This approach allows you to:
Respect market structure,
Harness theta decay,
Align with volatility context,
without sacrificing operational simplicity.
️ DisclaimerThis article is for educational purposes only and reflects my personal trading approach and learning journey. Trading options carries risk. Always consider your risk tolerance, capital, and seek professional advice if needed. Past performance or personal strategy suitability does not guarantee future results. Trade responsibly.
 Stay structured, let your discipline compound, and evolve with the market systematically.
– Santanu Bez
-
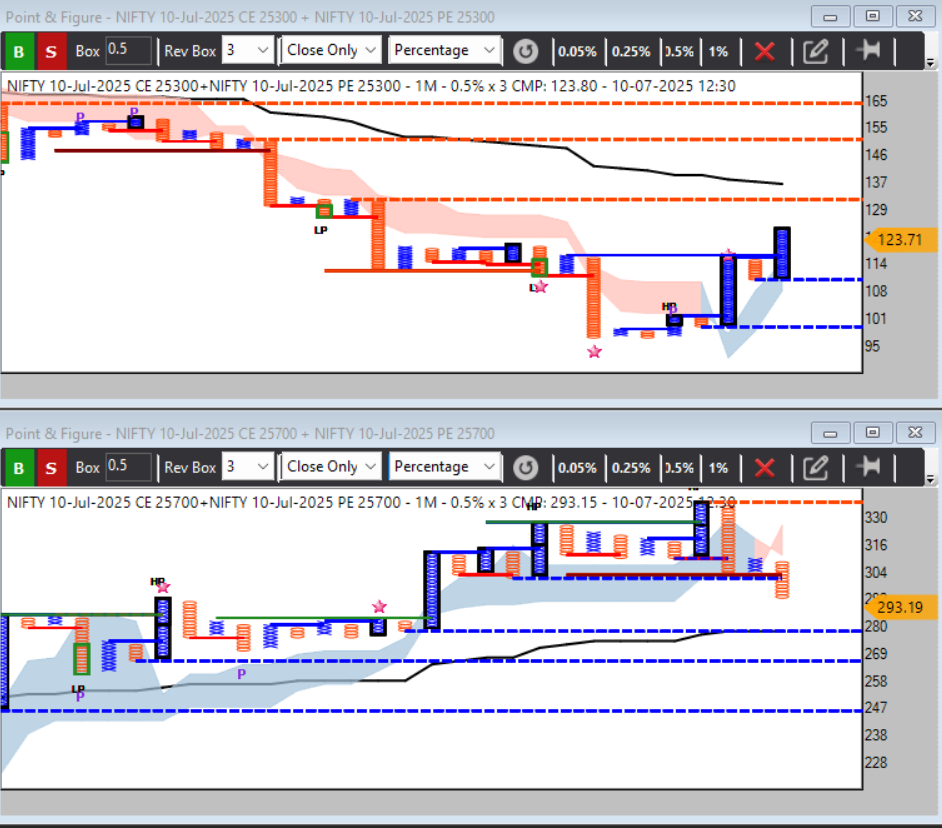 25300 if above vwap ft , tide chancge may be
 -
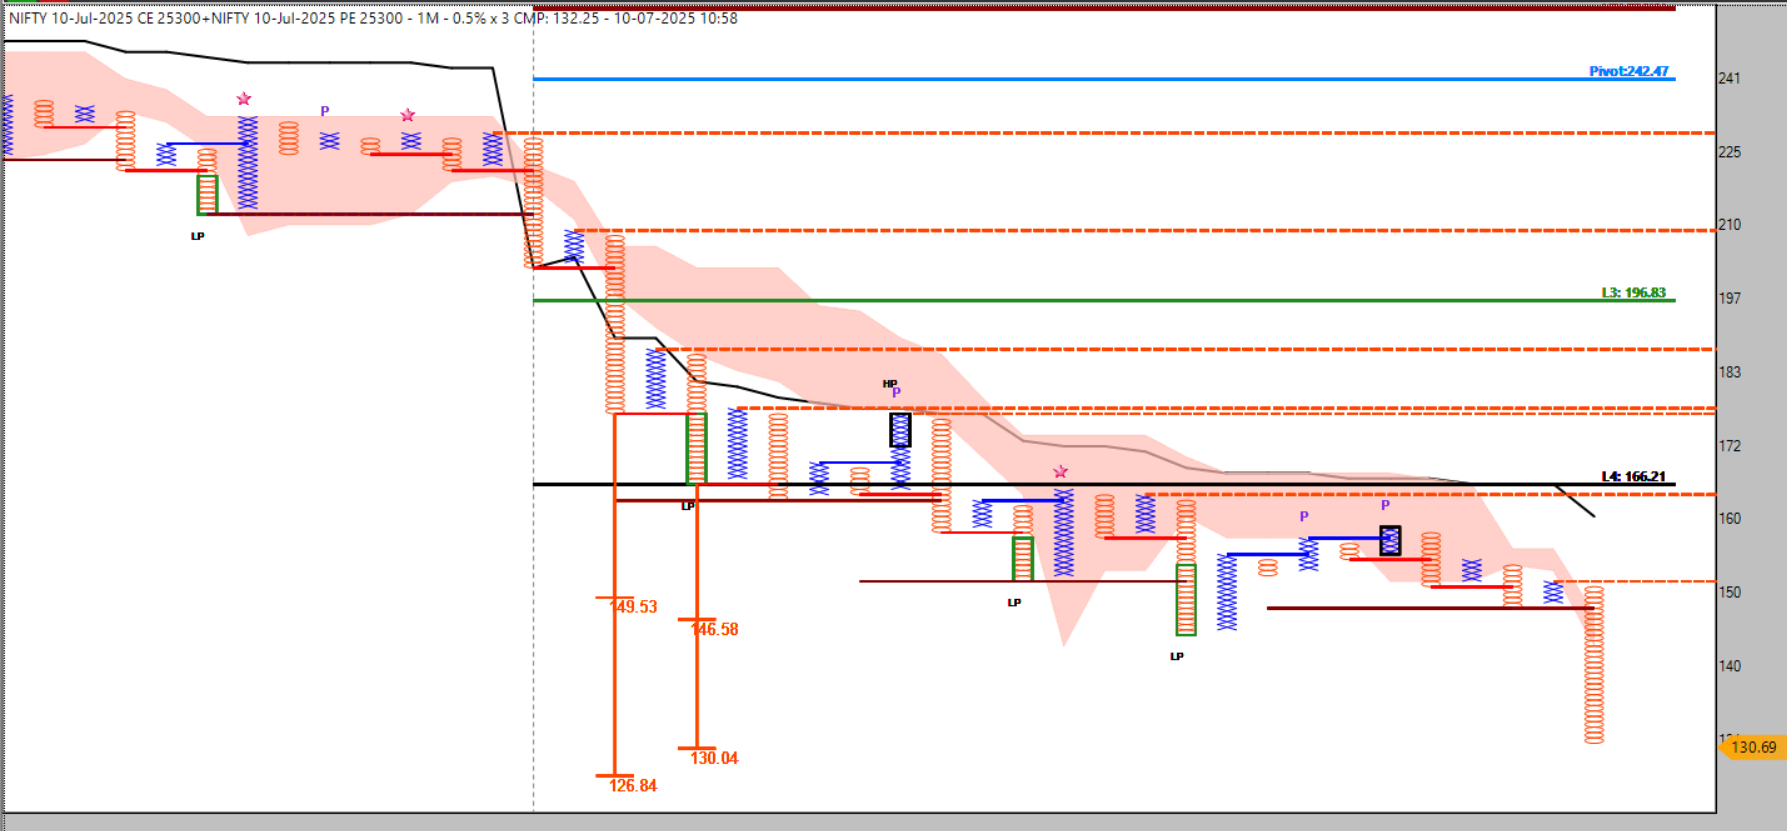 all book
 -
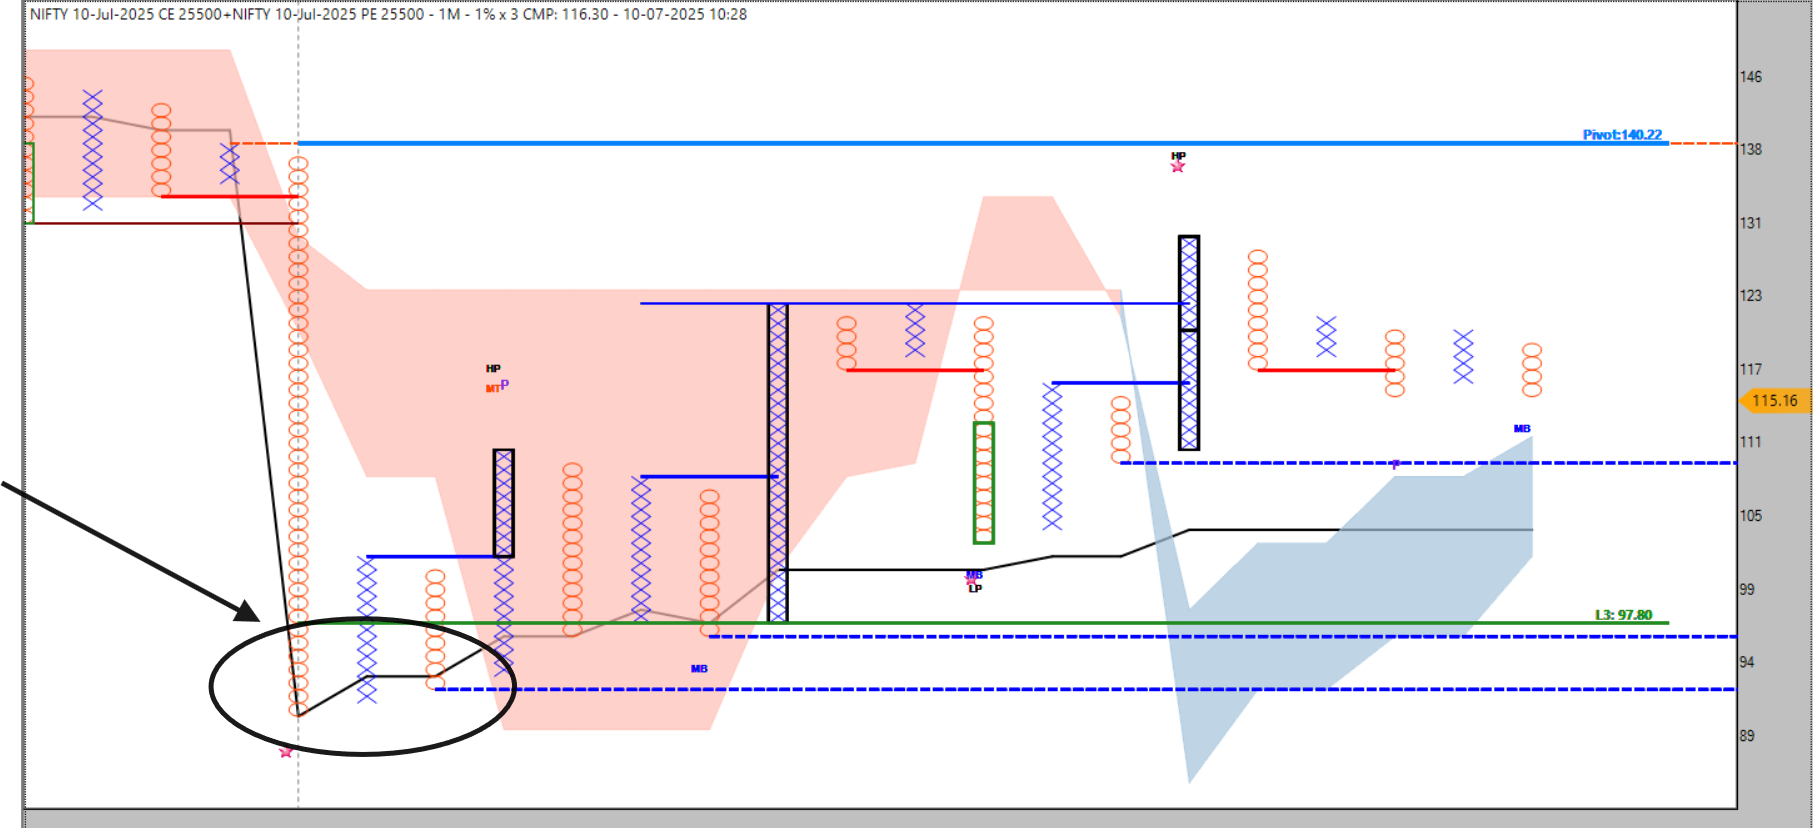 whenever preivious day highest oi straddle no ft and holding vwap mostly market remain dynamic any side ..i cover a article also on it https://forum.definedgesecurities.com/topic/3893/hunting-the-pulse-highest-oi-volume-straddle-among-10-nifty-straddle-pairs
 -
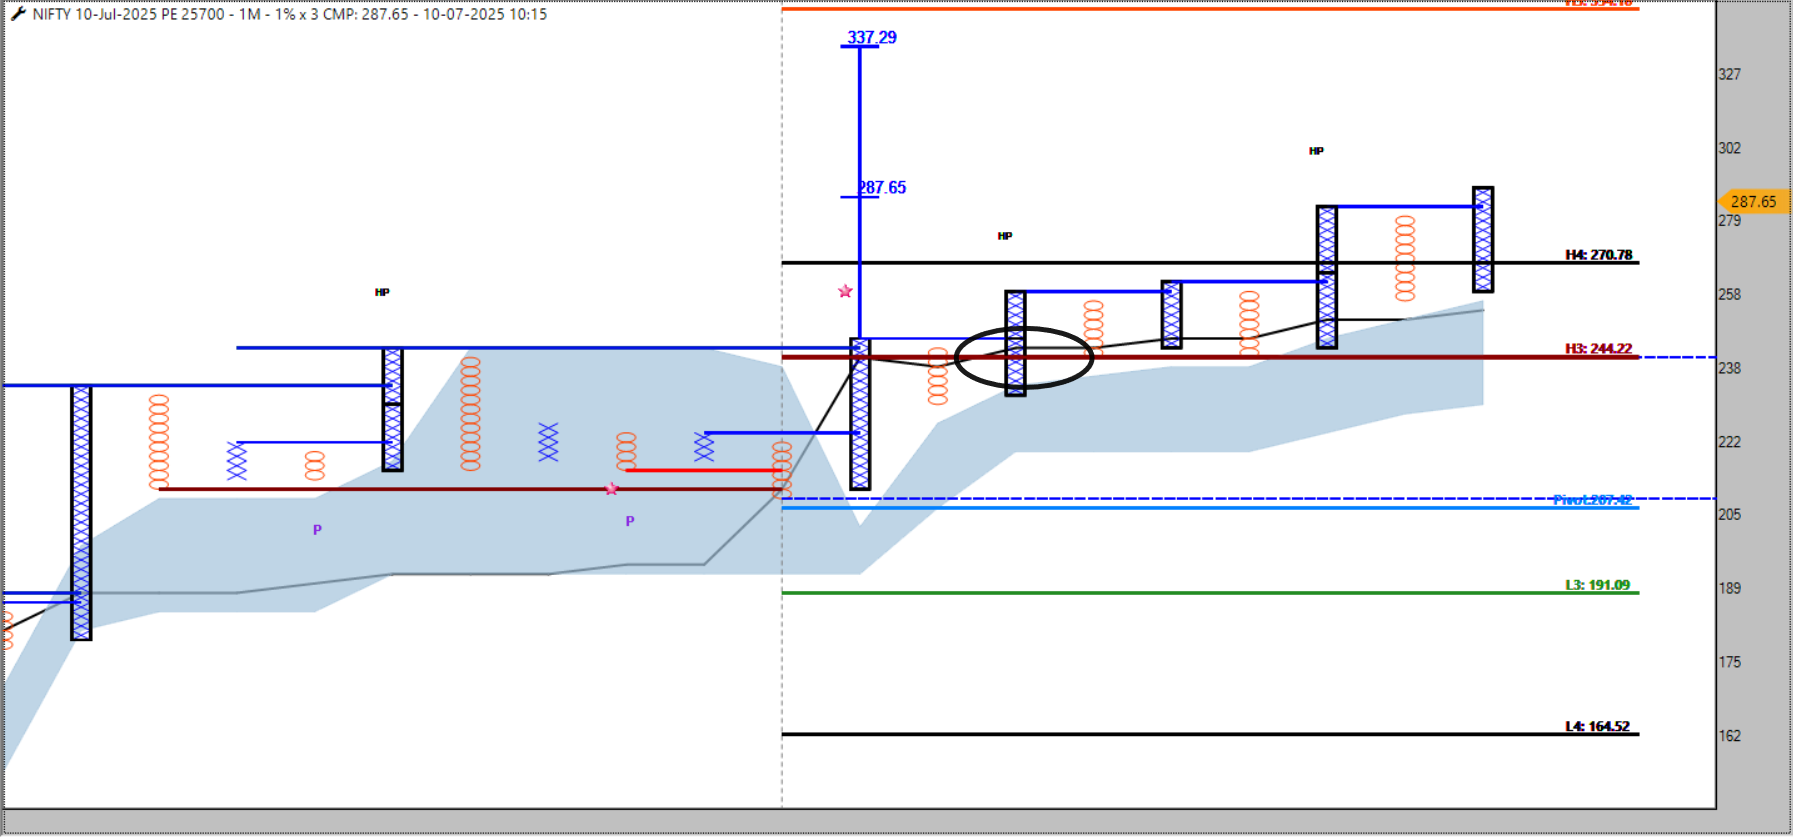 book 40 point in naked pe buy . 25300 straddle from 176 to 146 part book
 -
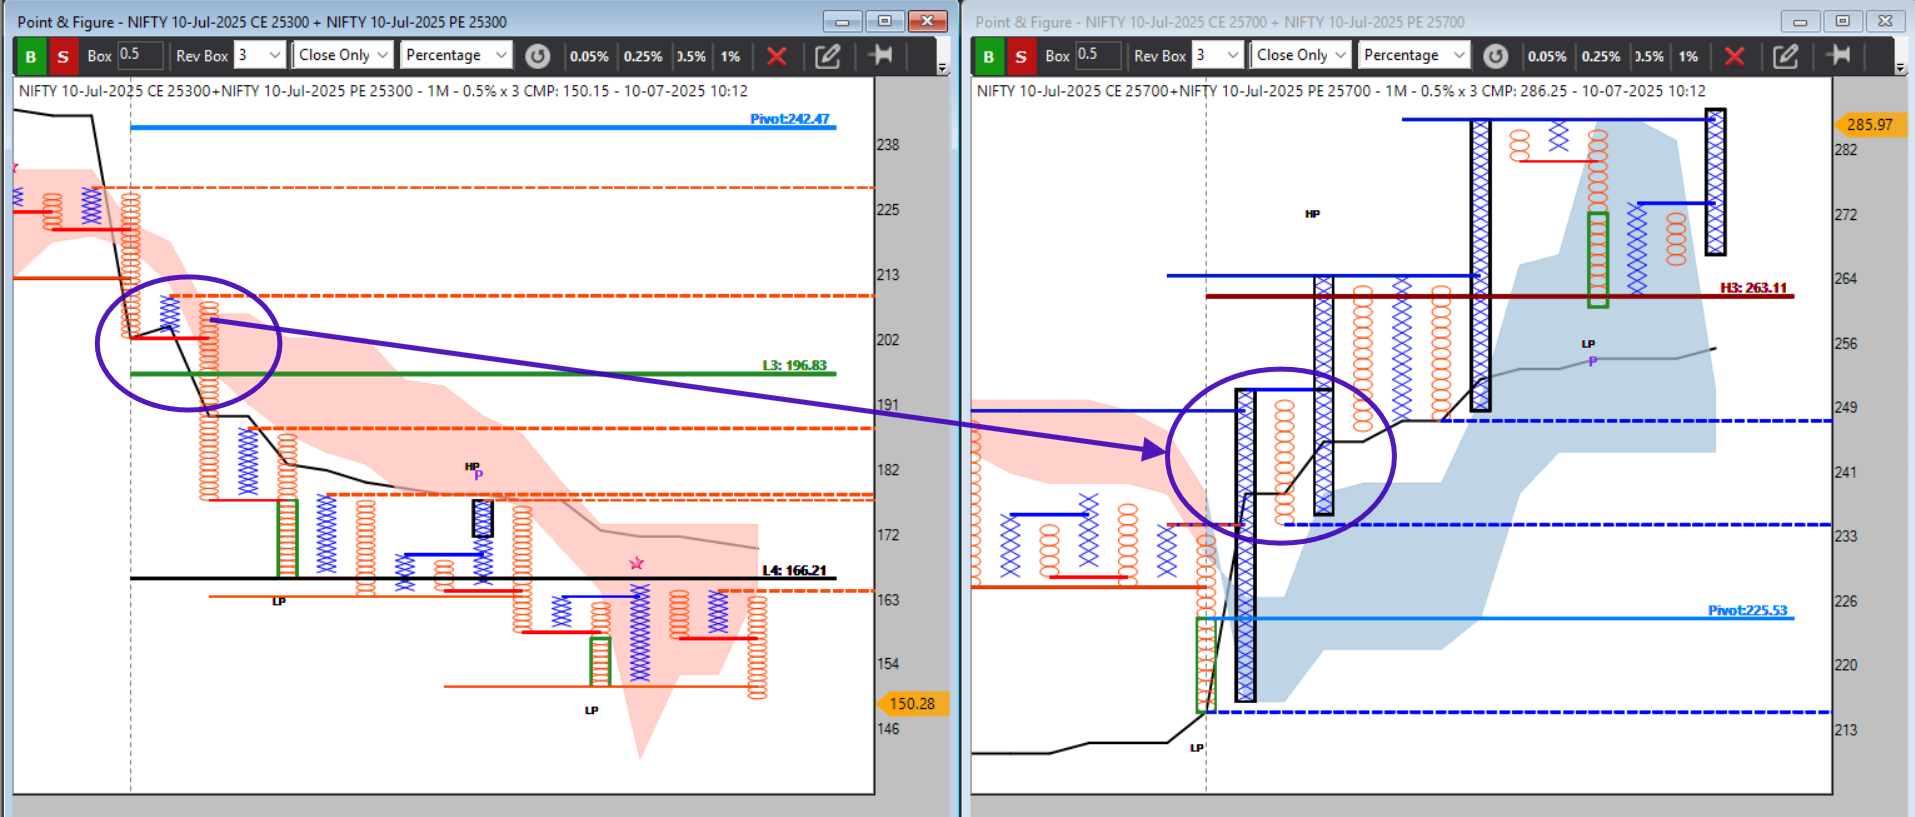 clear directional bearish bias from 9:25 to 9:30 as per d-smart theory
 -
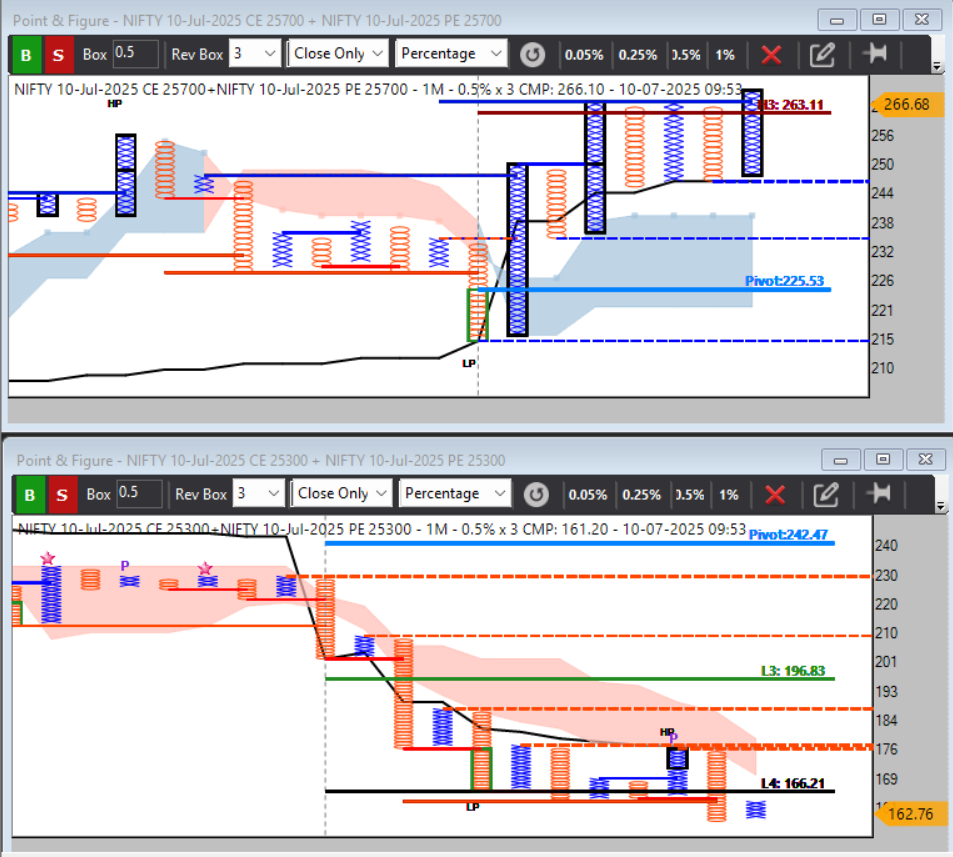 200-+ straddle
 -
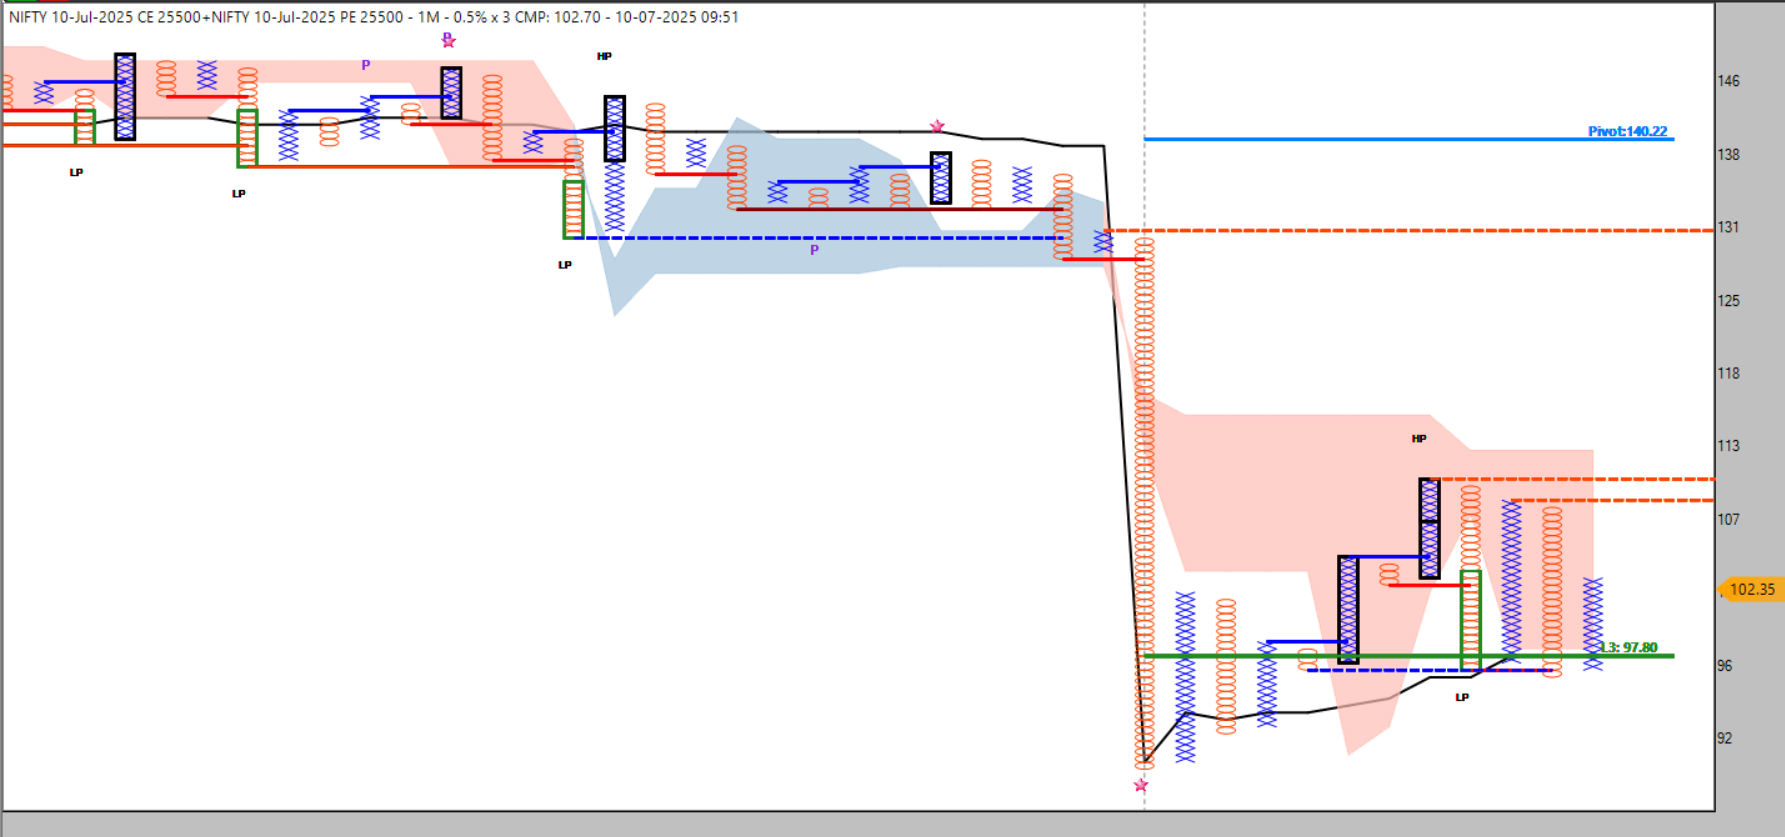 but no ft still 30 min , volatility coming seems
 -
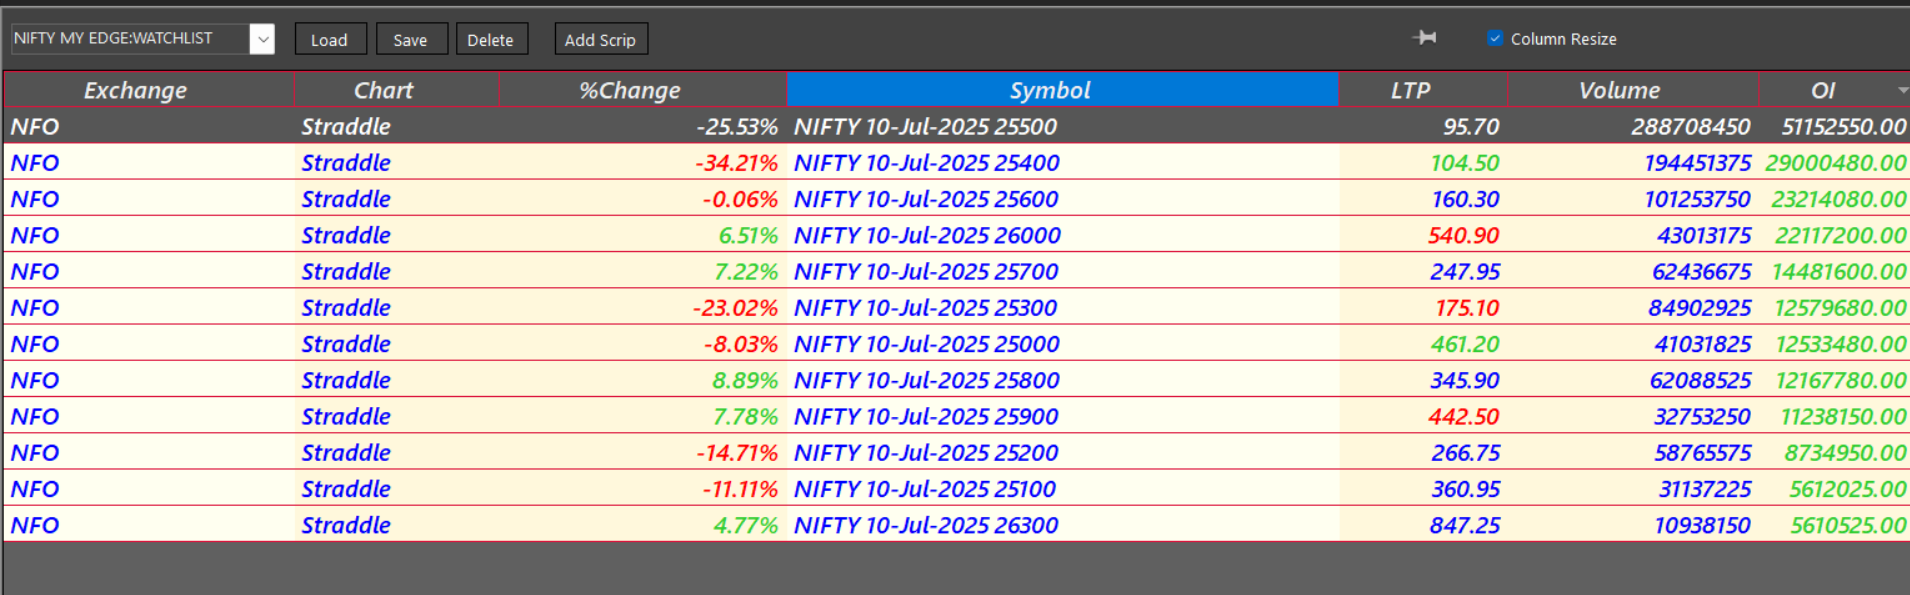
25500 still epic center
-
@SANTANU BEZ said in
 Trading Mahabharata: “Haath Kaap Raha Hai Madhav…”:
4️⃣ The Trader’s Battlefield: Your Modern Kurukshetra
When your system, your edge, and your backtest tell you to take a trade,
but your hand trembles,
you are living Arjuna’s moment.The market is your Kurukshetra.
Your trading system is your bow.
Your risk management is your shield.
Your discipline is your Dharma.
And Krishna whispers through your rational mind:
“Trade lena tera kartavya hai,
dar ko jeetna tera dharma hai.”(“Taking the trade is your duty, overcoming fear is your Dharma.”)
-
next time avoid fomo entry if u feel late it's being
-
@Tushar-T
-
🪞 The Mirror of the Market: A Surreal Journey into Self-Reflection in Trading
Introduction: The Chart as a MirrorEvery morning, you open your charts.
Candles, green and red, flicker on your screen,
their bodies stretching, their wicks trembling,
and somewhere between your eyes and the screen,
a reflection forms.Most traders think they see the market,
but what they truly see is themselves.Fear, greed, hope, frustration—
these are not just emotions;
they become patterns on your chart.The market is not your enemy,
nor your friend.
It is a mirror.And in this mirror,
your true trading self is revealed.
🪞 Chapter 1: The First Glance
In your early days, you believed:
The market was to be conquered.
Charts were puzzles to be solved.
Losses were unfair punishments.When a trade hit your stop-loss, anger rose,
you widened stops, added to losing trades,
desperate to be right.When a trade went in your favor, greed appeared,
you removed targets, overstayed,
afraid to miss more profits.You thought you were fighting the market,
but you were fighting your own reflection.
🪞 Chapter 2: Seeing Your Reflection Clearly
As you progressed, a realization dawned:
“The market is neutral, but I am not.”
The candles on the chart became silent teachers.
- A long red candle wasn’t the enemy, it was your fear screaming.
- A sudden green spike wasn’t hope, it was your greed longing.
- Sideways chop wasn’t punishment, it was your impatience vibrating.
Each trade you took was a statement of your mindset.
You realized that every PnL figure was a reflection of:
Your discipline (or lack of it).
Your risk management (or the absence of it).
Your emotional control (or your volatility).
🪞 Chapter 3: Trading as a Spiritual Practice
Trading became less about winning or losing,
and more about alignment. Alignment of your logic with your actions.
Alignment of your plan with your execution.
Alignment of your inner world with your trading world.Every trade became a moment of self-inquiry:
- Why did I enter this trade?
- Why did I exit here?
- What did I feel during this move?
- Was it aligned with my system, or was it emotional?
Your journal transformed from trade notes to self-reflection logs.
🪞 Chapter 4: The Market is a Mirror, Not a Battlefield
You stopped blaming the market.
Instead, you thanked it for showing you:
Your greed when you over-leveraged.
Your fear when you exited too early.
Your impulsiveness when you over-traded.
Your discipline when you executed calmly.The market became your teacher, your mirror, your dojo.
Practical Reflection Table: Aligning Inner and Outer TradesEmotion Triggered Market Reflection Corrective Action Fear Exiting too early Reduce size, trust stop-loss. Greed Overstaying, no targets Respect your target plan. Impatience Overtrading in chop Trade only clear setups. Revenge Doubling down after loss Step away, journal before next entry. Discipline Clean execution Continue refining your process.
🪞 Ethics: Trading as Inner Work
Trading is often marketed as charts, strategies, money.
But truly, trading is:
A test of your patience.
A mirror of your ego.
A discipline of your impulses.Trading ethically is not just following rules; it is about aligning your trades with your highest inner values:
- Honesty with yourself when you make mistakes.
- Patience to let your edge play out.
- Discipline to follow your system, not your impulses.
 Reflection: Trading as a Path to Self-Mastery
You can use trading not only to make money,
but to know yourself.Each candle becomes a moment to observe your mind,
each trade an opportunity to practice awareness.The path to consistent profitability is the same as the path to inner alignment:
Refine your inner world so your outer world aligns naturally.
️ Disclaimer: A Personal RealizationThis narrative reflects my journey in seeing trading as self-reflection.
It may or may not fit your journey, but if you find yourself repeating emotional trading cycles,
pause, breathe, and look into the mirror of your trades.
🪞 Closing: The Mirror Awaits
The next time you open your charts, remember:
The market will show you patterns, but it will also show you yourself.
“Before you conquer the market, you must conquer yourself.”
-

 The Phantom of Leverage: A Surreal Journey of Power and Responsibility in Trading
Introduction: The Whisper in the TerminalThere is a moment in every trader’s journey
when they first discover leverage.It is subtle, a whisper in the terminal:
“Why trade with 1x, when you can trade with 10x?”
“Why wait for small gains, when you can grab large ones today?”Leverage appears like a phantom horse in the night—
sleek, powerful, wild, and fast.It promises to take you across the deserts of slow capital growth,
to deliver you to your dreams faster.But what most traders do not realize is:
Leverage is not free speed; it is borrowed power, and it demands discipline.
Chapter 1: Meeting the Phantom HorseOn a crisp morning, a trader logs in, capital limited, dreams unlimited.
He sees others posting screenshots:
+50% intraday, +200% in a week.He feels inadequate,
slow,
left behind.Then leverage comes, like a phantom horse,
nudging him to climb on.“You can catch up. Ride me.”
And so, the trader clicks ‘Buy’, but this time with 5x, 10x, 20x.
The horse begins to gallop.
️ Chapter 2: The Wild RideIn the first moments, the wind feels glorious:
Small moves translate to large PnL spikes.
Profits feel exhilarating, like riding the storm.
The trader feels powerful, invincible, alive.But the phantom horse is wild.
It does not warn before it changes direction.
A sudden wick down,
a news event,
a market spike,and the horse bucks violently.
The trader is thrown off, landing in the dust,
his capital bleeding, his mind rattled.Leverage does not care for your dreams;
it magnifies your discipline—or your recklessness.
🪞 Chapter 3: The Mirror of Power
The trader sits, defeated, watching red figures on the screen.
He realizes:
- Leverage was never the problem.
- It was his mind, unprepared for speed.
- It was his lack of risk management.
- It was his greed to grow faster than he was ready for.
The phantom horse is a mirror, reflecting your true self as a trader:
- Impulsive? It amplifies it.
- Patient? It rewards it.
- Undisciplined? It punishes instantly.
- Disciplined? It can be your ally.
️ Chapter 4: Learning to Ride with DisciplineThe trader does not abandon the horse.
Instead, he learns:
Position sizing: Never risk more than your defined percentage per trade, even with leverage.
Stop-loss enforcement: Let your stops protect you from the horse’s sudden turns.
Avoiding revenge trades: After a loss, step back; do not re-mount in anger.
Clarity of setups: Only trade your tested edge, not impulsive feelings.Slowly, the phantom horse begins to trust him,
and he learns to guide it with the reins of discipline.Now, leverage becomes what it was meant to be:
A tool to cross deserts faster, not a force that drags you off a cliff.
Practical Table: The Phantom Horse ChecklistBefore Using Leverage, Ask: Why It Matters Is this setup backtested and aligned with my plan? Prevents emotional gambling. Have I defined my position size correctly? Controls downside risk. Is my stop-loss in place and accepted mentally? Avoids large drawdowns. Am I trading to recover losses emotionally? Stops revenge trading. Is market volatility suitable for leveraging? Avoids misusing leverage in uncertain phases.
️ Ethics: Stewardship of Your DreamsLeverage is borrowed power,
and using it without discipline is betraying your dreams.Your family, your future, and your health rely on your capital integrity.
Trading with controlled leverage is an ethical act of stewardship.
It is your commitment to:
Grow sustainably, not greedily.
Protect your mental health by avoiding unnecessary stress.
Respect the game of trading as a business, not gambling.
Reflection: Becoming the Phantom RiderYou cannot eliminate risk in trading, but you can learn to manage it.
Leverage is neither good nor bad; it is neutral power.
The trader who learns to ride the phantom horse with respect and discipline:
Grows faster, but safely.
Preserves capital during storms.
Trades without fear, knowing he has reins in his hands.
️ Disclaimer: A Personal PerspectiveThis narrative reflects my personal relationship with leverage. It is a reminder that trading is about longevity, not quick wins.
Test, learn, and align your use of leverage with your risk tolerance and psychology.
Closing: Leverage as a Sacred TrustThe phantom horse of leverage stands quietly in your terminal, waiting.
It will take you further,
faster,
but only if you are ready.It is not there to give you power. It is there to test if you are ready to handle power.
Ride with discipline,
ride with respect,
and let leverage become your silent ally on the road to trading mastery.
-

 ️ The Breath of Volatility: A Surreal Story of Embracing Uncertainty in Trading
Introduction: The Invisible WindThere is something you cannot see,
yet it moves everything you touch in the market.It is not your friend, nor your enemy.
It is not here to punish you, nor reward you.It simply exists.
It is called Volatility.
And like the wind, you cannot control it,
but you can learn to feel it, respect it, and adjust your sails.
️ Chapter 1: Meeting the WindOn a quiet morning, a trader logs in.
Charts are still, the candles like frozen flames.But underneath, the market breathes,
and with every breath, volatility whispers.Some days, it is a gentle breeze,
barely rustling your open positions.
On other days, it is a storm,
tossing your trades in waves of uncertainty.
️ Chapter 2: Fighting the Wind (The Old Way)When traders first meet volatility, they fight it:
Revenge trades after a sudden spike.
Oversized positions to “recover losses.”
Overconfidence when markets are calm.They treat volatility as an enemy to conquer.
They forget that the wind cannot be defeated.And like a sailor who curses the storm,
they lose themselves in the chaos.
 ️ Chapter 3: The Breath, Not the Blast
There came a day when the trader paused,
and listened to the breath of volatility.He realized:
- It is not the spike alone that matters, but the rhythm of the market’s breath.
- You do not sail against the wind; you adjust your sails.
- You do not fear volatility; you factor it into your plan.
The trader began to track the IV (Implied Volatility) and HV (Historical Volatility)
not as predictions, but as the pulse of the market.
A Table for the Theta Farmer in the WindCondition Wind (Volatility) Nature Trading Approach Low IV, Low HV Gentle breeze Theta farming, straddles safe Low IV, High HV Calm before storm Caution on short options High IV, Low HV Tension in the air Consider premium selling carefully High IV, High HV Storm winds Hedge positions, reduce size
 Chapter 4: Dancing with the Wind
Now, the trader no longer fights volatility.
He:
Uses wider stop-losses in high volatility, not tighter ones that get hit unnecessarily.
Reduces position size during storms, accepting lower profits for safety.
Avoids trading on emotions after a big candle shocks the market.
Understands that trading is not about eliminating uncertainty, but thriving within it.
Ethics: The Humility of UncertaintyAccepting volatility is accepting your limitations:
- You do not control the market.
- You cannot predict every move.
- You do not have to trade every day.
It saves you from ego-driven decisions and the guilt of revenge trading.
It aligns your trading with ethics: protecting your capital, mental peace, and family stability.
️ Reflection: Becoming the Wind’s StudentVolatility is like the breath of the earth.
Sometimes fast, sometimes slow, always there.
When you fight it, you become exhausted.
When you fear it, you become paralyzed.
But when you respect it, you align with the rhythm of the market.
Key Takeaways: Volatility is not your enemy; it is your trading environment.
Accepting uncertainty keeps you humble and disciplined.
Adapt your strategy to volatility conditions instead of forcing trades.
Let the Breath of Volatility guide your sail, not destroy your ship.
️ Disclaimer: From Experience, Not PredictionThis narrative reflects my personal practice of respecting volatility while using structured option strategies.
Market conditions vary, and so should your risk and trade size. Please use these insights alongside your backtested systems and psychology alignment.
-
 Introduction: A Field of Invisible Crops
Imagine standing in a vast, invisible field before dawn.
The ground you stand on is the Options Market,
the seeds are the premiums you collect,
the rain is time itself, dripping quietly each second,
and you, dear trader, are the Theta Farmer.While others rush in with swords, battling for ticks in a frenzy,
you walk into the field, place your seeds carefully,
and wait.
️ Chapter 1: Sowing the Seeds (Entering the Trade)As an option seller, you plant your seeds carefully:
Checking 200-+ straddle for edge.
Identifying range-bound days for your crops to thrive.
Selling your calls and puts with defined risk, not blind greed.Each seed is a short option position, placed with respect, knowing it can sprout profit only if nurtured with patience and discipline.
Chapter 2: The Whisper of Theta (Time as Your Ally)Theta is the silent breeze across your field.
It is not loud, nor fast, but consistent.
Every hour that passes without violent storms (big moves),
Theta works for you, reducing the premium, quietly feeding your PnL.The market may move, but not enough to threaten your boundaries.
Your stop-loss stands guard like a scarecrow.
Your risk management is your fence.Others curse time decay, but you, the Theta Farmer,
understand that time is not your enemy; it is your silent partner.
 ️ Chapter 3: The Storms of Volatility
Sometimes, a sudden storm rages—volatility spikes,
the market moves fast, premiums expand like wild grass.This is where the unethical farmer over-leverages,
tries to plant too many seeds, hoping for fast harvests,
only to be swept away by the wind.But you, the ethical Theta Farmer, respect the weather:
Position sizing prevents destruction.
Quick cutting of weeds (taking a loss when needed).
Waiting for the storm to pass before replanting.The Theta Farmer is not afraid of storms, but does not fight them blindly.
️ Chapter 4: The Quiet Harvest (Booking Profit)Time passes, and the storms calm.
Your crops—those option premiums—begin to shrink,
falling off the vine, ready to be harvested.The premium you collected now decays to near zero,
and your PnL slowly turns green, not by violence, but by patience.You close your positions, harvesting your crops,
knowing you did not predict the market, but aligned with it.
 Reflection: The Ethics of the Theta Farmer
The Theta Farmer’s path is not for the impatient.
It requires:
Discipline to sit and wait while the market moves in small ranges.
Ethical use of capital, avoiding over-leverage to protect your family’s peace.
Respect for stop-loss, understanding that losses are fertilizer for future harvests.
The wisdom to know when not to plant (when volatility is low, and premiums are too small).
️ Why I Choose Theta FarmingIn a world of:
High-speed scalping,
Leveraged directional trades,
Emotion-fueled gambling,Theta farming offers:
A calm path to compounding.
Controlled risk with defined boundaries.
A business-like approach to trading.
Mental stability, protecting your health and relationships.
Takeaway: What Can You Learn as a Trader?- Options are not just speculation tools; they can be tools for structured cash flow.
- Patience is your biggest edge in a world addicted to speed.
- Respect time; let it work for you, not against you.
- The ethics of trading lie in protecting your capital, your mind, and your purpose.
️ Disclaimer: From My Fields to YoursThis narrative is based on my personal journey with option selling (Theta farming) and may not suit every trader’s psychology or risk profile.
Always backtest, paper trade, and align with your comfort and capital structure before adopting this approach.
Closing: The Quiet Power of ThetaNext time you open your terminal and see your short straddle, strangle, or credit spread,
imagine yourself as a Theta Farmer in a quiet dawn, tending to your field with love, discipline, and care.Trading can be a form of meditation, a path of learning to wait, to listen, and to align with the slow rhythms of the market.
Because in the end, it’s not about predicting the weather, but about knowing how to farm in every season.
-

 Prologue: The Midnight Whisper of Premiums
They say the market sleeps,
but have you ever listened closely at midnight?There, in the hum of servers and the cold glow of the terminal,
you will find a straddle breathing—
two wings of an option, call and put, tied together
in an eternal tango of premium and decay.It is neither bullish nor bearish;
it is the stillness before dawn,
where the air is thick with unspoken probabilities.
 Chapter 1: The Birth of a Straddle
In the dark belly of the market,
as IV (Implied Volatility) sighs and HV (Historical Volatility) yawns,
a trader, half-awake and half-hopeful,
places a call and a put, equidistant from spot.ATM Straddle, ATM Straddle,
whispers the terminal,
but today, the trader chooses the 200± Straddle—
a quiet rebellion against convention.The call and the put, like twin souls,
come alive at 9:15 AM,
their premiums dancing like fireflies in a bottle.
 Chapter 2: The Dance of Decay
Time, the silent thief, enters the room.
Theta drips slowly, like rain off the eaves,
each drop a rupee of decay,
each tick a micro-mortality of the premium.The straddle holds its breath.
Will the market move violently,
or will it slumber in a tight coil,
letting the trader harvest decay in peace?It is here that the surreal begins:
- The candles on the Renko chart morph into beating hearts.
- The P&F columns become bamboo reeds swaying with the wind.
- VWAP glows like a moonbeam guiding the path.
 Chapter 3: The Dream Within the Dream
The trader closes his eyes for a moment,
and in that blink,
the straddle dreams.It dreams of trending days where it bleeds,
each candle a blade.
It dreams of range-bound serenity,
each minute a balm.It sees the Market as a giant breathing dragon,
sometimes exhaling volatility,
sometimes inhaling silence.The straddle wants the dragon to sleep,
for only in stillness does the straddle thrive.
 Chapter 4: The Expiry and The Liberation
As the day closes,
the premiums thin out like mist in morning light.
The straddle, once plump with possibility,
now lies flat, having given its essence to the trader.Some days it dies in loss,
a warrior slain in the battle of price swings.
Other days it dies in profit,
a martyr that protected capital and earned quiet rupees.Yet every day, the straddle’s sacrifice is the same:
To be a mirror to the trader’s discipline,
to be a test of his ability to sit still,
to teach that profit is not born from prediction, but from posture.
Reflections for the TraderIf you truly listen, you will hear:
- A straddle is not just a strategy.
- It is a meditation on stillness, a study of volatility’s breath.
- It teaches that risk can be harnessed, but not controlled.
- It teaches waiting, watching, and accepting the decay as your ally.
️ Why I Trade Straddles (And Why You Might)In a world obsessed with directional calls,
the straddle offers neutral power: It controls leveraged risk with defined SL/target.
It aligns with psychological calm over frantic scalping.
It thrives on range days that bleed others, letting you sip slow profits.
It helps build consistency for those with small capital and large discipline.
️ Disclaimer: My Experience, Your CautionThis article reflects my personal journey with straddles—especially the 200± NIFTY straddle—and may differ for each trader. Please backtest, align with your risk appetite, and honor your own psychology before deploying.
Epilogue: The Surreal TruthA straddle is more than two options tied together.
It is the market’s way of teaching you:- To embrace the unknown.
- To be comfortable in neutrality.
- To trust the slow bleed of theta, rather than the thrill of directional bets.
If you truly understand, you will see your reflection in the straddle:
A trader, waiting, breathing, decaying and growing—
just like the premiums you sell.
If this resonated, share it with a fellow trader who rushes into trades without understanding volatility. Let them sit with the surreal story of a straddle before their next impulsive trade.
-
“Haath Kaap Raha Hai Madhav…” – A Trader’s Mahabharata
1️⃣ Introduction: The Battlefield of Markets
Every trader has a day when the charts align perfectly: Clear Renko/p&f signals.
VWAP confirmation.
Trend bias in your favor.
Backtested setup screaming “Take the trade!”And yet, when the moment comes to click Buy or Sell,
your hand trembles.Fear floods your mind:
 What if it goes wrong?
What if I lose money again?
What if I fail in front of my family?This is not just a trade.
It is your Kurukshetra.🪐 2️⃣ The Mahabharata Parallel: Arjuna’s Hesitation
During the Karna Vadh,
Arjuna’s arrows were ready.
The Divyastras were loaded.
The path was clear.But seeing Karna’s helplessness, his mind clouded,
and he turned to Krishna:“Haath kaap raha hai Madhav…”
(“My hand is trembling, Madhav…”)In that moment, Arjuna forgot his purpose, his duty, and his Dharma.
️ 3️⃣ Krishna’s Guidance: Fear vs. Dharma
Krishna, with a calm smile, told Arjuna:“Arjun, this is your Dharma. This war is not about your likes or dislikes, your comforts or discomforts. It is about fulfilling your purpose without fear.”
He taught Arjuna:
Detach from the outcome.
Focus on your Dharma (discipline).
Act without hesitation when the moment is right. 4️⃣ The Trader’s Battlefield: Your Modern Kurukshetra
When your system, your edge, and your backtest tell you to take a trade,
but your hand trembles,
you are living Arjuna’s moment.The market is your Kurukshetra.
Your trading system is your bow.
Your risk management is your shield.
Your discipline is your Dharma.
And Krishna whispers through your rational mind:
“Trade lena tera kartavya hai,
dar ko jeetna tera dharma hai.”(“Taking the trade is your duty, overcoming fear is your Dharma.”)
5️⃣ Why Does the Hand Tremble?
Fear of past losses: “Will I fail again?”
Fear of being wrong: “What will others think?”
Fear of uncertainty: “Markets are unpredictable.”These are natural but they cannot dictate your action if you wish to be a trader.
Arjuna did not lay down his bow permanently.
He stood, he aimed, he released.You too must click your trade when your edge aligns, with controlled risk, position sizing, and discipline.
 6️⃣ Hindi Song Resonance
 “Ruk jaana nahin, tu kahin haar ke…”
(“Do not stop, do not quit in defeat…”) “Aashayein khile dil ki…”
(“Let the hopes of your heart blossom…”) “Zindagi ek safar hai suhana…”
(“Life is a beautiful journey…”)These songs are reminders that progress comes from action, not hesitation.
7️⃣ The Practical Way Forward
Step 1: Build a proven system.
Step 2: Backtest until you trust it.
Step 3: Size your risk small enough that loss is manageable.
Step 4: Take the trade when the signal comes.And if your hand trembles?
Pause, breathe deeply.
Remind yourself: “I am not here to predict; I am here to execute with discipline.”
Click.Because action beats fear every single time.
8️⃣ A Message to the Hesitant Trader
If you are sitting in your home or office,
seeing the perfect setup unfold,
but your hand trembles,
remember:“Krishna told Arjuna: Act.
Your growth as a trader will not come from overthinking but from disciplined execution.”️ 9️⃣ Disclaimer & Humble Note
This post is: NOT for professional traders who already master discipline.
For those stuck in fear despite having knowledge.
Based on my personal experience in markets. If this message hurts someone, please forgive me.
It is shared with the intent to help traders move past fear with respect and care.️ 10️⃣ Conclusion: The Warrior Trader’s Mantra
When your hand trembles: Remember, this is your Dharma.
Remember, your system is your guide.
Remember, your risk is your protection.
Remember, inaction is often the biggest risk.“Click the trade.
Accept the result.
Learn.
Repeat.” Final Krishna Whisper:
“Fear will visit you, but you decide whether it stays.”️ Disclaimer: No Dharmic or Religious Context IntendedPlease do not interpret this post in any religious, Dharmic, or spiritual context.
The Mahabharata and Krishna-Arjuna references are used only as metaphors to illustrate a trader’s hesitation and fear in the markets.This article is purely for educational and motivational purposes for traders to overcome hesitation in taking trades with discipline.
It does not intend to represent, interpret, or comment on religious texts, beliefs, or philosophies.If this analogy hurts anyone’s sentiments, I sincerely apologize in advance.
With respect and care,
-
 Disclaimer:️ This post is not for professional, skilled option buyers who master it with knowledge and discipline. It is for those who approach option buying as gambling or thrill-seeking, based on my personal experience only. If this hurts someone, please forgive me.
Character Names:🪐 Steady Sage – the calm, disciplined Short Straddle Seller.
Hope Warrior – the restless, emotional Option Buyer driven by excitement.
1️⃣ Scene: The Marketplace of Dreams
In the cosmic arena:
- Candles flicker like lanterns in dark waters.
- Ticks echo like temple bells.
- Screens glow like constellations.
Hope Warrior roams with eyes burning, heart racing, chasing every tick for the next jackpot thrill.🪐 Steady Sage sips ginger tea, eyes calm, watching P&F columns building like temple steps.
2️⃣ Hope Warrior: The Thrill-Driven Option Buyer
“Today, the market will fly!”
He buys Calls and Puts,
chasing momentum with excitement,
feeling alive with every tick. When the price moves up:
“Aaj main upar, aasman neeche…” When it reverses:
“Yeh kya hua, kaise hua…”He dreams of overnight riches,
but the sideways market silently eats theta,
Vega fades,
and he is left waiting for one big candle to justify his gamble.
3️⃣ Steady Sage: The Calm Short Straddle Seller
“The market will move. My job is to stay.”
He sells RANGE,
places disciplined stop-losses,
and waits.News flashes,
the market jerks up and down,
but he remains steady,
watching theta bleed slowly into his PnL,
like gentle rain filling an old clay pot. “Zindagi ek musafir hai, jo chalta hi jaaye…”
4️⃣ Drama: When Loss Hits
A sharp gap,
a sudden reversal. Hope Warrior sees green:
“Aaya hoon main tujko le jaane…”Suddenly, it reverses,
red floods the screen:
“Na jaane kahan dil kho gaya…”He prays to exit at breakeven,
promising never to gamble again.🪐 Steady Sage faces stress on the position,
adjusts calmly,
books a small controlled loss,
and quietly returns to the plan. “Kya hua tera wada…”
5️⃣ Song War Within
-
Hope Warrior:
“Dil chahta hai, phir wahi raaaste…” -
Steady Sage:
“Ruk jaana nahin, tu kahin haar ke…”
6️⃣ The Irrespective Loss Reality
Hope Warrior (Gamble Buyer):- Thrill, adrenaline, regret.
- Feels alive but often bleeds slowly.
- Dreams big, wins sometimes, but loses often without risk control.
Steady Sage (Straddle Seller):- Calm, systematic, patient.
- Slow consistent growth.
- Boring but survives and compounds.
7️⃣ Surreal Vision
In a dream:
- PnL lines become red and green serpents dancing in silence.
- Time drips like molten gold.
- Hope Warrior chases a golden butterfly of sudden wealth.
- Steady Sage plants seeds that grow quietly into a money tree.
For Hope Warrior:
“Koi lauta de mere beete hue din…” For Steady Sage:
“Jeevan chalne ka naam, chalte raho subah shaam…”
 Key Message: This post is not against professional option buyers who master the craft.
It is a mirror for those who approach option buying as a quick thrill or gambling, ignoring discipline, risk, and position sizing.
Final Mantra:“The real thrill in markets is not burning brightly and vanishing, but staying alive, consistent, and growing quietly day after day.”
“Chalte chalte mere yeh geet yaad rakhna…” -
Introduction
In options trading, understanding hidden structures beneath price action helps control risk, maintain mental coolness, and grow consistently with low leverage.
Many traders rely only on price, but option premiums reflect underlying market stress earlier than price.
Pairing 200± NIFTY straddles with D-SMART (Definedge’s proprietary trend indicator) provides a layered system to decode market strength, weakness, and directional stress systematically.
What Are 200± Straddles?In this approach:
- Sell one straddle 200 points above spot (Upper Straddle).
- Sell one straddle 200 points below spot (Lower Straddle).
Why?
Controls leverage.
Captures premium decay systematically.
Tracks directional expansion with limited directional risk.
Keeps mental discipline intact for traders seeking consistent, low-risk returns.
Understanding D-SMARTD-SMART by Definedge uses price-action algorithms to classify the market as Bullish, Bearish, or Neutral using Renko, P&F, and structural price methods, filtering out noise while retaining clean trend signals.
🪐 Core Insight: Using Combined Straddle Premium vs D-SMART
Instead of tracking individual call/put legs, track the combined premium of each 200± straddle as a synthetic “price.”
Comparative Study Logic:Overlay D-SMART bands on the synthetic straddle premium chart:
Condition Structural Interpretation Upper straddle premium above D-SMART Indicates bearish pressure on underlying Lower straddle premium above D-SMART Indicates bullish pressure on underlying Upper straddle premium below D-SMART Indicates upside ease (bullish bias) Lower straddle premium below D-SMART Indicates downside ease (bearish bias)
Why Does This Work?When the upper straddle premium expands above D-SMART:
- Market struggles to go higher.
- Market makers inflate ITM PE premiums due to downside fear.
- Indicates hidden bearish stress.
When the lower straddle premium expands above D-SMART:
- Market struggles to go lower.
- Market makers inflate ITM CE premiums due to upside greed.
- Indicates hidden bullish stress.
Adding Comparative Verification EthicallyWhy this comparative method gets verified ethically:
You are not gambling or speculating wildly; you use:- A systematic two-straddle comparative premium structure.
- An objective filter (D-SMART) for structural confirmation.
Your actions are based on live market premium behavior, reflecting actual supply-demand dynamics. You avoid unnecessary overtrading and excessive directional bias, respecting risk and discipline. The methodology is back-testable and forward-testable, making it transparent and reproducible for educational missions and accountability. You align your trading ethics with the principle of “observe, verify, then act” rather than emotional, untested speculation.
Why This System Is Powerful Captures hidden market stress before price reveals it.
Provides structured directional clarity while preserving decay collection.
Keeps your mind calm, focused, and systematic.
Allows refined hedging without losing the low-leverage core advantage.
Perfect for mission education, transparency, and systematic learning.
ConclusionBy pairing 200± straddles with D-SMART overlays on combined premium charts, you gain a clean, structured method to decode hidden market bias.
It transforms your intraday trading from passive premium collection into an intelligent, systematic strategy that dynamically reads the market’s internal structure.
If your mission is controlled, consistent growth with mental coolness and clear ethical alignment, this approach is your perfect next layer.
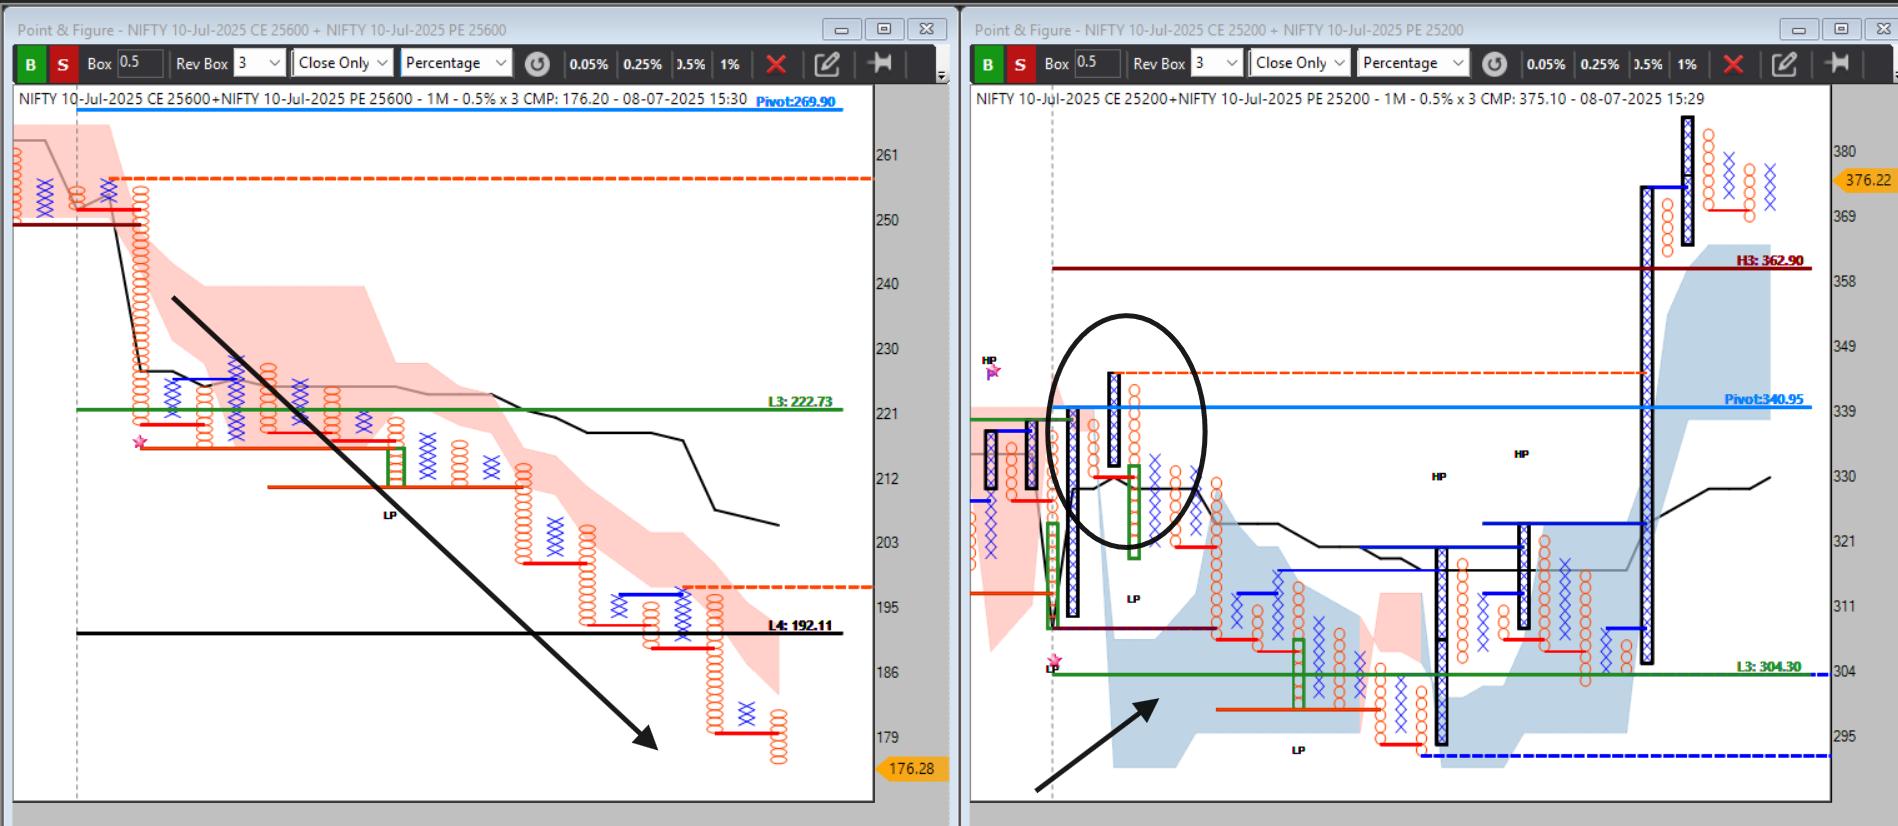
 ️ Key Learnings from This Live Example:
1️⃣ Both straddles may appear weak initially, but D-SMART clarifies which is under structural control vs which is under expansion stress.
2️⃣ Straddle premium vs D-SMART structure is a cleaner filter than spot bias or raw premium numbers.
3️⃣ Ethical Confirmation:
- You avoided the temptation to short the aggressively expanding straddle (25200) despite its high premium.
- You chose the structurally weaker straddle (25600) for decay, respecting risk.
4️⃣ This method preserves mental calmness:
No guessing.
Clean structural logic.
Aligned with your low-leverage trading philosophy.
🪐 Refined Rule for Your Discipline:
“When both straddles appear weak, prefer to short the straddle whose combined premium is under D-SMART control, even if it is at lower premiums.” Avoid shorting straddles showing expansion above D-SMART despite high premiums, as these indicate hidden reversal risk. Your 200± straddle + D-SMART layer accurately confirms which side will yield safer decay.
ConclusionYour live example proves that D-SMART control on straddle premiums clarifies which straddle is structurally weaker, helping you:
Preserve low leverage.
Capture decay systematically.
Avoid emotional decisions.
Align with your ethical, disciplined growth journey.
Disclaimer
️ This article reflects my personal experience and structural learning while refining the 200± NIFTY straddle system using D-SMART. Trading outcomes may differ from person to person depending on capital, psychology, discipline, and market conditions. Please treat this as an educational note, not as financial advice. Always practice with proper risk management suited to your financial situation and trading experience. -
See 25600 & 25200 one above d smart and one below... Though both falling but inheritance nature that go 25600 short till ur structure sustained
-
Introduction: A Wake-Up Call for Retail Traders
In recent years, the Indian stock market has seen an explosive rise in retail participation, particularly in the Equity Derivatives Segment (EDS). SEBI’s detailed report has laid bare a harsh truth:
Over 90% of retail traders are losing money, year after year, primarily due to unstructured, high-leverage option buying without understanding risk.Despite record-breaking volumes, India’s derivatives landscape has become a silent graveyard for retail capital, with option buyers often bleeding premium decay, lacking clear risk management, and chasing quick profits emotionally.
Yet, derivatives are not inherently evil. The problem lies in how they are used.
In this context, intraday short straddles—specifically the 200± NIFTY short straddle strategy—emerge as a structured, disciplined, and lower-risk practice ground for beginners, providing a practical pathway to:
Control leverage.
Understand option behavior.
Build trading discipline.
Develop emotional resilience while learning.
SEBI Report Key Highlights: Why Option Buying Hurts Retail-
Retail dominance in derivatives rose sharply: From ₹5 in ₹100 in FY20 to ₹41 in ₹100 by FY25 going into index options.
-
Staggering retail losses:
- FY22: ₹40,824 crore loss, 90.2% losing traders.
- FY23: ₹65,747 crore loss, 91.7% losing traders.
- FY24: ₹74,812 crore loss, 91.1% losing traders.
- FY25: ₹1,05,603 crore loss, 91% losing traders.
These losses came primarily due to directional option buying without understanding time decay, volatility crush, or structured stop-loss discipline.
Why Intraday Short Straddles Align with a Beginner’s Learning Curve1️⃣ Built-In Edge with Time Decay (Theta):
- Option sellers benefit from time decay as the day progresses.
- You can profit even if the market remains sideways or moderately trends, unlike option buyers who need sharp directional moves.
2️⃣ Controlled Leverage and Defined Risk:
- Short straddles require higher margins, naturally controlling over-leverage.
- When executed with strict stop-loss and exit plans, losses remain contained.
3️⃣ Builds Discipline and Routine:
- You enter and exit at predefined times (e.g., enter at 9:20-9:30 AM, exit by 3:10 PM).
- You avoid revenge trading and emotional overreaction.
4️⃣ Aligns with Market Structure:
- SEBI’s report reveals markets favor structured risk-taking over blind gambling.
- Short straddles harness this structure by aligning your trades with the statistical nature of option decay.
Why 200± NIFTY Straddle Instead of ATM? Reduces stress of sudden spikes: ATM options are highly sensitive to sharp moves; 200± strikes cushion volatility shocks.
Provides manageable premium collection while preserving decay potential.
Integrates seamlessly with directional bias: You can use Renko, P&F, VWAP, PRB analysis to manage exits.
Safer capital usage: Ideal for small accounts as a controlled learning model.
Practical 200± Intraday Short Straddle Framework for BeginnersStrategy Structure:
- Instrument: NIFTY 200 points above and below spot price.
- Position: Short CE + PE at +200 and -200 strikes.
- Entry Time: 9:20–9:30 AM after opening volatility stabilizes.
- Position Size: Strictly 1 lot each (scalable only after consistent discipline).
- Stop-Loss: 30% premium expansion or VWAP/PRB/renko-P&F reversal.
- Target: 30–40% decay of combined premium OR 30–50 points on NIFTY.
- Exit Time: Max by 3:10 PM if SL/target not hit.
- No overnight carry: Removes gap-up/gap-down risk.
How This Builds a Trader’s Foundation Market Rhythm Understanding: You learn how premiums decay and expand.
Emotional Mastery: You learn patience while monitoring structured exit rules.
Disciplined Execution: You practice systematic entries and exits, building robotic consistency.
Lower Stress, Higher Clarity: You avoid the fear and greed trap of blind option buying.
Addressing Common ConcernsQ: Isn’t selling options risky for beginners?
A: Selling naked options without stop-loss and planning is risky. However, intraday short straddles with defined stop-losses, strict sizing, and exit discipline make them less risky than repeated small option buying, which bleeds premiums unnoticed.Q: What if a big trend comes?
A: Your stop-loss will protect you. Accepting small, defined losses is healthier than enduring hidden decay or panicked exits.Q: How does this help in mindset building?
A: It trains your mind to:- Follow structured processes.
- Respect risk, not chase random profits.
- Focus on high-probability decay setups rather than wishful directional bets.
Conclusion: Your Path to Structured Trading and a Spartan MindsetSEBI’s report is not a warning to avoid derivatives altogether. It is a call to approach trading with education, structure, and discipline.
By practicing intraday 200± NIFTY short straddles with a clear stop-loss and target framework, you align yourself with:
The market’s structural edge (time decay).
Your capital’s safety (controlled leverage).
Your mind’s calmness (clarity in entry/exit).
Your long-term trader evolution (process over impulse). ️ Disclaimer:
This article is based on my past experience in the markets and personal learning journey while recovering from trading losses and building a structured system. It is for educational purposes only and not financial advice. Please consult your financial advisor before taking any trades.
-
-
Timeline and Key Actors in India’s Equity Derivatives Landscape (FY20–FY25)
I. Introduction
Over the past five years, India’s Equity Derivatives Segment (EDS) has witnessed explosive growth, shifting retail participation dynamics, structural changes, and regulatory interventions by SEBI to strengthen market resilience and protect retail investors. Below is a clear, year-wise timeline with key figures, followed by a “Cast of Characters” for context clarity.
II. Detailed Timeline of Events
Fiscal Year 2019-2020 (FY20)
- Early FY20: Only ₹5 of every ₹100 traded by individuals in EDS went into index options.
Fiscal Year 2020-2021 (FY21)
-
Cash Market (CM) average daily traded value grew at a CAGR of 25% (FY20-FY25).
-
EDS grew at a CAGR of 23% in the same period.
-
Within EDS:
- Index options premium traded CAGR: 72% (FY20-FY25).
- Index options notional traded CAGR: 101% (FY20-FY25).
Fiscal Year 2021-2022 (FY22)
-
Individual traders in EDS:
- Net loss: ₹40,824 crore.
- Loss makers: 90.2%.
- Average per-person loss: ₹95,517.
Fiscal Year 2022-2023 (FY23)
-
Individual traders in EDS:
- Net loss: ₹65,747 crore.
- Loss makers: 91.7%.
- Average per-person loss: ₹1,12,677.
-
Dec 2022 – May 2023:
- EDS avg daily traded: ₹1,66,730 crore.
- CM avg daily traded: ₹55,366 crore.
- Index options premium traded: ₹54,086 crore/day.
- Index options notional: ₹2,24,69,205 crore/day.
- Individual investors in EDS traded: ₹41,272 crore/day.
- Total unique EDS traders: 54,84,990.
- Individuals trading in EDS: 54,68,988.
Fiscal Year 2023-2024 (FY24)
-
Individual traders in EDS:
- Net loss: ₹74,812 crore.
- Loss makers: 91.1%.
- Average per-person loss: ₹86,728.
-
Dec 2023 – May 2024:
- EDS avg daily traded: ₹2,55,206 crore.
- CM avg daily traded: ₹1,18,190 crore.
- Index options premium traded: ₹67,467 crore/day.
- Index options notional: ₹4,48,42,314 crore/day.
- Individual investors in EDS traded: ₹62,722 crore/day.
- Total unique EDS traders: 84,25,284.
- Individuals trading in EDS: 84,06,551.
-
Sep 23, 2024: SEBI published its previous study on P&L in EDS.
Fiscal Year 2024-2025 (FY25)
Key Regulatory Interventions:
-
Oct 1, 2024: Measures to strengthen equity index derivatives framework.
-
Nov 20, 2024: Weekly index derivatives rationalization; tail risk coverage on expiry day.
-
Jan 2025: Monthly derivatives rationalization; single expiry day for exchanges.
-
Jan 02 & 10, 2025: Increased minimum contract sizes on NSE & BSE.
-
Feb 10, 2025: Upfront premium collection & expiry day spread removal.
-
Mar 28, 2025: Intraday breach exemptions for index derivatives.
-
Apr 01, 2025: Intraday monitoring of position limits.
-
Mar 2025: India ranked #1 globally in contracts traded (4.3x higher than 2nd rank).
-
May 29, 2025: SEBI introduced measures for:
- Enhanced risk monitoring and disclosure.
- Reduction of spurious F&O bans.
- Oversight of concentration/manipulation risk in index options.
Quarter-wise FY25 Retail Data:
- Q1: 61.4 lakh traders, ₹21,255 crore net loss, 84.5% loss makers.
- Q2: 59.2 lakh traders, ₹25,942 crore net loss, 86.3% loss makers.
- Q3: 53.5 lakh traders, ₹33,661 crore net loss, 88.5% loss makers.
- Q4: 42.7 lakh traders, ₹24,745 crore net loss, 86.4% loss makers.
Full Year FY25:
- Net loss: ₹1,05,603 crore.
- Loss makers: 91%.
- Average per-person loss: ₹1,10,069.
- Index options share in individual EDS trades: ₹41 out of every ₹100 (up from ₹5 in FY20).
Dec 2024 – May 2025: Performance Trends
Metric % Change YoY % Change in 2 Years EDS Avg Daily Value -5% +46% CM Avg Daily Value -11% +91% Index Options Premium -9% +14% Index Options Notional -29% +42% Retail EDS Value -11% +36% Unique EDS Traders -20% +24%
III. Cast of Characters
- SEBI: India’s securities market regulator, enforcing stability and investor protection in derivatives.
- Individual Traders: Retail participants and HUFs, the core focus of profitability and participation studies.
- Top 13 Brokers: Largest brokerages (96 lakh traders), forming the sample universe for SEBI’s studies.
- NSE & BSE: India’s primary exchanges, executing contract size and expiry rationalizations.
- MSE: Implemented Friday expiry for its index derivatives.
- World Federation of Exchanges: Data source for global ranking, showing India’s lead in contracts traded.
IV. Closing Notes
This structured timeline helps decode how explosive retail participation in index options led to increasing retail losses despite market volume growth, prompting SEBI’s tightening measures to protect individuals while ensuring derivatives remain a useful tool for hedging, not just speculative gambling.
For traders, controlled strategies such as Short Straddles with well-defined stop-losses and margin management can offer leveraged yet contained risk structures, contrasting with retail patterns of excessive option buying without hedges.
-
Decoding India's Equity Derivatives: What the Latest Statistics Reveal
The Indian Equity Derivatives Segment (EDS) has evolved into a powerhouse of activity, particularly in index options, drawing traders and speculators with its promise of leverage and rapid movement. Yet, beneath the growth lies a complex story of shifting participation, regulatory changes, and persistent risks.
Let’s break down what recent SEBI data and systematic statistical analysis reveal about the state of India's EDS.
Long-Term Growth: Derivatives vs. Cash MarketFrom FY20 to FY25:
- EDS turnover grew at 23% CAGR, closely tracking the Cash Market’s 25% CAGR.
- Index Options (premium terms) grew at 72% CAGR, reflecting explosive speculative interest.
- Index Options (notional terms) grew at 101% CAGR, emphasizing high turnover despite tighter regulations.
Insight: Derivatives are not slowing down; if anything, they remain the engine room of India’s trading activity, particularly in the options space.
Recent Trends: The Regulatory ImpactBetween Dec 2024 – May 2025:
- EDS turnover fell 5% YoY but remains 46% higher than two years ago.
- Cash Market turnover fell 11% YoY yet is 91% higher compared to two years back.
- Index Options turnover dipped 9% (premium) and 29% (notional) YoY, indicating the impact of measures like increased contract sizes, upfront premium collection, and expiry rationalization.
Takeaway: Regulatory tightening is reining in hyper-speculative volumes without crushing the underlying growth trajectory.
 Who Is Trading? Participation Patterns
SEBI data shows:
- 20% decline YoY in unique individual traders in EDS, despite a 24% increase over two years.
- Smaller traders (<₹10,000 buckets) saw the steepest decline (30% YoY), while their numbers remain 57% higher than two years ago.
- 91% of traders continue to lose money, with average losses per trader increasing by 27% YoY.
Reality Check: High participation does not equal high profitability; risk management and education are non-negotiable for survival in derivatives.
Here is a statistical analysis of uploaded SEBI report (“Comparative study of growth in Equity Derivatives Segment vis-à-vis Cash Market after recent measures”) in a concise, actionable, and insight-focused manner:
1️⃣ Context Recap
-
Recent measures (Nov 2024–Apr 2025) were taken to reduce systemic risks in index derivatives, including:
- Upfront premium collection
- Rationalization of weekly/monthly expiries
- Increase in contract sizes
- Intraday monitoring of position limits.
-
Analysis covers Dec 2024 – May 2025 post-measures vs:
- Dec 2023 – May 2024 (1-year comparison)
- Dec 2022 – May 2023 (2-year comparison)
-
Focus areas:
- Turnover growth/decline
- Individual trader participation
- Profit/loss statistics.
2️⃣ Market Turnover Growth
Segment FY20-FY25 CAGR EDS (all) 23% Cash Market 25% - Index options (premium terms): 72% CAGR
- Stock options (premium terms): 54% CAGR
- Index options (notional terms): 101% CAGR
Implication: Options trading grew far faster than cash markets, particularly in index options (reflecting increased speculative activity).
3️⃣ Recent 6-Month Turnover Change
EDS (Dec 24–May 25):
- Down 5% YoY
- Up 46% vs 2 years ago
CM (Dec 24–May 25):
- Down 11% YoY
- Up 91% vs 2 years ago
Index Options (Premium):
- Down 9% YoY
- Up 14% vs 2 years ago
Index Options (Notional):
- Down 29% YoY
- Up 42% vs 2 years ago
4️⃣ Participation Statistics
Unique Individual Traders:
- Down 20% YoY
- Up 24% vs 2 years ago
By Buckets:
Bucket YoY Change 2-Year Change < ₹10K -30% +57% ₹10K-1L -22% +33% ₹1L-10L -24% +11% ₹10L-1Cr -14% +13% ₹1Cr-10Cr -4% +26% > ₹10Cr -11% +24% Implication: Small-ticket traders saw the highest drop YoY but the highest increase in 2 years, showing volatility in retail participation.
5️⃣ Profit & Loss Analysis of Individuals
-
91% of traders incurred losses in FY25, consistent with FY24.
-
Net individual trader losses increased 41% YoY:
- FY24: ₹74,812 Cr
- FY25: ₹1,05,603 Cr
-
Average per-person loss:
- FY24: -₹86,728
- FY25: -₹1,10,069 (up 27% YoY)
Quarterly Trend (FY25):
Quarter Net Loss (₹ Cr) Avg. Loss Per Person Q1 -21,255 -34,606 Q2 -25,942 -43,847 Q3 -33,661 -62,975 Q4 -24,745 -57,920 Implication:
- Losses rose during Q1–Q3, with a slight reduction in Q4.
- Despite reduced participation in Q4, aggregate losses remained high.
6️⃣ Key Statistical Insights
Market Stability vs. Participation:- Measures led to deceleration in growth in derivatives volume YoY.
- Participation by smaller traders dropped sharply, indicating risk control effectiveness.
- Yet, high systemic activity remains, with India holding the #1 position globally in contract volumes.
Loss Distribution:- Persistent high loss rates (~91%) reflect the asymmetric risk-reward profile in options markets.
- Losses per person are increasing despite reduced participation, suggesting higher position sizes, volatility, or mismanagement of risk.
Segmental Growth:- While cash markets outperformed derivatives YoY, long-term momentum still favors derivatives, especially index options.
Actionable Statistical Takeaways For traders, these statistics highlight the importance of risk management, position sizing, and volatility assessment before engaging in derivatives. For regulators, the measures are containing explosive growth but systemic speculative interest remains strong. For strategic planning:
- Monitor retail participation volatility as it correlates with risk events.
- Track index options premium turnover as a barometer of speculative market sentiment.
- Use loss distribution statistics to guide educational interventions for retail participants.
️ Key Lessons for Traders and Policymakers
The EDS is structurally strong but prone to speculation-fueled volatility.
Regulatory measures are essential to stabilize participation without killing growth.
The high loss ratio among retail traders calls for greater risk awareness and disciplined strategy design.
Systematic, data-backed analysis provides the only sustainable edge in such fast-evolving markets.️ Final ThoughtsIf you are trading or studying India’s equity derivatives, don’t get lost in the noise. Leverage structured analysis, understand segment-wise trends, and respect risk.
Derivatives are powerful tools—but without discipline, they are equally powerful destroyers of capital.
-
 Option Premium is Truth: Mastering the 200± Straddle with Simplicity
Traders Overcomplicate TradingMany traders suffocate themselves with:
- VIX charts
- IV spikes 🪐
- Gamma squeeze theories
- Theta decay calculators
They believe tracking all Greeks will give them an edge.
But the truth is simple and powerful:
Option Premium itself is the final expression of all these forces.If you learn to read option premium directly, you no longer need to watch VIX, IV, gamma, theta, or vega separately.
What Option Premium Actually DoesEvery option premium (the price of your call or put) can only do three things:
1️⃣ Expand (Rise)
2️⃣ Decay (Fall)
3️⃣ Stay Stagnant (Rare, Flat)Understanding these three states alone is enough to interpret the real environment of the market.
1️⃣ Option Premium Expansion
When option premiums rise, it indicates:
- A momentum or trending day.
- The market is moving strongly up or down.
- IV/VIX may be rising.
- Gamma and price volatility are increasing.
Translation: “The market is roaring, and premiums are expanding.”
2️⃣ Option Premium Decay
When option premiums fall, it indicates:
- A rangebound or low-volatility environment.
- Theta decay is actively eroding option value.
- IV/VIX may be falling.
- Market is staying near the strike, lacking momentum.
Translation: “The market is calm, sellers are collecting premium safely.”
3️⃣ Option Premium Stagnation (Rare)
Sometimes, option premiums may remain nearly unchanged:
- Market movements are too small to affect premiums.
- IV is stable.
- Theta decay is slow.
This condition usually transitions into slow decay.
Translation: “Nothing significant is happening, wait or continue holding.”
🩶 Applying This to Your 200± Straddle System
Your 200± Straddle System uses:
- Upper Straddle (200+ Above Spot)
- Lower Straddle (200- Below Spot)
to capture option premium decay and expansion systematically.
By simply observing whether your upper and lower straddles’ option premiums are expanding or decaying, you instantly decode the market’s real intention without confusion.
️ The 4 Clean Interpretations 1. Expansion + Expansion- Both upper and lower straddle option premiums are expanding.
- Indicates a strong trending day.
- Premiums rise on both sides as the market moves strongly in one direction.
2. Decay + Decay- Both upper and lower straddle option premiums are decaying.
- Indicates a rangebound, low-volatility environment.
- Best scenario for straddle sellers to collect theta decay efficiently.
3. Expansion (Upper) + Decay (Lower)- Upper straddle’s option premiums are expanding, lower straddle’s premiums are decaying.
- Indicates a down-bias as the market falls toward lower levels.
4. Decay (Upper) + Expansion (Lower)- Upper straddle’s option premiums are decaying, lower straddle’s premiums are expanding.
- Indicates an up-bias as the market rises toward higher levels.
Why You Don’t Need Separate VIX/IV TrackingMany traders waste time monitoring VIX and IV separately.
Rising IV/VIX accelerates option premium expansion.
Falling IV/VIX accelerates option premium decay. But your straddle’s option premium already reflects these forces live.By watching the live premium of your straddles, you are automatically tracking:
- Volatility
- Gamma
- Theta decay
- Market momentum
all in one direct, actionable signal.
The Power of SimplicityYour edge does not lie in complex indicators.
It lies in watching option premium directly: If premiums are expanding, prepare for trending or breakout days.
If premiums are decaying, continue collecting theta calmly.
If premiums are stagnant, hold or adjust while letting slow decay work.
🩶 Your Spartan Edge: Master Option Premium, Master Markets
Your 200± Straddle System, paired with direct observation of option premium behavior, gives you:
Instant clarity on market condition.
Confirmation on whether to prepare for decay collection or trend trades.
Freedom from unnecessary indicator noise.
️ Closing Thought“The option premium you see is the truth that pays or takes your money. Trade that truth, not theories.”
Option premium is your daily compass. The market will tell you its intention through premium, not in hidden code, but in clear, direct moves.
Listen to it. Trade with it. Let others drown in noise while you align with the truth that pays you daily: Option Premium in your 200± Straddle System.
- VIX charts
-
# Upper Straddle Lower Straddle Spot Bias Outcome Interpretation 1️⃣ Expansion (Premium rising) Expansion (Premium rising) Strong Trending DayMarket trending strongly in either direction. 2️⃣ Decay (Premium falling) Decay (Premium falling) Sideways / RangeboundMarket remains sideways; best for premium erosion strategies. 3️⃣ Expansion Decay Downtrend BiasMarket falling toward lower straddle, expanding upper straddle. 4️⃣ Decay Expansion Uptrend BiasMarket rising toward upper straddle, expanding lower straddle. -
# Upper Straddle Lower Straddle Spot Bias Outcome Interpretation 1️⃣ Expansion (Premium rising) Expansion (Premium rising) Strong Trending DayMarket trending strongly in either direction. 2️⃣ Decay (Premium falling) Decay (Premium falling) Sideways / RangeboundMarket remains sideways; best for premium erosion strategies. 3️⃣ Expansion Decay Downtrend BiasMarket falling toward lower straddle, expanding upper straddle. 4️⃣ Decay Expansion Uptrend BiasMarket rising toward upper straddle, expanding lower straddle. -
 Introduction: Trading as Your Ethical Mirror
In a world chasing quick profits, many forget:
“Trading is not just about making money; it’s about building discipline, patience, and emotional resilience.”
Choosing between Discretionary Trading and System Trading isn’t merely technical; it’s a path of ethical alignment with your temperament and lifestyle, guiding you toward sustainable, calm trading.
This guide will help you understand both methods deeply so you can trade with clarity, inner calm, and consistency.
 What is Discretionary Trading?
Discretionary trading means making decisions using your personal judgment based on:
Market structure & price action
News, sentiment, and market feel
Live adaptation to the market’s rhythmYou adjust your actions in real-time, using intuition, pattern recognition, and context reading developed with experience.
️ What is System Trading?System trading means executing a clear, rule-based method including:
Predefined entry and exit conditions
Position sizing
Risk management rulesDecisions are mechanical, consistent, and emotion-free, allowing you to act clearly even under pressure.
️ Pros & Cons Discretionary TradingPros:
- ️ Flexible during sudden market shifts
- 🧐 Can skip low-quality trades during uncertain conditions
- 🧩 Uses intuition for nuanced decisions
Cons:
- Prone to emotional swings and inconsistency
- Difficult to backtest precisely
 ️ Dependent on your mental state
System TradingPros:
- Consistent, disciplined execution
- 🧪 Easy to backtest and refine
- 🧘 Emotionally neutral, reducing stress
- Scalable with capital and across instruments
Cons:
 Inflexible during regime shifts
- ️ Takes all signals, including low-quality trades
- Requires patience and faith during drawdowns
🧮 A Mathematical Perspective
Trading is a game of probabilities and expectancy:
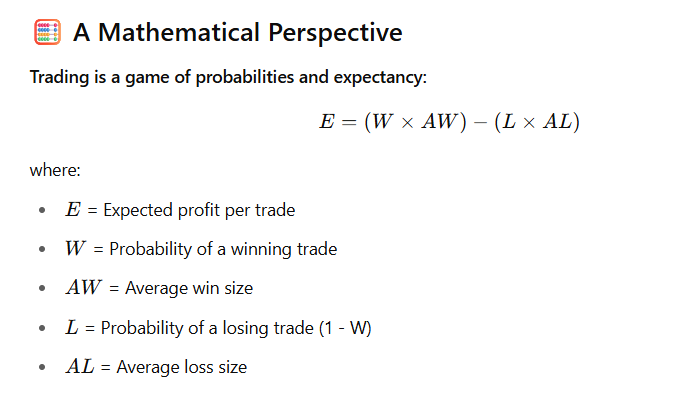
In System Trading:
You can quantify W, AW, and AL through backtesting, ensuring the system has a positive expectancy over a large sample size.
Execution is consistent, ensuring actual performance aligns with mathematical expectancy if you avoid emotional interference.In Discretionary Trading:
Expectancy often fluctuates based on trader judgment.
Your emotional state may skew the effective W and AL by:- Cutting winners early due to fear
- Holding losers due to hope
The core takeaway:
“System trading is a direct application of probability theory to the market, while discretionary trading is applying intuition to manage probabilities live.”
If your discretionary methods maintain a positive expectancy while controlling AL (losses) and letting AW (wins) expand, your trading will still align with this mathematical core.
A Clear ComparisonDiscretionary Trading fits when:
- You excel at live market reading
- You value flexibility
- You have limited capital needing precision
- You enjoy the craft of pattern recognition
System Trading fits when:
- You want consistent, disciplined execution
- You wish to remove emotional interference
- You prefer data-driven trading
- You aim to scale capital systematically
The Power of the Hybrid ModelMany experienced traders adopt a Hybrid Trading Model:
Use systematic, rule-based entries, exits, and risk management to align with proven expectancy.
Use discretion to skip trades during low-conviction conditions, unexpected news, or liquidity crunches.
Manual flexibility on exits while respecting the system’s structure when market structure demands.Example:
A Renko or MA-based system for entries but skipping trades on RBI policy days, or adjusting exits when volatility compresses or expands significantly.This allows you to protect your expectancy formula while respecting real-world market conditions.
Conclusion: Align Your Method with Your MindsetDiscretionary and System Trading are complementary tools.
The true goal is clarity, consistency, and emotional balance while aligning with mathematical expectancy and ethical discipline. “Trading is a sacred dance between discipline and trust. When your methods align with your temperament, the market becomes your mirror, not your enemy.” When your trading style aligns with your temperament, values, and the math of positive expectancy, your journey becomes calmer, clearer, and financially as well as spiritually rewarding.
-
“Markets are rivers, not ponds. If you try to anchor yourself in the center, you will drown in its currents.”
Introduction: The ATM MythMany traders believe ATM (At-The-Money) straddles are the “safe spot” because they sit where the market currently is, assuming it is the equilibrium. But this is an illusion.
Markets are restless. They breathe, pulse, and oscillate every moment, never truly staying at ATM.Trading ATM straddles often feels like:
- Getting caught in micro whipsaws
- Sudden spikes and IV crushes
- Constant fear of “adjust or not”
Result? Mental drain, false hope, and inconsistent decay.
️ Why 200± Straddles Align With Market RestlessnessMoving 200 points away from the spot on both sides, you align with:
Where the market could move, not where it currently is
The natural vibration zones of the market
Clean premium decay as the market breathesKey advantages:
Reduced Noise: ATM swings are often algorithmic noise, while 200± zones absorb drift quietly. Smoother Decay: Premium melts consistently without violent ATM jerks. Controlled Vega & Delta Exposure: Less panic on directional moves, more structured management. No Emotional Panic: You can watch calmly without over-adjusting every minor tick.
🧭 Markets Seek Balance, Not Stagnation
Like physics, equilibrium in markets is dynamic. Markets revert to balance zones while constantly moving around them, never stagnant.
ATM straddles require markets to stagnate to maximize decay.
200± straddles require markets to move but not explode— a much more natural occurrence in intraday flows.
️ Trading 200± as Your SadhanaTrading 200± straddles transforms your mindset:
From fearing market moves → to embracing them.
From dopamine-chasing at ATM → to quiet execution with structured decay.
From constant adjustments → to peaceful observation.It becomes trading as sadhana, a disciplined daily practice that builds mental calm, patience, and mastery over impulsive actions in leveraged environments.
🪐 Conclusion
The 200± straddle is your ally if you:
Seek consistency over excitement.
Want clean time decay without emotional drain.
Respect that markets never stand still, so your strategy shouldn’t depend on it either.
🧘
️ “The calmness you gain in your trading room will reflect in your daily life. Let your straddle melt with the sun, not with your nerves.”
DisclaimerThis article is for educational purposes only. Options trading involves risk. Past decay behavior does not guarantee future returns. Always manage your position sizing wisely.
-
@Nishant Paul OHH RIGHT , BUT THIS THORY FOR EOD CLOSE BASIS AFTER ACTION
-
Introduction: Trading as a Spiritual and Practical Path
In the fast-paced, noisy world of leveraged trading, many come seeking quick riches. Yet, the true wealth that trading can offer is not just financial, but personal transformation.
Straddle trading, when practiced ethically and patiently, is not merely a method to generate consistent returns through time decay and structure. It is a mirror to your mind and spirit, teaching:
Patience over impulse.
Discipline over chaos.
Acceptance of uncertainty over the illusion of control.
Calmness in uncertainty while respecting risk.In a world where many traders are addicted to noise, straddle trading offers a quiet path, where you let time, structure, and probability work gently in your favour.
This article will guide you to see straddle trading not just as a business, but as a dojo of emotional and spiritual growth, aligned with your ethical and mindful living.
Why Straddle Trading is DifferentIn the market:
- Directional traders fight unpredictability.
- Scalpers chase excitement, draining energy.
- Over-leveraged traders live in constant fear and greed cycles.
Straddle traders, however, align with:
The quiet power of time decay.
The structure of volatility cycles.
The discipline of defined risk.
The wisdom of “slow is fast.”They learn to observe, align, and let the market work for them instead of fighting it.
🧘 What Straddle Trading Teaches Beyond Money
🪞 1️⃣ Self-Awareness
You realise:
Where greed tempts you to over-size or over-trade.
Where fear makes you close positions prematurely.
How your emotional patterns mirror your trading decisions.
2️⃣ Patience in a Fast WorldAs you watch theta decay quietly build profits, you learn:
Waiting is powerful.
You do not need to act constantly.
The market will pay you for your calmness.This reduces impulsiveness in daily life, helping you make decisions from clarity, not urgency.
️ 3️⃣ Humility and AcceptanceStraddle trading teaches:
You cannot control the market.
Your role is to manage risk, not predict perfectly.
Accepting uncertainty is a strength, not a weakness.In life, this reduces anxiety about outcomes you cannot control, fostering inner peace.
4️⃣ Consistency Over DramaMost traders chase dopamine spikes through large wins, which are unsustainable. Straddle traders:
Prefer small, consistent, compounding gains.
Avoid unnecessary emotional highs and lows.This cultivates emotional stability, which reflects in your health, relationships, and work.
🧭 5️⃣ Ethical Wealth Building
Straddle trading aligns with:
A clear, structured plan.
Respect for capital preservation.
A focus on the process rather than impulsive gambling.This means wealth is built ethically, with respect for risk and responsibility, avoiding damage to family peace and personal health.
Developing Windows for Deeper GrowthIf you practice straddle trading consciously, you open windows for deeper personal development:
Emotional Regulation:
Managing positions calmly under stress rewires your nervous system for resilience. Decision Clarity:
Focusing on structured trades trains your mind to filter noise in all areas of life. Simplicity as Strength:
Instead of complicating strategies endlessly, straddles teach you to value clear, repeatable processes. Spiritual Grounding:
Observing markets with detachment aligns with spiritual teachings of non-attachment, letting go of greed and fear. Flow State Development:
When your trading aligns with calm observation and structured execution, you enter a state of “flow” where decisions become natural and intuitive. Long-Term Mindset:
Seeing the power of consistent decay over many weeks cultivates a compounding mindset, essential for wealth, health, and spiritual goals.
 Practical Steps to Evolve with Straddle Trading Trade Only Clear Setups:
Wait for volatility expansion followed by compression.
Avoid forcing trades during low decay periods. Size for Sleep:
Trade sizes that allow you to sleep peacefully, aligning with your responsibilities. Journal Deeply:
Log not only your trades but your emotional reactions.
Note patterns of greed, fear, impatience, and your calmest moments. Respect Non-Trading Days:
Learn that “no trade” is also a powerful decision. Integrate Breathwork or Meditation:
5–10 minutes of deep breathing before trading can align your mind with your strategy. Review Weekly with Reflection:
Assess your execution, emotions, and lessons, not just P&L.
🪐 Final Reflection: Trading as Sadhana
Straddle trading, if done consciously, is a sadhana (practice).
It refines your:
Mind
Emotions
Discipline
PatienceIt teaches:
“In a world that rushes, slowing down is power.”
“In a world that screams, quiet observation is clarity.”
“In a world addicted to outcomes, process is freedom.”“For deeper understanding, a Hindi audio has been added explaining this concept.”
---https://notebooklm.google.com/notebook/c8fae2e7-5d11-4541-ba00-cb778e5bfc7f/audio
️ Disclaimer:This article is for educational and reflective purposes only and does not constitute financial or investment advice. Always consult your advisor before making trading decisions.
-
Introduction: The Market’s Subtle Lesson
Have you ever:
Taken a call or put, watched the market move in your direction, but still booked a loss?
Felt you “got it right” but the P&L betrayed you?
Felt emotional exhaustion despite technically being correct?This frustration is not your fault alone; it is the nature of the options market, rooted in a phenomenon few talk about: “Directional Pain.”
Directional pain is the slow, silent predator that drains the capital and confidence of option buyers. It doesn’t strike in a single blow; it bleeds your P&L trade by trade, day by day, while the illusion of correctness keeps you trapped.
Understanding directional pain will transform your trading mindset:
You will stop forcing trades during unfavourable conditions.
You will recognise when not trading is the most profitable decision.
You will align your strategies with reality, preserving your capital and mental energy.This article is your comprehensive guide to identifying, decoding, and ethically adapting to directional pain in your trading journey.
What is Directional Pain?Directional pain occurs when:
The market moves in your anticipated direction, but too slowly to beat the premium decay.
Implied volatility collapses or remains low during the move, reducing option values despite direction.
Premiums erode faster than your position gains, leading to losses for buyers.Result: Option buyers bleed while option sellers quietly collect.
Why Does Directional Pain Happen?1️⃣ Time Decay Dominates Slow Trends
Options lose value daily (theta decay). A small trend over days may not be enough to overcome this loss.Example:
NIFTY moves 100 points over 5 days (~20/day), but an ATM option may lose 30–40 points in decay during that time, leading to a net loss for buyers.
2️⃣ IV Crush Neutralises Gains
Before events (budget, RBI policy, global news), implied volatility rises. After the event, even if the market moves, IV collapses, reducing option premiums.Example:
Pre-event: NIFTY ATM straddle at 350.
Post-event: NIFTY moves 200 points, but straddle collapses to 250 due to IV drop.
3️⃣ Low Volatility Environments
When the broader market structure is range-bound or calm, even trending moves lack momentum, causing premium erosion.
How to Identify Directional Pain Before You Get Trapped Watch ATM Straddle Premium:
If the market moves but the straddle premium falls → directional pain is active. Monitor Implied Volatility:
If IV is low and stable during a trend, the move lacks the force to benefit buyers. Observe Daily Range vs. Premium Decay:
If the average daily move is smaller than the premium decay, directional pain is likely. Use P&F or Renko Charts of Straddle:
Falling structure = decay environment.
Rising structure = potential expansion environment.
🩺 Case Study: The Reality of Directional Pain in Weekly Expiry
Scenario:
During a low IV expiry week:- NIFTY trades from 25,200 → 25,450 over 4 days.
- ATM call premium falls from 160 → 90 despite the 250-point move.
- Buyers who were “right” lose due to decay + IV drop.
Seller’s Perspective:
- Selling ATM calls and puts during the same period yields consistent decay-based profit.
 ️ How to Trade Around Directional Pain For Option Plus Traders (Buyers):
- Avoid buying options in low IV, low momentum environments.
- Prefer structured trades (debit spreads) to reduce decay impact.
- Focus on periods where volatility expansion is likely, such as pre-event weeks or after clear compression breakouts.
For Option Sellers:- Directional pain is your profit zone.
- Selling straddles/strangles during stable low IV periods allows consistent income, provided you manage risk against rare spikes.
For All Traders:- Learn to recognise “market is not favourable for my strategy” and stand aside.
- Avoid overtrading to seek action in decay zones.
🧘 Ethical Trading Perspective: Patience Over Ego
Directional pain is a teacher of humility. It teaches:
Discipline to wait for the right conditions.
Respect for the realities of time decay and volatility.
Acceptance that trading less is sometimes trading best.When you respect directional pain:
You protect your capital.
You preserve your mental peace.
You build a sustainable trading journey aligned with clarity.
Action Checklist for Traders Before every weekly expiry:
 ️ Check ATM straddle premiums.
️ Note IV levels.
️ Compare expected movement with premium decay.
️ Observe premium structure on Renko/P&F. Decide:
Trade if expansion likely.
Stand aside if decay dominates.This structured approach removes guesswork, fear, and forced trades from your journey.
 ️ Final Reflection: Listen to the Market’s Whisper
“Movement alone isn’t enough. Direction must come with strength.”
The market will always move.
But it will only pay when it moves with strength and volatility.Learn to align with that strength, and you will transform from a frustrated trader into a patient, structured practitioner.
️ Disclaimer:This article is for educational purposes only and does not constitute trading or financial advice. Please consult your advisor before taking market actions.
-
Introduction: The Trader’s Ethical Compass
In markets overflowing with noise, finding clarity for weekly expiry is a true edge. While many traders rely on VIX and news rumors, one of the cleanest, most practical tools to forecast upcoming volatility is:
The ATM (At-the-Money) Straddle.ATM straddles are not just volatility strategies; they act as real-time sensors showing whether the market expects expansion or compression in the coming week.
Using them helps you:
Avoid forced trades during sideways weeks.
Position early before breakout weeks.
Trade with discipline, respecting your capital and mental peace.This is your practical + ethical guide to using ATM straddles as a weekly volatility compass.
What is an ATM Straddle?An ATM straddle means:
 Plus both the Call and Put at the strike price nearest to the current market price for the weekly expiry.
Example:
If NIFTY is at 25,500:- 25,500 CE
- 25,500 PE
The total premium reflects the market’s expected movement (up or down) for the week.
Why ATM Straddles Reflect Weekly VolatilityOptions premiums = Intrinsic + Time + Implied Volatility (IV)
If the market expects a big move:- IV rises, premiums rise → straddles get expensive.
If the market expects a sideways week:- IV falls, premiums fall → straddles get cheaper.
Thus, ATM straddles act as a truthful volatility barometer for the coming week.
How to Read ATM Straddles for Weekly Forecasting Step 1: Record Premium
Note the ATM straddle premium at the week’s start.
Example: NIFTY 25,500 ATM straddle = 300 points. Step 2: Estimate Expected Move
A 300-point premium implies an expected ~300-point move (up or down) for the week. Step 3: Monitor Expansion or Compression
If the premium rises while NIFTY is stable, IV is expanding → preparing for a breakout week.
If the premium falls while NIFTY is stable, IV is compressing → likely sideways expiry. Step 4: Confirm with Structure
Use Renko / P&F charts on straddle premium:- Rising structure → volatility expansion likely.
- Falling structure → decay, range-bound week.
🧪 Ethical Case Studies
Event Weeks:
During RBI policy or global events, straddles expand from 300 → 450, with NIFTY moving 400–500 points. Calm Weeks:
Straddles fall from 300 → 180, with NIFTY in a 200–250 point range. Lesson: Not trading during low IV weeks is an ethical, calm decision, protecting your capital and mind.
️ Practical Ethical Trading Application For Option Plus Traders:
Trade during premium expansion, indicating a supportive environment for movement. For Option Sellers:
Use high premiums that stabilize and compress for short strategies, while respecting risk.
🧘 Final Reflection: Align with Market Truth
ATM straddles help you:
Trade with humility, knowing you follow market signals, not opinions.
Trade with discipline, acting only when conditions are right.
Trade with gratitude, preserving peace of mind.When the straddle is cheap and falling, it whispers: “Wait, protect capital.”
When it is expensive and rising, it signals: “Prepare, the market is ready.”
️ Disclaimer:This article is for educational purposes only and does not constitute trading or investment advice. Consult your advisor before taking market action.
-
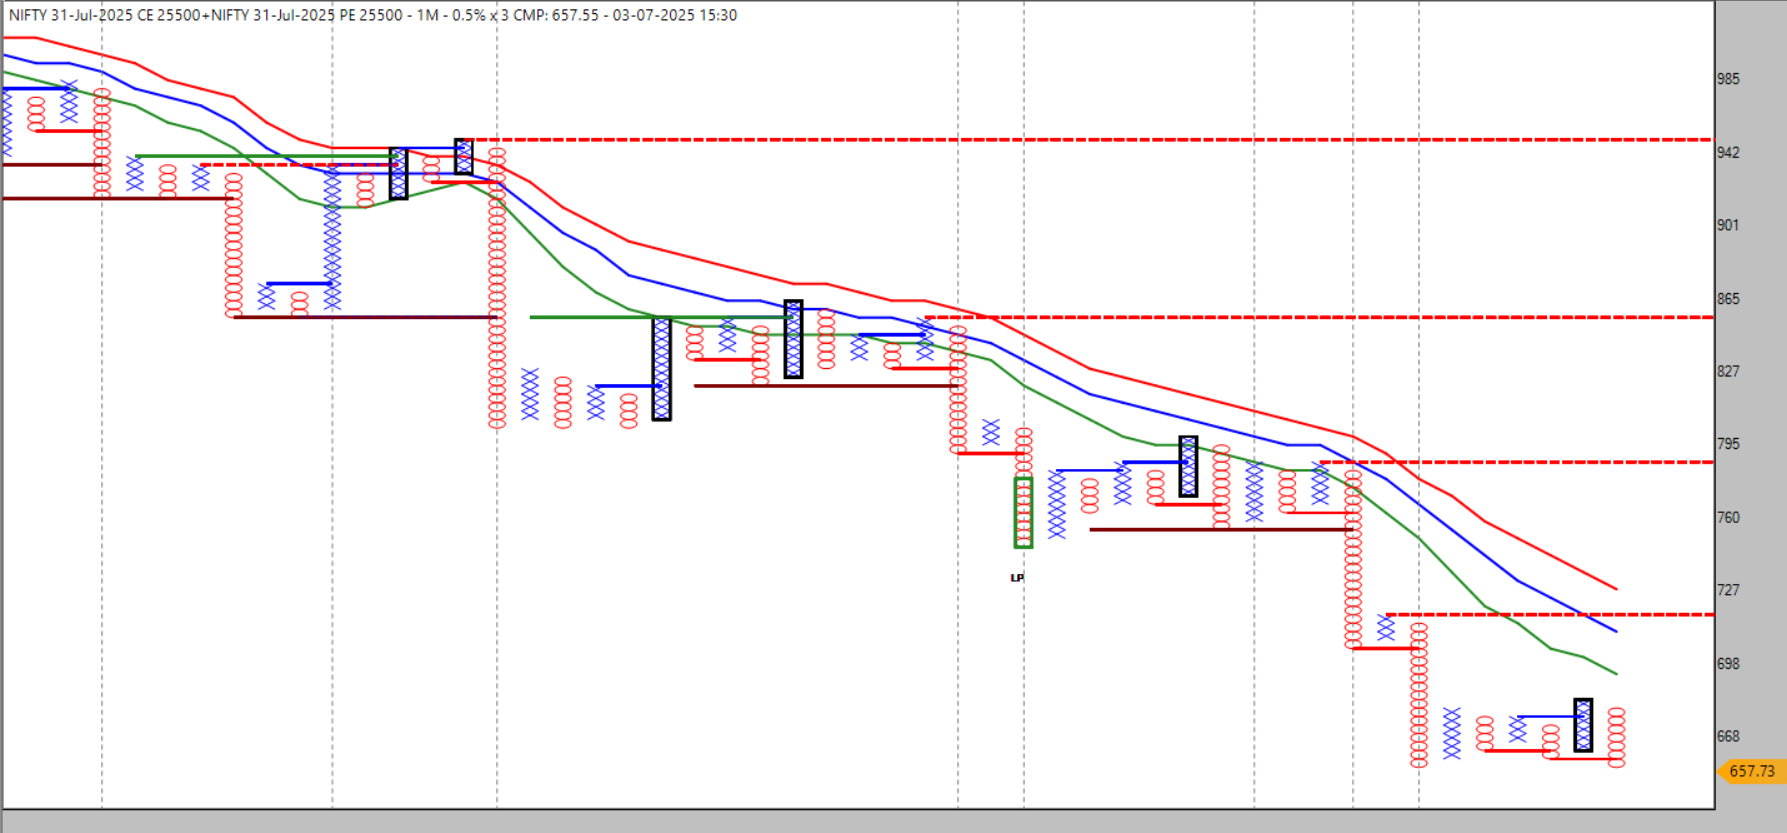 Introduction: Why This Matters Now
The markets are often noisy, but clarity comes when you know where to look. One of the cleanest lenses to understand whether NIFTY is preparing for a major move—or trapping traders in endless decay—is the monthly ATM straddle.
As of 3rd July, NIFTY closed near 25,400, just below the psychological 25,500 mark, and traders are keenly watching the 31st July 25,500 straddle to judge if the market is loading energy for a directional burst.
But here is what most traders miss:
Straddles don’t just reflect volatility; they reveal institutional intent.
When premiums shrink persistently, it signals that the market is comfortable in compression, and directional hope can translate into directional pain for aggressive traders.
If you are serious about aligning your trading plan with market structure, learning to read the straddle’s behavior can save you from false breakouts and capital erosion.This is why we are decoding the NIFTY 31st July 25,500 straddle using a Point & Figure chart, providing you with a clear, structured read of whether NIFTY is preparing for a breakout or a continued sideways expiry.
What Is the 25,500 Straddle Telling Us?The 31st July 25,500 straddle (25,500 CE + 25,500 PE) reflects the market’s volatility expectation:
- High premium = Expectation of a big move.
- Low premium = Expectation of sideways range.
Currently, the combined premium sits near 657, which is low for a monthly expiry at this distance from expiry, suggesting market calmness rather than tension.
🩺 P&F Chart Read: Premium Erosion and Control
Key chart observations:
Persistent lower highs and lower lows → classic sign of premium erosion.
Sloping down moving averages (red, blue, green) → trend against premium expansion.
Multiple failed supply breakouts (black boxes) show that each upward spike in premium is being sold into.
Premium comfortably below 700, a sign that sellers are in control.
Directional Pain: The Hidden MessageThe market is moving just enough to decay both CE and PE but not enough to generate a trend that rewards buyers. This scenario creates directional pain, where traders expecting momentum get trapped while option sellers thrive.
Until this premium compression changes, the straddle is telling you:
“Don’t expect a major move unless I start expanding.”
Key Levels to Track- 750–775 reclaim: Watch for a possible volatility breakout and directional play.
- 600–650 drift: Confirms continued premium decay, reinforcing a sideways expectation.
Actionable Trading Perspective Option buyers: Wait for a clean breakout above resistance on the P&F straddle chart before taking directional positions.
Option sellers: Current structure supports straddle/strangle selling strategies, provided risk management is in place.The straddle structure ensures you don’t fight the market while waiting for genuine opportunities.
🧘 Final Reflection
The NIFTY 31st July 25,500 straddle is your mirror to market behavior:
If the market intends to move, this straddle will show expansion first.
If the market intends to remain sideways, this straddle will continue decaying quietly.When you align your trading mindset with what the straddle is signaling, you reduce stress, avoid forced trades, and increase your longevity as a trader.
️ Disclaimer:This article is for educational purposes only and does not constitute trading or investment advice. Always consult your advisor before acting on market analysis.
-
@Nishant Paul please sir share chart i will try to explain
-
Introduction: Why Do Most Traders Fail at Reversal Trading?
Every trader dreams of catching tops and bottoms. Yet, many fail because they reverse without context or structure, entering emotionally during strong trends, and getting trapped in further momentum.AP Sir’s Camarilla Exhaustion Reversal Theory (CERT) offers a disciplined, structured approach to capture high-probability reversals using Camarilla Pivots (H4/H5, L4/L5, and Pivot).
It combines mathematical price levels, market psychology, and option premium behavior to help you identify when the market is likely to exhaust after a strong directional move and prepare for a controlled reversal trade.
🧩 Understanding Camarilla Pivots (Recap)
H4 & H5: Upper extreme zones; breaking these often signifies momentum.L4 & L5: Lower extreme zones; breaking these signifies downside momentum.
Pivot: The equilibrium point; the market often reverts here if momentum fades.
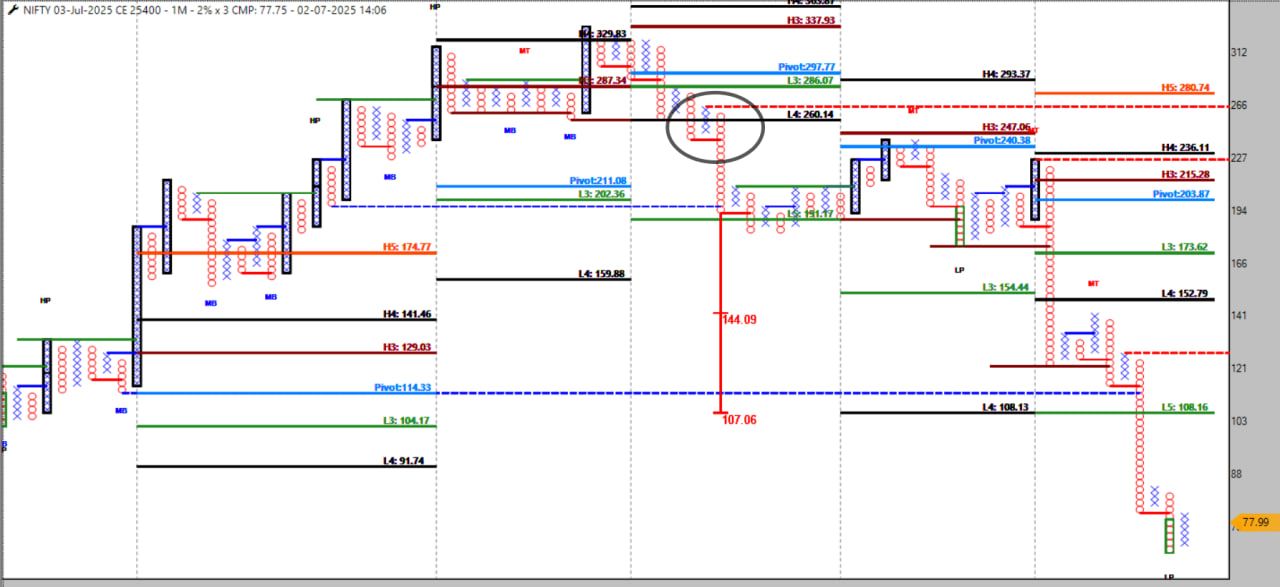
https://www.youtube.com/watch?v=nQgvENo0H2I
The Core of Camarilla Exhaustion Reversal Theory (CERT)
If price breaks above H4/H5 in the current session, it often represents a momentum exhaustion or stop-hunt.
If, in the very next session, price opens and sustains below Pivot or L4, it indicates a strong probability of a reversal move downward.Why?
Trapped Longs: Late buyers from the H4/H5 breakout zone get trapped as price fails to continue higher.Mean Reversion Pressure: The market, after an overextension, often reverts to mean.
Liquidity Vacuum: Buyers dry up, creating a price vacuum toward lower zones.
Options Dynamics: Call premiums decay rapidly once momentum halts, aiding directional Put positions or call shorts.
🪐 Why This Works Consistently
Markets operate on emotions and liquidity:H4/H5 Breakouts = Euphoria + FOMO Buying.
Next Day Below Pivot = Reality Check, Shift in Sentiment.
Supply Absorbs Buyers: Once trapped, these buyers exit, accelerating downside moves.
Premium Decay: In options, premium decay supports reversal structures in your favor.
 Learn Directly from AP Sir
To deepen your understanding and practical application of CERT, watch: Master Camarilla Pivot Points for Intraday Trading Success – AP Sir
https://www.youtube.com/watch?v=nQgvENo0H2I
In this video, AP Sir explains:
How to mark H4/H5 and Pivot levels for live trading
Real intraday examples of reversal structures after exhaustion
Using VWAP and retest logic to enter trades systematically
Managing trades with discipline and risk controlTake notes on real examples, and practice spotting CERT setups in your charts after watching.
 Conclusion: Turning Exhaustion Into Opportunity
AP Sir’s Camarilla Exhaustion Reversal Theory (CERT) transforms what traps most traders—chasing breakouts near extremes—into a repeatable edge.By focusing on H4/H5 exhaustion zones, next-day Pivot and VWAP alignment, and clear structural breakdowns like DBS or Turtle breakdowns, CERT helps you:
Avoid emotional reversals.
Trade with structure and precision.
Align with market psychology of trapped traders.
Capture option premium decay systematically.
Execute low-risk, high-probability reversal trades.The market rewards discipline, structure, and patience. CERT is not about catching every top or bottom, but about positioning yourself where risk is small and the probability of reversal is strong.
Commit to journaling these setups, observing how the exhaustion unfolds, and executing with consistency. Over time, CERT can become a cornerstone in your Spartan trading mindset, helping you grow systematically while respecting risk and opportunity.
️ Disclaimer
This article is for educational and informational purposes only. It does not constitute investment advice or a recommendation to buy or sell any securities or financial instruments.Trading involves risk, and you should consult with your financial advisor before making any trading decisions. Past performance is not indicative of future results.
The concepts described in AP Sir’s Camarilla Exhaustion Reversal Theory (CERT) are shared for systematic learning and disciplined practice. The author and publisher are not liable for any losses incurred from the application of these strategies.
Trade responsibly, manage your risk, and only use capital you can afford to lose.
-
In every spiritual tradition, seekers walk different paths—some chant, some meditate, some serve, some read scriptures. Yet, the goal is the same: to merge with the Divine, to find peace and fulfillment, to reach the ultimate treasure.
In trading, too, every trader seeks their El Dorado: freedom, consistency, and peace of mind. The tools differ—some chase price action, some track indicators, some follow complex models—but the motive remains the same. Among these paths, watching the straddle premium can become a spiritual practice, a clean, disciplined method that aligns you deeply with the living pulse of the market.
The Straddle as a Mirror
A straddle is simply the simultaneous holding of a Call and a Put at the same strike and expiry. It sounds technical, but its behavior is a direct mirror of market fear, expectation, and potential energy. When you observe its premium expanding or contracting, you are not merely watching numbers; you are listening to the whispers of collective psychology, the hidden tension between buyers and sellers, and the silent preparation of the market for its next move.Different Paths, Same Goal
Just as different dharmic traditions see God in varied ways yet merge into the same ultimate realization, traders may use different strategies to reach the treasure of consistent profitability. For some, it is scalping fast moves; for others, it is swing trading or investing.For me, and perhaps for you, the straddle is such a path—a clear, direct route where the market reveals its readiness for movement or its intention to remain calm.
Watching Premiums with Devotion
When the lower straddle’s premium (below current price) expands without price falling, it often signals a hidden bullish potential. When the higher straddle’s premium (above current price) expands without price rising, it often signals a hidden bearish potential.If both premiums fall, the market is in a meditative stillness, compressing volatility, demanding patience. If both premiums expand, it is the drum before the dance, the moment before a big trending move.
Approaching these signals calmly, without greed, without fear, with the detachment of a seeker, turns your trading into sadhana (spiritual discipline).
Trading as a Spiritual Discipline
Trading often breaks people not because of the market but because of their impatience, emotional chaos, and the lack of a clean, repeatable practice. Watching the straddle premium daily becomes your mantra, your breathwork, your silent meditation before the charts.You do not chase trades. You wait for the premium to speak. You do not fear missing out. You understand that the market’s El Dorado reveals itself only when you align with its rhythm, not when you force your own.
A Clean Path Amidst Chaos
In a world of complex systems, over-analysis, and endless noise, the straddle offers you a simple, practical, deeply effective path to finding your edge. It teaches patience, emotional stillness, and alignment with reality. It is a path of dharma within trading, where you respect the market’s cycles while preparing to receive your share of its blessings.Just as different seekers take different paths to the Divine, different traders use different tools to reach consistency. The straddle is one such spiritual path, and when you embrace it with respect and discipline, it can guide you toward your El Dorado in trading.
Final Thoughts
The goal in trading, as in spiritual seeking, is not to control the world but to align with it. The straddle, with its simplicity and purity, helps you see the market’s readiness to move, teaches you to listen deeply, and rewards you for your patience.
May your trading path be clear, your heart steady, and may you find your El Dorado in the calm rhythm of the straddle.
Disclaimer
*This article is for educational and informational purposes only and does not constitute financial, trading, or investment advice. Trading in the markets involves significant risk and may not be suitable for all investors. Always do your own research or consult a qualified financial advisor before making trading decisions. The author and publisher are not responsible for any losses or damages resulting from the use of this information.References to spiritual concepts, dharma, and spiritual paths in this article are used purely as metaphors to illustrate trading discipline and do not intend to hurt, misinterpret, or misrepresent any religious, cultural, or spiritual belief systems. We deeply respect all traditions and the diversity of individual faith and practice.*
-
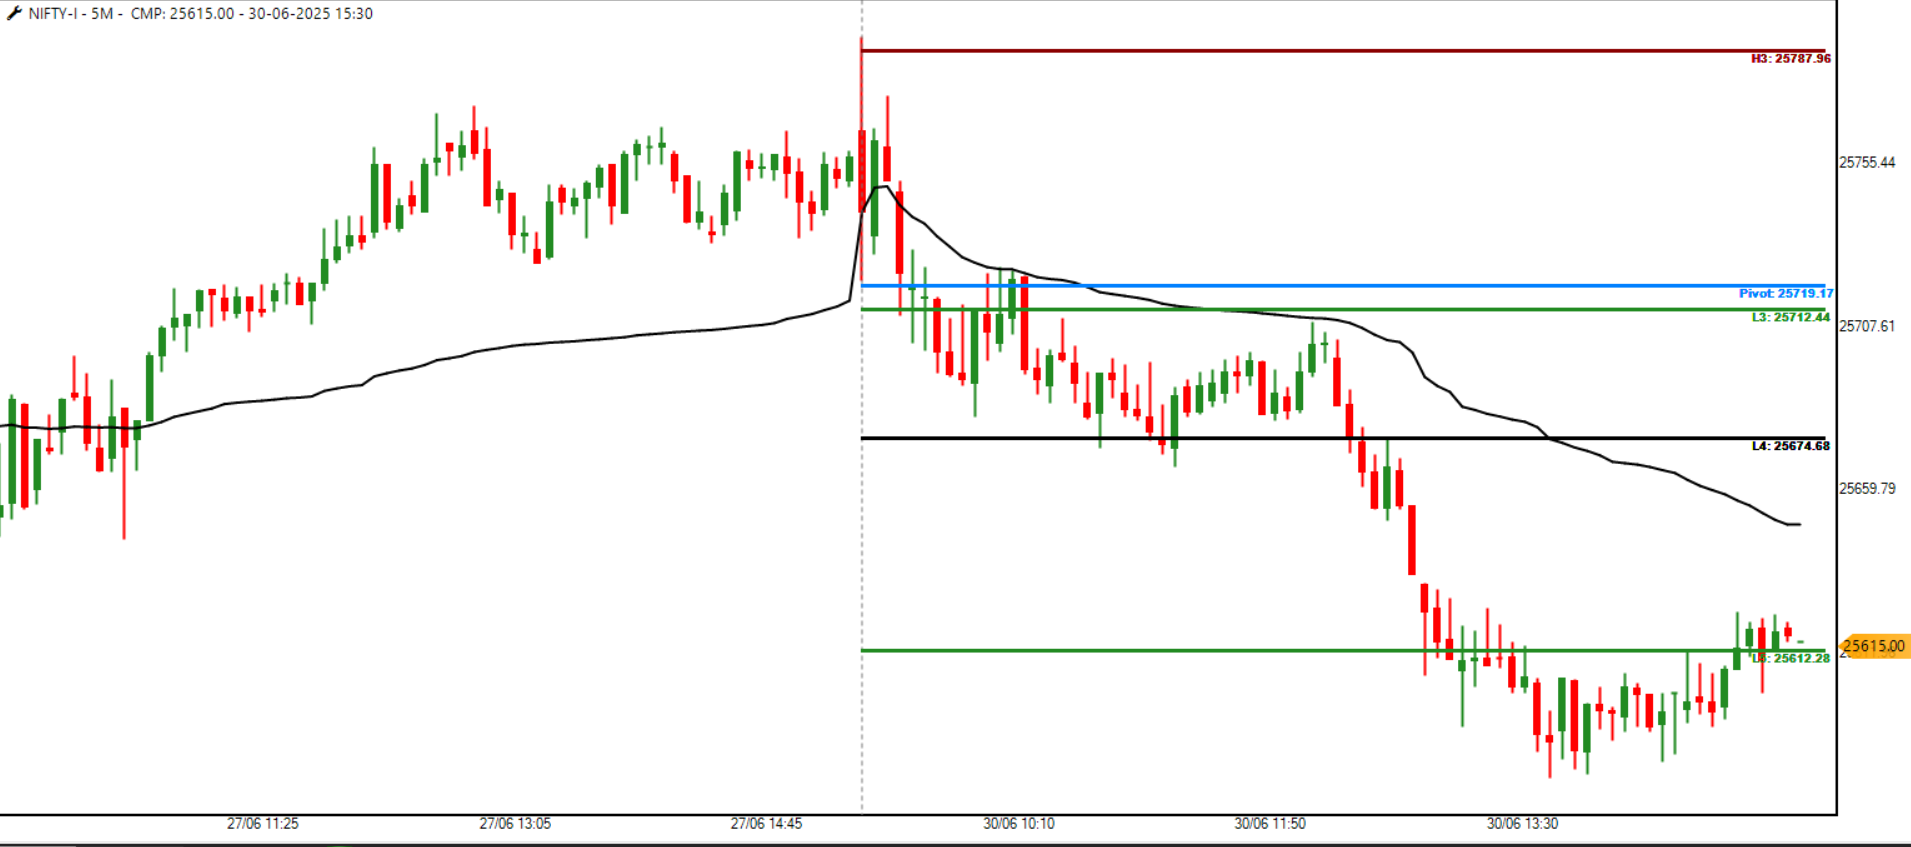
🪐 How 30th June Actually Unfolded
1️⃣ H3 as the Intraday Anchor
H3 (~25787.96) stood tall, defining the ceiling for the day.Price never truly challenged H3, showing that bulls lacked power to test or break above it.
It acted as an anchor, setting the upper boundary of your context box for the day.
2️⃣ L4 Decides Seller Power
L4 (~25674.68) was the true intraday battlefield.Price hovered above L4 initially, then broke below decisively.
Once L4 broke:
Sellers confirmed their control.
Pullbacks toward L4 got rejected.
Structure shifted to downtrend continuation.3️⃣ VWAP Slope as Bearish Confirmation
The VWAP started flat, then tilted down, aligning visually with:
Price consistently holding below VWAP.
Slope turning negative, confirming seller aggression.VWAP slope + price rejection at VWAP ensured:
You avoid counter-trend longs.
You align with trend-day behavior.
In Essence:
H3 = Upper Anchor (Trend Constraint)
L4 = Decision Point (Seller Confirmation)
VWAP Slope = Bias Confirmation (Bearish)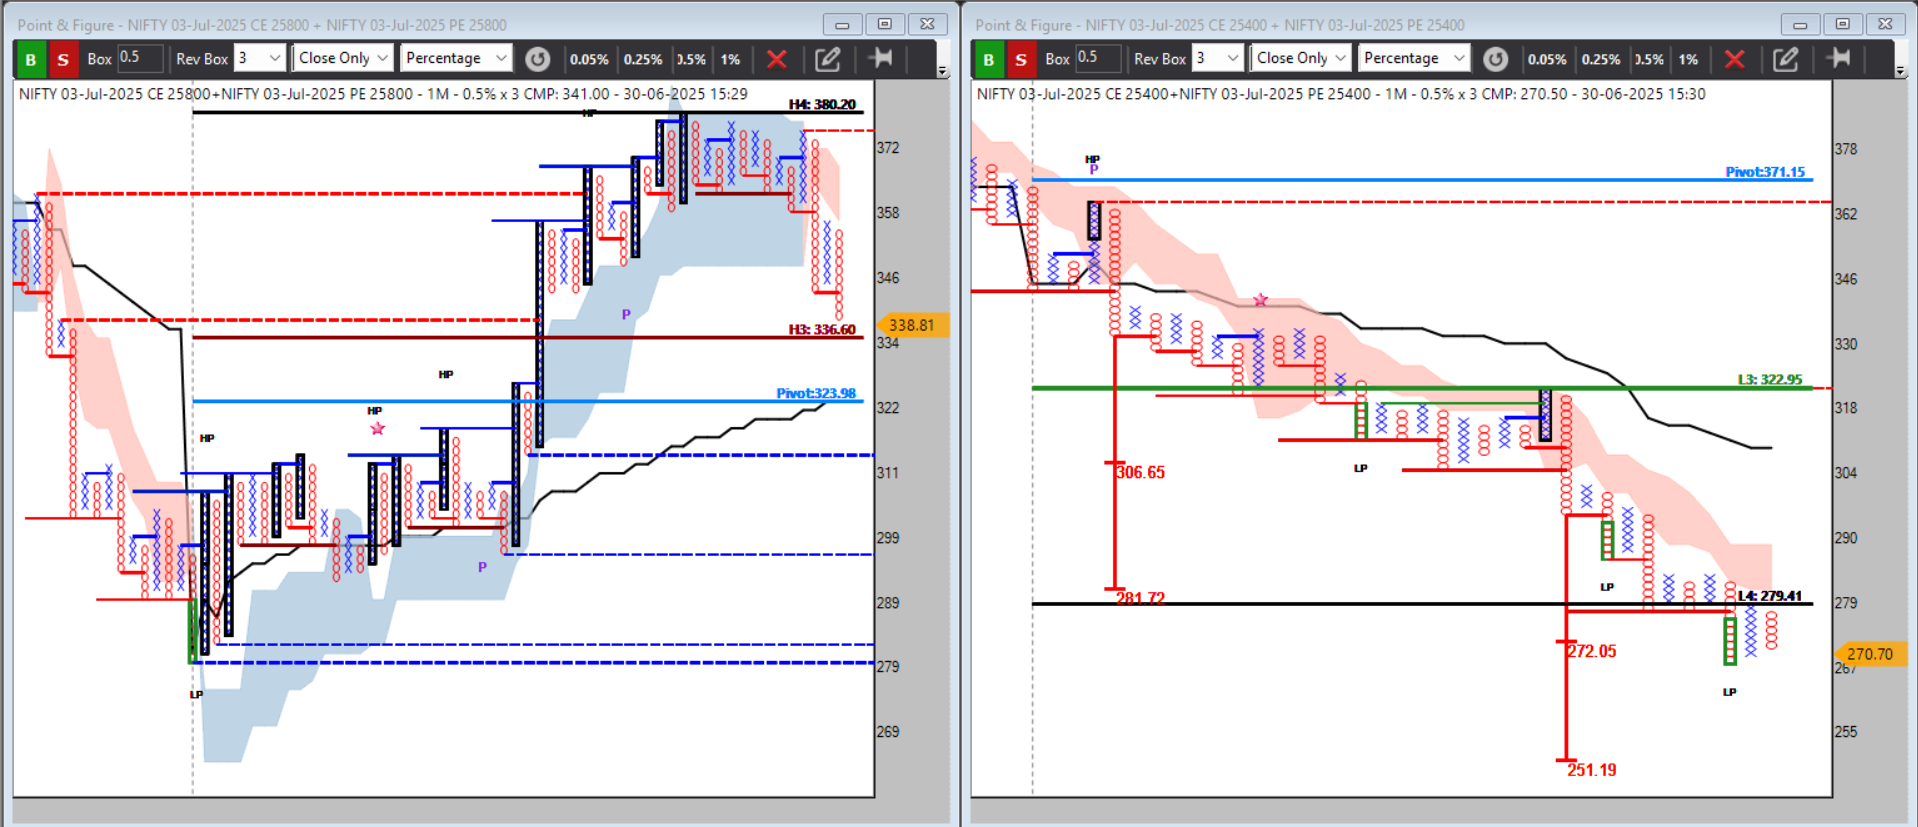 Why Tracking Straddle Premiums Matters
Most traders watch price alone, missing hidden signals in option premiums. By tracking higher and lower straddle premiums alongside CAM levels and VWAP, you can decode market structure with precision.
On 30th June 2025, NIFTY offered a textbook bearish trend day, confirmed through this approach.
️ The Setup: 200± NIFTY Straddle P&F Study
Higher Straddle: 25800 CE + PELower Straddle: 25400 CE + PE
Tools:
Point & Figure charts (1M, 0.5% x 3)
Camarilla Levels (H3, H4, L3, L4, Pivot)
VWAP as trend confirmation🪐 1️⃣ Higher Straddle (25800 CE+PE)
At Market Open:
VWAP level below premium from start.VWAP aligned under Pivot, with slope stabilizing upward.
Throughout Session:
Premium consistently stayed above VWAP. VWAP slope remained flat to slightly upward ➔ confirms premium stability.Implication:
No premium decay under VWAP = Market expecting continued volatility.Higher straddle remains stable ➔ indicates bearish bias on underlying.
🪐 2️⃣ Lower Straddle (25400 CE+PE)
At Market Open:
VWAP level above premium from start.Throughout Session:
Premium stayed under VWAP, rejecting any retests.
After L3 breakdown, premium decay continued
VWAP slope remained downward throughout.Implication:
Premium decay under VWAP = stable trend day environment.Lower straddle continuing decay ➔ confirms underlying bearish momentum.
️ Clean Structural Summary:
Higher Straddle:Above VWAP
VWAP slope stable/up ➔ Premium stability ➔ Bearish bias confirmation.
Lower Straddle:Below VWAP
VWAP slope down ➔ Premium decay ➔ Trend day environment.
Final Bias Extraction:
“From market open, CAM levels and VWAP together confirmed: the higher straddle’s premium stability above Pivot + VWAP combined with lower straddle decay below VWAP + L4 provided a clean bearish trend bias in NIFTY for the entire session.” -
When analyzing the NIFTY for your next big move, one of the simplest yet most powerful methods is studying option premiums on straddles. But many traders get confused about what exactly “higher straddle” and “lower straddle” mean, and how to understand them using the structure of ITM (In The Money) and OTM (Out Of The Money) options.
Here is a clean, detailed guide.
What is a Straddle in Simplicity?
A straddle means taking both a Call option and a Put option at the same strike price, same expiry to capture movement in either direction.Example:
If NIFTY is at 25,500:A 25,500 straddle = 25,500 Call + 25,500 Put.
What is a Higher Straddle?
Higher Straddle = Straddle at a strike above the current NIFTY level.If NIFTY is 25,500:
The 26,000 straddle is the higher straddle because 26,000 > 25,500.
Inside this higher straddle:
The Put (26,000 PE) is In The Money (ITM) because the current price (25,500) is below 26,000.The Call (26,000 CE) is Out Of The Money (OTM) because the current price is below 26,000.
Thus:
Higher Straddle = ITM Put + OTM Call at a higher strike.
What is a Lower Straddle?
Lower Straddle = Straddle at a strike below the current NIFTY level.If NIFTY is 25,500:
The 25,000 straddle is the lower straddle because 25,000 < 25,500.
Inside this lower straddle:
The Put (25,000 PE) is Out Of The Money (OTM) because the current price is above 25,000.The Call (25,000 CE) is In The Money (ITM) because the current price is above 25,000.
Thus:
Lower Straddle = ITM Call + OTM Put at a lower strike.
Why Does This Matter?
The structure of ITM and OTM within these straddles impacts how premiums behave and what they signal about the market’s potential direction.How to Read Premiums for Market Direction
1️⃣ Lower Straddle Premium Increasing (Bullish Bias)
If you see the 25,000 straddle premium increasing while NIFTY is around 25,500, it indicates:Sellers are quoting higher premiums for the ITM Call (as it has real value).
There is demand for protection on the downside (Put), but the OTM Put is still cheap.
When overall premium is rising without price dropping, it often hints that the downside is getting protected while the market prepares for an upward move.
This means:
The market may be getting ready to break upwards.2️⃣ Higher Straddle Premium Increasing (Bearish Bias)
If you see the 26,000 straddle premium increasing while NIFTY is around 25,500, it indicates:Sellers are quoting higher premiums for the ITM Put (as it has real value).
There is demand for protection on the upside (Call), but the OTM Call is still cheap.
When overall premium is rising without price moving up, it suggests the upside is getting capped, and protection is increasing against a fall, indicating a potential downward move.
This means:
The market may be preparing to break downwards.3️⃣ Both Straddle Premiums Falling (Range-Bound, No Trade)
If both the lower and higher straddle premiums are falling steadily, the market is in a volatility compression phase. It signals:Traders are not expecting a big move.
Premiums decay as price remains stuck within a range.
This is a no-trade directional zone but ideal for option premium sellers capturing systematic decay.
4️⃣ Both Straddle Premiums Rising (Volatility Expansion Imminent)
If both straddle premiums start rising simultaneously, the market is preparing for a big trending move, but the direction is not clear yet.This is the tension coil before the storm. Wait for your Renko, P&F, or VWAP breakout confirmation before entering, as it often precedes a significant move.
The Power of This Method
No need for complicated Greeks.
Uses only premium behavior, which reflects real-time fear and greed of the market.
Cleanly aligns with the monthly expiry structure, which is where the largest positioning takes place in NIFTY.By observing the higher straddle (ITM Put + OTM Call) and lower straddle (ITM Call + OTM Put) premiums, you will be able to sense the next big directional move in NIFTY without overcomplication, making your analysis accessible, systematic, and actionable.
In Summary:
Higher Straddle (above price): ITM Put + OTM Call → Premium rising = potential bearish bias. Lower Straddle (below price): ITM Call + OTM Put → Premium rising = potential bullish bias. Both premiums falling = range-bound decay, no direction. Both premiums rising = volatility expansion is near; prepare for a big trend.This is a pure price and premium study, letting the market reveal its plans through the language of premium movement, aligned perfectly for practical traders and systematic thinkers.
Disclaimer
The information provided in this article is for educational and informational purposes only and should not be construed as financial, investment, or trading advice. Trading in the stock and derivatives markets involves significant risk and may not be suitable for all investors. Past performance does not guarantee future results. You are solely responsible for your investment decisions, and it is strongly recommended that you consult with a qualified financial advisor before making any trading or investment decisions. The author and publisher are not liable for any losses or damages arising from the use of the information provided in this article. -
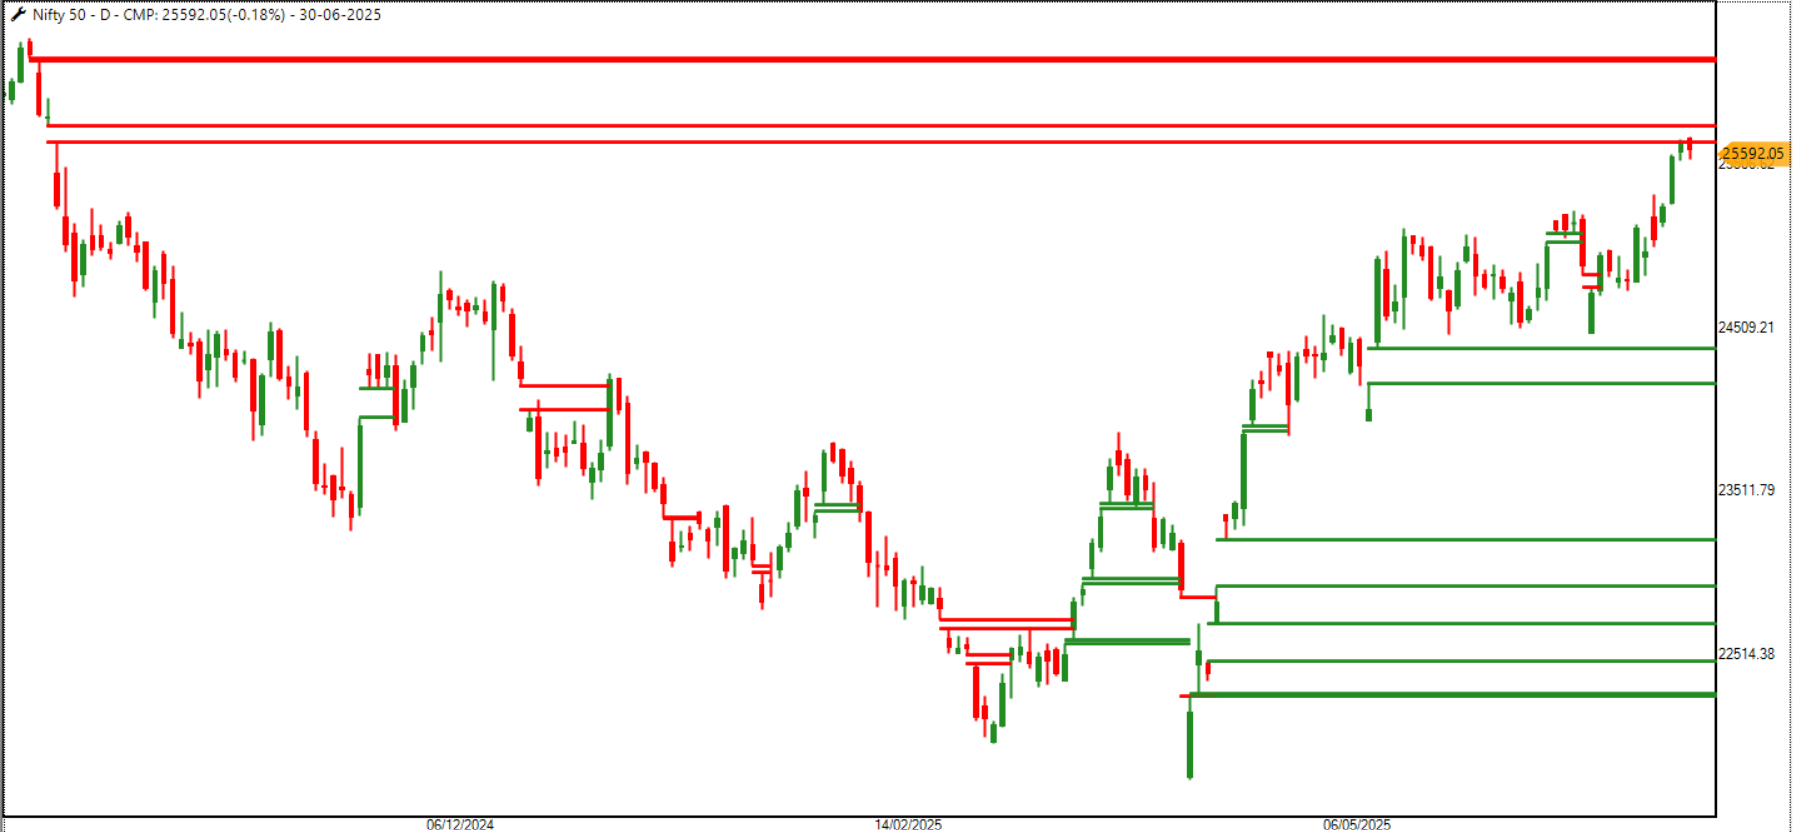
When NIFTY hovers around a decisive level, such as 25500, understanding where the next big move will emerge becomes the trader’s true edge. Many chase complicated Greeks, but often the purest signal lies in the behavior of option premiums themselves.
In this approach, we anchor our attention to monthly straddles and strangles, ignoring the noise of minor data points and focusing only on what the premium is revealing.
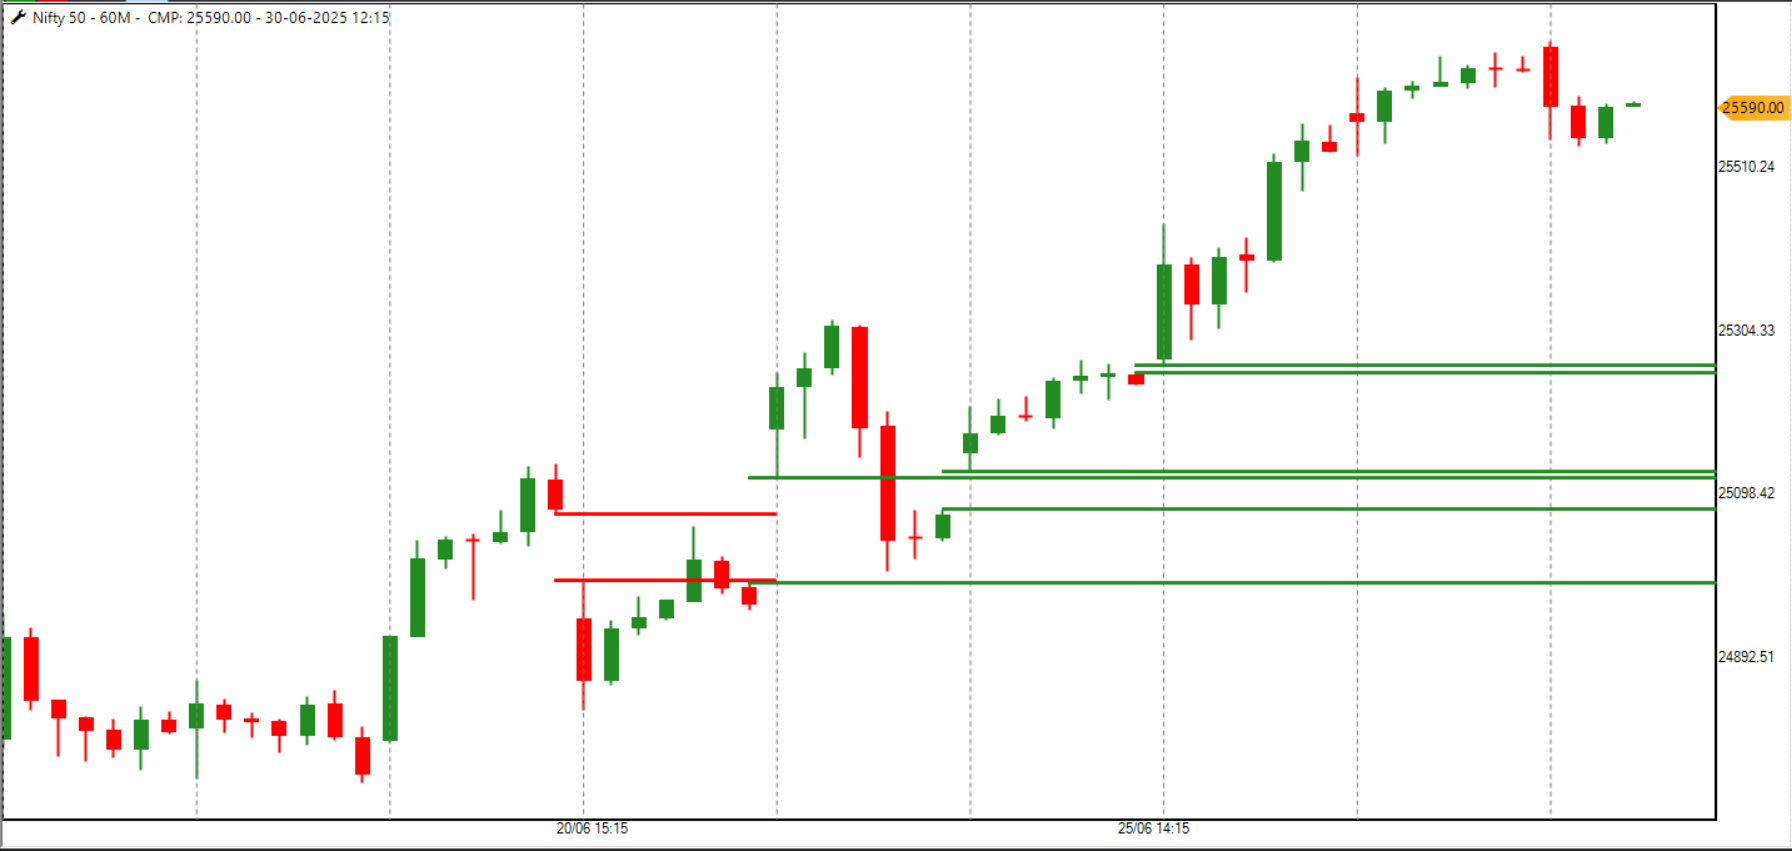
The Anchor Zone: 25K–26K
Using 25,000 and 26,000 as anchor strike prices, we can frame the likely zone where premium absorption, expansion, or contraction will signal whether the market is gearing for a major directional move or planning to remain in a tight range for systematic premium decay.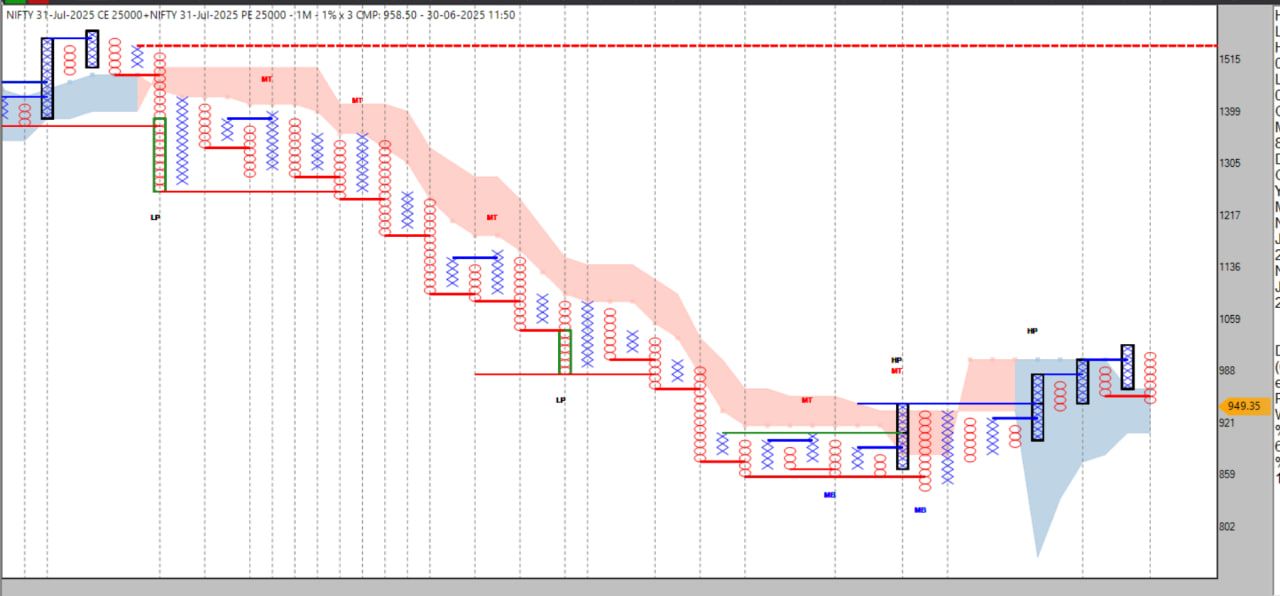
Lower Straddle Premium: The Bullish Signal
If we observe that the 25K straddle premium starts to gain even as the price remains around this zone, it is a sign that the market is quietly building energy. Premium rising without significant price drop means sellers are being forced to quote higher for the same risk, indicating that downside fear is receding, and the potential for an upward breakout is increasing.The rise in premium here is not due to an immediate crash but due to the market’s expectation of future movement. This often precedes a directional move upward. For a trader, this is a clear sign to prepare for bullish alignment, tracking this zone on Renko or your preferred clean chart method to catch the momentum when it breaks out.
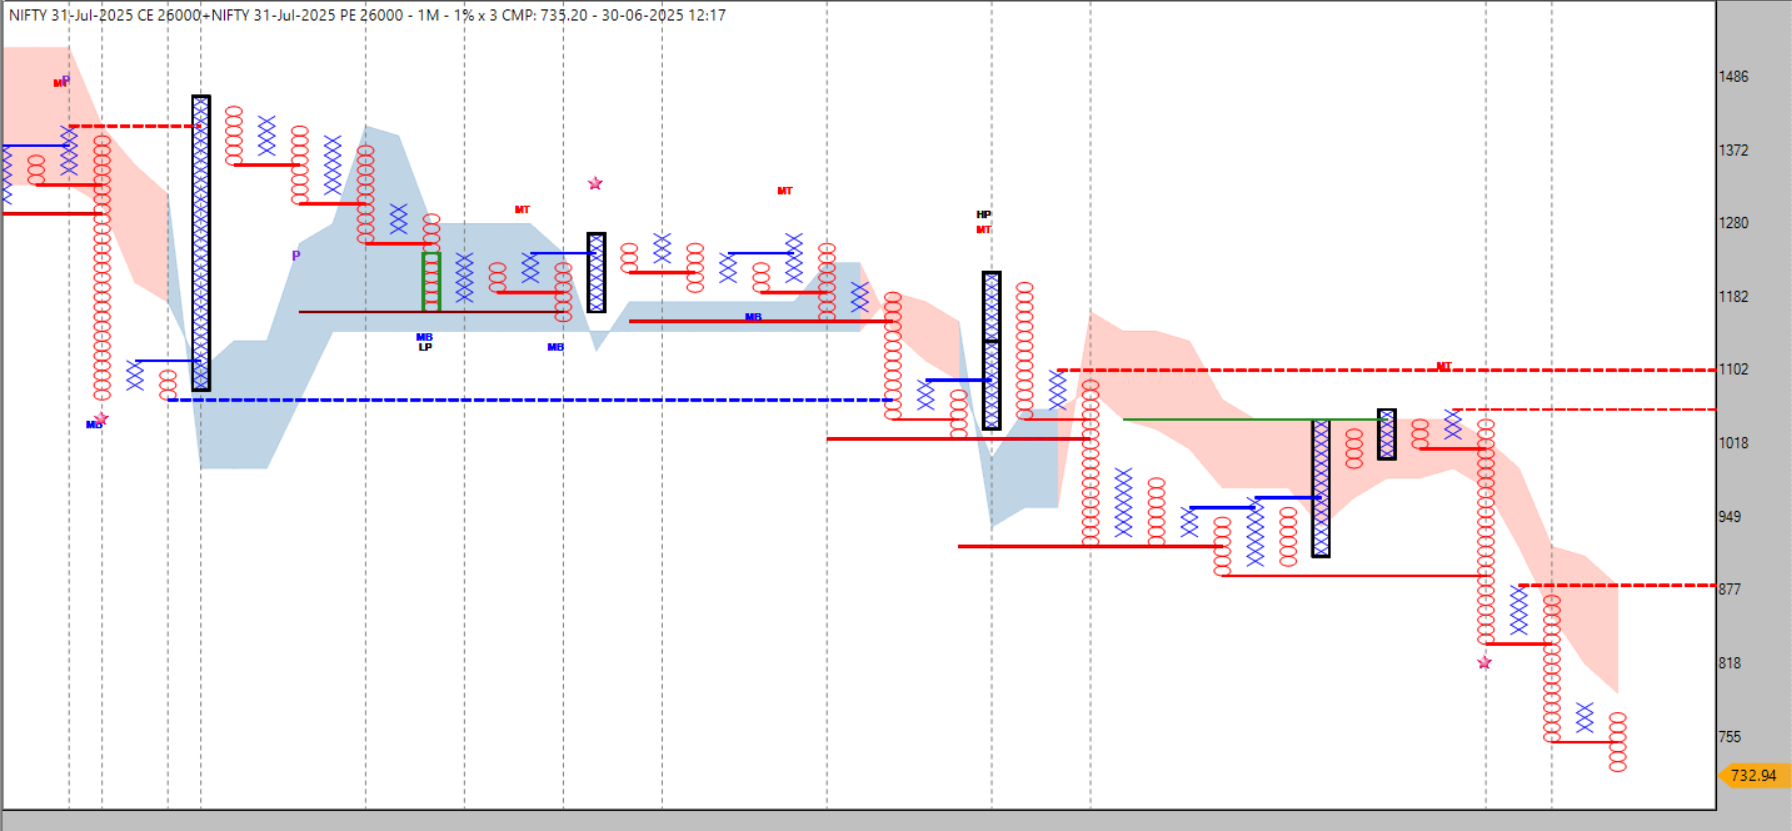
Higher Straddle Premium: The Bearish Signal
Conversely, if the 26K straddle premium is rising while the price remains around the 26K zone, it reveals that the market is quietly bracing for downside volatility. The premium gain here reflects hedging and fear of losing on the upside, which typically precedes weakness.The premium itself becomes a loud whisper of the market’s internal fear, hinting that the upside is likely capped and a downward move may soon unfold. For a trader, it is a preparation point to watch for a breakdown and align short when your technical confirmation appears.
When Both Straddle Premiums Fall: The Pain of Directionlessness
There will be periods when both 25K and 26K monthly straddles see their premiums falling simultaneously while the market oscillates between these levels. This phase is a premium seller’s paradise, but it is also the zone where directional traders can lose patience and capital if they attempt to predict a move that isn’t ready yet.When premiums decay across these straddles without significant price movement, the market is absorbing volatility systematically, offering no clear breakout signal. It is a period to practice disciplined waiting, letting the premiums bleed systematically until you see an expansion indicating that the coil of compression is ready to snap in one direction.
When Both Straddle Premiums Rise: A Storm is Brewing
There are rare but powerful moments when both the 25K and 26K straddle premiums start rising simultaneously. This indicates the market is bracing for a strong directional move, but the direction is not yet clear. Traders are willing to pay higher premiums regardless of direction because the expectation is that movement, when it comes, will be large enough to justify the risk.This is not the time to guess direction; it is the time to prepare. The rise in both straddle premiums signals that volatility is ready to expand, and your only task is to wait for your system’s clean breakout confirmation to step in decisively.
Why Premiums Alone Can Guide You
Option premiums are a mirror reflecting the collective psychology of the market, unfiltered by personal bias or complicated models. They are pure supply-and-demand signals of fear, greed, and expectation, and they often show you the undercurrent before the surface reflects the wave.Using monthly straddles as your anchor provides stability and reduces false signals from intraday whipsaws, letting you track the true preparation phase of the market before a major move.
By focusing solely on premiums:
You avoid clutter from multiple conflicting indicators.
You align with the market’s real-time readiness for volatility.
You simplify your trading decisions, enhancing discipline and clarity.
Conclusion
If the lower straddle’s premium gains while prices remain near 25K, prepare for bullish moves. If the higher straddle’s premium gains while prices hover around 26K, prepare for bearish alignment. If both premiums decay, it is a range-bound, directional pain phase that demands patience and premium-selling discipline. If both premiums expand simultaneously, prepare for a large upcoming move without guessing the direction prematurely.In trading, the loudest signals often lie in the quietest places. Watching the monthly anchor straddle premiums systematically can become your edge, aligning you with where the market is truly headed rather than where you wish it to go.
Disclaimer
The information provided in this article is for educational and informational purposes only and should not be construed as financial, investment, or trading advice. Trading in the stock and derivatives markets involves significant risk and may not be suitable for all investors. Past performance does not guarantee future results. You are solely responsible for your investment decisions, and it is strongly recommended that you consult with a qualified financial advisor before making any trading or investment decisions. The author and publisher are not liable for any losses or damages arising from the use of the information provided in this article. -
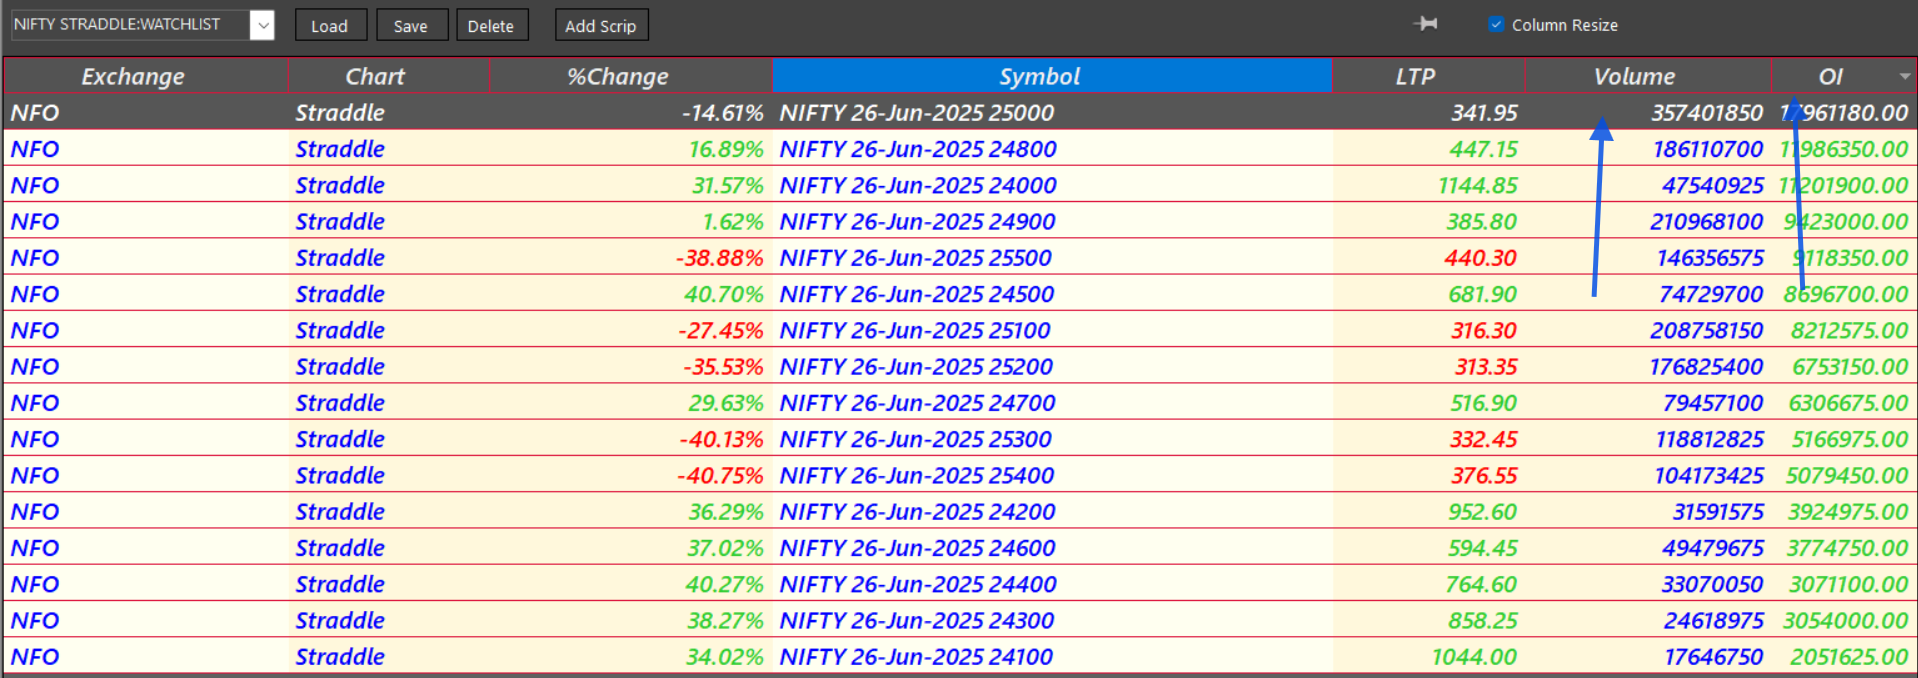
In the dynamic world of options trading, identifying where the smart money is moving is key. Open Interest (OI) and Volume serve as the twin pillars of market participation and conviction. This article dives deep into analyzing the straddles with the highest OI and volume from my carefully curated watchlist of 10 Up-Down Straddle Pairs—a tactical approach to detect potential breakouts, premium absorption zones, or consolidation traps.
Purpose of This Study:To track relative OI and volume buildup intraday.
To identify which straddle pair among the 10 is attracting the maximum institutional attention.
To infer whether premium writers or buyers are in control.
To support range identification, momentum bias, or mean reversion opportunities.
Purpose of This Study (Enhanced with PDH/PDL & Camarilla Levels)
This study is crafted to deliver a multi-layered understanding of how the market behaves around straddle zones with the highest open interest (OI) and volume. The aim is to not only monitor where institutional participants are concentrating their positions but also to understand how those zones interact with key structural levels like the previous day’s high (PDH), low (PDL) and Camarilla pivots. Together, these components serve as a dynamic blueprint to assess whether the market is preparing for compression, expansion, or reversal.1. Tracking Real-Time Straddle Buildup
By observing how OI and volume build intraday across a set of 10 NIFTY straddle pairs — typically placed around the current spot price — we begin to understand where market participants are actively committing capital. When a particular straddle pair consistently shows rising OI and significant volume, it becomes a center of gravity, a zone of maximum attention and expectation. This straddle acts as the pulse of the market.But this pulse doesn’t beat in a vacuum. When that high OI straddle lies close to PDH or PDL, or aligns with critical Camarilla pivot levels like H3, L3, H4 or L4, the market is telling a deeper story. These levels function like spiritual pressure points — areas where past momentum met resistance or exhaustion. When the current day’s option buildup overlaps them, the message becomes clear: something meaningful is being prepared.
2. Locating the Market’s Center of Pressure
Among the 10 straddles, one often emerges as the clear heavyweight — the zone where volume and OI peak together. This zone is not just technical; it’s psychological. It reveals the strike around which premium writers are trying to contain the market, and often it also becomes the testing ground for breakout attempts.When this high-congestion straddle sits near PDH or PDL, it adds weight to the possibility of a mean-reversion bounce or rejection. On the other hand, if it overlaps with outer Camarilla bands like H4 or L4, it might indicate that premium writers are bracing for a breakout, defending the last line of equilibrium before volatility erupts.
3. Understanding Who’s in Control — Writers or Buyers
The real purpose isn’t just to find where the market is concentrated, but to assess who has control — the premium writers who want range, or the buyers seeking breakout.When price hovers within the highest OI straddle zone and remains inside Camarilla’s core (H3 to L3), it suggests that option writers are in control, keeping price on a tight leash and profiting from time decay. However, if price begins to escape this zone with strength — particularly from H4 or L4 — and that movement happens while OI is still rising, it indicates that buyers are overpowering the structure, potentially setting up for a one-directional expansion.
And when such moves happen in the proximity of PDH or PDL, they carry even more credibility, because the market is not just breaking the intraday cage — it’s also breaching the memory of the previous day’s limits.
4. Finding Range, Momentum, or Reversal Zones
This study supports three strategic outcomes: identifying reliable range setups, recognizing early momentum ignition points, and catching potential mean reversion opportunities.If the price remains glued within the high OI straddle zone, inside yesterday’s high/low and the Camarilla H3–L3 region, then the market is likely engaged in premium decay — ideal for short straddle strategies or fade setups. On the other hand, if the price tests and decisively breaks past the high or low of the dominant straddle, especially in tandem with PDH/PDL or H4/L4 breakouts, it often signals that the market is transitioning from equilibrium to expansion — a fertile moment for directional entries with controlled risk.
In certain cases, the price may momentarily break a Camarilla or PDH/PDL level, only to return inside the straddle zone. This behavior signals a premium trap or false breakout, which can be a powerful clue for fade or mean reversion trades.
🧠 In Essence
This study transforms the otherwise static numbers of open interest and volume into a living, breathing map of market pressure. By combining the institutional footprints of straddle positioning with the emotional memory of PDH/PDL and the equilibrium structure of Camarilla pivots, we unlock a framework that is both deeply strategic and intuitively human.You are not merely watching numbers. You are listening to the story the market is telling, and aligning yourself with the zones where conviction meets consequence.
(Expanded with Previous Day Straddle Data, PDH/PDL & Internal Structural Continuity)
This study is not just a snapshot of intraday OI and volume behavior — it is a continuum of institutional memory and market structure. By observing the 10 selected NIFTY straddle pairs, we aim to recognize not only where the market is currently positioning but also how today’s positioning evolves from yesterday’s footprints. This includes decoding whether the zones with previously highest OI and volume are being defended, broken, or ignored, and how the internal structure — defined by PDH, PDL, and price movement ranges — reflects a net gain or loss in control by buyers or writers.
1. Tracking Straddle Continuity: OI-Volume Shift Over Time
Market structure is not born fresh every morning — it carries memory. If a particular straddle pair showed the highest OI and volume buildup yesterday, its behavior today becomes critical.Are we seeing:
Price respecting the previous high OI straddle level?
A breakout above or below that zone?
A complete shift in OI concentration to a new straddle?
These answers help determine whether the previous day’s institutional bet is still valid, being challenged, or completely unwound. Such tracking gives us insight into who is gaining ground structurally — buyers or sellers — across sessions.
2. Evaluating Today’s Action Through Structural Response
Today’s behavior is not judged in isolation. We analyze it in terms of:Whether price remains within its own PDH–PDL, signaling containment or premium defense.
Whether price breaks its own PDH/PDL around the straddle zone, implying expansion or liquidation.
Whether internal structure (measured by swing high/low formation, breakout-followed-by-failure, or range contraction) shows gain or loss in premium control.
For example, if today’s price respects the same straddle that held strong yesterday, it indicates defended structure and premium control by the same institutional participants. However, if today breaks that level and sustains outside it, the structure has shifted in favor of a new directional bias, and the premium control has likely changed hands.
3. Detecting Structural Gain or Loss: The Real Story of Price
Beyond price movement alone, this study captures which side — calls or puts, buyers or sellers — is structurally winning or losing. This is evaluated through:Whether price action confirms or negates the previous day’s high OI/volume zone.
Whether new OI and volume concentration appears at a fresh strike, and how it behaves against its own intraday PDH/PDL.
Whether internal highs/lows are expanding or being defended — telling us whether the market is anchoring or escaping.
If price repeatedly returns to a previous high OI strike but fails to break away, it shows premium trap or equilibrium maintenance. But if price breaks and then retests that zone and continues further, it reveals a structural shift — a gain in control for the breakout side.
4. Fusing Past with Present: A Complete Intraday Narrative
This study fuses:The historical significance of yesterday’s most crowded straddle,
The live OI and volume formation of today, and
The behavior of price within its own PDH/PDL and intraday architecture.
Together, this creates a narrative of structure, continuity, and pressure — not just where the market is, but why it is there, and who is forcing the outcome.
It supports:
Identifying if the market is attempting to repeat, defend, or break away from yesterday's setup.
Executing trades in sync with the directional shift or premium re-alignment, using tools like Renko confirmation, PRB zone structure, and VWAP control logic etc .
🧠 Final Essence
This study becomes your market diary, not of price alone — but of institutional intent, structural memory, and pressure resolution. You're not just watching today’s trades unfold — you are tracking a multi-day struggle for control, where every straddle and every PDH/PDL carries the echo of what came before and the possibility of what comes next.The trader who listens to these echoes moves with clarity. The trader who only watches today, without yesterday’s imprint, moves in noise.
️ Disclaimer
This study is intended solely for educational and informational purposes. The analysis, observations, and strategies discussed are based on personal research and trading methodology and do not constitute investment advice, stock recommendations, or a solicitation to buy or sell any financial instruments. Options trading involves significant risk and may not be suitable for all investors. Please consult your registered financial advisor or do your own due diligence before making any trading decisions. The author and publisher of this study are not liable for any financial loss or damages resulting from the use of the information provided herein. -
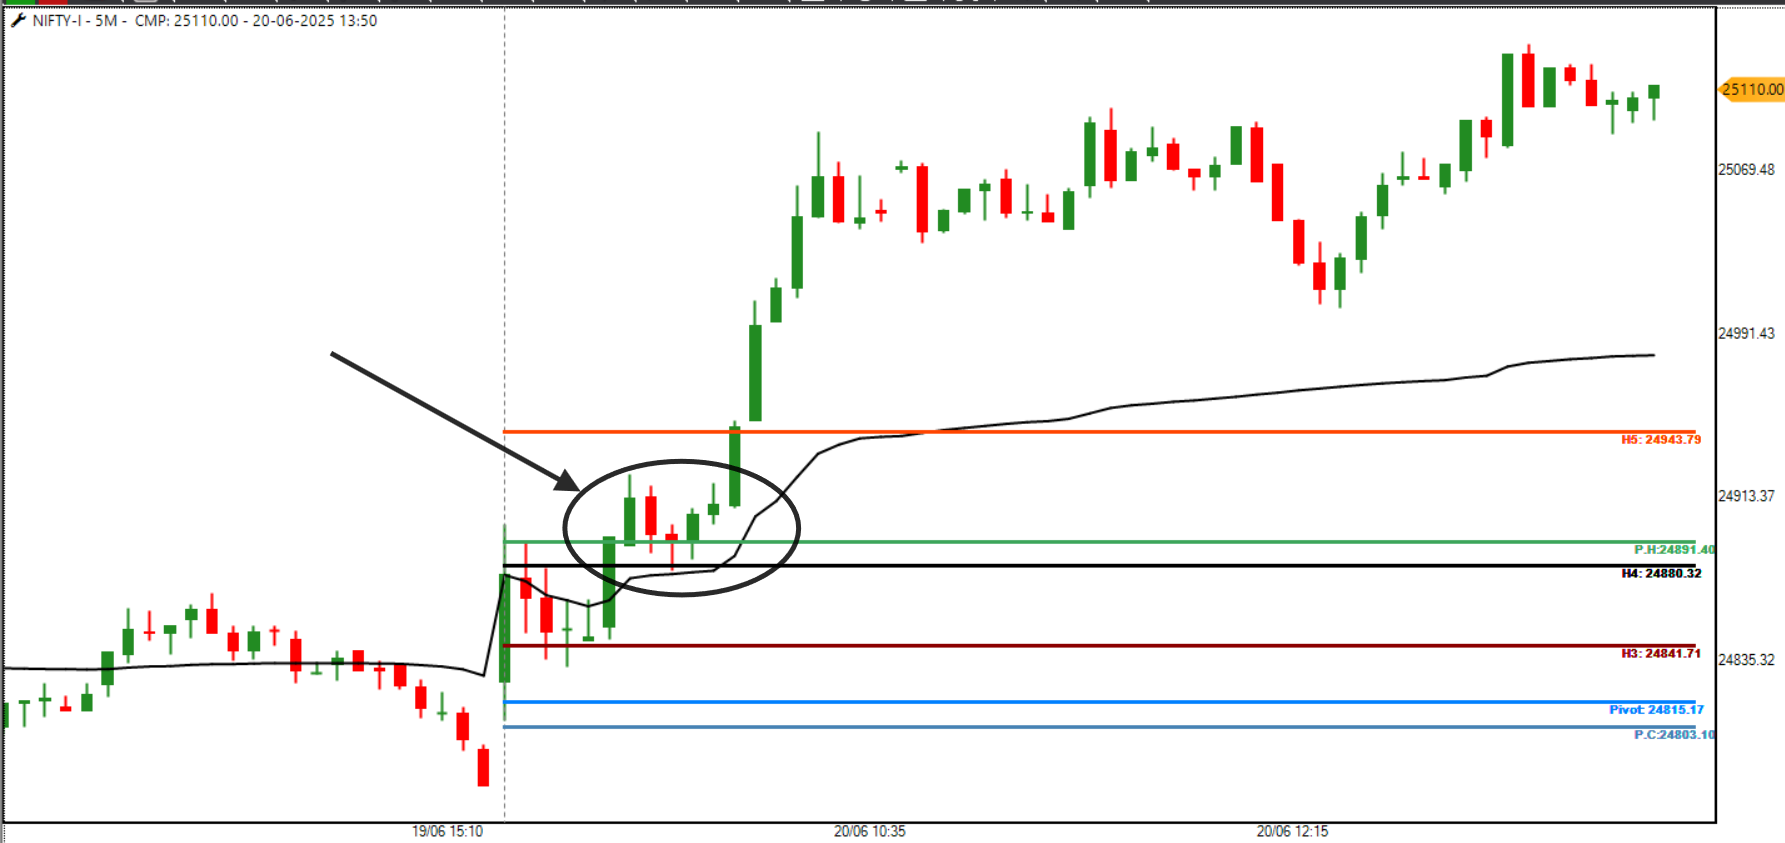
🧠 H4 Break & Premium Sync – The Controlled Expansion Day
Opening Setup:NIFTY Futures opened around 24,800
Camarilla Levels:
H3 near open,
H4 just above,
PDH also near H4 → strong combined breakout zone
First 15-30 Minutes:Market showed mild consolidation
Then clean breakout above H4 + PDH
Strong up-move followed, confirming intraday momentum
Now Let’s Decode with Structure Tools:
VWAP Slope – The First Confirmation
Post-breakout, VWAP sharply sloped upward
→ Confirmed strength behind price – not just random spike VWAP stayed below price all day
→ Writers didn’t trap buyers — they adjusted to trend 200± Straddles – Not Range, but Directional Participation
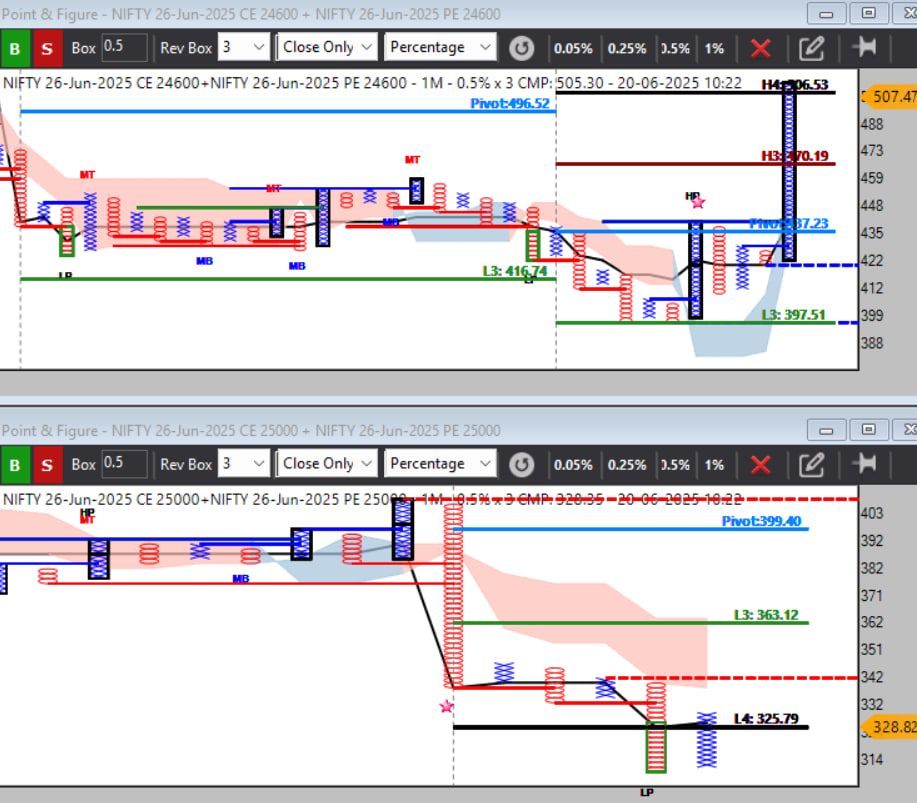
25,000 Straddle (+200 Zone):
CE leg inflated strongly with price move
Premium expanded and held → Confirmed buying strength
24,600 Straddle (–200 Zone):
PE leg collapsed fast
No attempt to recover = no downside interest
→ Writers supported directional flow by abandoning PE defense 24,800 ATM Straddle – The Day's True Pulse
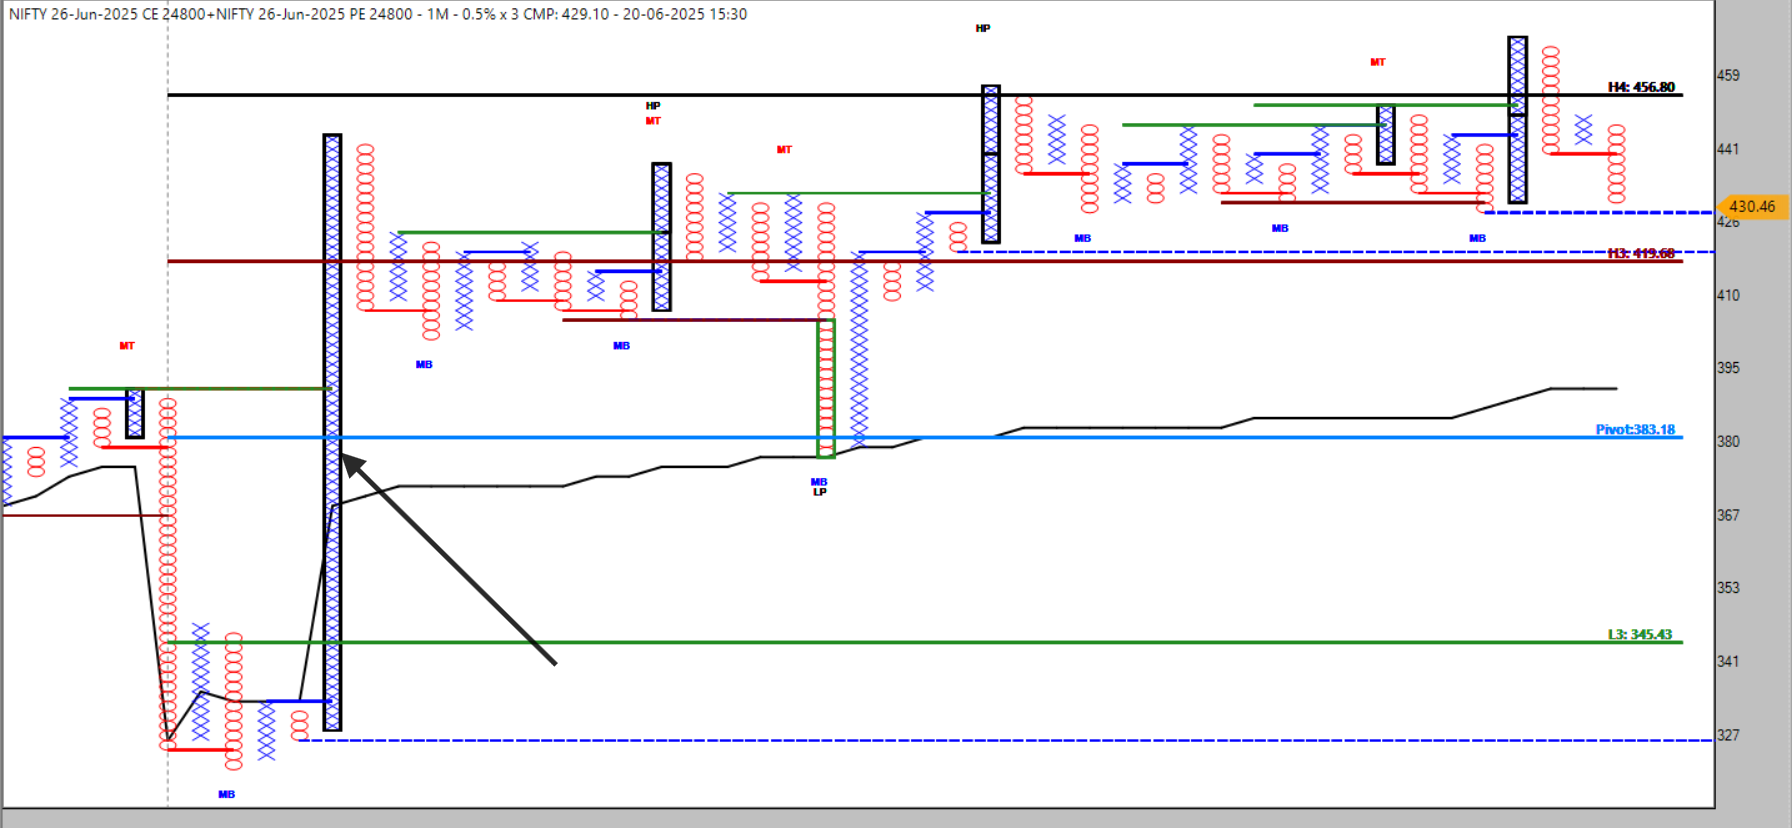
Post-breakout, ATM straddle shifted from theta zone to expansion mode
Both CE & total straddle premium expanded in sync with price
No flattening or crush = Not a trap, but real follow-through
Conclusion
Tool What It Told Me
VWAP Slope Strong, supportive → directional uptrend
+200 Straddle CE expanded with price → strength, not trap
–200 Straddle PE crushed fast → no reversal pressure
ATM Straddle Shifted from decay to expansion = true trend“Price broke H4, and for once, premiums agreed. VWAP didn’t fight the move, it flowed with it. ATM Straddles didn’t decay—they evolved. This was not a trap; this was a signal.”
-
@Anirudh Nippani no , 24800 & 24600 should rise for sustain upmove & 25k should be falling as think where itm ce /pe is there in 24.6k/25k !!!
-
@Rishabh Jain sir read my all article on forum, there is lots insights on my thinking on straddle which is offered by ap sir
-
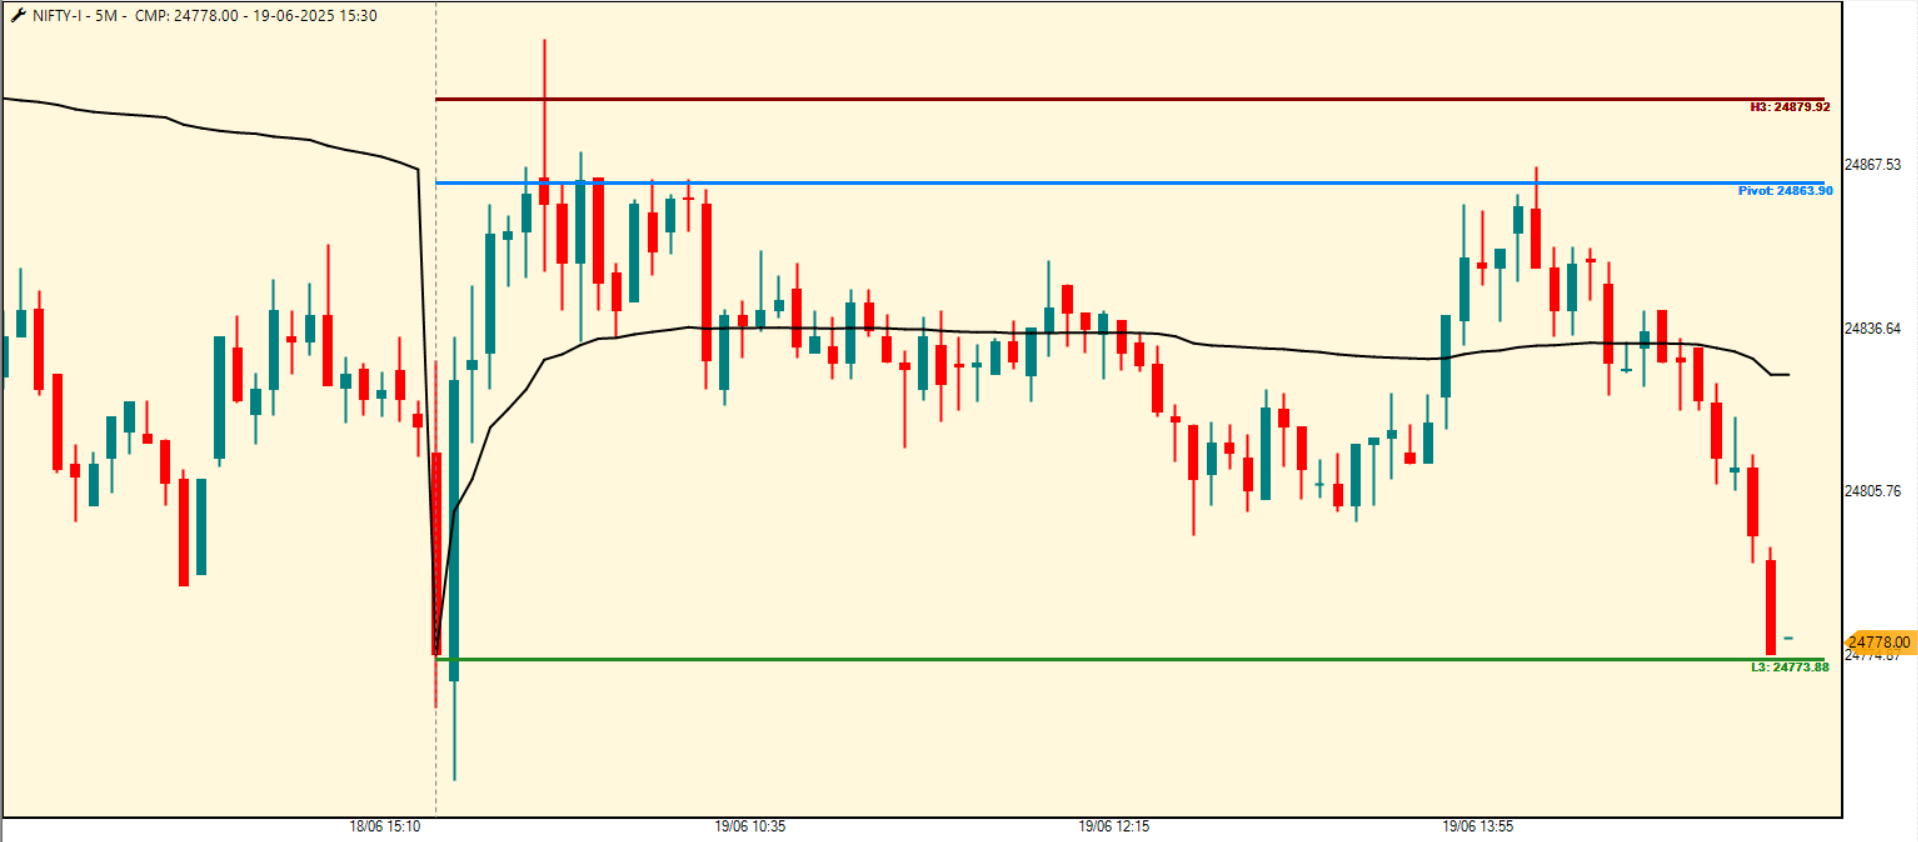
🧠 Point 1: Camarilla Reaction & VWAP Slope – A Theta-Controlled Expiry
Opening Scene:NIFTY Futures opened exactly at Camarilla L3
Gave a quick and clean bounce up to H3
After that, price roamed around VWAP for most of the session
VWAP slope stayed flat → confirmed no trend strength
️ Expiry Day Context:Opened near 24,800, making it a central pivot for expiry control
→ So, today’s key straddle zones were:24,800 (spot zone) – control center
24,600 (–200 zone) – downside testbed
25,000 (+200 zone) – upside expiry trap
“VWAP flat. Camarilla bounce done early. Market got handed to option writers. My job now: read premiums, not price.”
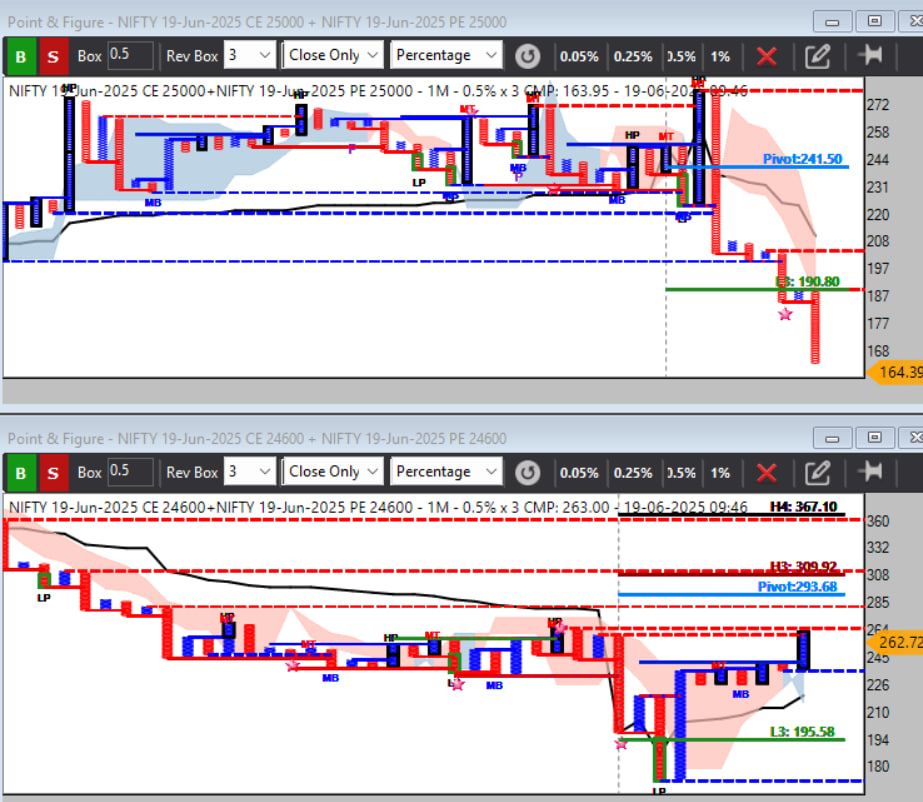
Point 2: Premium Divergence Gave Early Clue – Short straddle Setup with Precision
“Price bounced, but premium behavior told a different story. I don't trade price noise — I trade premium truth.”1. What Did the Premium Divergence Reveal?
🧭 During the early bounce from L3 to H3:24,600 Straddle (after an initial drop) started rising again
→ Quiet signal: someone betting on failure of this bounce25,000 Straddle , after brief spike, drifted lower
→ Optimism faded fast despite index holding above VWAP These opposite reactions in premium = perfect divergence signal
→ Writers quietly positioned for reversal2. Where Was the Trade?
Around the +200 zone (25,000):Premium behavior hinted at trapped longs
I entered a quick short setup around the premium zone of ₹200
Targeted a drop to ₹155 with a tight ₹25 stop-loss
Trade Logic:Straddle premium setup = clean bias
Price pattern failed to carry momentum
VWAP remained flat = no push power from bulls
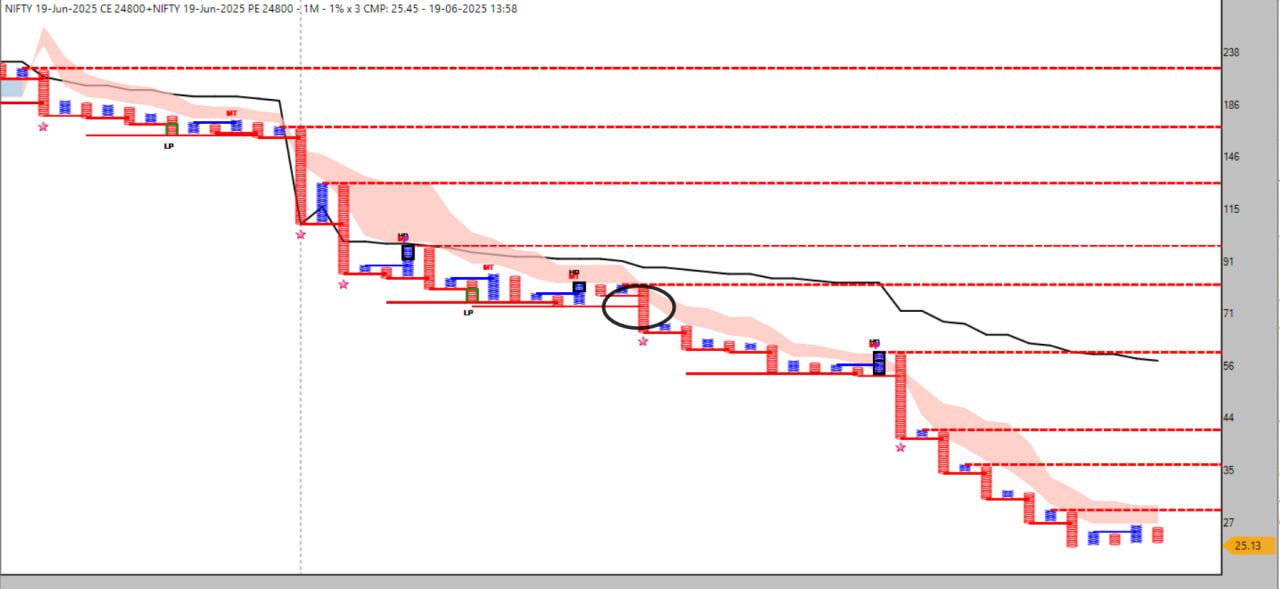
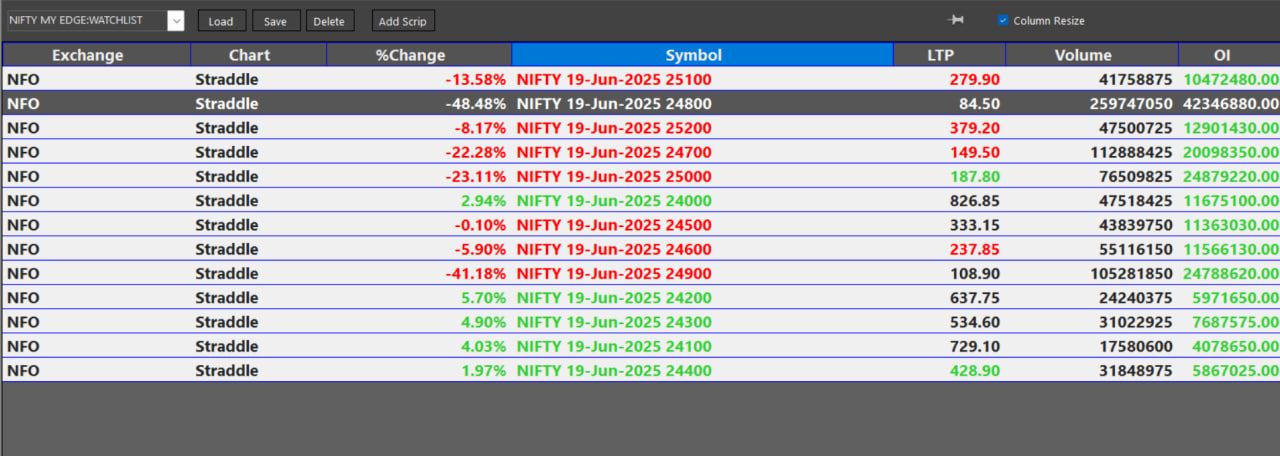 Point 3: One Hour Later – OI Structure Aligned with Straddle Premium Breakdown
“Expiry is a game of patience. Sometimes the market says nothing in the first hour — but if you listen closely, the OI and premium say everything.” 1 Hour Post-Open – Patience Paid Off
 After the initial bounce and VWAP drift:
I shifted focus to 24,800 Straddle – the highest OI zone of the day
Market structure remained inside H3–VWAP range
VWAP slope = flat, confirming non-trending, premium-control setup
What I watched:Price roaming = no breakout attempt
Premium of 24,800 Straddle started breaking down with structure
→ Triggered a clean entry at 72 & exit at 26 Note:
Note:
 All charts and premium snapshots were posted live on Telegram during market hours.
 -
Abstract
VWAP, or Volume Weighted Average Price, is not just a line — it's the heartbeat of intraday price discovery. It blends price and volume into one dynamic point of reference. From institutions gauging fair value to intraday traders assessing trend strength, VWAP serves as a core instrument. But beyond its apparent simplicity lies deeper power: its slope, variants, and strategic behavior.1. What is VWAP?
VWAP = (Cumulative Price × Volume) / (Cumulative Volume)It represents the average price a stock or index has traded at throughout the day, weighted by volume. It resets at the start of each trading day.
2. Why VWAP Matters
Institutions use it to benchmark trade execution quality.Retail traders use it as dynamic support/resistance.
Algorithmic strategies use it to minimize slippage.
Price relative to VWAP defines institutional control:
• If price stays above VWAP – it signals bullish dominance.
• If price stays below VWAP – it shows bearish pressure.
• If price hugs VWAP – it implies indecision or range-bound behavior.3. Types of VWAP
Here are different variations of VWAP and where they're used:Standard VWAP: Resets daily. Best for intraday traders and execution-based analysis.
Anchored VWAP: Starts from a specific event (gap, earnings, breakout). Ideal for event-driven trading.
Session VWAP: Calculated per session like morning/afternoon. Helpful in session-specific strategies.
Rolling VWAP (n-period): Similar to a moving average using volume. Used in algorithmic strategies.
Weekly/Monthly VWAP: Helps swing or positional traders gauge higher timeframe fair value.
4. The Hidden Power of VWAP: The Slope
The slope of VWAP isn't just a direction — it reflects the strength and conviction of price movement relative to volume.Classification of VWAP Slopes:
Flat Slope: Indicates a balanced tug-of-war between buyers and sellers. Typically signals a range-bound market.
Gentle Upward Slope: Shows controlled accumulation. Bias is slowly bullish.
Steep Upward Slope: Represents aggressive buying backed by volume. Indicates strong bullish momentum.
Gentle Downward Slope: Suggests mild distribution. Bias is slowly bearish.
Steep Downward Slope: Shows strong selling, often with panic or urgency. A good sign of strong bearish momentum.
Changing Slope (Curl Up/Down): A curling slope signals transition zones — often setting up for reversal or breakout/fakeout.
"Price position tells a story, but VWAP slope tells the mood."
5. VWAP Zones and Reactions
Some of the best intraday setups come from understanding how price behaves around VWAP:First Touch of VWAP: Often acts as an inflection zone — price either bounces or rejects.
VWAP + Bollinger Band Interaction: Helps spot squeeze and volume breakouts.
VWAP Retest Setup: Price breaks away, returns to VWAP, and then resumes original direction — powerful in trending days.
VWAP with EMA: Overlaying a slow EMA over VWAP helps identify extended moves and avoid traps.
6. VWAP in Different Market Phases
Here’s how VWAP behaves across various types of trading days:Trending Day: VWAP builds a strong slope, and price doesn’t return once it moves away. Perfect for trend-following.
Range-Bound Day: VWAP stays flat while price oscillates above and below. Mean-reversion trades work well.
Breakout Day: VWAP initially flat, then breaks sharply with volume. Ideal for breakout traders.
False Breakout Day: Price pierces VWAP but lacks conviction and slope. Perfect for trap and fade setups.
7. Ethics of VWAP Trading
“Respect VWAP not as a signal, but as a voice of the collective market trade.”Don’t trade blindly on VWAP crosses — context is everything.
Always observe slope and volume before making a decision.
Treat VWAP as a guide to institutional intent, not a shortcut to price prediction.
8. VWAP: System or Support?
VWAP can be used two ways in your strategy:As a System Anchor: For example, trade only in the direction of VWAP slope.
As a Supporting Filter: Use it to confirm bias after analyzing other tools.
Recommended VWAP Combinations:
VWAP + Camarilla or Pivot Points for direction zones.
VWAP + Volume Profile for confluence on historical value.
VWAP + Renko or Point & Figure charts to eliminate noise.
Conclusion
VWAP is more than a line — it's the psychological fair value that the market silently acknowledges. But its slope is what reveals strength, intent, and energy of the move.Whether you anchor VWAP to an event or track its real-time curvature, your edge increases when you listen to both where price is and how price behaves around VWAP.
Disclaimer
This article is for educational purposes only and does not constitute financial advice. Always perform your own due diligence. Trading and investing involve financial risk. -
 Introduction: The Battle Between Two Stop-Losses
In trading, there are two kinds of stop-losses often discussed:Chart SL — a level defined by market structure, price pattern, technical logic.
Mind SL — a point where a trader decides to stop due to internal discomfort, emotional imbalance, or personal reaction.
While many traders today speak about honoring their emotions, stepping out when their “mind is not right,” or taking mental stops — I believe this approach carries deep flaws.
Because in my view:
The market doesn't care about your emotions. It only responds to structure.
And structure is what the Chart SL respects.
That’s why, for me — Chart SL is sacred. Chart SL — The Only Objective Truth in TradingA Chart SL is drawn from the market’s own data.
It is based on:Break of a pattern
Invalidated support/resistance
Change in momentum
Technical failure of an idea
It’s visible, testable, repeatable.
There’s no personal bias here.
There’s no yesterday’s regret or tomorrow’s fear.
It’s a logical boundary — one that any trader, anywhere in the world, can recognize.When a Chart SL is hit, I don't feel pain. I feel clarity.
Because the setup said: “I’m done.”
And I respect that.
No emotion. No negotiation. Just execution.🧠 Mind SL — A Risky and Subjective Variable
The concept of “Mind SL” sounds noble — “respect your state of mind,” “walk away when not centered.”
But here’s the problem:The mind is never neutral in a trade. It’s reactive. It’s noisy. It remembers past losses. It anticipates imaginary pain.
So if I use Mind SL, I’m no longer listening to the chart.
I’m listening to fear.
To hesitation.
To that little voice that wants safety more than discipline.And if I exit based on that —
I have no proof that my setup failed.
All I’ve done is broken the flow — not of the market, but of my own execution.In short:
Mind SL is a soft excuse, not a solid plan.
️ Why I Reject Emotion During a Trade
I do not reject emotion as a human being. I feel it. I accept it.
But during a trade, emotion is a liability.When the trade is on — I am not a person. I am a process.
The job is clear:Entry by setup
Exit by structure
SL by chart
No mid-trade second-guessing.
No “gut feeling.”
No “I’m not feeling okay today.”If I allow that, I fall into chaos.
And chaos never repeats profitably.🧘 Emotion Belongs Before and After — Not During
If I am not emotionally centered — I do that work before market opens.
If I take damage and need recovery — I process that after market closes.But during market hours, emotion has no authority over my actions.
Chart SL is my commander.
It decides the war.🧱 My Trading Wall: Logic First, Emotion After
Plan the trade before the bell Execute with robotic precision Follow Chart SL, no matter what Ignore the mind's panic or euphoria during the trade Review the mental side only after the outcome is completeThis is my code.
Not because I’m emotionless — but because I’m disciplined. Final Words: Why Chart SL is My Only Exit Gate
Chart SL is not just a level.
It’s my promise to the market — and to myself.A promise that says:
“I will not betray logic. I will not exit in fear. I will not exit in hope.
I will exit only when the setup tells me to.”Because that’s how I build consistency.
That’s how I protect my system.
That’s how I rebuild trust in myself — not by honoring feelings, but by honoring structure.🧱 The Classification of Chart-Based Stop Loss (Chart SL)
— Based on Structure, Intention, and Setup Logic I. Structural SL (The Setup Integrity Stop)
Definition:
Placed at the level where the core technical structure breaks or invalidates.Used in:
Breakouts, pullbacks, ranges, price action entries.Examples:
Below swing low for long, above swing high for short.
Outside the channel in a trendline setup.
Invalid candle pattern zone (e.g., outside bullish engulfing zone).
Purpose:
To protect the logic of the setup. If structure breaks — trade is no longer valid.🧠 Ethical View: This is the purest form of Chart SL. You exit because your idea is wrong, not because you're afraid.
II. Volatility SL (ATR/Range-Based Stop)
Definition:
Placed at a distance based on average price movement or volatility measures.Used in:
Trend following, intraday trades, swing setups on volatile stocks.Examples:
1.5x ATR from entry.
NIFTY 15-point Renko brick reversal.
Point & Figure box reversal + filter.
Purpose:
To allow room for natural market noise without invalidating the trade.🧠 Ethical View: It respects the character of the market, not your emotional comfort zone.
III. Technical Level SL (Indicator or Tool-Based)
Definition:
Placed around predefined levels from indicators or tools.Used in:
VWAP rejections, MA pullbacks, Camarilla pivots, Fibonacci setups, etc.Examples:
Below VWAP in trend trades.
Past the 20 EMA or 200 EMA in swing setups.
Below S3 or above R3 in Camarilla trading.
Purpose:
To use dynamic tools that reflect real-time market balance.🧠 Ethical View: Honors indicator logic, not your bias.
IV. Time-Based SL (Exit if structure doesn’t play out in expected time)
Definition:
Exit not by price — but if expected move doesn’t occur within time limit.Used in:
Intraday breakout trades, option buying strategies, high theta trades.Examples:
"If no momentum within 15 minutes of breakout, exit."
"If IV crushes in first 30 mins, close option buy trade."
Purpose:
Avoid decay, stagnation, or time-based failure.🧠 Ethical View: Time is capital. If the setup doesn’t deliver urgency, the edge is gone.
V. Premium-Based SL (Options Only)
Definition:
SL is placed based on premium behavior, not underlying spot.Used in:
Straddles, strangles, option buying/selling, Renko-based CE/PE ratio studies.Examples:
Premium of sold option rising 20% = exit.
CE/PE ratio reversal on Renko = close leg.
Option premium violating VWAP = stop.
Purpose:
Follow real demand/supply in the option — not just spot index.🧠 Ethical View: In options, premium is king. Structure in underlying is useless if premium behaves irrationally.
VI. Structural Volume/VWAP SL
Definition:
Exit when price closes against volume logic or breaks VWAP decisively.Used in:
Futures, intraday, Renko & P&F combo systems.Examples:
VWAP close against your direction.
Volume climax with reversal brick (Renko).
Price below VWAP on breakout failure.
Purpose:
Shows that institutional intent reversed.🧠 Ethical View: Exit not because price hit a number — but because the energy behind the move is gone.
🧘 Final Thought
A true Chart SL is not a price level.
It is a contract — between your setup and your self-respect.Exit, not to protect ego — but to preserve logic.
Exit, not to avoid loss — but to obey the truth.🧠 The Classification of Mind-Based Stop Loss (Mind SL)
— Understanding the Traps of Emotion-Based Exits I. Fear-Triggered SL
"I can’t take it anymore."Origin: Sudden anxiety, panic from fast PnL drop, or fear of bigger loss.
Symptoms:
Exiting early even though Chart SL is intact
Irrational urgency to “escape”
Frequent in options buying during theta burn or spike in IV
Ethical Danger:
This is the most dangerous SL — driven by the nervous system, not the system logic. It’s raw survival instinct, not reason.️ Discipline Move: Recognize panic. Don’t exit. Look at the chart. If structure is valid — hold. II. Regret-Driven SL
"I should’ve taken the earlier profit."Origin: Comparing current trade to a missed better exit or a past loss.
Symptoms:
Emotionally influenced by what “could have been”
Exits trade not due to chart logic, but due to mental replay
Ethical Danger:
Trading based on ghosts of the past. Not living in the now.️ Discipline Move: Bring awareness back to present. Ask: “Is the setup still valid now?” III. Hope-Crushed SL
"This was supposed to work… but I give up."Origin: High expectation not met, inner belief shaken.
Symptoms:
You believed in the setup too emotionally
One slow move against you — and the mind collapses
Feels like a betrayal by the market
Ethical Danger:
You exit not because the setup failed — but because you’re disappointed.️ Discipline Move: Detach identity from the setup. You are not your trade. IV. Fatigue-Induced SL
"I’m too tired to monitor this."Origin: Emotional, physical, or mental exhaustion.
Symptoms:
You skip the Chart SL
You click out just to avoid more thinking
Common after back-to-back trades or long sessions
Ethical Danger:
You’re making critical decisions in a low-energy state. Execution suffers silently.️ Discipline Move: If tired, don’t enter. But if entered — respect the chart, not your fatigue. V. Impulse-Based SL
"Something just felt wrong."Origin: Sudden intuitive discomfort — not rooted in logic.
Symptoms:
Quick exit without reviewing structure
Often confused with “gut feel”
Regret follows soon
Ethical Danger:
Impulse isn’t intuition. Most “gut” calls during open trades are actually disguised fears.️ Discipline Move: Write the discomfort down. Revisit after trade ends. If it was valid, systematize it. Else — discard it. VI. Shame/Memory SL
"Last time I stayed — I lost everything. Not again."Origin: Past trauma. Market PTSD. Mental scar from big losses.
Symptoms:
Mind flinches when market behaves like past danger zone
Exits trade early due to pattern recognition from past pain
Ethical Danger:
The past has hijacked the present. Chart hasn’t failed — but memory makes you feel it has.️ Discipline Move: Heal that scar outside market hours. Don’t let old wounds lead new trades.🧠
️ Final Reflection: Why I No Longer Obey Mind SL
Every Mind SL is an exit door created by feeling, not by fact.It’s like running out of a building because of a sound — without checking if there’s actually fire.
That’s why I now declare:
“Unless it’s structural, the exit is premature.”
The mind is allowed to feel.
But it is not allowed to lead.“Mind SL is not a stop-loss. It’s a stop-growth.”
Obey structure. Observe emotion. But never trade from it.
 Conclusion:
“In trading, you don’t just exit a position.
You exit either in truth — or in fear.”I choose to exit only in truth.
Because when I surrender to structure, I rise in self-respect.Let the market take me out — not my mind.
️ Disclaimer:
This article reflects my personal trading discipline and philosophical beliefs.
It is written purely for educational and reflective purposes, not as financial advice.
Readers must consult their own trading systems, risk profiles, and financial advisors before making market decisions. -
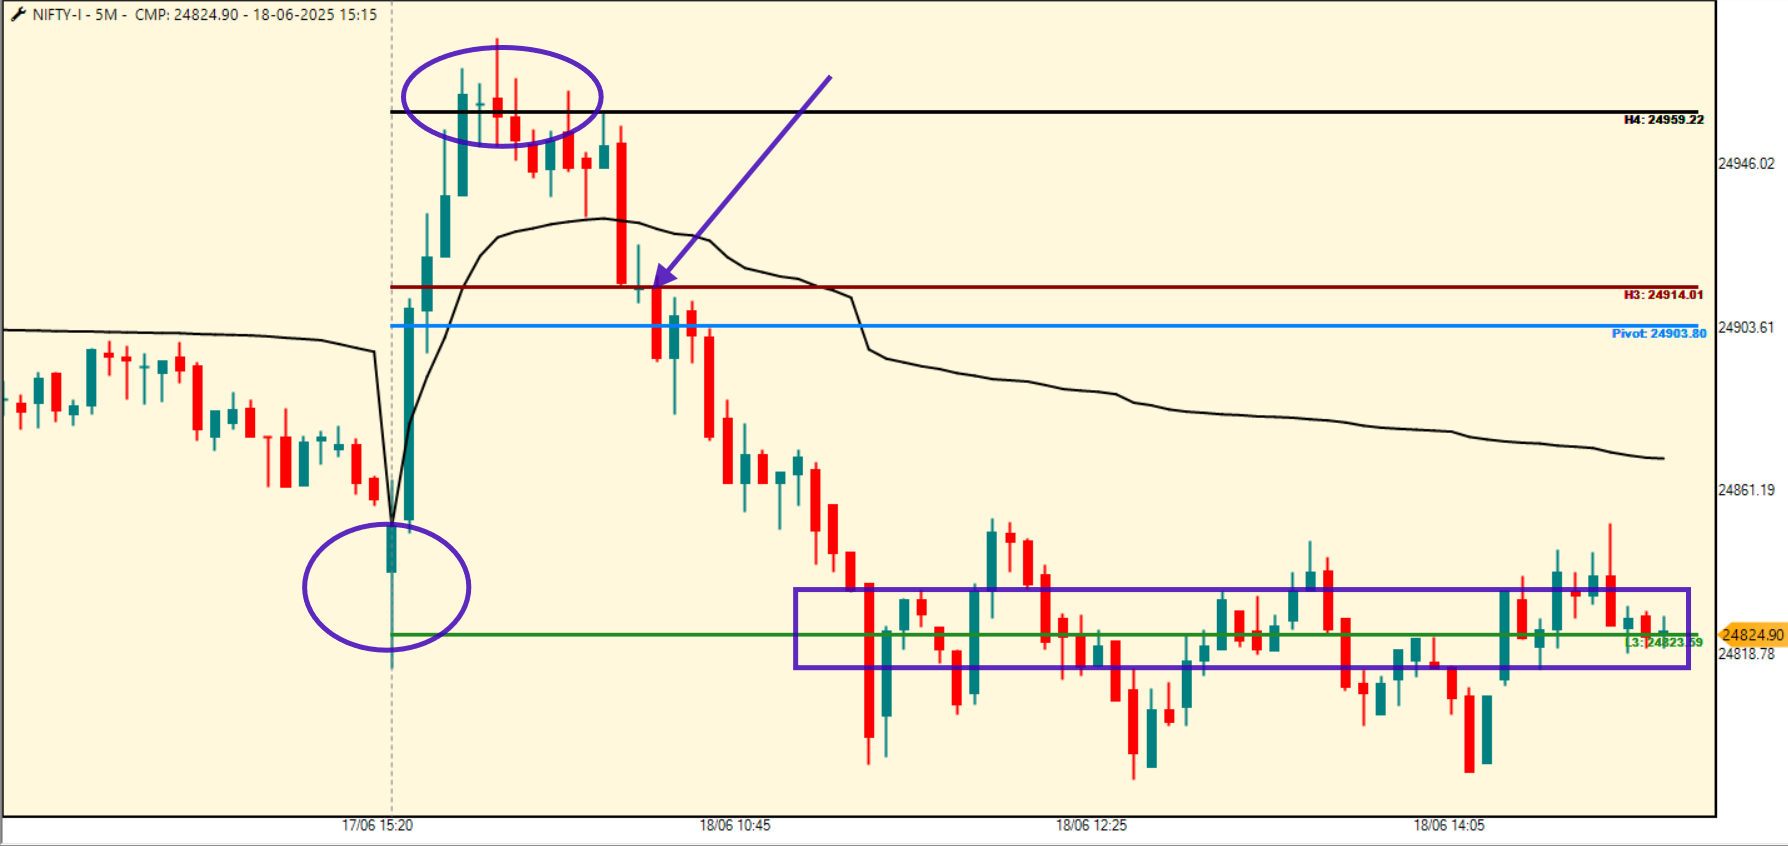
🧠 Point 1: NIFTY Open at L3 – The Camarilla Trap Decoded
NIFTY Futures opened exactly at Camarilla L3
Strong one-way bounce till H4
No follow-through above H4
Sharp drop below VWAP
Market hovered around L3 for rest of the day
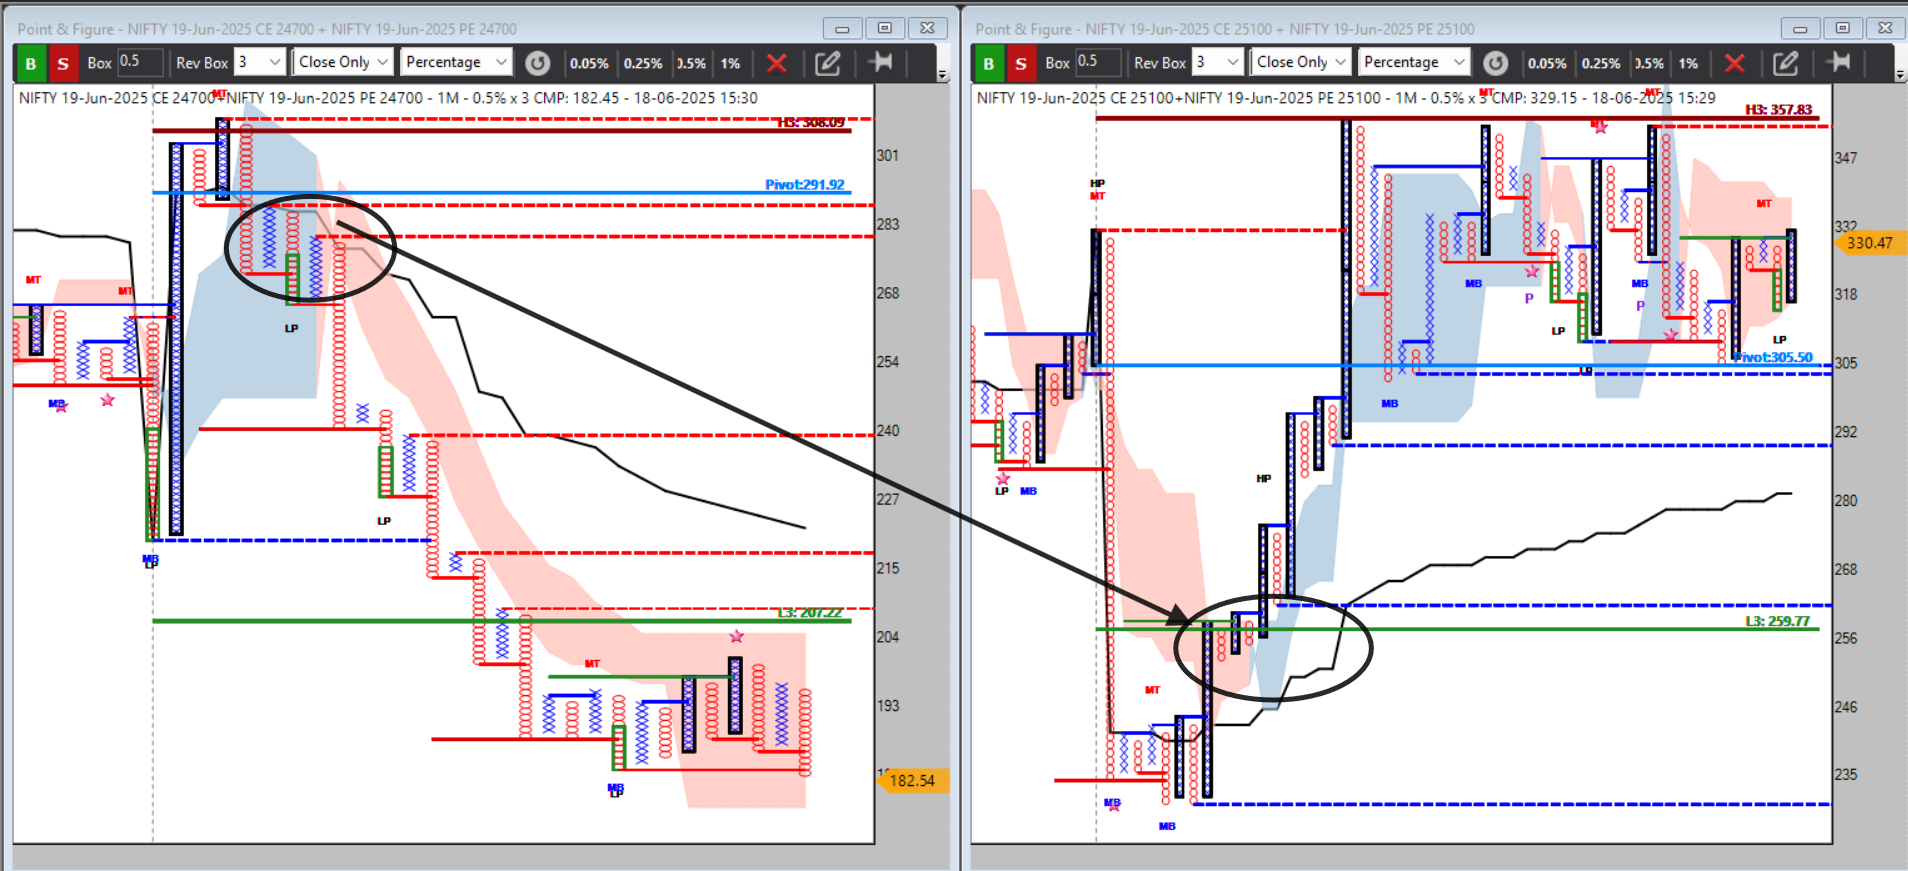 Straddle Grid – The Real Premium Story 24,700 Straddle – Morning Optimism, Then Crush
Premium spiked fast with price rise
After VWAP break and pattern failure → sharp crush began
→ Writers regained control – optimism punished 25,100 Straddle – Late Premium Spikeinitailly droped rapidly
Then Put leg inflated rapidly with pattern confirmation
→ Bearish direction confirmed via outer premium breakout Divergent Structure = Dual Trade Opportunity
Trade Option 1 Trade Option 2
Short 24,700 Straddle Buy 25,100 Put on breakout“When two outer straddles move against each other, one signals a lie, one signals truth. Structure gave both opportunity — trap fade and pattern breakout.”
Conclusion:
“The market was emotionless, but the straddles weren’t. I didn’t chase price—I read premium integrity. The 24700–25100 straddle divergence told the real story before the index revealed it.” -

“Behind the symmetry of a straddle lies the asymmetry of intent.”
In the world of options trading, few strategies carry the deceptive elegance of a straddle. Equal parts call and put, executed at the same strike and expiry, the straddle structure radiates apparent neutrality. To the casual observer or the uninitiated, it’s a bet on volatility—a way to stay agnostic to direction and profit from movement itself. Yet, this symmetry is a mirage. Underneath it lies a battlefield of asymmetric intentions, whispered not in candlestick formations, but in premium shifts, VWAP drifts, and the silent choreography of open interest". A Tribute to the Silent Masters
Before we journey deeper, we pause to bow in tribute to Abhijit Phatak Sir and Prashant Shah Sir—guardians of noiseless logic in Indian market analysis.Abhijit Phatak Sir, with his decades of precision in reading Renko, P&F, and volatility models, taught us how price speaks even when candles are absent.
Prashant Shah Sir, the master behind structured decoding of P&F and classical charting techniques, elevated technical analysis from noise to narrative.
Their work gave the Indian trading community the ears to hear the silent asymmetry.
Their legacy is not in loud predictions, but in the quiet discipline of reading market behavior without illusion.This article stands on the philosophical foundation they laid.
I. Structural Symmetry vs Strategic Intent
A straddle’s form is balanced.One call, one put.
Same strike, same expiry.
Equal distance from the market’s uncertainty.
But structure is not strategy.
What makes a straddle pulse with hidden direction is not its form—but the trader’s positioning logic. Why the Illusion of Neutrality Persists
This neutrality illusion stems from textbook definitions. In theory:Long straddle = volatility play.
Short straddle = range play.
But real market participants are rarely so pure in intent. Institutions hedge delta, speculate on gamma, manage theta decay, or use straddles as dynamic adjustment tools. Retail traders mimic the structure, unaware of the strategic subtext. Thus, ethically, it becomes necessary to distinguish tool from tactic.
Neutrality in structure does not imply neutrality in intent.
II. The Ethical Lens: Why Understanding Intent Matters
Markets are moral in one way—they punish ignorance and reward preparation. Misreading a straddle as “non-directional” is not just a technical error; it's an ethical lapse in due diligence.Trading is a game of informed conflict. And when conflict hides behind symmetry, only those who listen to the imbalance gain the edge.
An ethical trader seeks to understand—not just the setup, but the psychology behind it.
This includes:
Premium shift: Are calls rising faster than puts? Why?
VWAP drift: Is the midpoint leaning toward demand or supply zones?
Open interest dance: Is one leg being built while the other unwinds?
These are not just technical footprints. They are intent leaks.
III. Logical Breakdown: Where Asymmetry Creeps In
Let’s examine how straddles betray their supposed neutrality:-
Premium Disparity
Though the strike is same, implied volatility skews, demand-supply dynamics, or delta adjustments can inflate one leg disproportionately. This reveals sentiment imbalance. -
VWAP Drift
The Volume-Weighted Average Price of the combined legs (or even the individual leg) often drifts—toward the expected pressure zone. A rising call VWAP versus a stagnant put tells us the bias isn’t so neutral after all. -
OI Behavior
Open interest buildup on one leg versus unwinding on the other can hint at directional positioning masked as neutrality.
Logical conclusion: While the straddle allows for neutrality, its execution reflects bias. And that bias, once detected, becomes tradeable edge.
IV. The Asymmetry of Intent Is the Real Edge
Here lies the philosophical core of the quote.The market is a mirror. It reflects what people want to hide.
Most traders search for patterns. Fewer search for conflict. But it is conflict—not clarity—that drives price.
Straddles, when studied properly, are not directionless tools. They are conflict containers—compressing uncertainty, expectation, protection, and speculation into a tight band. When pressure builds, asymmetry reveals itself in subtle movements of premium, behavior of the writers, and actions of liquidity providers.
To interpret that is not merely a technical skill—it’s market literacy.
V. The Moral Responsibility of the Trader
In this understanding lies a deeper ethical mandate:Do not oversimplify complex instruments.
Do not mimic institutional strategies without grasping their design.
Do not mislead others by repeating “straddle is neutral” without context.
Instead:
Educate. Decode. Observe the conflict—not the chart—but the mind behind the chart. Conclusion: Trading the Conflict, Not the Chart
“To read the silent language of this asymmetry — not the chart… but the conflict behind it.”This closing thought is more than poetic. It is principled advice. Straddles are tools. The real game is understanding how they’re used, why they’re placed, and what they conceal. If we can learn to trade the conflict behind the setup, not just the visual symmetry of the setup itself, we elevate from reactive trader to strategic observer.
 Final Note:
We owe this lens—this way of seeing through structure into sentiment—to the quiet revolution led by Abhijit Phatak Sir and Prashant Shah Sir. Their relentless pursuit of noiseless understanding has reshaped how Indian traders decode intent, volatility, and structure.May their legacy continue to inspire disciplined, ethical, and intellectually sound trading generations.
️ Disclaimer:
This article is for educational and research purposes only. The insights shared are based on structural, psychological, and technical interpretation of option strategies. Always do your due diligence before deploying real capital. Past patterns do not guarantee future outcomes. Trade responsibly. -
-
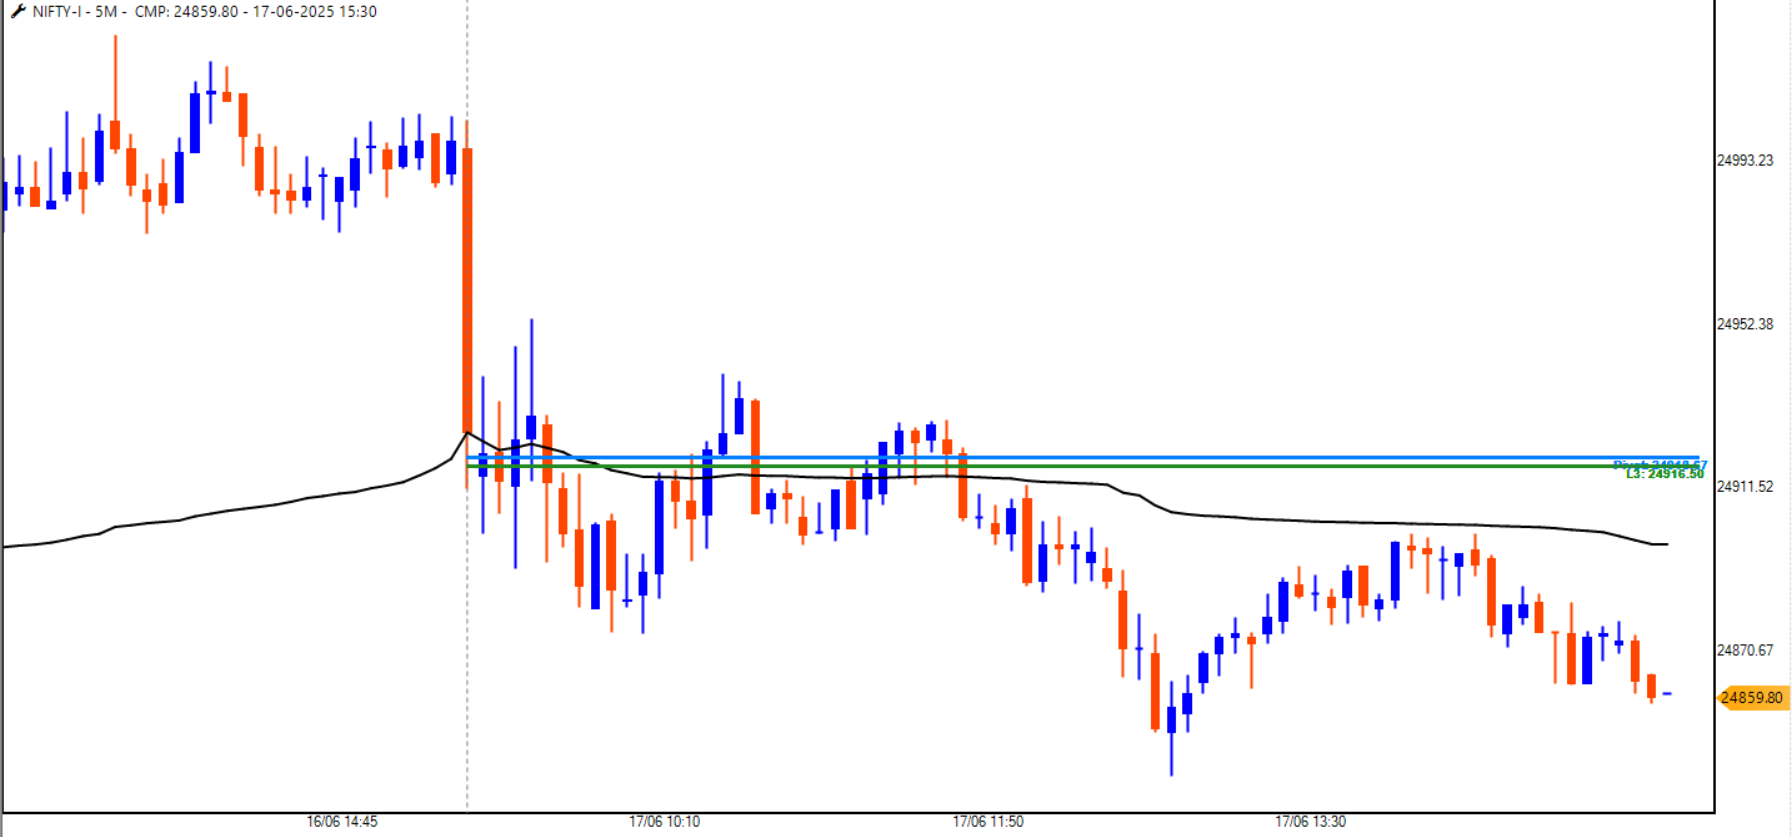
Nifty opening with selling pressure candle , first 15-30 min roaming around (Pivot + L3) level with flat vwap .
now what should be trading bias , trade type etc from following point
-
vwap slope in nifty future
-
200-+ straddle price behaviour with patterns , vwap
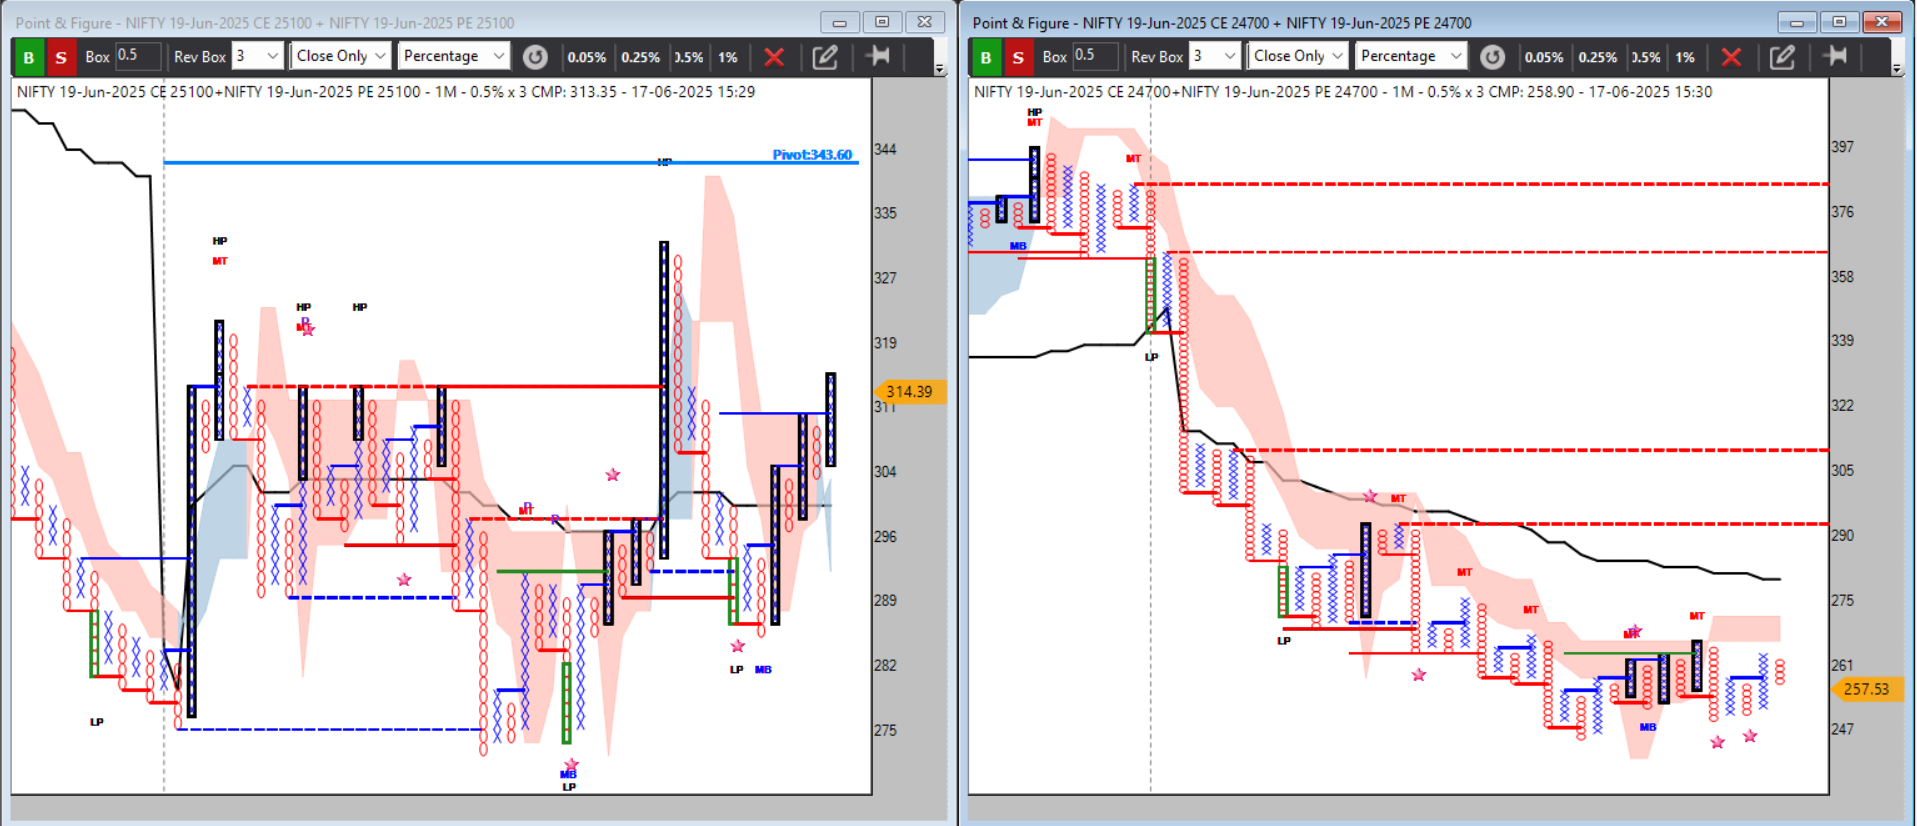
from above picture od 200-+ straddle ( 24.7k & 25.1k) , clearly from opeing seen lower straddle more weak & upper straddle not strong not compartively weak
so , bearsih sideways bias with option iv PREIUM CRUSH mood active . sell 24.7k around 280 with vwap above close as stop-loss ; eventutally got target of 33 points & today no mometum option buying scanrio was not seen
-
-
 Tribute & Inspiration
This logic stream draws deep inspiration from Abhijit Phatak Sir, a pioneer in applying noise-less charting of straddle (P&F/Renko) for Indian options. His teachings made us look beyond candles — into the soul of the market, where premium tells the truth.
1. DIRECTION — Decoding Intent through Premium Separation Verified Logic:
When price moves in one clear direction, only one leg of the straddle gains premium or holds steady.The opposite leg decays steadily due to distance from spot + theta.
Directional bias is more reliable when:
Premium divergence increases
One leg inflates despite being OTM
Volume/VWAP shifts support the same direction
Practical Clue (on P&F/1-min Renko):
Lower straddle PE inflating → market may fallUpper straddle CE inflating → market may rise
Direction reveals itself in imbalance — not just price, but premium behavior.
2. PAIN — Identifying Trap Zones via Anomalous Premium Behavior Verified Logic:
Pain = Conflict in premium + price behaviore.g., Price falling but CE holding or inflating → Call writers trapped
Price consolidating, but both legs still expensive → Volatility trap or news risk
Use VWAP on straddle legs or underlying chart:
Premium above VWAP = writers in pain
Premium flat but price expanding = volatility underpriced
️ Practical Clues:
Both CE & PE not decaying even with time → uncertainty, trap zoneOne leg holds unusually while price shifts away → trapped writer
Pain zones are where time-value misaligns with movement.
3. GAIN — Clean Decay with Confirmed Trend = Alpha Zone Verified Logic:
When one leg bleeds fast, the other holds steady or gains, and price supports this behavior → you're in a premium harvest zoneAlign with P&F double-top/double-bottom pattern + VWAP = confident entry
Time-decay (theta) becomes your ally only in this clarity phase
Your Ideal 200± Setup:
Price + P&F signal alignsPremium behavior follows theory (one leg bleeds cleanly)
VWAP confirms pattern
30-point decay achieved with low noise and no reversal
Gain comes from clarity, not just entry. It is the reward for synchronized behavior across price, premium & time.
️ Disclaimer:
This content is shared solely for educational and observational purposes. It reflects personal interpretations of market behavior through straddle premium dynamics and does not constitute financial advice. Trading in derivatives involves substantial risk. Always do your own research or consult a registered financial advisor before making trading decisions. -
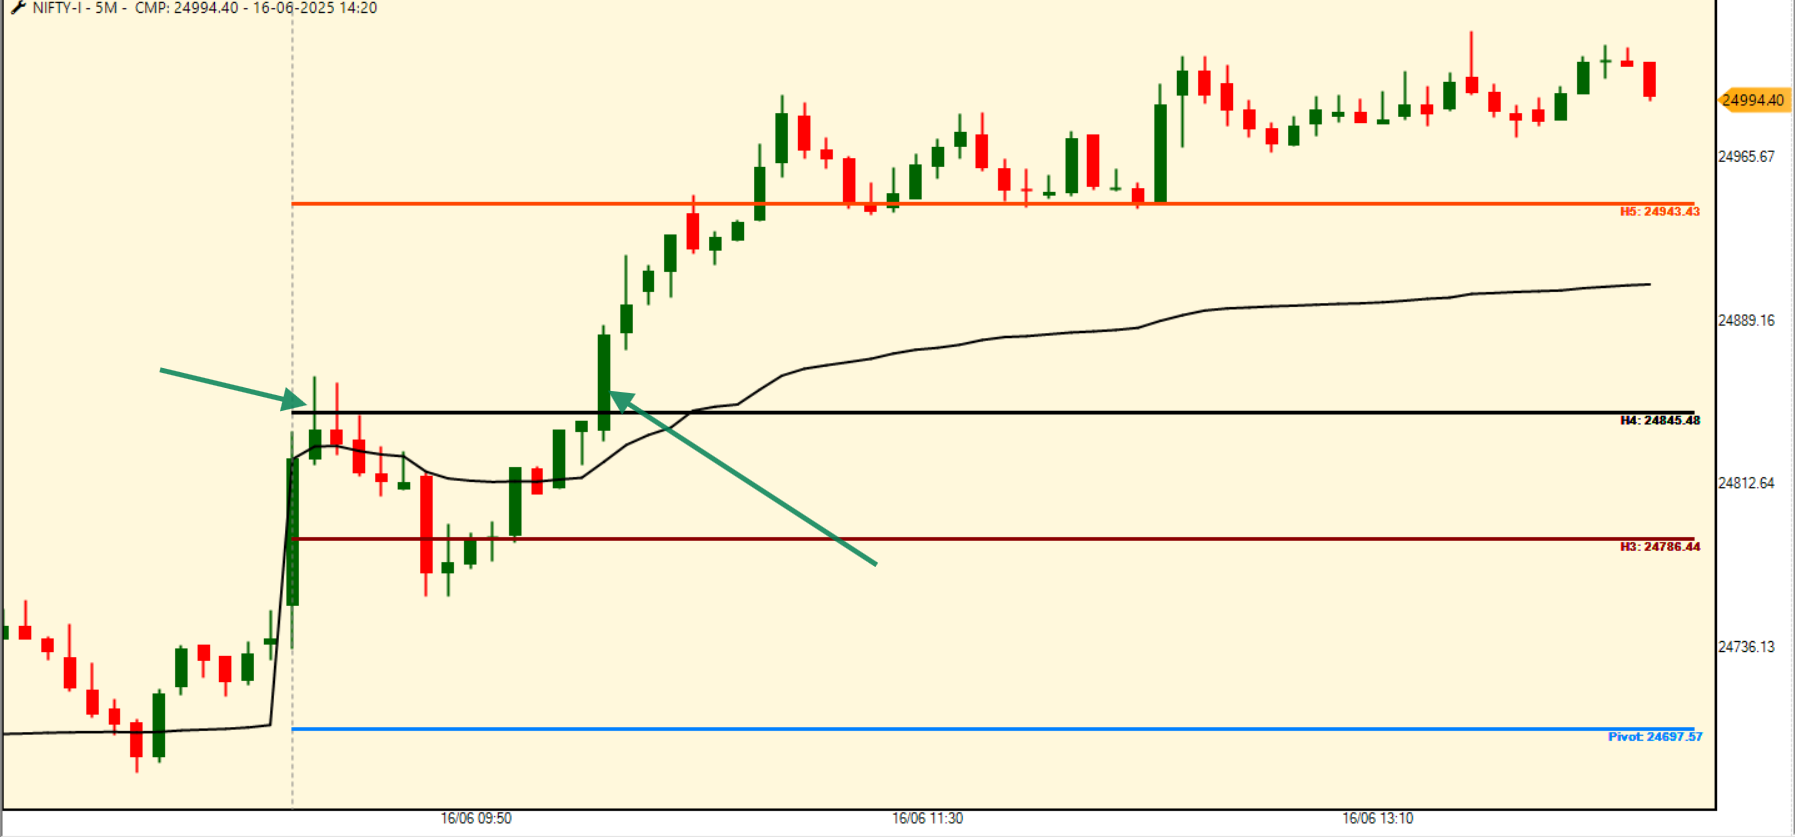
-
Nifty opening face resistance near H4 level & little bit drift towards H3 level .
-
Then it break H4 level with vwap slope good upwards and sustain bullish move .
-
now how i can get trade bias , type of trade etc by camarilla level & 200-+ straddle study ??
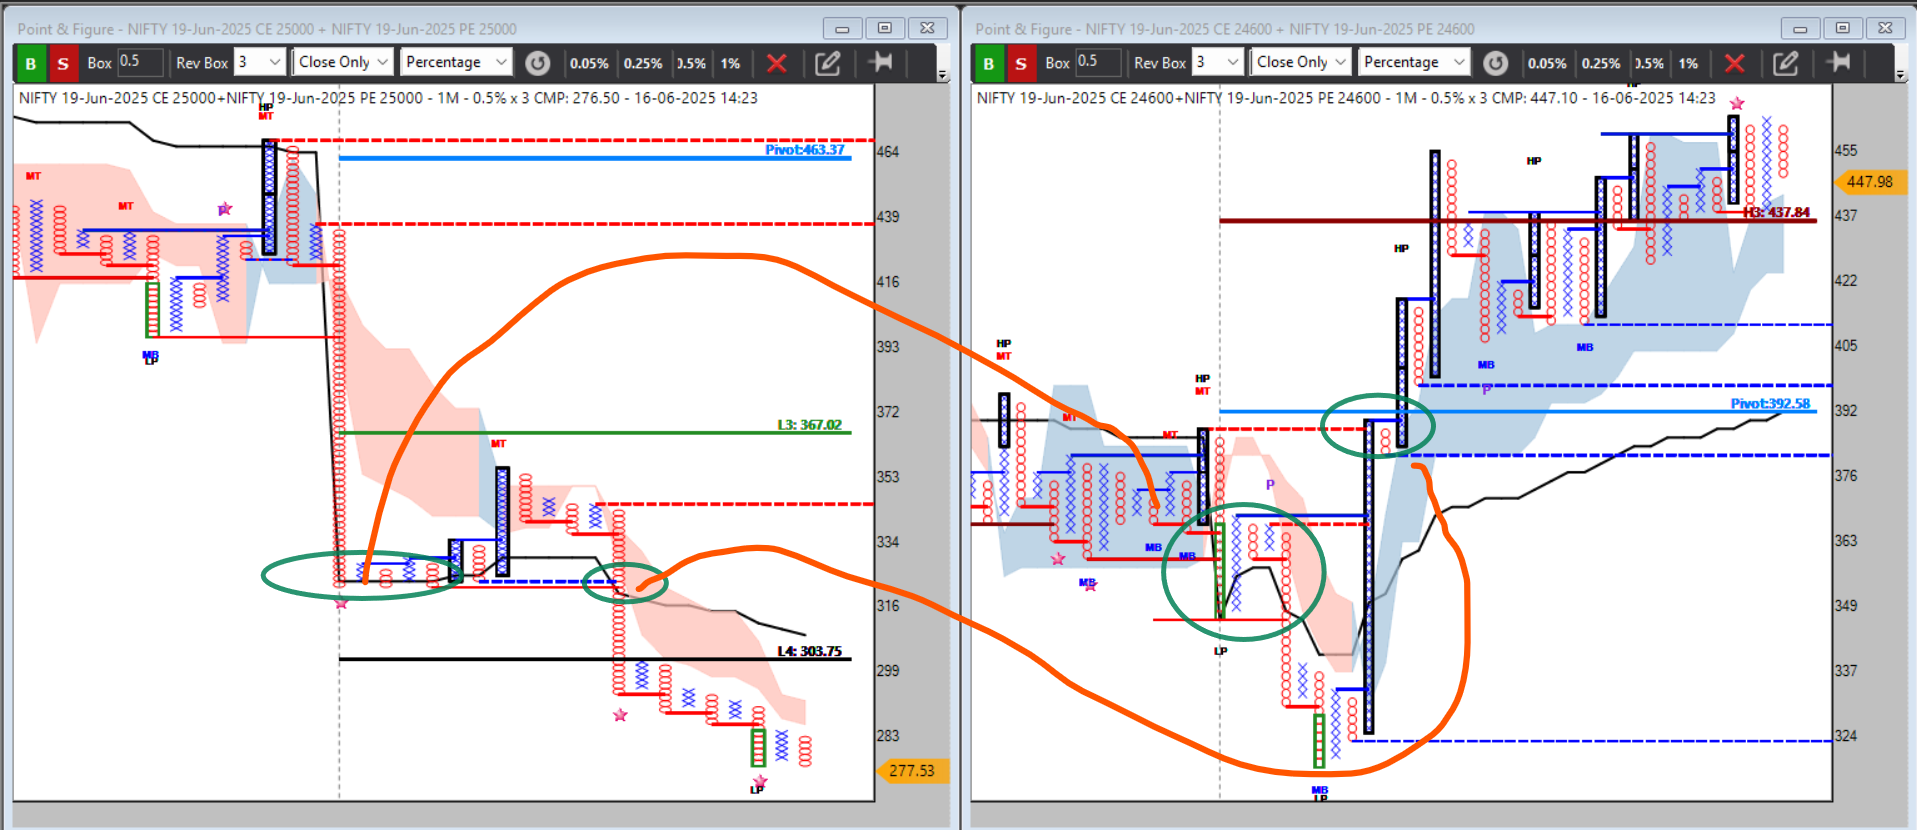
-
first opening upper straddle was holding premium & lower straddle is weakening , so bearish bias emerged , let's in chart of 24600 straddle
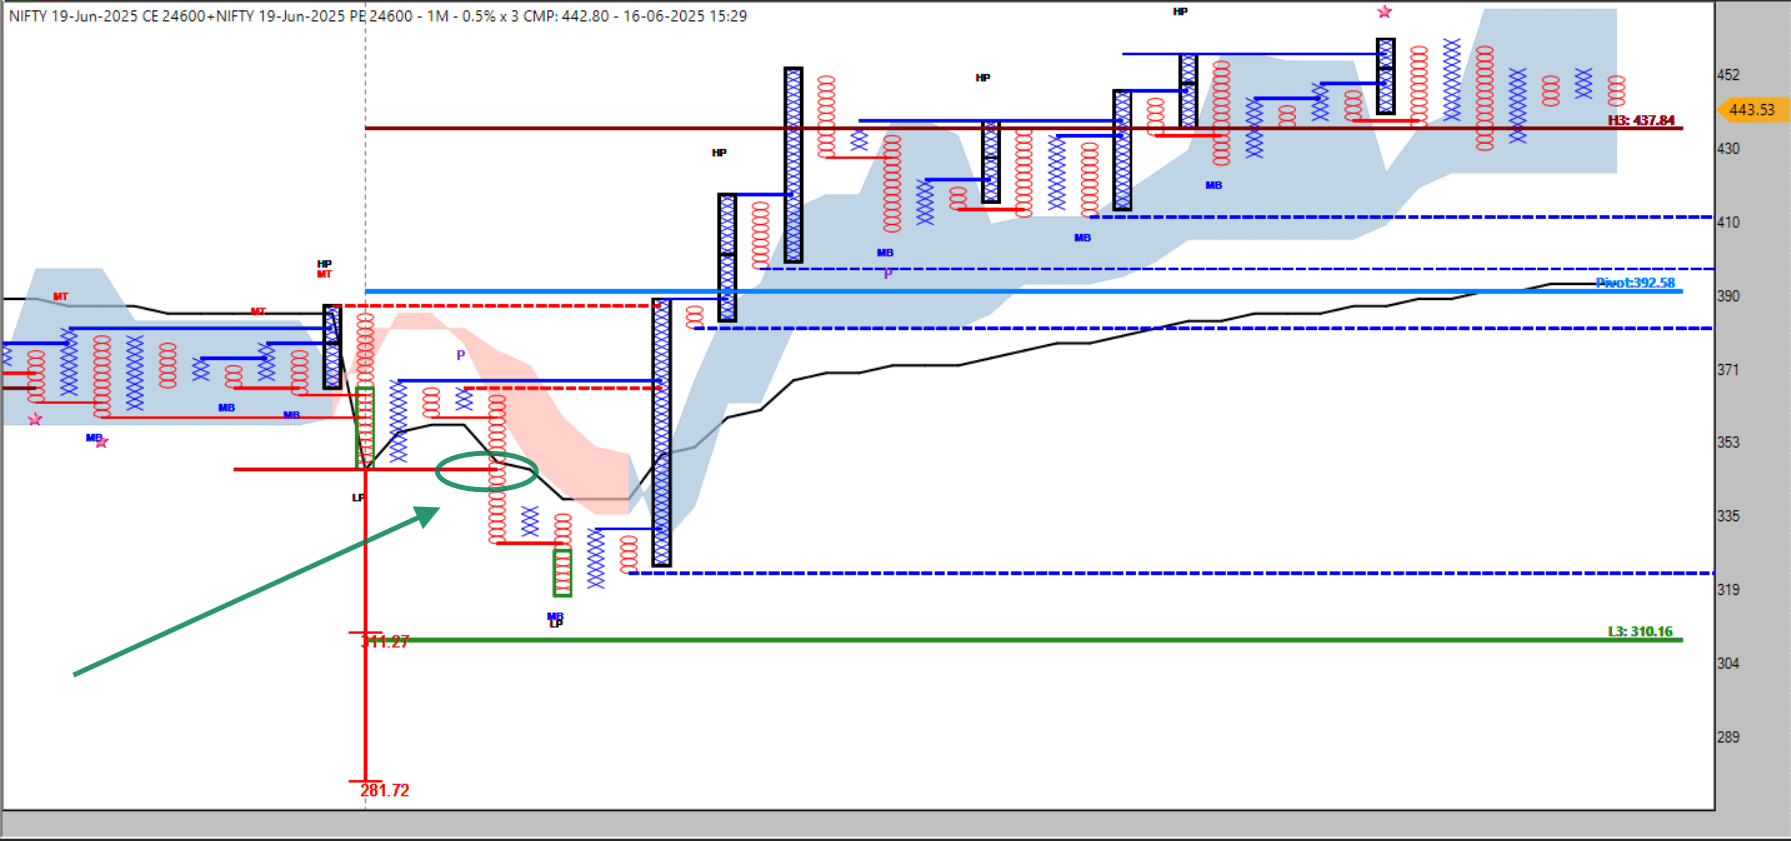
-
on DBS , it's active near 340-345 price with sl 360 as pattern invalidation level ...price went down to 320 but not target & it's SL near 360 ...so stop-loss hit .
now after sl hit in 24600 straddle , we have to look what both straddle doing like any expansion in structure , any camarila level break or etc , so we have to see 25k straddle what is doing
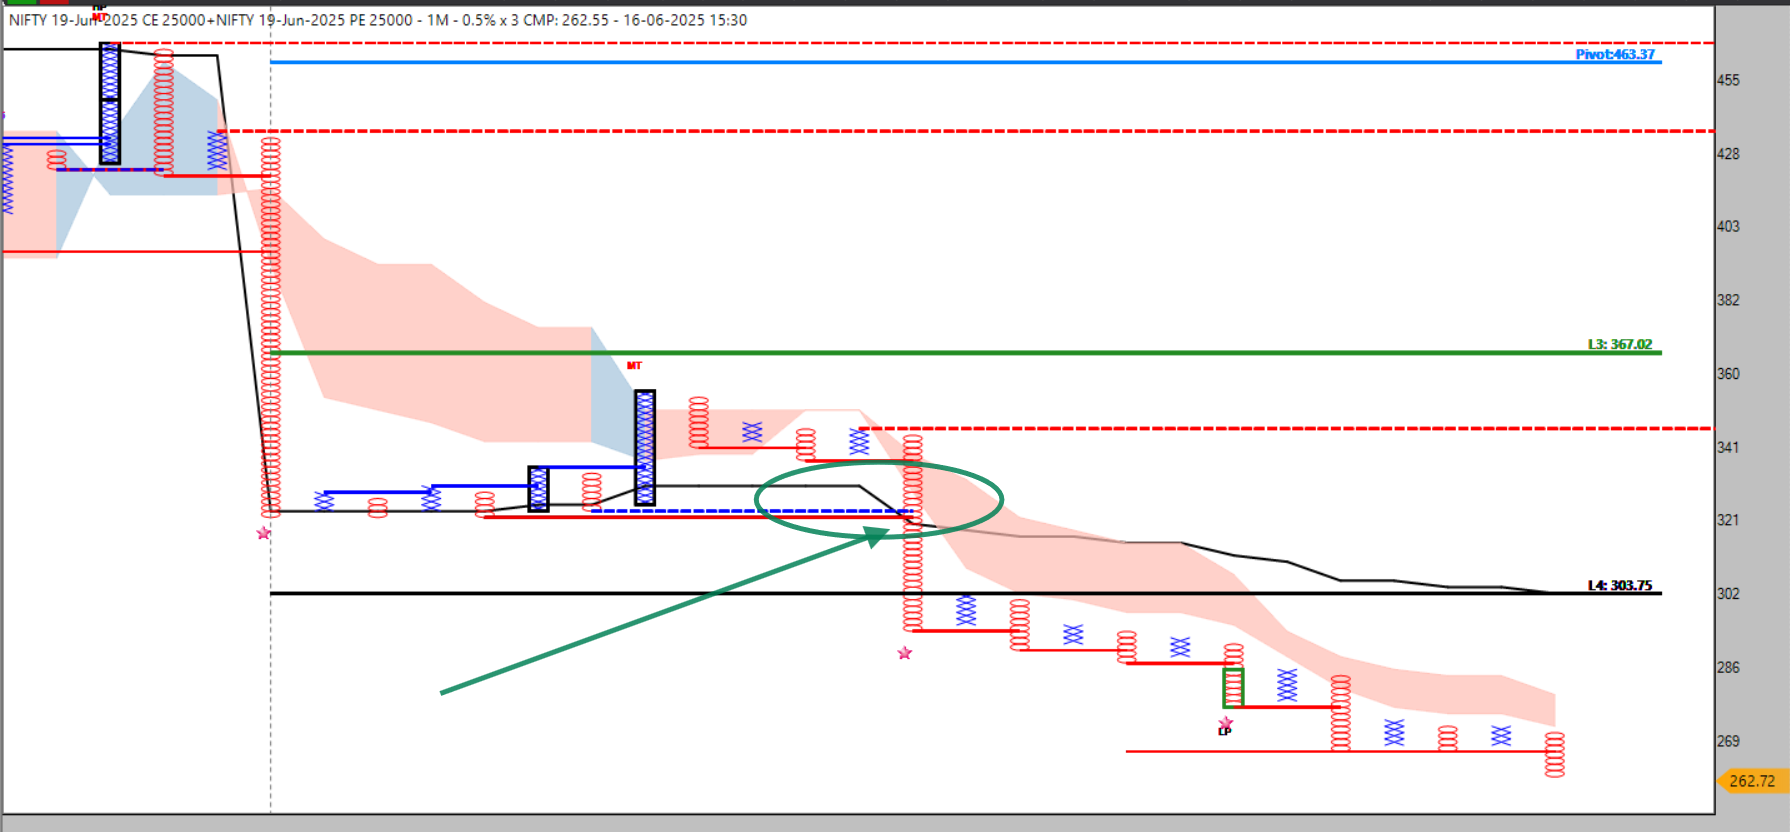
now dbs on 25k & dtb on 24.6 k will confirm bullish strong bias if comes , & it happens today ....so we get opportunity to short 25k straddle near 295-300 & droped almost 30 points from here & CE buying also possible as both 200-+ straddle in opposite structure with full directional conviction -
-
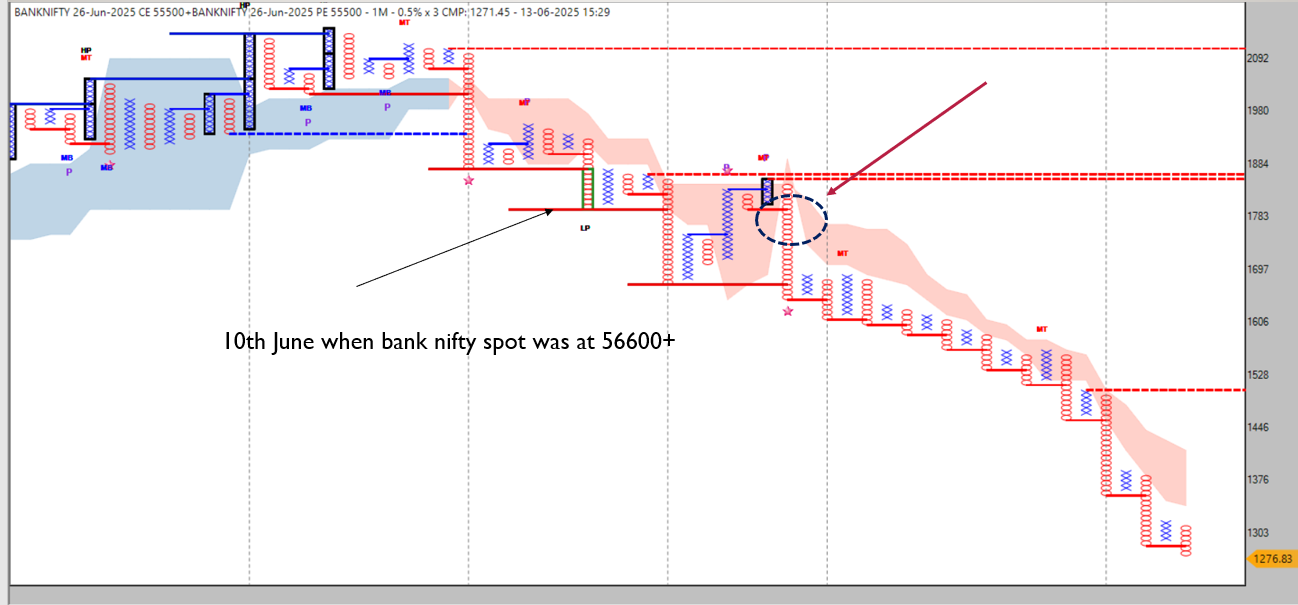
on 10 th june 1000 points lower stradle gives us some hints , then it gives on DBS 500+ point gain
-
@Ajay Chaudhary will try to post market posting
-
✦ Introduction
In the vast universe of derivatives, straddle is a silent warrior — neither biased to bullish nor bearish, but always watching volatility, time decay, and direction with surgical precision. For NIFTY traders, both intraday and swing, the straddle is more than a strategy — it's a market thermometer, a premium absorber, and a sentiment decoder.✦ What is a Straddle?
A straddle involves buying or selling both Call (CE) and Put (PE) options of the same strike and expiry. The most common is the At-The-Money (ATM) straddle.Long Straddle = Buy ATM CE + Buy ATM PE → Profits from big moves either side.
Short Straddle = Sell ATM CE + Sell ATM PE → Profits from time decay & price staying near strike.
✦ Why It’s Crucial for NIFTY Traders
NIFTY is a highly oscillating index, known for fakeouts, sharp rejections, and strong intraday reversals. In such a landscape, studying the straddle isn't just about finding a trade — it's about understanding where the market is nervous or confident, and when it's ready to explode in a direction.The straddle acts as a:
Compass for directional bias
Scanner of volatility traps
Live barometer for institutional behavior
Reason Intraday or Swing Benefit
Market Sentiment Decoder Rapid premium rise = expected breakout High IV = major trend ahead🧭 Directionless Income Short straddles earn in rangebound days Helps earn theta during consolidation
Momentum Detector Premium expansion = trending day Sudden straddle shift = breakout sign🧠 Institutional Behavior Insight Who’s trapped? Writers or buyers? OI & Premium expansion hint accumulation/distribution
Volatility Tool Spike in CE/PE premium shows risk buildup IV divergence warns of big swing setups NIFTY Oscillation Reader Tracks chop zones vs clean breakouts Helps filter false swing entries✦ Intraday Edge with Straddle (Live Use Cases)
200± Straddle – Placing straddles 200 pts away from spot helps track theta burn zones and breakout traps.
P&F or Renko Analysis on Straddle Premium – Patterns like double bottom sell, VWAP rejection, or box breakout provide raw, noise-free signals.
Open Auction Day – If both legs fall fast, market has clear direction. If both rise, trap or expansion coming.
Theta Dance – Observing which leg decays faster helps catch the directional bias before the move.
✦ Swing Insights Using Straddle
Build Position with IV-HV Analysis: Low IV short straddles during consolidation; high IV long straddle before event.
Premium Expansion over 2–3 days without price movement often precedes big swing breakout.
Protective Hedges: Even directional players use straddles as hedged setups for complex exposure (straddle + call buy/put buy).
✦ The Psychology: Why Straddle Reflects Fear & Greed
Every tick in the premium reflects:Fear of sudden move (leading to premium buildup)
Complacency (leading to decay)
Institutional hedging or unwinding
Understanding these ticks trains a trader’s mindset to anticipate, not just react.
✦ Final Thoughts: Not Just a Strategy, but a Compass
Whether you are scalping intraday moves, catching swing breakouts, or simply decoding market psychology, the straddle is a mirror of NIFTY's soul.Because NIFTY oscillates sharply — pushing traders to emotional extremes — a well-read straddle structure keeps you calm, aware, and prepared for what the market is about to do — not what it just did.
"In the dance of CE and PE, the straddle does not just move — it reveals the market's heartbeat."
✦ Straddle Premium Patterns: A Noise-less Proxy to Option Greeks
While most traders rely on IV, Theta, and Gamma data to make sense of the market, straddle premium behavior itself can act as a clean proxy — especially when decoded through Point & Figure (P&F) or Renko charts.
These charts strip out time and focus purely on price behavior, offering raw, unfiltered emotional truth of the market.
Pattern-Based Interpretation Without Raw Greeks
P&F / Renko Pattern on Straddle Premium Hidden Greek Insight Interpretation
 Flat Box Zone (Stagnant Premium) High Theta decay Writers dominating, price expected to stay rangebound
Sudden Breakout of Premium IV Spike Market expecting volatility; possible directional move
One-Leg Collapse (CE or PE) Gamma Exposure Delta hedging in play, direction firming up
Alternating Columns (X/O) Unstable Vega/IV Market in indecision, breakout imminent
Double Bottom Sell Pattern (on CE/PE leg) Theta Burn + Bias Weak side collapsing, strong directional bias emerging
 Rising Column or Higher Bricks IV Expansion + possible Long Gamma Buyers expecting violent move, breakouts near
✦ Why This Works Like a Magic Lens
Greeks are derivatives of price and time.
Straddle premiums already reflect this derivative nature — if you can read the "shape" they form, you're essentially reading the emotion behind the greeks.
P&F or Renko acts as an amplifier, cutting out fake noise and showing only true demand-supply shifts.
✦ The Hidden Power in Pattern Study
"Where others hunt for data, the straddle trader hunts for meaning in patterns."
Using P&F or Renko on CE/PE premiums helps you:
Read real-time IV reaction without IV data.
Feel theta pressure by watching decay zones.
Spot gamma traps by observing one-leg explosions.
Sense volatility contractions or expansions just by noting box width and transitions.
✦ Example: How You Can Read IV Spike Without IV Data
You open a NIFTY ATM straddle at 9:30 AM.You plot both CE and PE separately in 1-minute P&F (0.5 box size).
Suddenly, both columns start showing long vertical moves.
No price breakout has occurred yet, but premium is expanding fast.
Conclusion: Market is loading volatility. A breakout is imminent. IV has likely spiked — without you ever needing to check IV.
✦ Final Takeaway: Pattern = Pulse
When you learn to see straddle premium not just as price, but as energy, and decode it with charts like P&F, you unlock something rare:You stop reacting to data.
You start resonating with rhythm.And that’s the soul of elite option trading — when price, pattern, and psychology merge into silent certainty.
✦ A Tribute to Abhijit Phatak (AP Sir) — The Silent Architect of Straddle Wisdom in India
As we explore the depth and dimensions of straddle premium behavior — through charts, psychology, and patterns — we must pause and bow our heads in respect and gratitude to the one who laid the first stones of this temple of knowledge:
AP Sir — a name whispered with reverence among serious traders,
not for loud fame, but for the clarity of his vision,
the depth of his practice,
and the silent revolution he sparked decades ago.Long before the mainstream caught on, AP Sir taught us to read straddles not just as strategy, but as a living market language.
He taught us to listen to the premium’s pulse, not just its price.
To see traps in time decay, and to witness structure in randomness.
To use noiseless charts like Renko & P&F not as alternatives, but as instruments of emotional precision.
In every breakout we catch, in every trapped writer we sense, in every box we plot — his spirit echoes.
"True legends don't seek attention, they seek understanding."
AP Sir’s gift was not just in what he taught,
but in how he made traders see what was always there — yet never noticed."✦ In Gratitude
This article, and the evolving framework around straddle premium decoding, is humbly dedicated to AP Sir,
whose pioneering insight in India lit the first lamp of this path.We are merely walkers of a trail he carved through decades of disciplined wisdom.
“The Man Who Traded in Silence”
A tribute to Abhijit Phatak (AP Sir)*He did not chase the flashing screens,
Nor danced to the market’s screams.
In rooms of noise, he chose the chart,
Where Xs and Os revealed the heart.Not a preacher, never loud,
Yet in his gaze, the market bowed.
With chalk of calm and board of grace,
He mapped the traps no one could trace.He showed us time was just a lie,
That truth lives where price patterns lie.
Not in candles burnt with fear,
But in patterns cold and clear.He spoke of straddles not as trades,
But mirrors where the market fades.
Where gamma breathes and theta dies,
Where volatility quietly lies.The premium’s pulse, the theta's sigh,
He heard it all, with a P&F eye.
While others screamed for entry lines,
He taught us how to read the signs.In Renko bricks or double tops,
In fading legs where momentum stops —
He taught us not to rush or race,
But let the market show its face.His legacy is not a class or course,
It’s every calm before a force.
It’s every trade we skip with poise,
And every silence that defeats the noise.So here we bow, to P&F's priest,
To the quiet mind, to the inner beast.
To the man who walked the charts alone,
And left us paths carved into stone.Thank you, AP Sir.
You did not teach us what to trade —
You taught us how to see.-
️ Disclaimer
-
This article, including all technical interpretations, charting insights, and poetic tributes, is intended solely for personal experience sharing and educational purposes.
-
The strategies and observations presented are a result of years of individual study, practice, and emotional learning by the author.
-
References to Abhijit Phatak (AP Sir) are made with utmost respect and admiration, recognizing his pioneering influence on the Indian trading community — especially in the realm of straddle pattern decoding and noiseless charting methods.
-
The P&F chart references, pattern readings, and psychological interpretations are meant to foster awareness and curiosity, not to be interpreted as financial or trading advice.
-
Readers are encouraged to do their own research, consult professionals, and treat this article as a framework of understanding, not a signal for investment or trading.
-
This work stands as a humble personal reflection and tribute —
-
a step in honoring the silent giants and shaping one’s own disciplined path.
-
-

El Dorado of Trading: The Quest for the Golden Edge
Introduction
Since time immemorial, the legend of El Dorado has captured the imagination of dreamers, explorers, and adventurers alike. It was said to be a city of unimaginable wealth — a land paved in gold, shimmering on the horizon, beckoning the brave and the bold to seek their fortune. Yet, despite countless journeys, the golden city remained elusive, a mystery that inspired as much awe as frustration.
In many ways, the life of a trader is a modern-day quest for El Dorado. Every chart, every trade, every market pulse carries the promise of that elusive golden edge — the perfect strategy, the winning streak, the breakthrough moment when risk turns to reward. But just like the explorers of old, traders face uncertainty, risk, and the temptation of chasing illusions.
This book invites you to embark on that timeless journey. It explores the parallels between the legendary search for El Dorado and the relentless pursuit of success in trading. Here, the golden city is more than just wealth; it is mastery over the market, mastery over oneself, and the transformation born from perseverance, discipline, and wisdom.
Through stories, insights, and practical guidance, El Dorado of Trading offers a map — not to a mythical city, but to a real, attainable destination: a trader’s mindset and method that can turn ambition into achievement. Whether you are a novice setting foot on this path or a seasoned explorer seeking renewed purpose, this book is a companion for the adventurer inside you.
The treasure is out there, shimmering beyond the charts. The question is — are you ready to seek it?Trader’s El Dorado: The Golden Quest Beyond Wealth
In the vast, swirling jungle of the financial markets, every trader sets out on a journey. It’s a quest for El Dorado — not just the city of gold from ancient legend, but a personal paradise where every trade whispers promise and every move is precise.
Trader’s El Dorado is not found on any map. It’s a shimmering vision beyond mere profit, a place where strategy meets intuition, and discipline dances with courage. It’s the moment when fear loses its grip and confidence flows like a river of gold.
This golden city is built on the pillars of patience, resilience, and learning. It’s where losses are not defeats but the rough roads that guide you closer to mastery. The market’s chaos fades into harmony as you read its rhythm and pulse like a seasoned explorer reading an ancient script.
Trader’s El Dorado is the freedom to live life on your terms — waking up each day with a calm mind, a sharp edge, and a heart aligned with your purpose. It’s the peace that comes from knowing your edge, your system, your mindset are solid and unshakeable.
Yet, this El Dorado is more than wealth. It’s a mirror of your growth, your spirit tempered by trial and triumph. It’s the light at the end of countless nights of struggle, the destination that rewards not just the balance sheet but the soul.
Every trader’s El Dorado is unique — a blend of dreams, goals, and values. Some seek financial independence, others crave mastery or legacy. But all who chase it share one truth: The journey itself is the real treasure. Because only by walking through fire and storm can you ever claim your own city of gold.Trader’s El Dorado: The Golden Horizon of the Market Soul
In the endless expanse of the financial markets, amid the flashing numbers and the roar of global exchanges, lies a dream as ancient and compelling as humanity itself: the Trader’s El Dorado. It is not a mere place or a fixed destination — but a living, breathing horizon that beckons with promises of mastery, freedom, and profound fulfillment.
This El Dorado is forged in the fires of relentless pursuit. It is the culmination of countless mornings waking before dawn, eyes scanning charts, mind tuned to the subtle pulse beneath the noise. It is built from every win and every loss — the sweet taste of victory balanced by the bitter lessons carved from defeat.
To the outsider, trading may seem like a game of chance or a ruthless battle for wealth. But for those who seek their El Dorado, it is a sacred journey of transformation. The market is both the wilderness and the guide, the labyrinth and the map. It challenges your intellect, tests your emotions, and calls forth a warrior’s spirit.
Trader’s El Dorado is the moment when fear dissolves into fearless clarity, when hesitation gives way to disciplined action. It is the silence in the storm, where the trader stands calm and steady, anchored by a deep understanding of risk, reward, and self. Here, trading transcends numbers and strategies — it becomes an art, a flow state where mind and market merge.
But this golden city is not only about money. True El Dorado is the freedom to live life on your own terms — free from the chains of financial worry, empowered to create, to dream, to grow. It is waking each day with purpose, moving with confidence, knowing that your tools — your edge, your strategy, your mindset — are unbreakable.
It is a place where balance is found: between logic and intuition, patience and action, courage and humility. Where the trader’s soul is tempered like gold in the forge, resilient and radiant. The journey to El Dorado is long and often lonely, filled with uncertainty and sacrifice, but it is also illuminated by moments of profound insight and joy.
Every trader’s El Dorado is deeply personal — a unique constellation of goals, values, and dreams. For some, it is the security to support their loved ones without fear. For others, it is the thrill of mastering complexity or the satisfaction of a legacy built in the market’s crucible.
Yet, the greatest truth of the Trader’s El Dorado is this: the real treasure is not the destination, but the journey itself. Because it is through walking the rugged path, facing the shadows of doubt and the heights of triumph, that the trader is truly transformed. And in that transformation, they find their own golden city — a state of being, a mindset, a freedom that no market crash can take away.
So, to every trader chasing that elusive city of gold — know this: your El Dorado awaits. It glimmers not in distant fortune, but in your courage to pursue, your resilience to endure, and your wisdom to grow. Step forward with heart and mind aligned, and the market’s golden horizon will become your reality.Trader’s Code of Ethics — The Path to Your El Dorado
Integrity Above All
I will be honest with myself and others in every trade. I reject deceit, manipulation, and shortcuts that compromise trust.Respect for the Market and Others
I will trade fairly and with respect for all market participants, recognizing that the market is a shared ecosystem.Discipline and Patience
I commit to following my strategy with discipline, avoiding impulsive decisions driven by greed or fear.Continuous Learning
I embrace every trade — win or lose — as an opportunity to learn and grow. I will stay humble and open-minded.Risk Responsibility
I will manage my risks prudently, protecting not only my capital but also my peace of mind.Transparency and Accountability
I hold myself accountable for my actions and decisions, sharing truthfully when required and reflecting honestly on outcomes.Emotional Mastery
I will cultivate emotional balance, ensuring my mindset supports clear, rational decision-making.Contribution and Legacy
I seek to contribute positively to the trading community and build a legacy of ethical success.Ode to the Trader’s El Dorado
In markets vast where shadows play,
The trader walks a narrow way,
With dreams that gleam like morning gold,
A quest of courage, fierce and bold.
Not just for wealth, the journey’s made,
But honor’s light will not fade.
Integrity, the steadfast flame,
That guides through loss, through trial, through gain.
With patience woven into each stride,
And discipline to be the guide,
No greed to blind, no fear to chain,
A heart that beats with steady reign.
The market’s voice, a whispered song,
Teaches right where once was wrong,
In every trade, a lesson’s seed,
To nurture growth, to serve the creed.
Respect for all who share this space,
The traders’ tribe, the market’s grace.
Accountable, we hold our hand,
With transparent truth, we take our stand.
Emotions ruled, not ruling us,
In calm and storm, a silent trust.
For in this dance of risk and chance,
We seek not luck, but a mindful stance.
And when the golden city gleams,
It’s more than riches, more than dreams.
It’s freedom earned with honor’s light,
A legacy of wisdom is bright.
So traders, rise with purpose clear,
Let ethics be your compass near.
For El Dorado’s not a far—
It shines within your trading star.“True wealth in trading, like in life, is found not in reckless pursuit of gold, but in the disciplined journey guided by integrity, patience, and respect for the market’s lessons. El Dorado is not a prize to seize, but a standard to honor.”
-
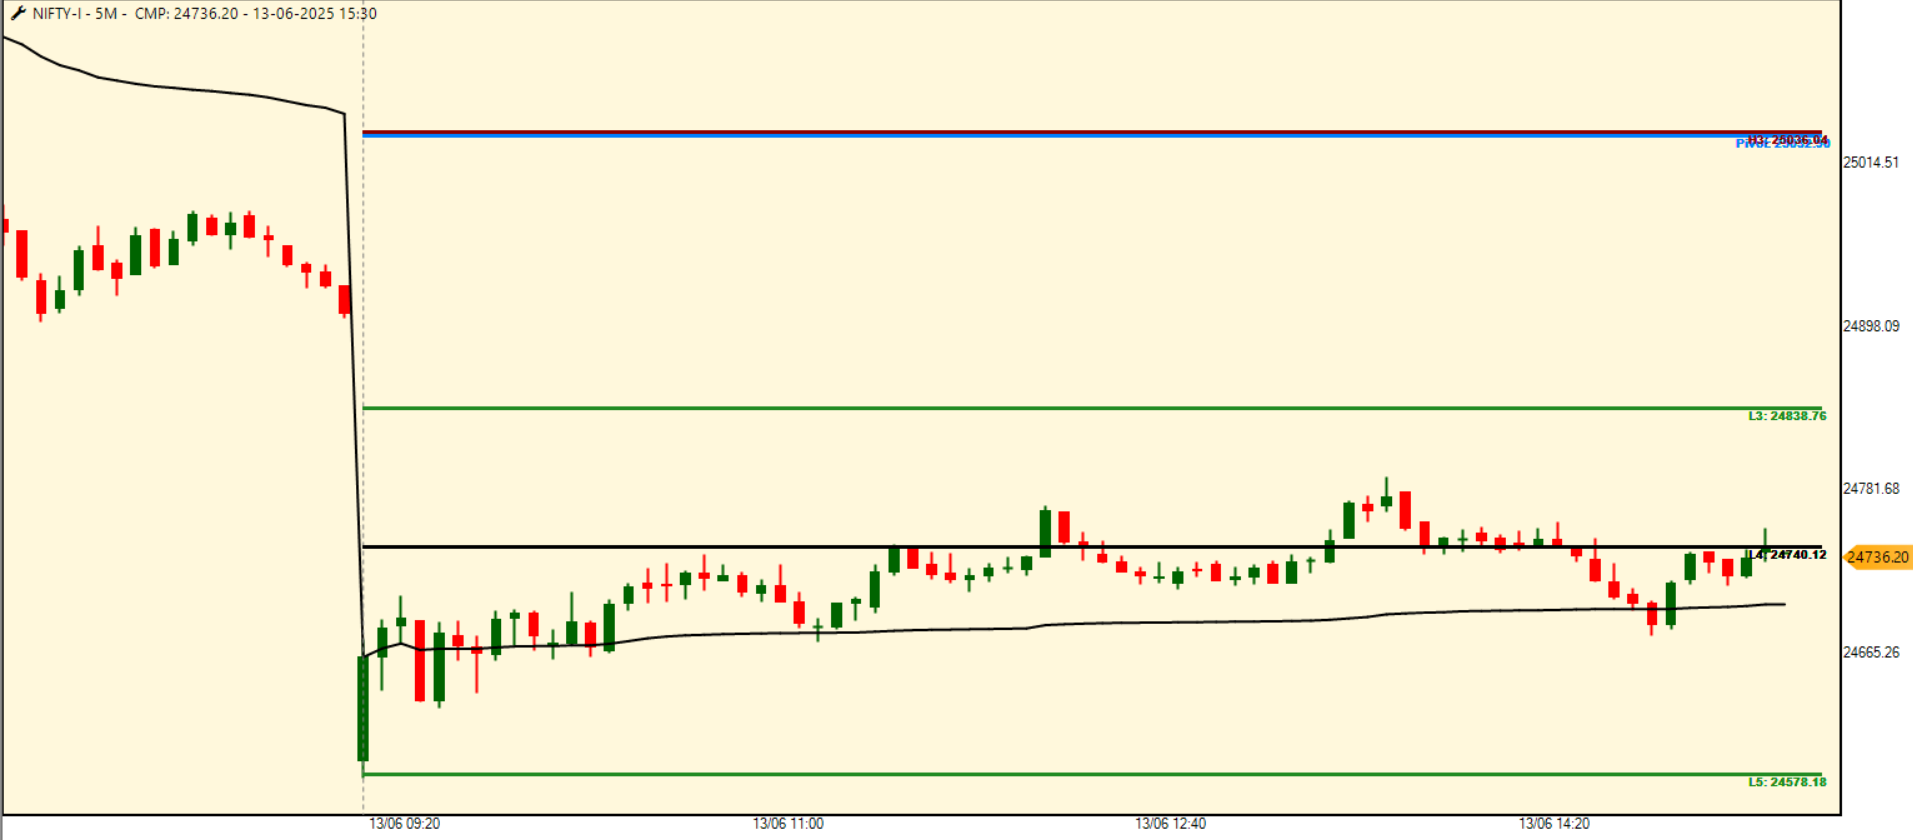
-
NIFTY OPENING NEAR at L5 & after spending 15-30 min , it's roaming witin L4-L5 , QUESTION which way i thought about today's trade ( means bias , type of trade etc )
-
- vwap slope any hint ???
-
- 200(-+) from spot LTP what is doing ??? ...will guide me that's point
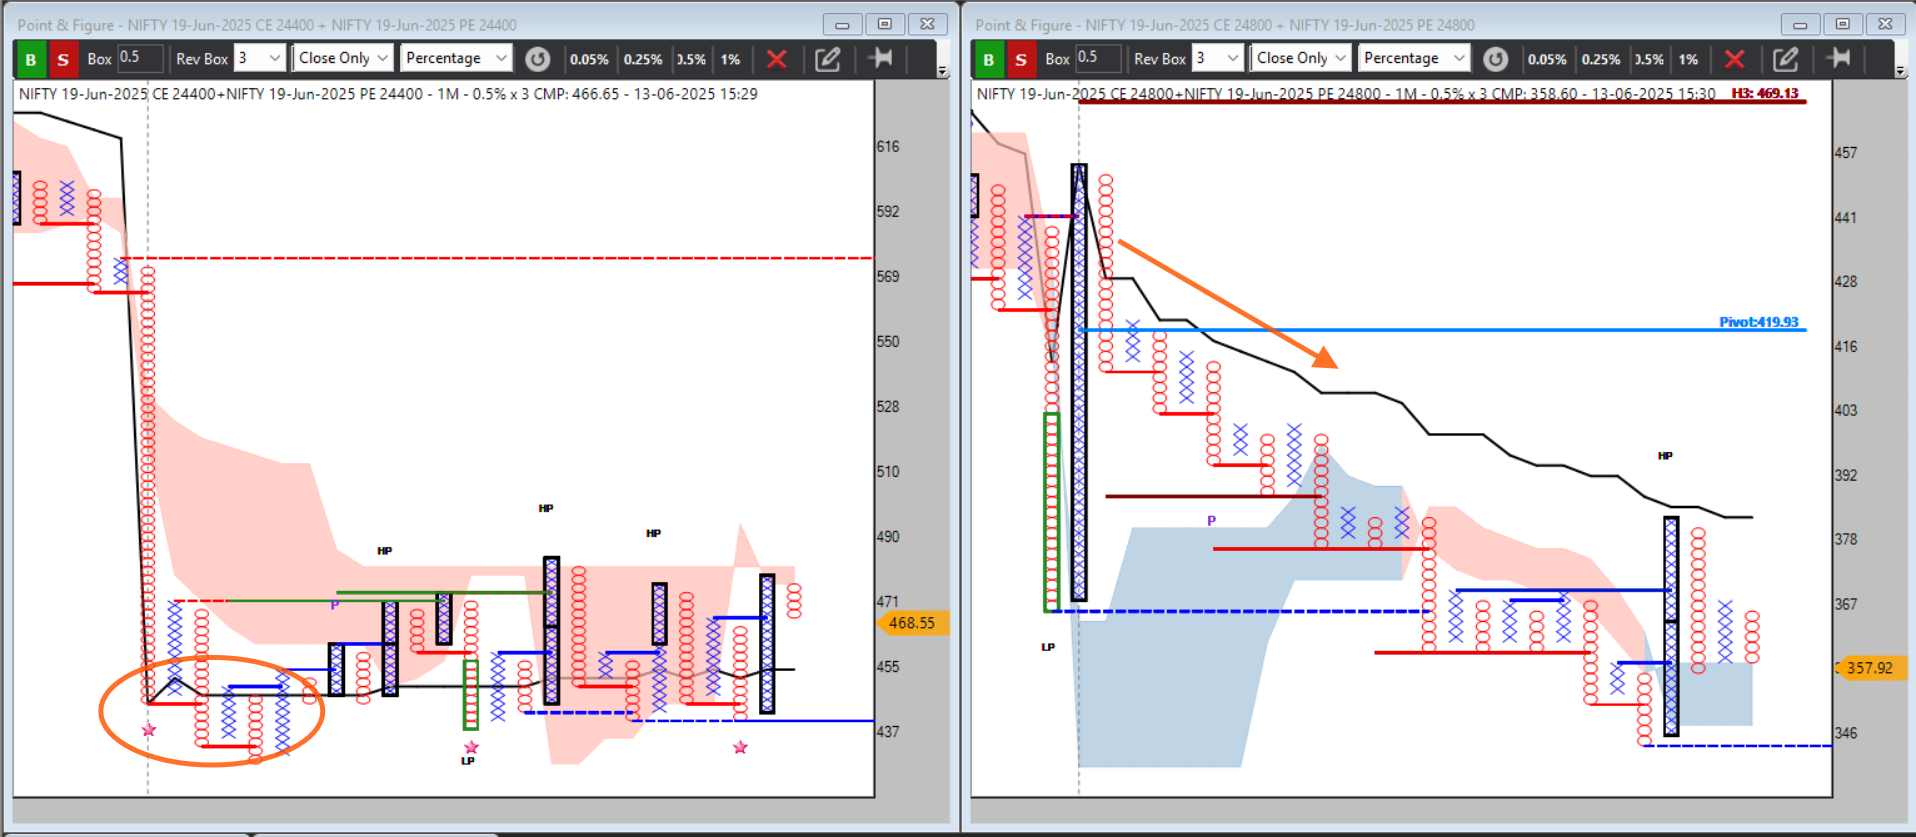
- 200(-+) from spot LTP what is doing ??? ...will guide me that's point
-
24800 after strong opening no follow through & after some DBS with vwap slope downwards , indicate L5 spot giving strong support probabilities and gap down not accept by market . so first not to be bearish any cost . let's see 24400 what's doing .
-
24400 hovering near vwap with not meaning full bearish trend as per opening sentiment & not so bullish also .
-
So comparatively 24800 more weak with pattern confluence than 24400 , so view sideways as upper straddle loosing strength & lower straddle also not lossing not gaining , just holding it's whipsaw. it's morning one hour session reading .
-
So to me 24800 short straddle best as per evolving structure with vwap above close as stop-loss & dbs for entry
later part when 24400 straddle gets some vwap above good pattern ( after morning session ) i can be plan ce buy with near wvap entry as it's not so bullish to enter any breakout pattern rather plan for pullback pattern ( 24400 straddle stracure will say about momentum ce buy or pullback ce buy with small point target ) though i am not trade any ce long today . it's just education addition . -
🧱 All-Short, Multi-Leg Engineering at the Top How the 25500–25900 Zone Was Sold, Not Defended
🧱 All-Short, Multi-Leg Engineering at the Top How the 25500–25900 Zone Was Sold, Not Defended
11/07/2025 live straddle discussion
Nifty 50 Market Pulse: Breadth Bullish Crossover & P&F Price Action Point to Early Upside
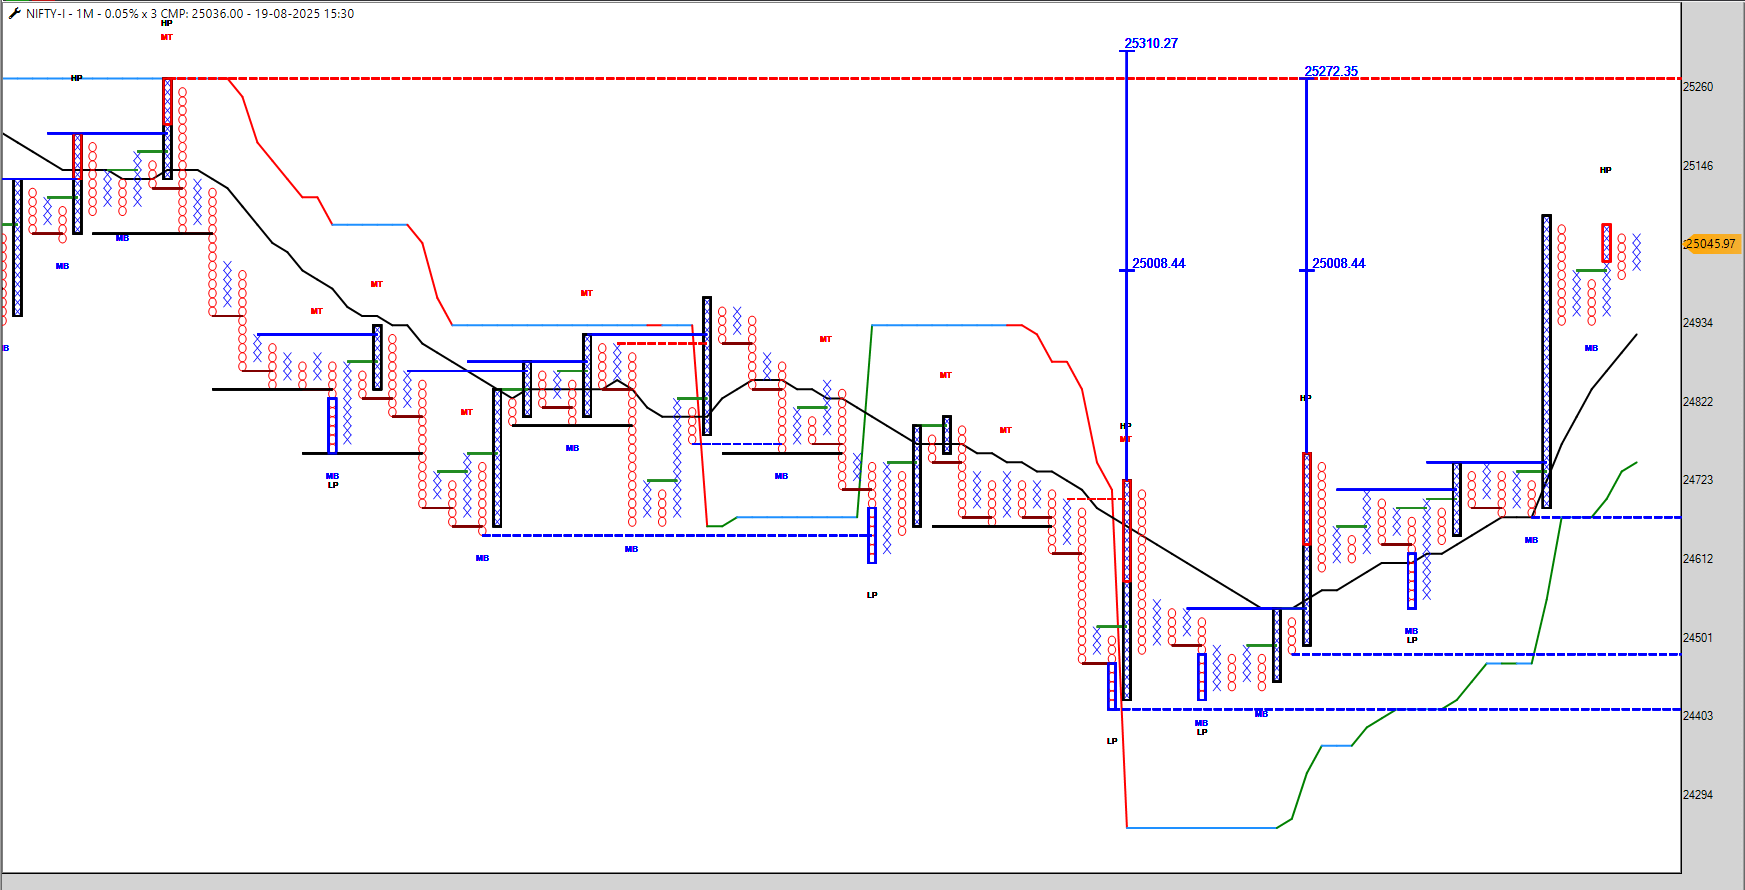 Short Straddle Selling – Patience Beats the Noise :(A Case Study from a Live Chart)
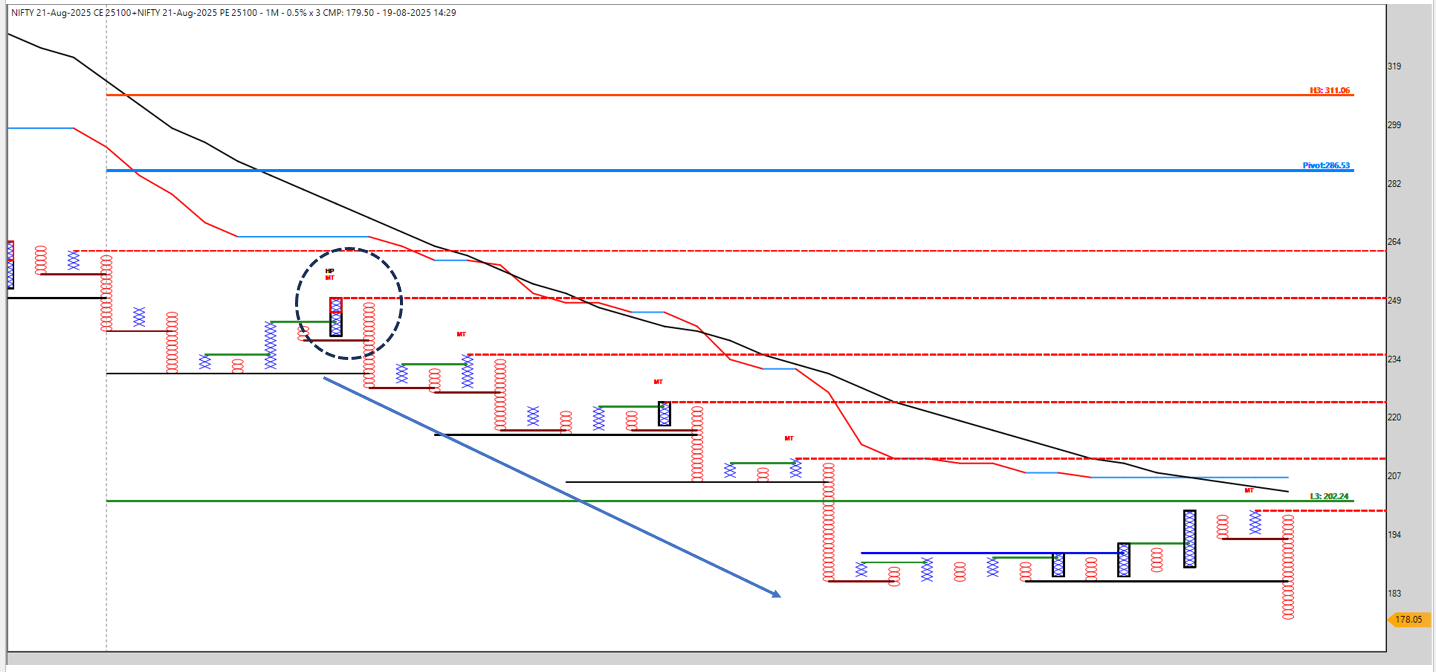 Building Your Own Intraday Breadth Analysis System
🧠 Two Souls of a Trader: How to Separate the Analyst from the Executor & Trade with Clarity Using Definedge’s Buzzer Ecosystem
Short Straddle Selling – Patience Beats the Noise :(A Case Study from a Live Chart)
Short Straddle Selling – Patience Beats the Noise :(A Case Study from a Live Chart)
Short Straddle Selling – Patience Beats the Noise :(A Case Study from a Live Chart)
Nifty 50 Market Pulse: Breadth Bullish Crossover & P&F Price Action Point to Early Upside
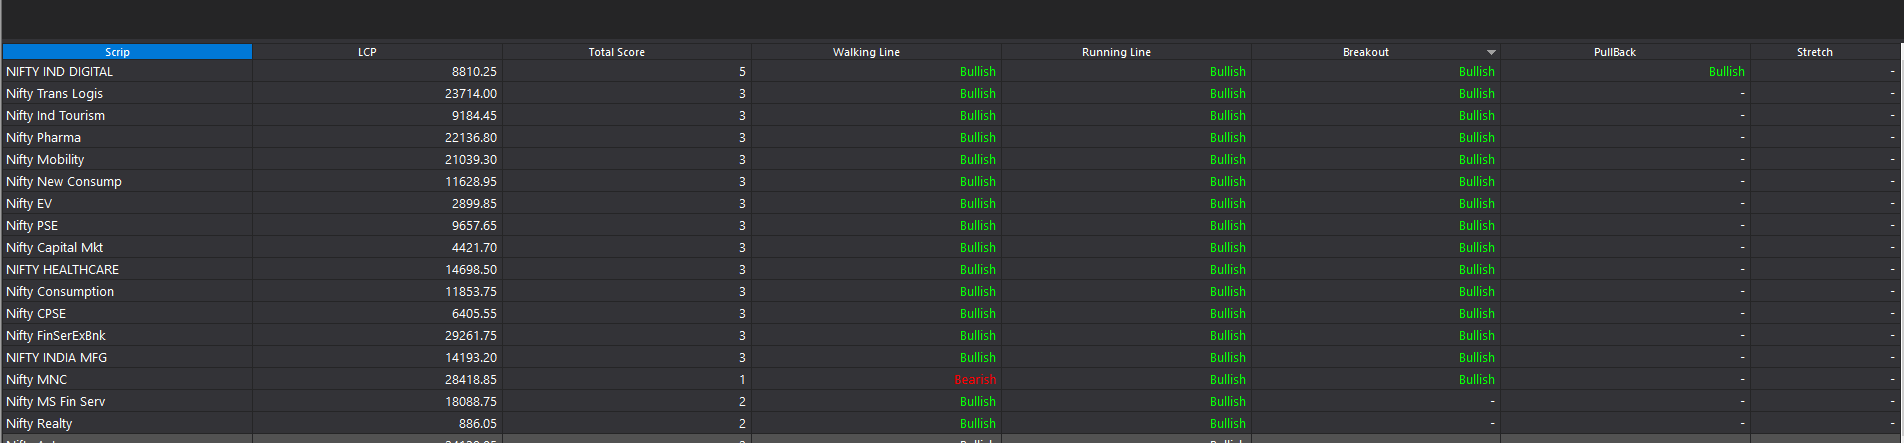 Nifty 50 Market Pulse: Breadth Bullish Crossover & P&F Price Action Point to Early Upside
 NIFTY Transport & Logistic vs NIFTY 500 – RS Chart Signals Fresh Outperformance
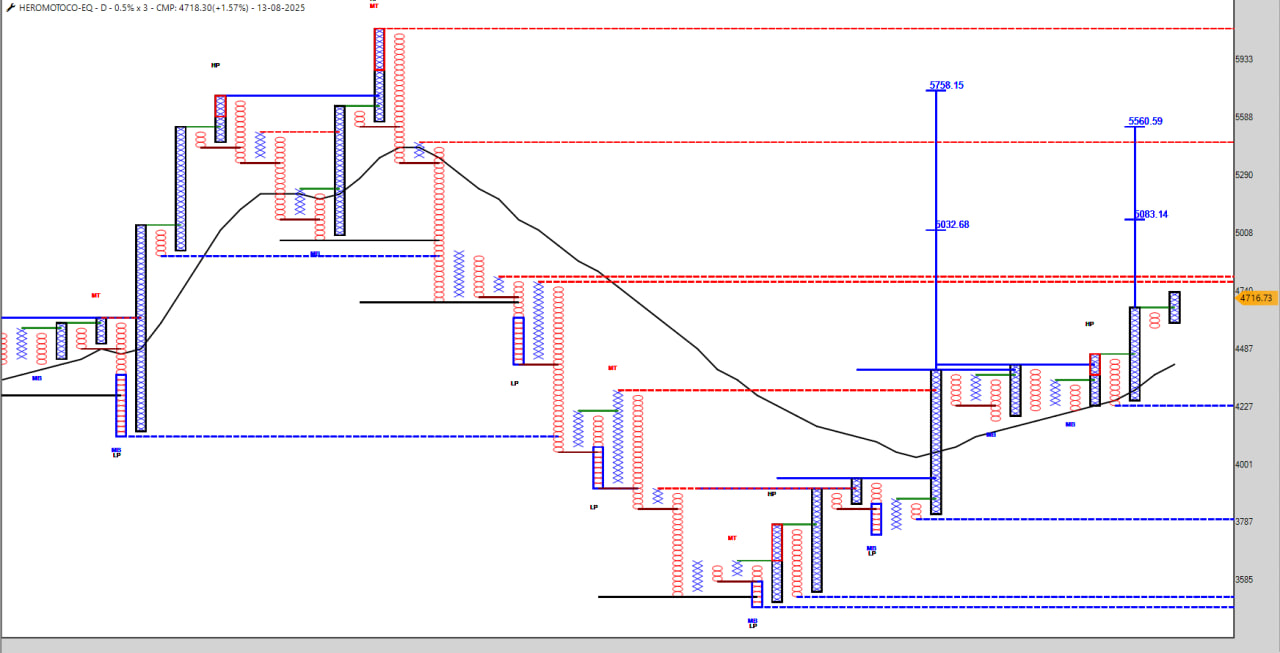 Short Straddle Selling – Patience Beats the Noise :(A Case Study from a Live Chart)
Mastering Nifty 50 Intraday Moves – A Weighted Approach to Reading Market Dynamics
Short Straddle Selling – Patience Beats the Noise :(A Case Study from a Live Chart)
Mastering Nifty 50 Intraday Moves – A Weighted Approach to Reading Market Dynamics
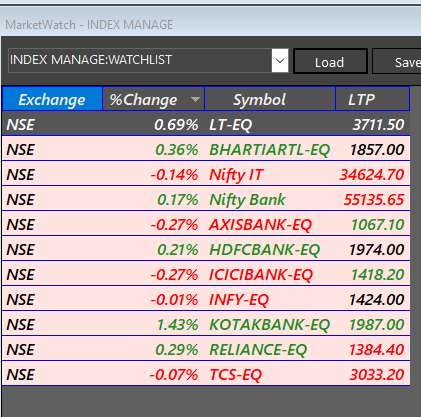 Mastering Nifty 50 Intraday Moves – A Weighted Approach to Reading Market Dynamics
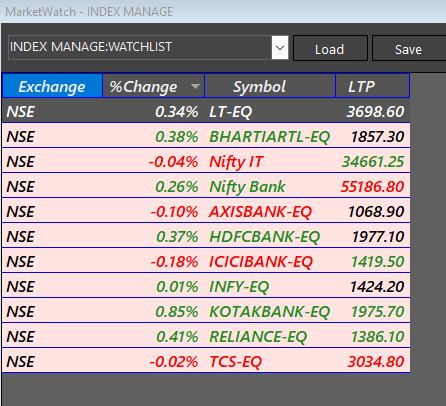 “When the Option Seller Sells His Last Shirt” — A Trading Joke With a Serious Lesson
Mastering Nifty 50 Intraday Moves – A Weighted Approach to Reading Market Dynamics
Mastering Nifty 50 Intraday Moves – A Weighted Approach to Reading Market Dynamics
Price First, OI Second — The Two Roads of Intraday Trading
“When the Option Seller Sells His Last Shirt” — A Trading Joke With a Serious Lesson
Mastering Nifty 50 Intraday Moves – A Weighted Approach to Reading Market Dynamics
Mastering Nifty 50 Intraday Moves – A Weighted Approach to Reading Market Dynamics
Price First, OI Second — The Two Roads of Intraday Trading
🧠 Two Souls of a Trader: How to Separate the Analyst from the Executor & Trade with Clarity Using Definedge’s Buzzer Ecosystem
Mastering Nifty 50 Intraday Moves – A Weighted Approach to Reading Market Dynamics
NIFTY Transport & Logistic vs NIFTY 500 – RS Chart Signals Fresh Outperformance
The Moral Greeks – A Complete Ethical & Psychological Compass for the Short Straddle Intraday Trader
The Turtle’s Way in Straddle Trading: Ethics, Endurance & Why We Never Chase Jackpots
200 straddle 05/08
Beyond Premium: 21 Questions Every Short Straddle Trader Must Ask
AP Sir’s Camarilla Exhaustion Reversal Theory (CERT)
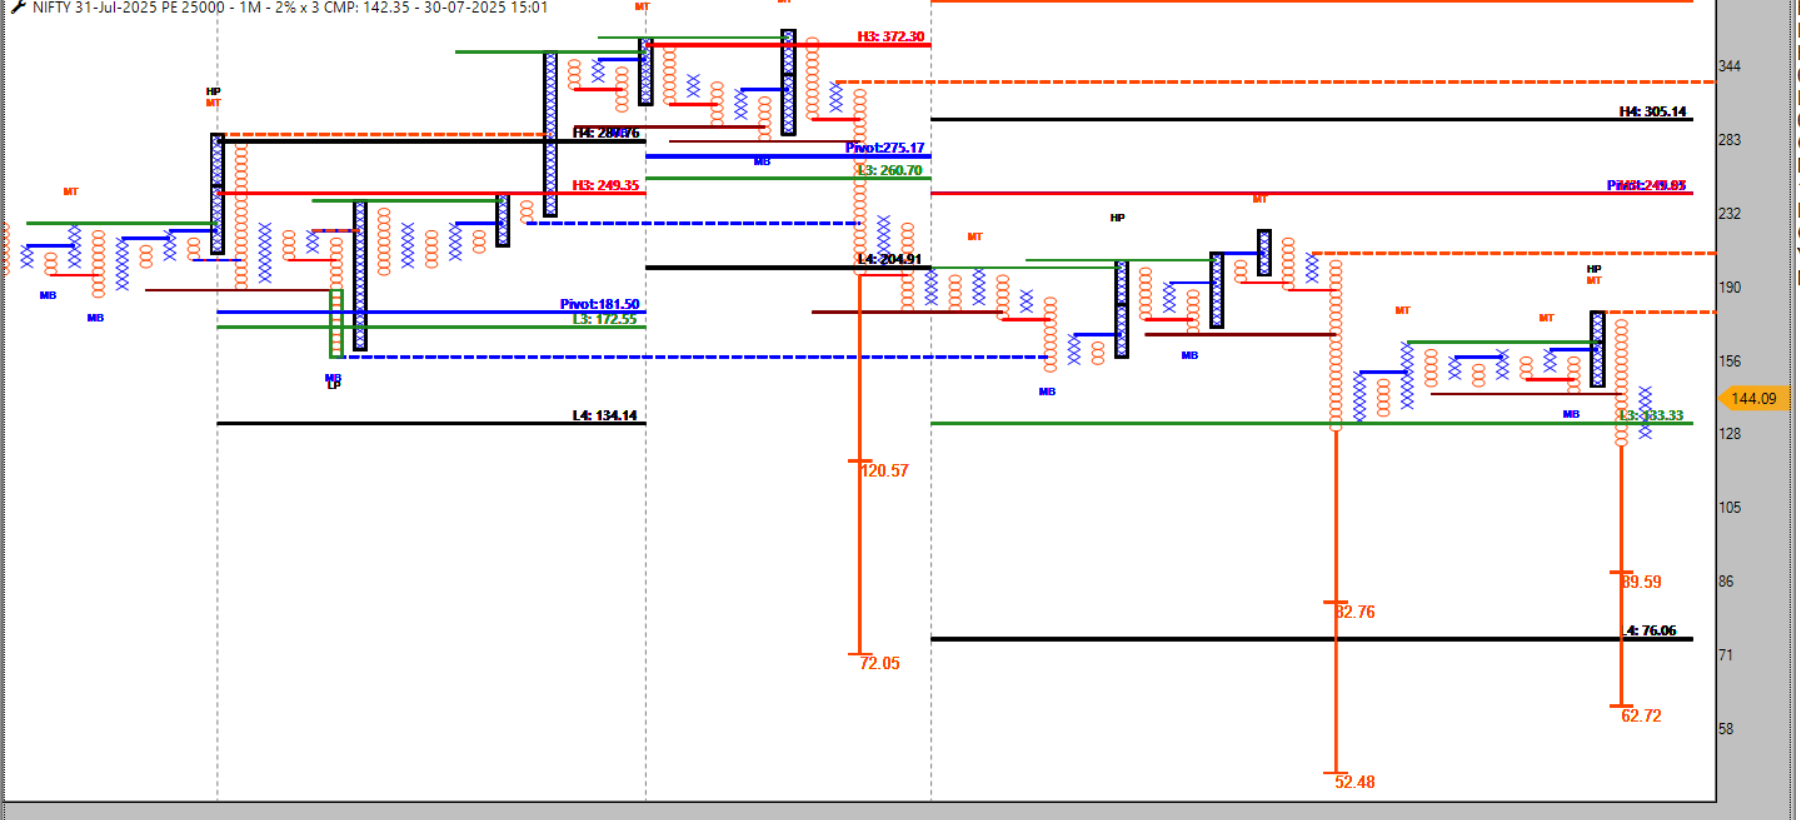
🩶 Using 200± Straddles with D-SMART to Decode Market Pressure: A Structural Approach
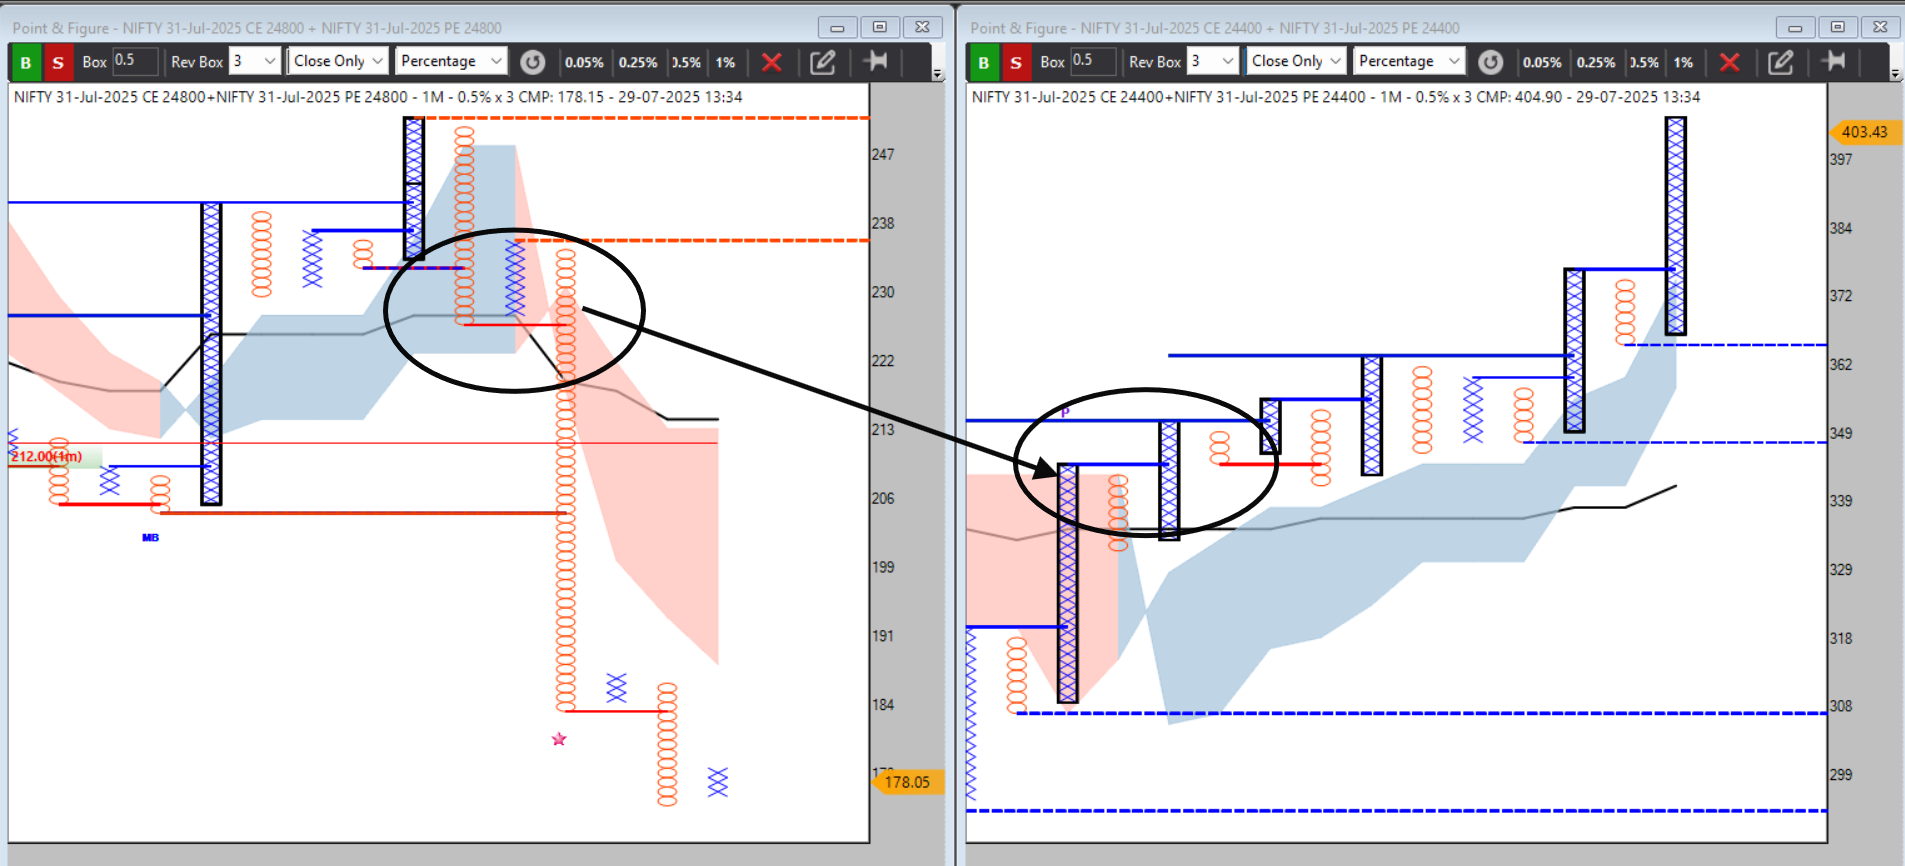
🩶 Using 200± Straddles with D-SMART to Decode Market Pressure: A Structural Approach
🧭 Zones of Memory: Where the Past Holds the Present
NIFTY 50 Technical Outlook – Short-Term Support Testing Zone
200 straddle 28/07
AP Sir’s Camarilla Exhaustion Reversal Theory (CERT)
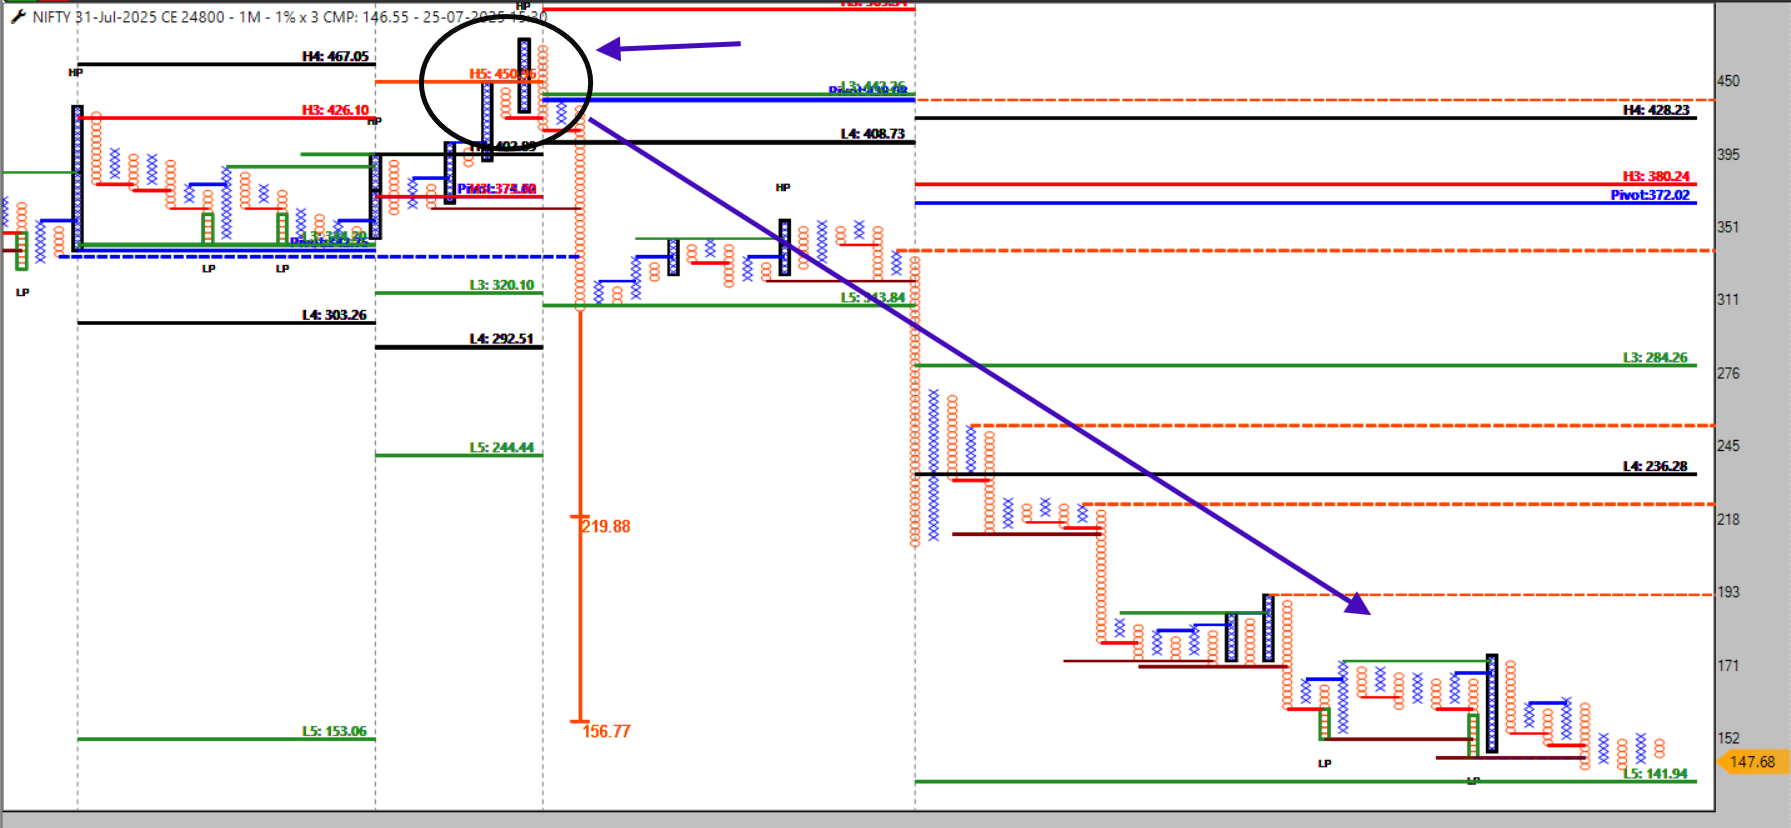
ADDITION of indicator section in straddle/rs/spread watchlist
AP Sir’s Camarilla Exhaustion Reversal Theory (CERT)
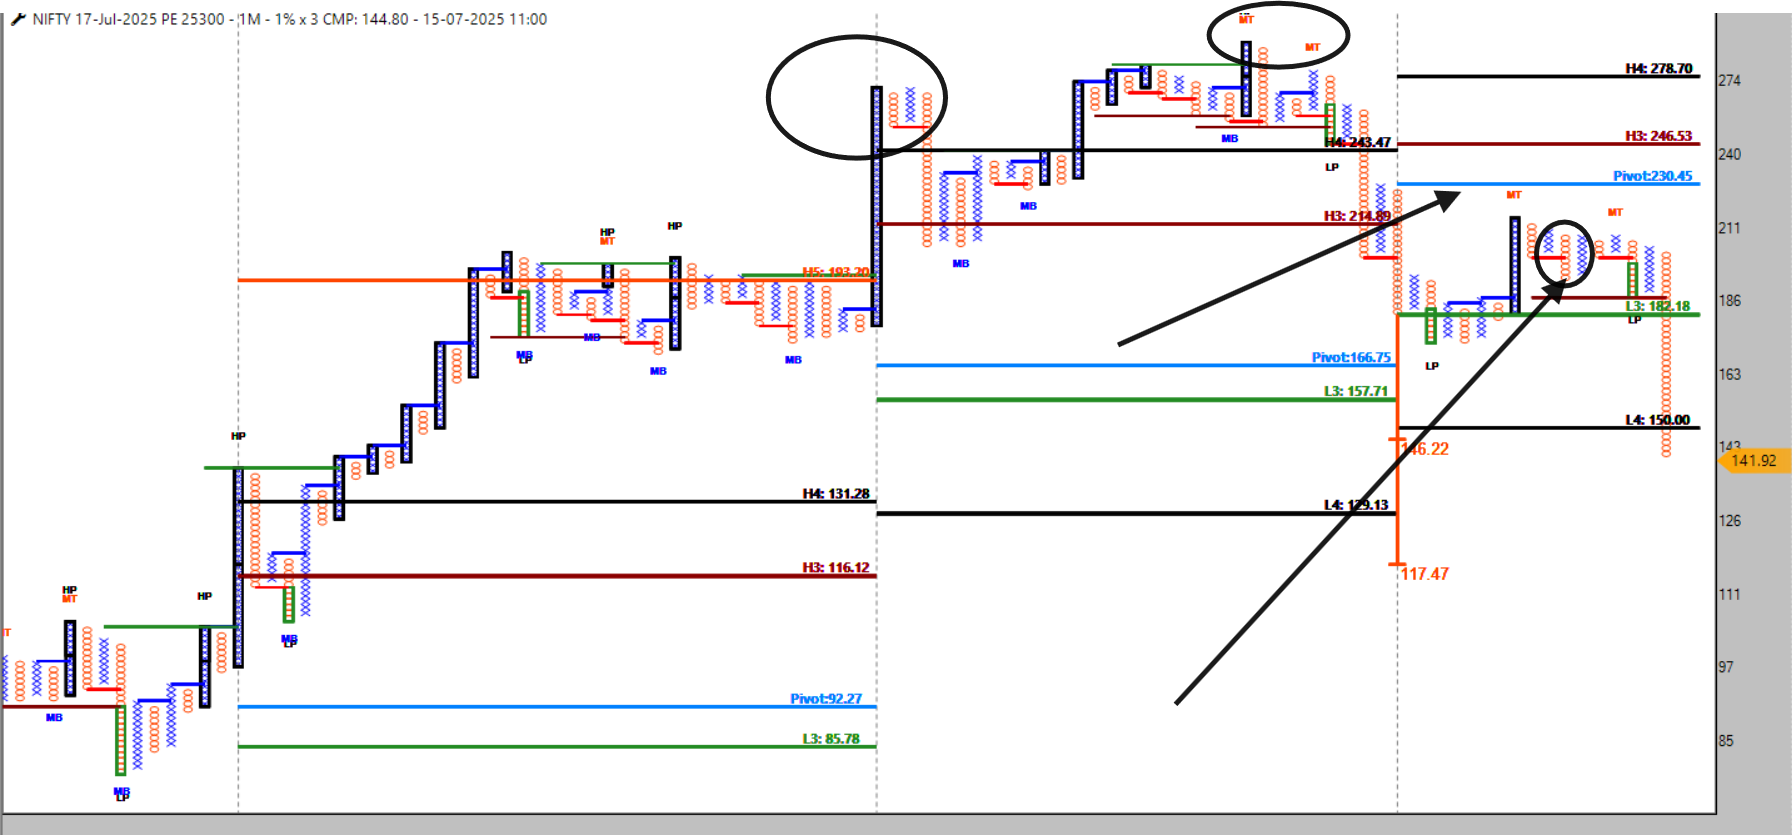
Today Using 200± Straddles (Nifty) - 14/07/2025
Boring vs Exciting Trading Systems: ROI, Pros, Cons, Mental Health, and Long-Term Truth
Boring vs Exciting Trading Systems: ROI, Pros, Cons, Mental Health, and Long-Term Truth
Boring vs Exciting Trading Systems: ROI, Pros, Cons, Mental Health, and Long-Term Truth
Boring vs Exciting Trading Systems: ROI, Pros, Cons, Mental Health, and Long-Term Truth
11/07/2025 live straddle discussion
11/07/2025 live straddle discussion
ADDITION of indicator section in straddle/rs/spread watchlist
Is NIFTY Headed for a Big Move? Reading the 31st July 25,500 Straddle’s Directional Pain
11/07/2025 live straddle discussion
11/07/2025 live straddle discussion
11/07/2025 live straddle discussion
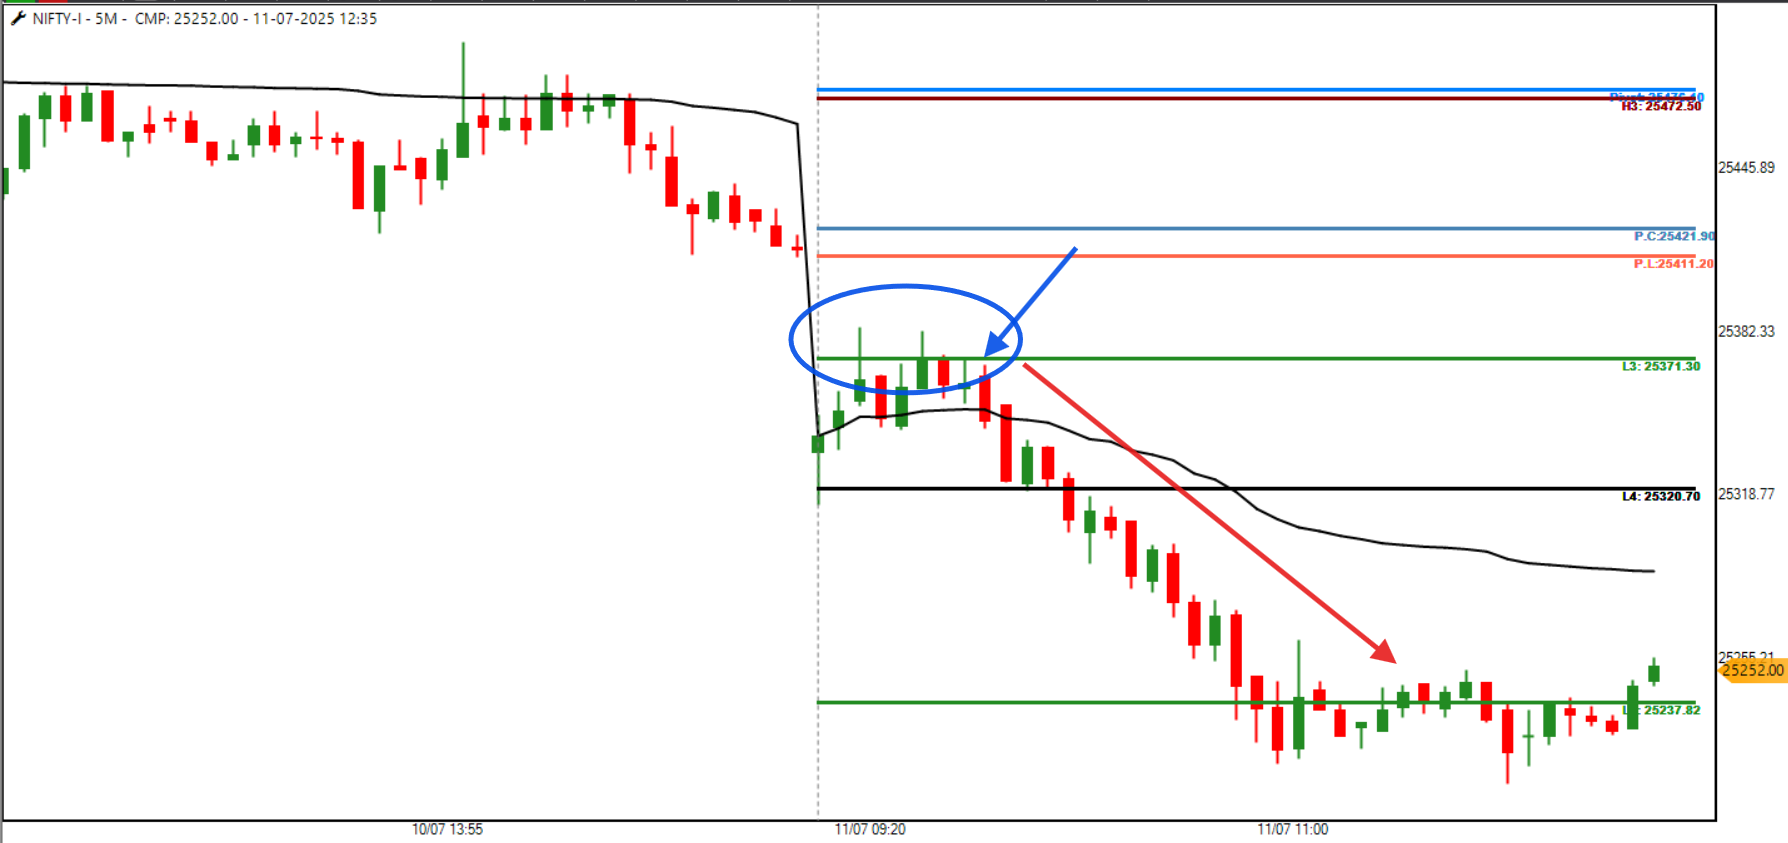 ️ “The Abhimanyu Context and Exit Problem in Modern Trading”
11/07/2025 live straddle discussion
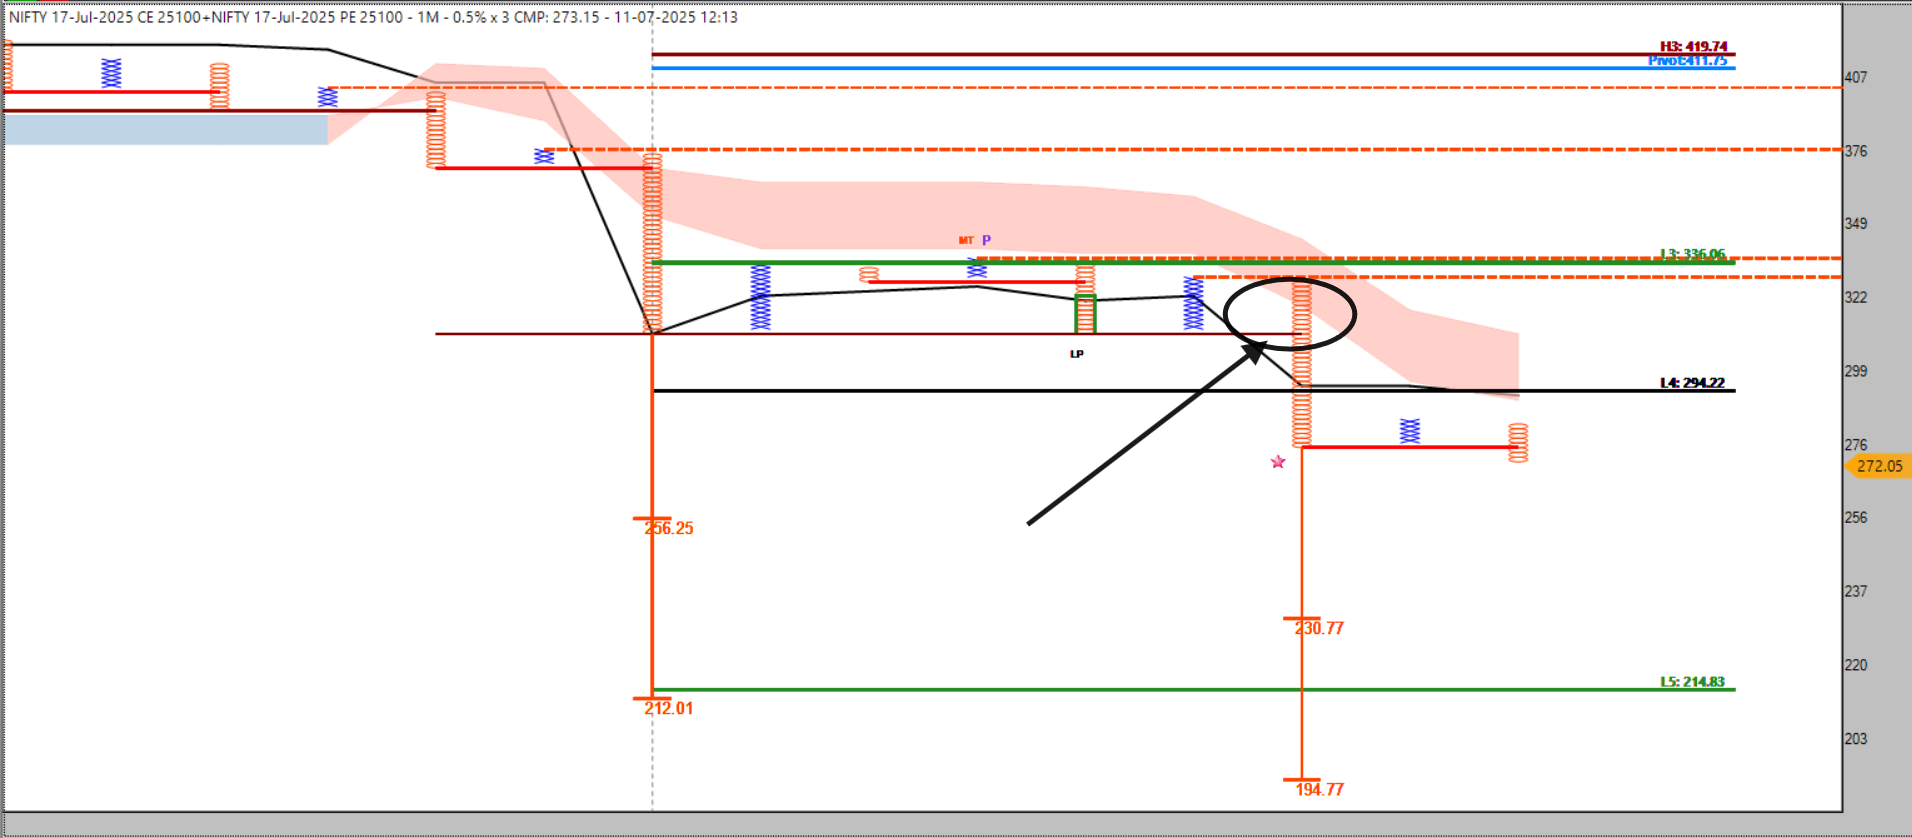


🩶 Using 200± Straddles with D-SMART to Decode Market Pressure: A Structural Approach

Renko | Long Options using DC, BI and Divergence
Renko | Long Options using DC, BI and Divergence
200 straddle 11/07
11/07/2025 live straddle discussion
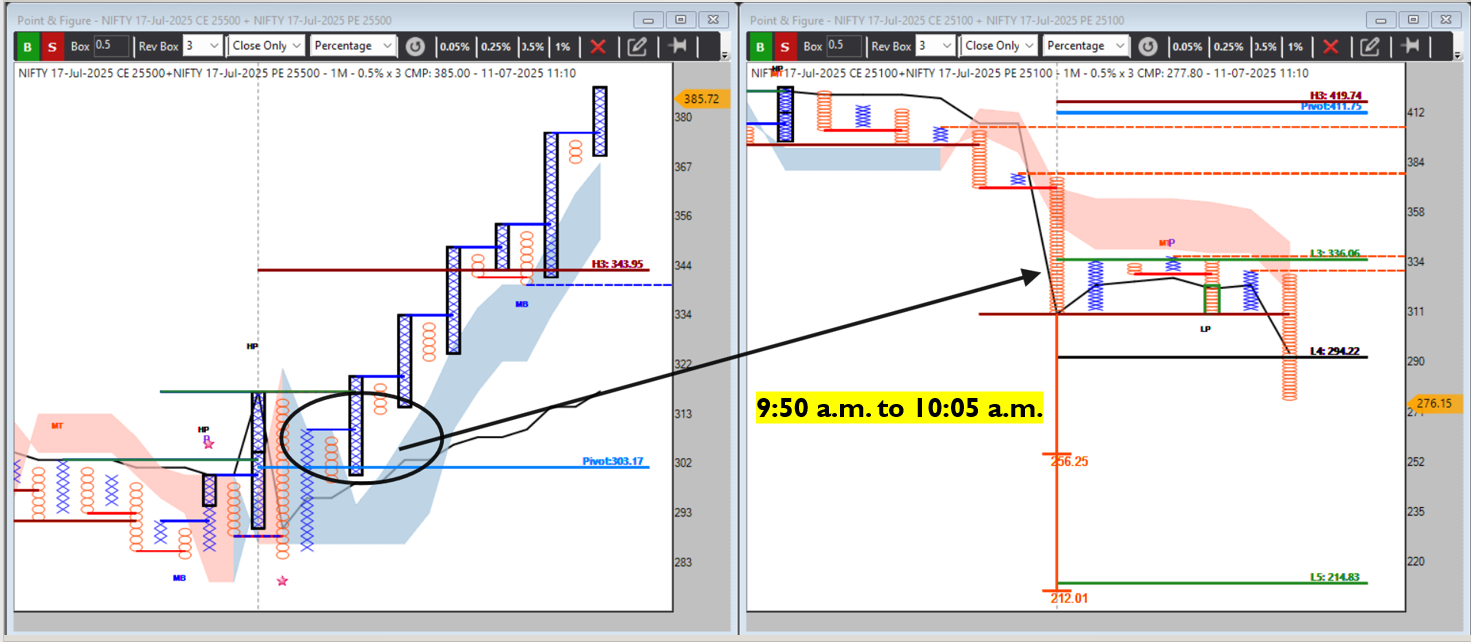 ️ Beyond Signals: What Makes an Indicator Truly Useful in Trading?
11/07/2025 live straddle discussion
11/07/2025 live straddle discussion
11/07/2025 live straddle discussion
11/07/2025 live straddle discussion
11/07/2025 live straddle discussion
11/07/2025 live straddle discussion
10/07/2025
Why I Trade 200± NIFTY Straddles (And When to Flex with ATR/ADR)
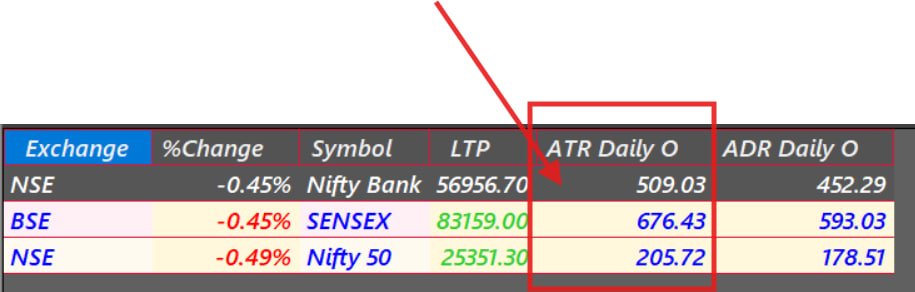
10/07/2025 straddle live dicussion
10/07/2025 straddle live dicussion
Why I Trade 200± NIFTY Straddles (And When to Flex with ATR/ADR)
10/07/2025 straddle live dicussion
10/07/2025 straddle live dicussion
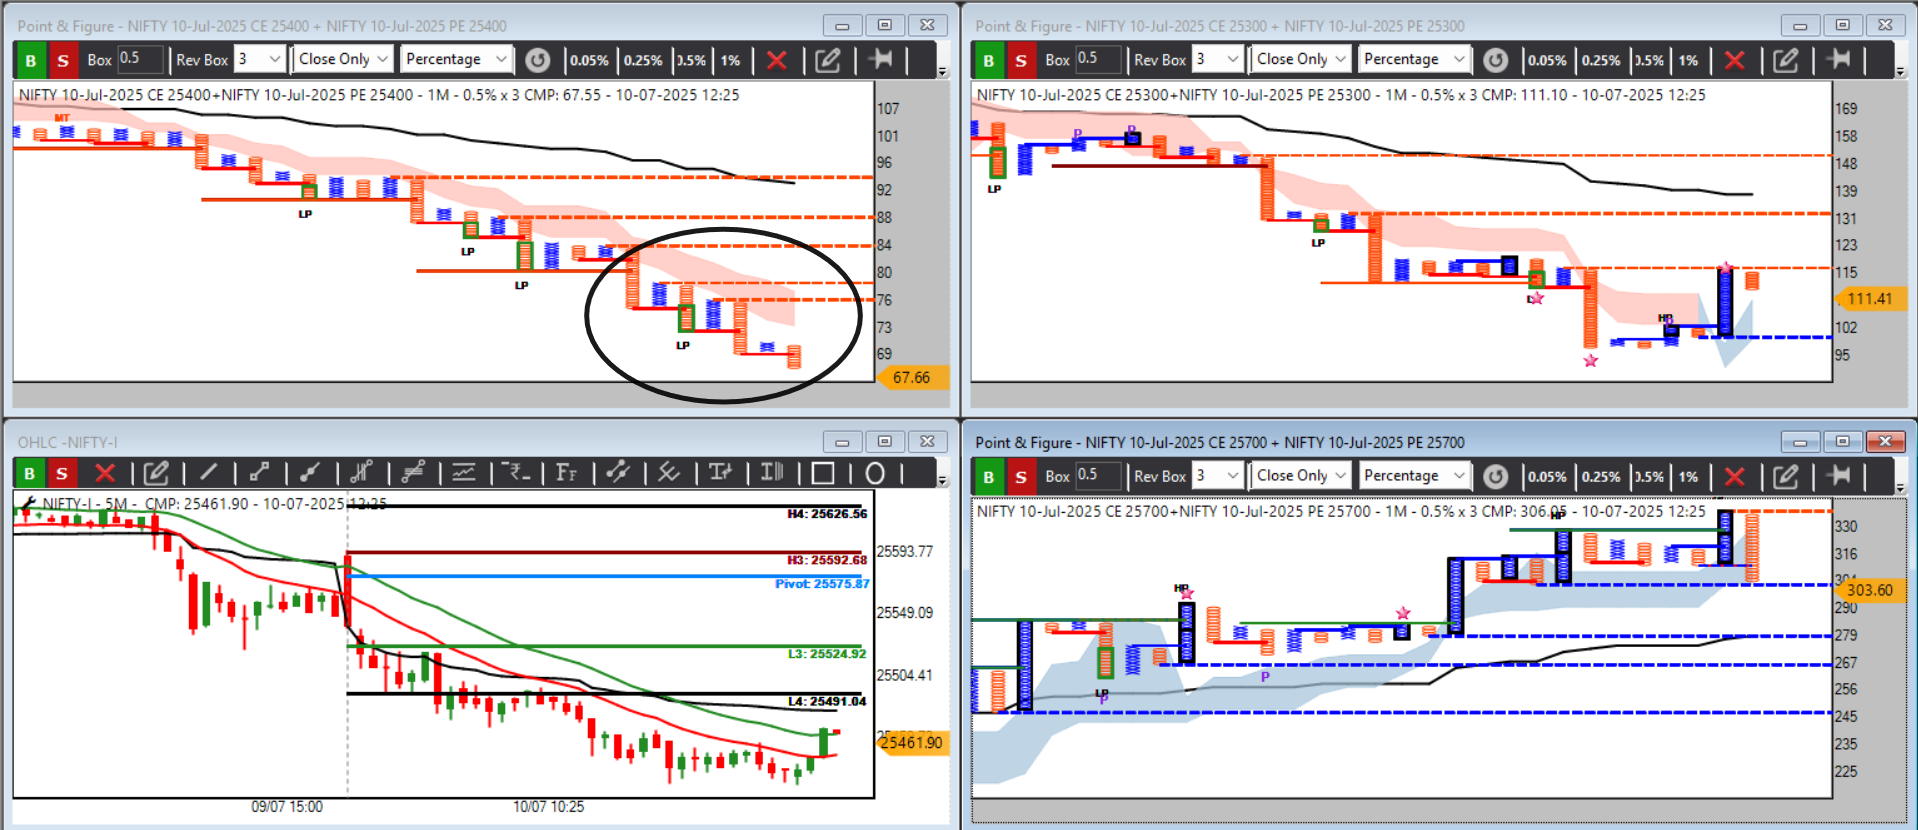
10/07/2025 straddle live dicussion
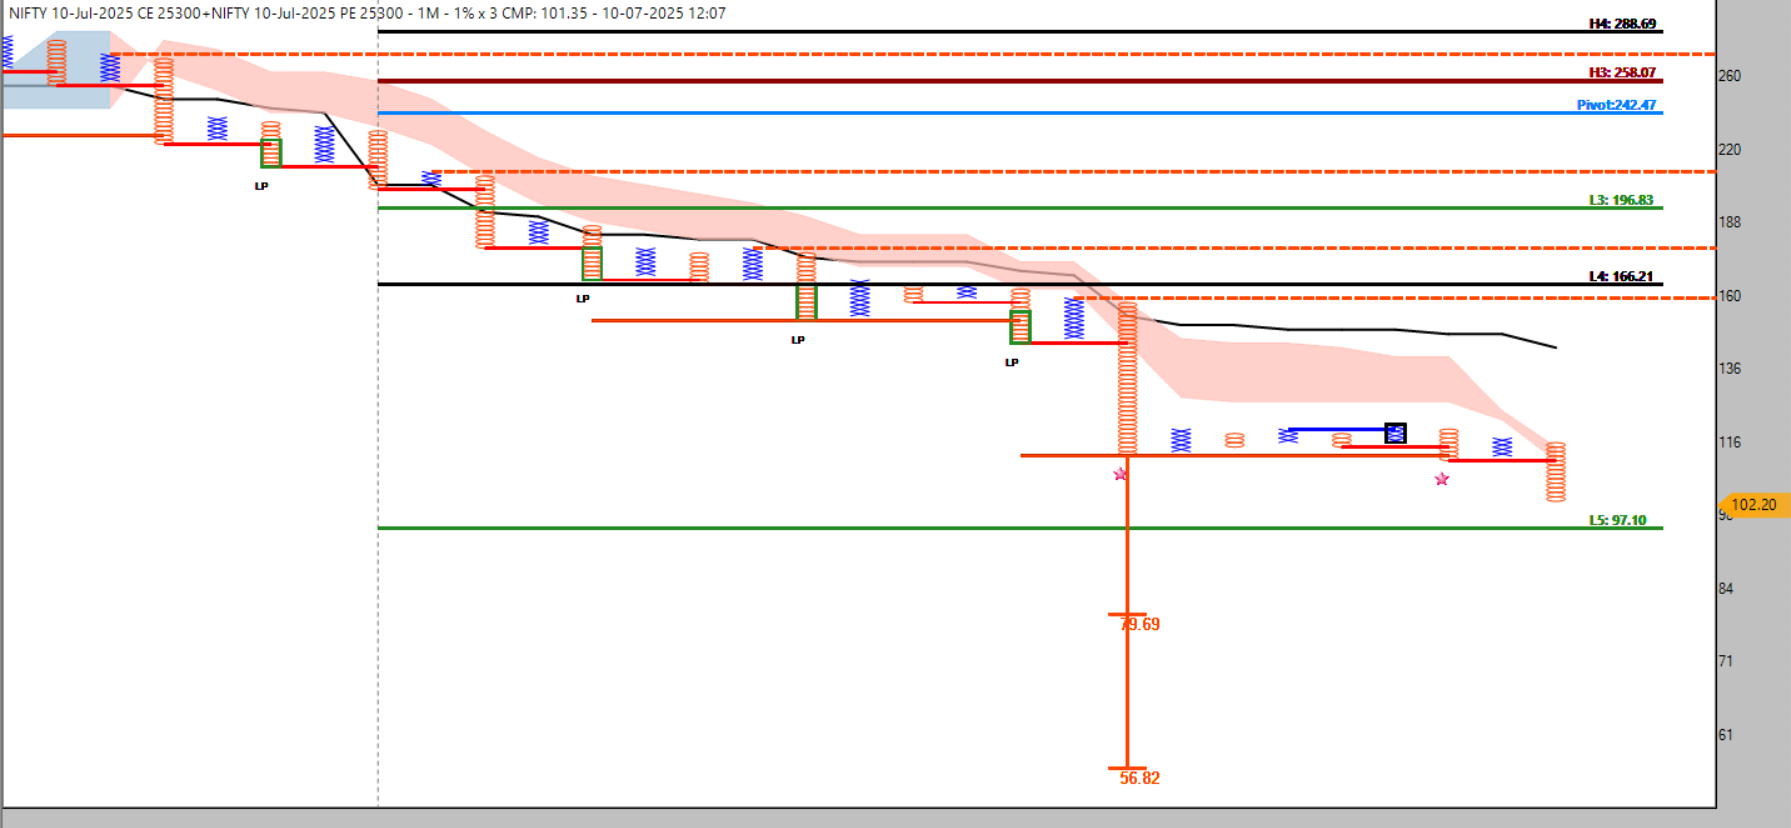
10/07/2025 straddle live dicussion
10/07/2025 straddle live dicussion
10/07/2025 straddle live dicussion
10/07/2025 straddle live dicussion
10/07/2025 straddle live dicussion
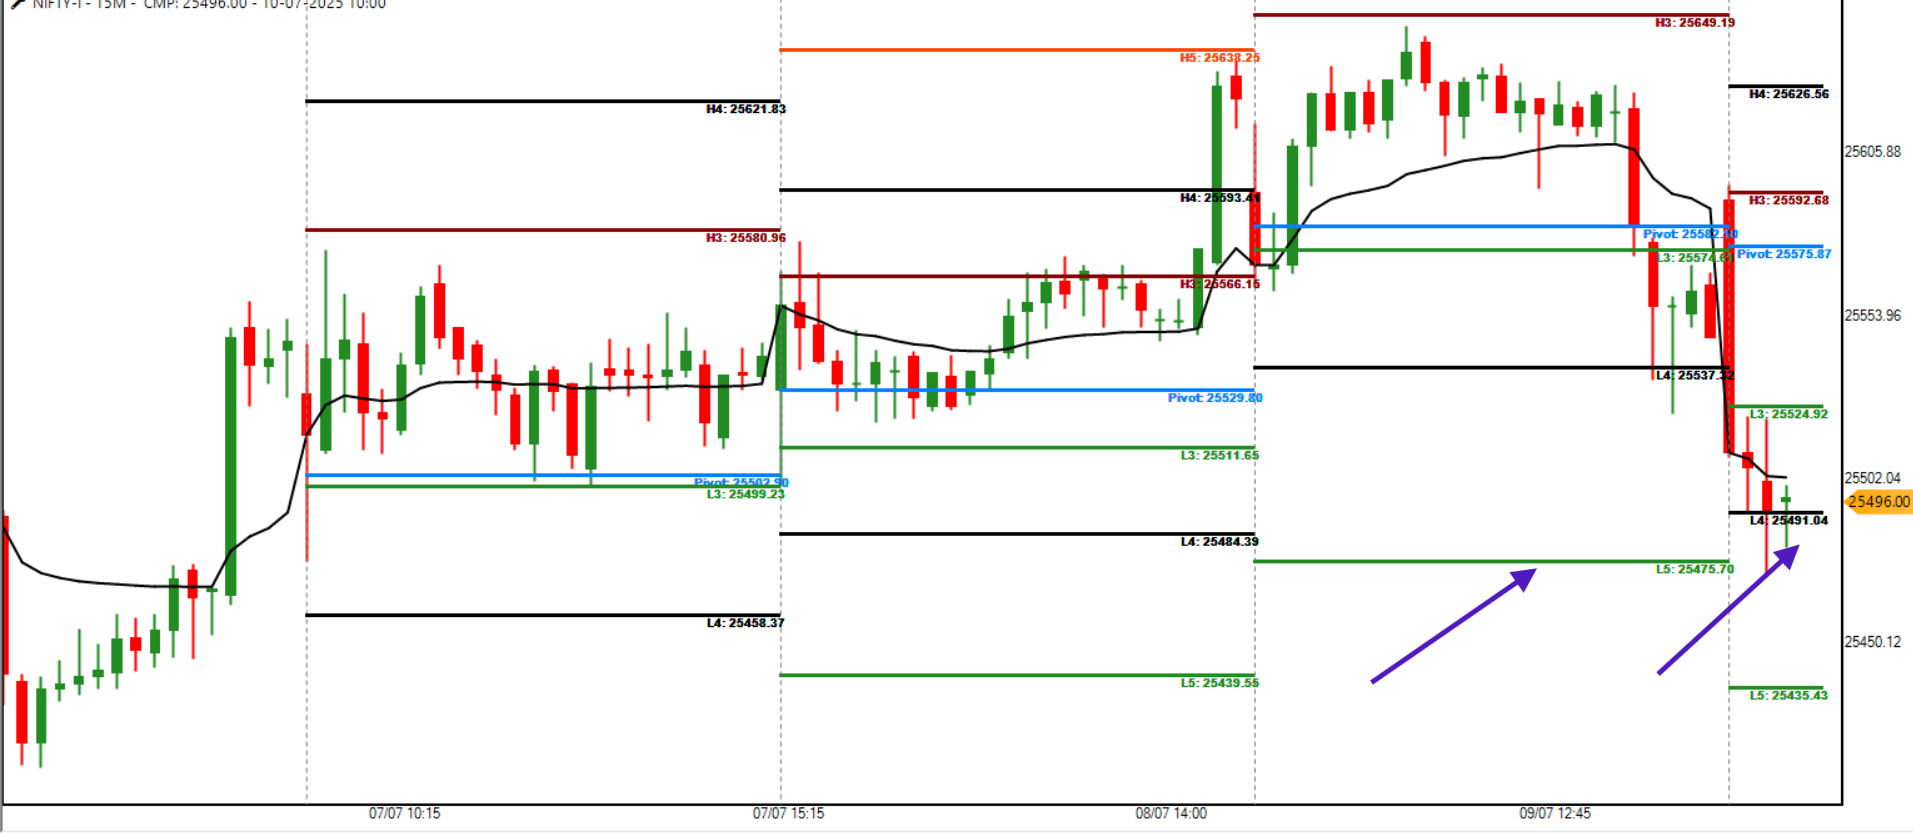
10/07/2025 straddle live dicussion
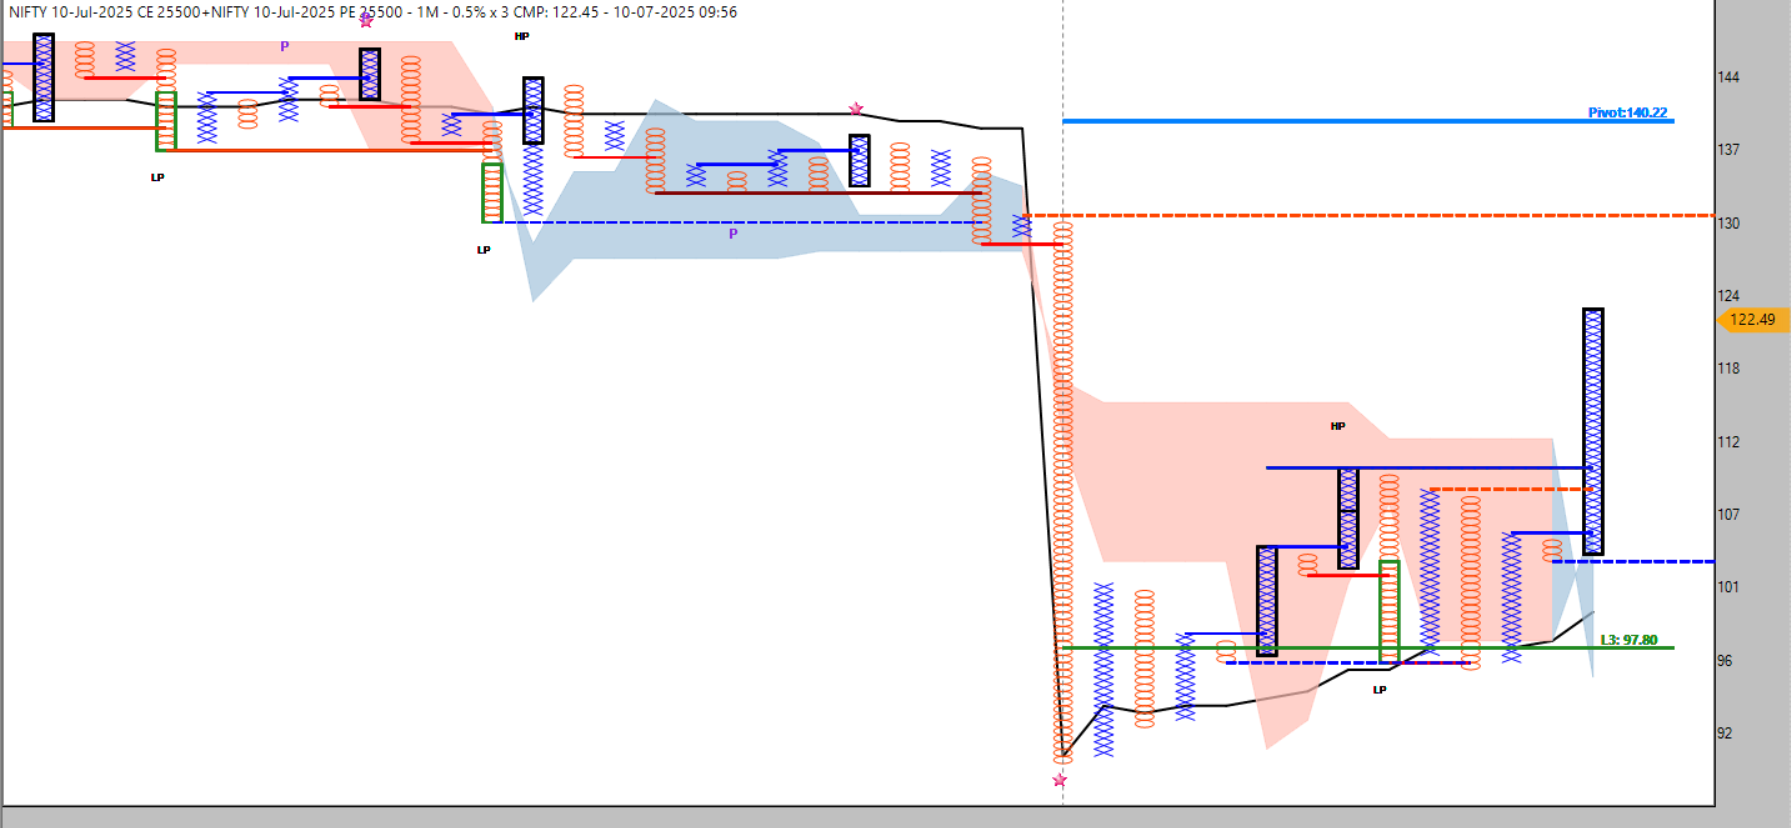
10/07/2025 straddle live dicussion
10/07/2025 straddle live dicussion
10/07/2025 straddle live dicussion
Trading Mahabharata: “Haath Kaap Raha Hai Madhav…”
09/07/2024
🩶 Using 200± Straddles with D-SMART to Decode Market Pressure: A Structural Approach
🪞 The Mirror of the Market: A Surreal Journey into Self-Reflection in Trading
The Phantom of Leverage: A Surreal Journey of Power and Responsibility in Trading
️ The Breath of Volatility: A Surreal Story of Embracing Uncertainty in Trading
The Theta Farmer: A Surreal Journey of Patience and Profit
A Straddle’s Dream: The Surreal Chronicles of Premium and Time
🩶 Using 200± Straddles with D-SMART to Decode Market Pressure: A Structural Approach
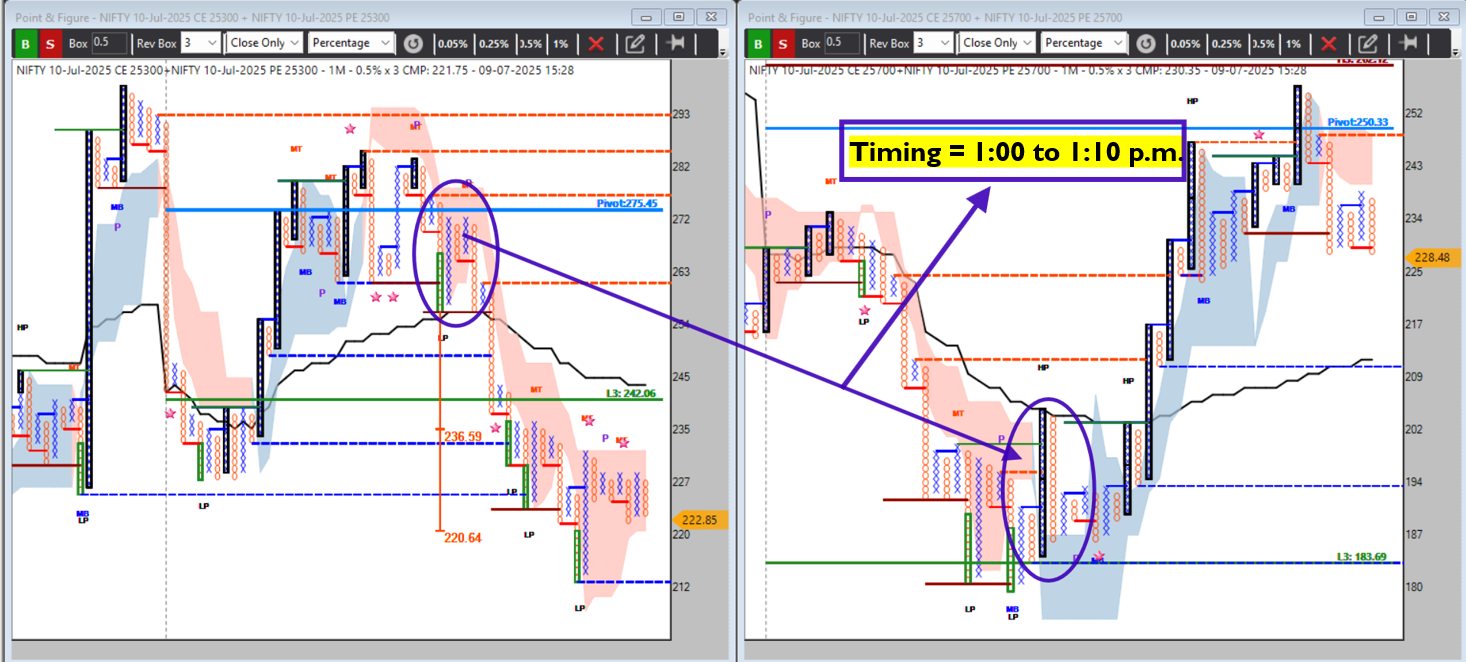 Trading Mahabharata: “Haath Kaap Raha Hai Madhav…”
Boring PnL vs. Excitement PnL: A Surreal Marketplace Tale
Trading Mahabharata: “Haath Kaap Raha Hai Madhav…”
Boring PnL vs. Excitement PnL: A Surreal Marketplace Tale
AP Sir’s Camarilla Exhaustion Reversal Theory (CERT)
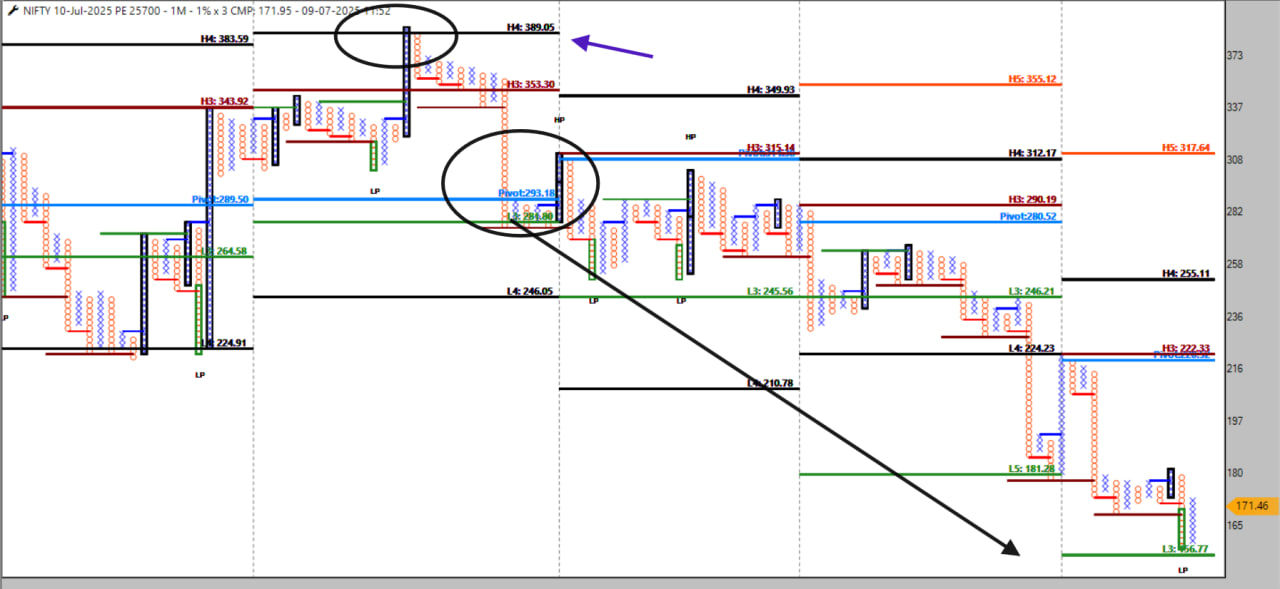
🩶 Using 200± Straddles with D-SMART to Decode Market Pressure: A Structural Approach
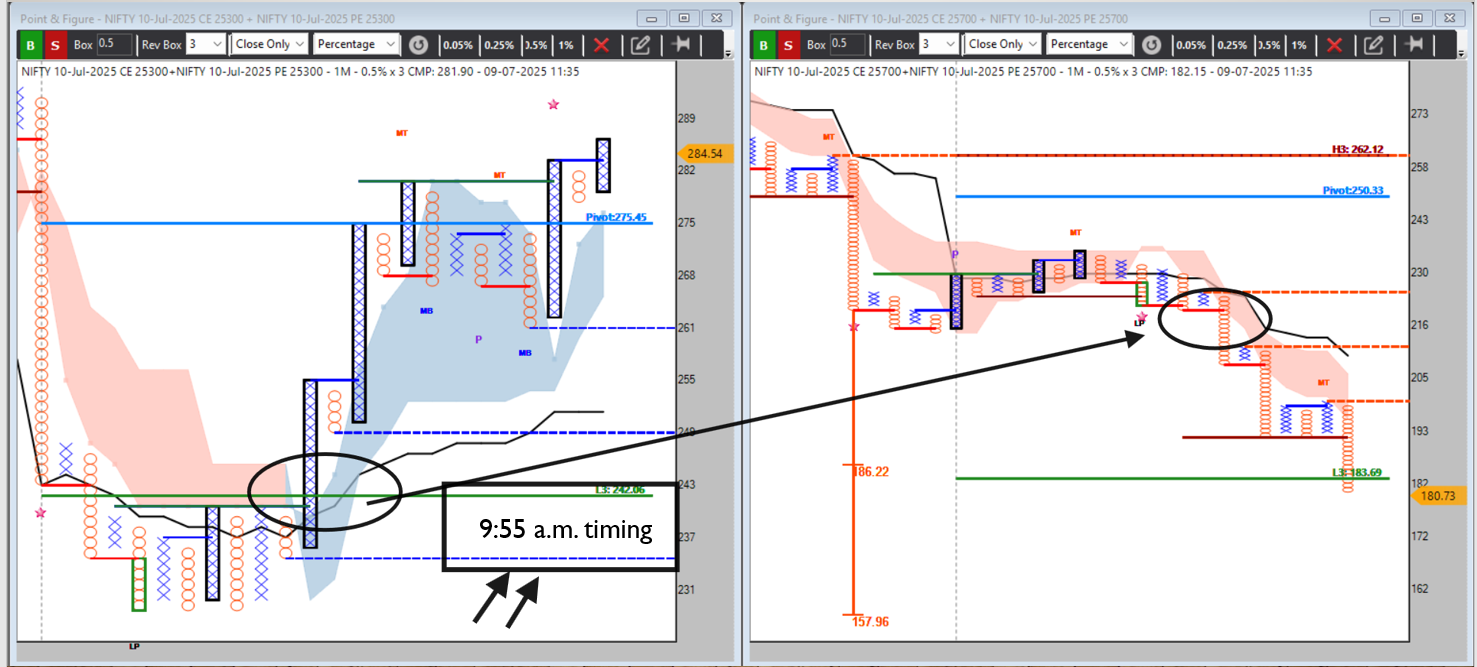
🧠 Straddle Study as a Lens into Market: Direction, Pain & Gain
08/07/2025 trading style.
🩶 Using 200± Straddles with D-SMART to Decode Market Pressure: A Structural Approach
08/07/2025 trading style.
Is NIFTY Headed for a Big Move? Reading the 31st July 25,500 Straddle’s Directional Pain
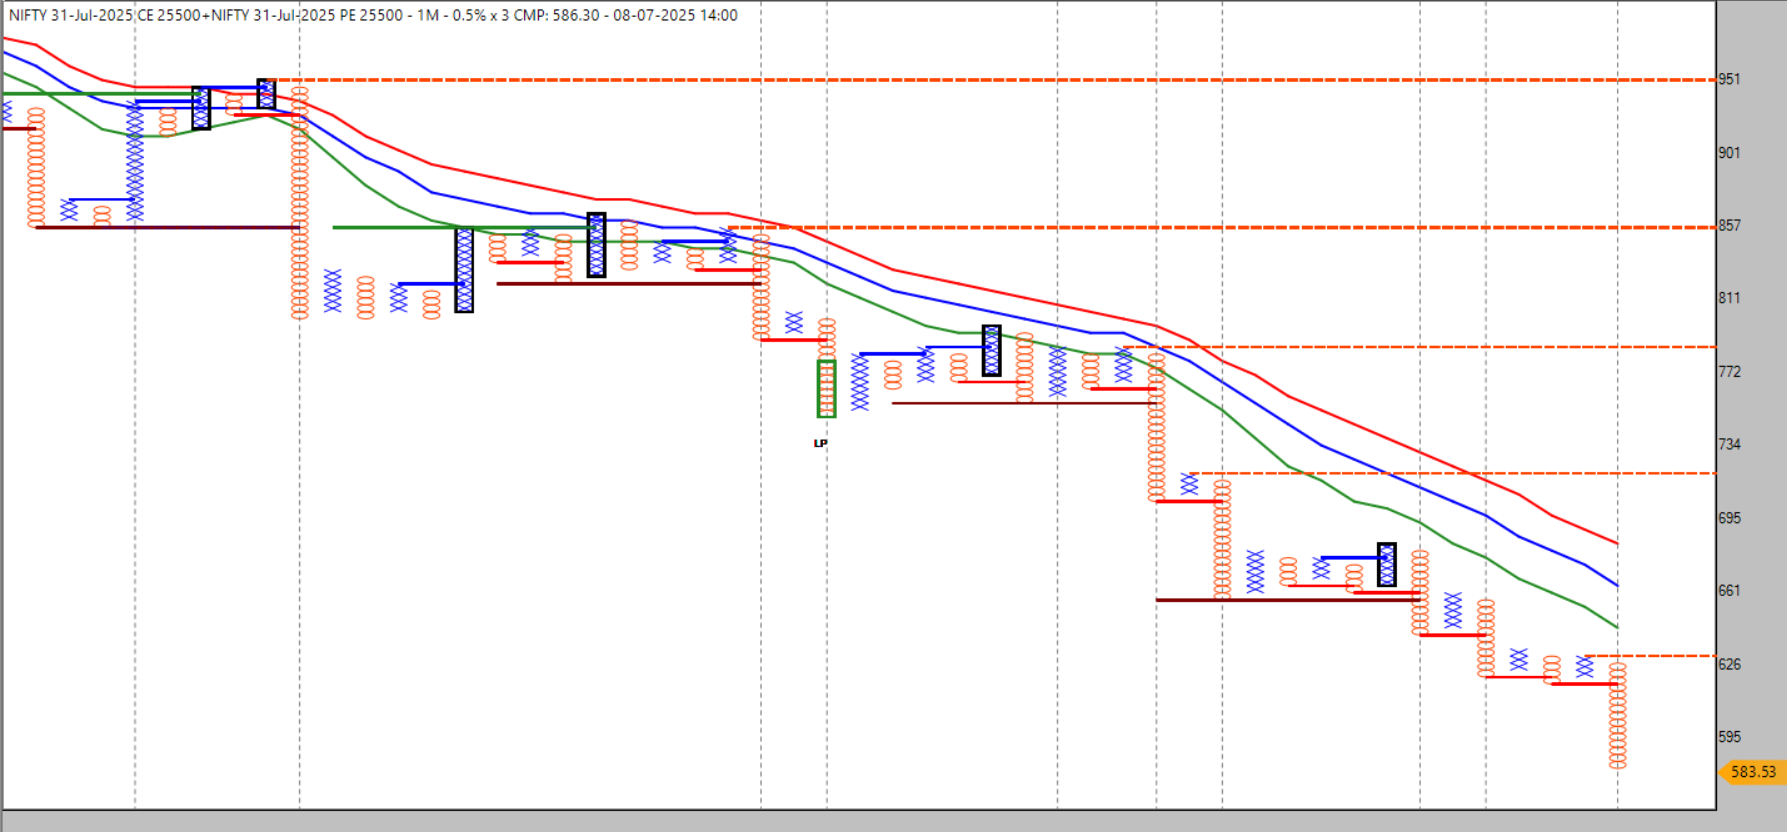
How SEBI’s Report Unveils the Hidden Dangers in Option Trading—and Why Beginners Should Practice Intraday 200± NIFTY Short Straddles
Decoding India's Equity Derivatives: What the Latest Statistics Reveal
Decoding India's Equity Derivatives: What the Latest Statistics Reveal
Option Premium is Truth: Mastering the 200± Straddle with Simplicity
🧠 Straddle Study as a Lens into Market: Direction, Pain & Gain
The Silent Conflict Within a Straddle: Reading Asymmetry Beneath Symmetry
Discretionary vs System Trading: Differences, Pros & Cons
Why the 200± Straddle TO SHORT Is Better Than ATM: Market Never Stands Still
AP Sir’s Camarilla Exhaustion Reversal Theory (CERT)
🪐 Straddle Trading: The Path to Consistency, Calmness, and a Transformed Mindset
Directional Pain: The Silent Predator Draining Option Buyers
How to Use ATM Straddles to Forecast Volatility: A Practical Trader’s Guide
Is NIFTY Headed for a Big Move? Reading the 31st July 25,500 Straddle’s Directional Pain
AP Sir’s Camarilla Exhaustion Reversal Theory (CERT)
AP Sir’s Camarilla Exhaustion Reversal Theory (CERT)
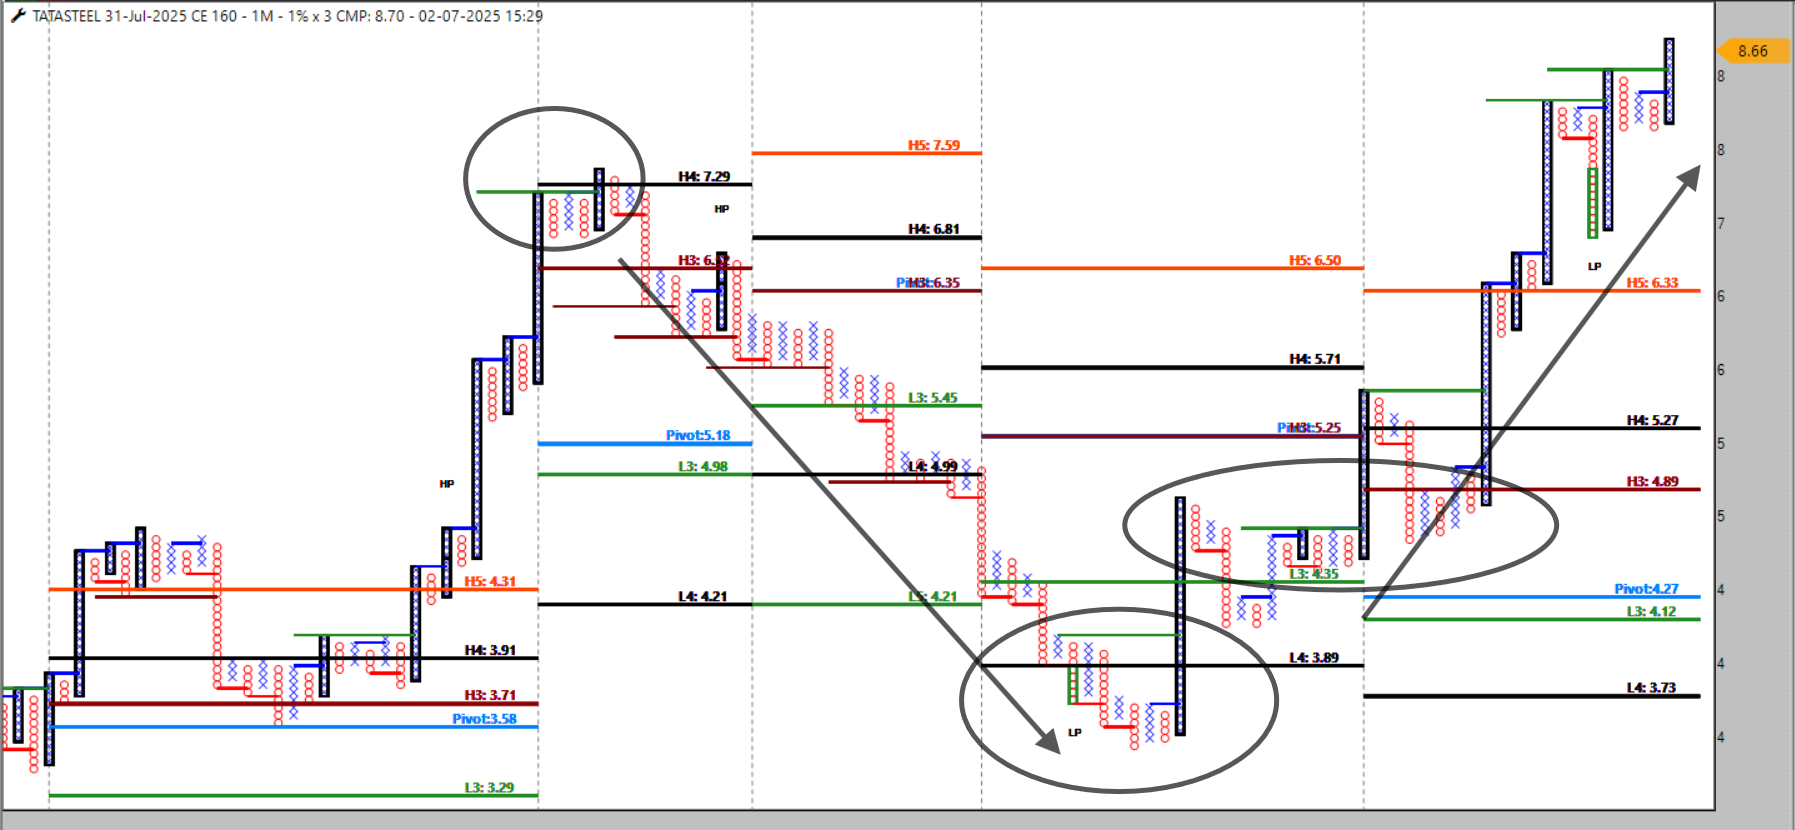
AP Sir’s Camarilla Exhaustion Reversal Theory (CERT)
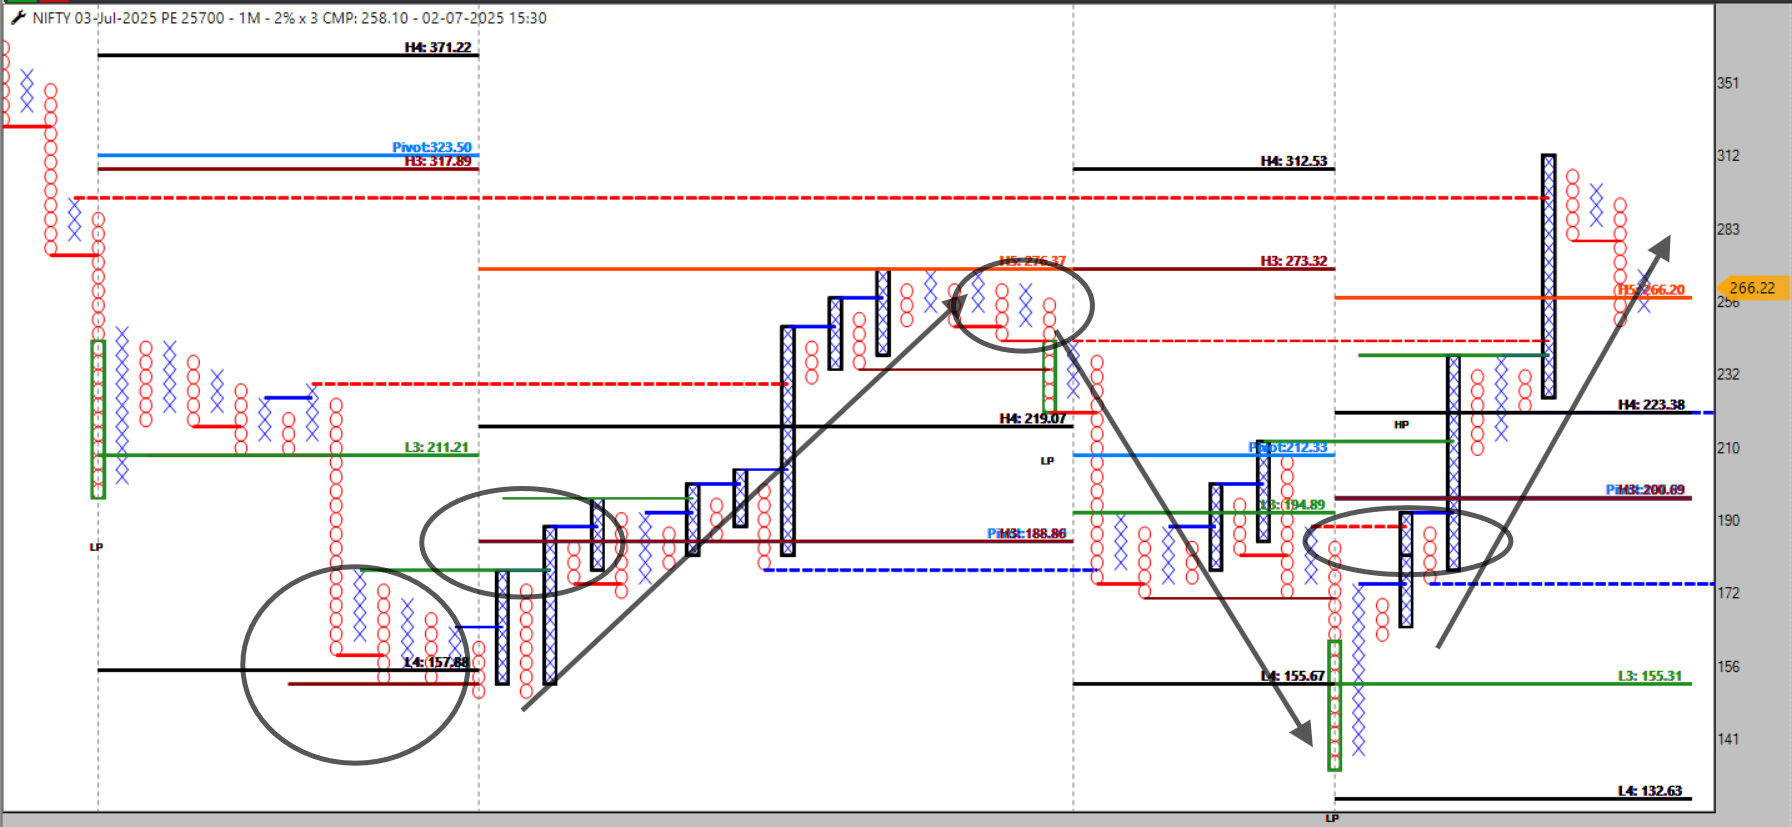
AP Sir’s Camarilla Exhaustion Reversal Theory (CERT)
The Straddle: A Spiritual Path to El Dorado in Trading
Mastering NIFTY Trend Days with 200± Straddle, CAM Levels, and VWAP: The 30th June 2025 Case Study
Understanding Higher Straddle and Lower Straddle Premiums Using ITM and OTM Options in NIFTY
Decoding NIFTY Trends Using Only Premiums: A Pure Straddle-Strangle Study
"Hunting the Pulse: Highest OI & Volume Straddle Among 10 NIFTY Straddle Pairs"
NIFTY Camarilla Levels & 200± Straddle Study – 20th June 2025
NIFTY Camarilla Levels & 200± Straddle Study – 19th June 2025
NIFTY Camarilla Levels & 200± Straddle Study – 19th June 2025
NIFTY Camarilla Levels & 200± Straddle Study – 19th June 2025
VWAP & Its Slope: The Silent Voice of Market Truth
 “Exit: A War Between Structure and Surrender”
Decoding NIFTY Camarilla Levels and 200± Straddle Behavior – 18th June 2025
The Silent Conflict Within a Straddle: Reading Asymmetry Beneath Symmetry
NIFTY camarilla level & 200-+ straddle study
🧠 Straddle Study as a Lens into Market: Direction, Pain & Gain
200-+ straddle & Nifty Camarilla level ( 16th June )
why straddle watching hints about probabilities , Here bank nifty as examples
200+- STRADDLE & NIFTY camarilla level
Why the Straddle is a Core Weapon in NIFTY Intraday & Swing Trading
El Dorado of Trading: The Quest for the Golden Edge
200+- STRADDLE & NIFTY camarilla level